
Abstract
Failure of combination antiretroviral (ARV) therapy in HIV-infected patients is often associated with the emergence of drug resistance-associated mutations (RAMs). To facilitate analysis of the barrier to resistance at therapeutically relevant ARV concentrations, we performed fixed-dose in vitro HIV-1 drug resistance selection assays using the immortalized MT-2 T-cell line and primary human CD4+ T cells with a panel of FDA-approved ARVs, each at their respective cell culture equivalent clinical trough concentration (CCE Cmin). At high multiples of its CCE Cmin, emtricitabine (FTC) selected for the rapid emergence of M184I/V, a result consistent with resistance emergence in vivo. While the rate of viral breakthrough in the presence of rilpivirine or efavirenz was delayed relative to FTC, both inhibitors selected for virus with known clinically relevant RAMs. No viral breakthrough was observed for the protease inhibitor atazanavir even at subtherapeutic drug concentrations, which is consistent with its previously characterized high in vivo barrier to resistance. Depending on assay conditions, treatment with integrase inhibitors elvitegravir and raltegravir resulted in breakthrough of both resistant and wild-type virus. The RAMs observed in drug selections were not detected above a 2% threshold by deep sequencing in the in vitro virus inoculum, and only rarely in isolates from treatment-naive HIV+ patients. These new viral breakthrough assays facilitate the analysis of multiple experimental replicates and conditions in parallel and provide a rapid quantitative means to evaluate drug resistance emergence at therapeutically relevant drug concentrations, which should facilitate the identification of new ARVs with a high barrier to resistance.
Introduction
A
Currently, the preclinical evaluation of an ARV's genetic barrier to antiviral resistance focuses on two types of assays performed in immortalized T-cell lines. Resistance selections utilizing a drug dose escalation method rely on a small initial virus inoculum and low drug pressure, typically less than or equal to twice the drug's 50% antiviral effective concentration (EC50), which is gradually increased over the course of up to 12 months as resistant mutant viruses are enriched and/or generated. 5,6 Although widely considered the gold standard approach for identifying the broadest diversity of potential resistance mutations that might emerge in the presence of a preclinical ARV, dose escalation selection protocols have some notable limitations. Most problematic is the frequent selection of accessory mutations and/or the progressive accumulation of numerous low-level resistance mutations due to the low concentration of drug used, both of which require extensive phenotypic characterization and which are difficult to verify as clinically relevant. 7,8
Less frequently used, the fixed drug dose viral breakthrough resistance selections utilize a much higher virus inoculum (typically about 10 times of that used in dose escalation selections) and constant drug pressure (>5 × EC50) to select for preexisting mutations or enable their emergence and enrichment over the course of 3–6 weeks. 9 In general, the fixed-dose breakthrough assay is significantly more rapid and higher throughput than dose escalation selections, and depending on the drug pressure used, the mutations that arise can be enriched for major, rather than minor, drug resistance-associated mutations (RAMs), thereby greatly accelerating the preclinical evaluation of potential drug resistance pathways. However, the fixed-dose resistance selection assay is dependent on the drug pressure used and does not typically utilize therapeutically relevant drug concentrations, thus diminishing the potential utility of these assays to facilitate preclinical evaluations of the resistance barrier for an experimental ARV.
Although the use of immortalized rapidly dividing T-cell lines for in vitro resistance selections is highly convenient, performing these assays in primary target cells may better approximate a drug's barrier to resistance. Primary cells may, in part, provide for a more appropriate mimic of the in vivo selective environment where antiviral drug resistant viruses must escape drug pressure while maintaining optimal affinity for host cellular factors involved in virus replication. These include host proteins that regulate proper uncoating of the viral capsid, 10 –12 nuclear uptake of the preintegration complex in nondividing cells, 13,14 integration of the viral DNA into host cell chromatin, 15,16 and the efficiency of viral particle release. 17,18 The levels at which these host cell factors are expressed in primary cells could differ significantly from those of transformed T-cell lines, which may affect resistance emergence. In addition, it is widely known that the rate and/or mode of virus spreading in primary cells can be distinct from that observed in immortalized cell lines. 19 Some proportion of resistant virus may be too unfit for cell-free virus spreading in cultured immortalized cells yet readily transmitted through cell-to-cell contact in primary T cells. 20,21 Finally, it has been shown that while lamivudine-resistant HIV-1 variants M184V/I rapidly emerge in the transformed T-cell line SupT1, these variants exhibit a replication defect in primary cells that may be due, in part, to limiting deoxynucleoside triphosphate (dNTP) concentrations in primary versus transformed T cells. 22 Conversely, certain HIV-1 mutants fail to replicate in SupT1 cells, but are efficiently rescued in primary T lymphocytes. 23 In spite of these distinctions, reports of in vitro drug resistance selections in primary and/or nondividing cells are uncommon.
Herein, we describe two new complementary fixed-dose viral resistance breakthrough assays that use therapeutically relevant drug concentrations in immortalized and primary human T cells for the in vitro evaluation of ARV barrier to resistance.
Materials and Methods
Reagents and cell culture
Emtricitabine (FTC), efavirenz (EFV), rilpivirine (RPV), atazanavir (ATV), nelfinavir (NFV), elvitegravir (EVG), and raltegravir (RAL) were synthesized at Gilead Sciences, Inc. (Foster City, CA). All drug stocks and serial dilutions were prepared in 100% dimethyl sulfoxide (DMSO). The HTLV-1 transformed human T-cell line MT-2 was obtained from the NIH AIDS Reagent Program (Germantown, MD) 24,25 and maintained at 37°C in 5% CO2 at densities below 0.6 × 10⁶ cells/ml by serial passaging in RPMI cell culture medium supplemented with 10% heat-inactivated fetal bovine serum (FBS) and antibiotics (Sigma-Aldrich, St. Louis, MO). The CEM-NKR-CCR5-Luc infectivity indicator T-cell line, 26,27 expressing the luciferase gene under transcriptional control of the HIV-2 long terminal repeat (LTR), was obtained from the NIH AIDS Reagent Program and cultured in complete RPMI medium supplemented with 0.8 mg/ml Geneticin® (Thermo Fisher Scientific, Grand Island, NY).
Human peripheral blood mononuclear cells (PBMCs) were isolated from fresh leukopaks obtained from healthy volunteers under informed consent (AllCells, Inc., Alameda, CA) and cryopreserved for long-term liquid nitrogen storage at −80°C in 90% FBS and 10% DMSO at a density of 5 × 10⁷ cells/ml. Blood donors were negative for HIV-1, hepatitis B, and hepatitis C viral infections. Following rapid thawing and overnight resting of PBMC cultures in complete RPMI cell culture media (CCM), CD4+ T lymphocytes were isolated by negative selection using a magnetically labeled antibody cocktail (STEMCELL Technologies, Inc., Vancouver, Canada) and activated for 48 h at 37°C before their use in breakthrough assays by culturing the cells in RPMI CCM supplemented with 1 μg/ml phytohemagglutinin (PHA; Sigma-Aldrich) and 5 ng/ml interleukin-2 (IL-2; Roche Diagnostics, Indianapolis, IN).
HIV-1 (IIIB strain), obtained from Advanced Biotechnologies (Eldersburg, MD), was propagated in H9 cells and concentrated 1,000-fold by direct virus pelleting from culture supernatant obtained from cells showing cytopathic effect (CPE). HIV-1 (Ba-L strain), obtained from ImQuest BioSciences (Frederick, MD), was propagated in human PBMCs and concentrated 30-fold from cell culture supernatants by tangential flow filtration. Clonal NL4.3 and HXB2D HIV-1 were prepared following transient proviral plasmid transfection of HEK293T cells using Lipofectamine-2000 transfection reagent (Thermo Fisher Scientific) and evaluated for viral breakthrough in MT-2 cells during the initial stages of assay development. These clonal viruses produced a similar, but much more limited set of emergent mutations in MT-2 viral breakthrough assays after an extended period of selection relative to the use of the propagated HIV-1 IIIB strain. Antiviral activity of ARVs was evaluated. Drug EC50 values were determined in a previously described 5-day multicycle cell viability assay measuring protection from CPE. 28 Briefly, MT-2 cells were bulk infected at a density of 2 × 10⁶ cells/ml with HIV-1IIIB at a multiplicity of infection (MOI) of 0.01 by gently rocking the culture for 3 h at 37°C and then added in quadruplicate to 384-well plates (Corning Life Sciences, Tewksbury, MA). Cells were incubated in complete RPMI medium containing a 10-point, threefold serial drug dilution (0.5% final DMSO concentration) for 5 days at 37°C in 5% CO2. After this time, 40 μl of 2 × CellTiter-Glo reagent (Promega, Madison, WI) was added to each well and the luminescence signals quantified on an EnVision plate reader (PerkinElmer, Inc., Waltham, MA). EC50 values, defined as the drug concentration inducing a 50% protection from HIV-induced cell killing, were calculated from a minimum of three independent experiments performed in quadruplicate using XLFit™ software (IDBS, Ltd., Guildford, Surrey, United Kingdom) and nonlinear regression analysis.
Antiviral activity was also evaluated in primary human CD4+ T cells as previously described. 29 Briefly, activated CD4+ T cells were infected with HIV-1BaL (5 ng p24 per 106 cells) by nutation for 4 h at 37°C, washed twice with complete RPMI to remove unabsorbed virus, and plated at 2 × 10⁵ cells per well on 96-well plates. Infected CD4+ T cells were incubated in triplicate with threefold serially diluted test compound for 6 days in a humidified 37°C incubator. After 6 days, cell-free supernatants were collected and the amount of HIV present was quantified by p24 enzyme-linked immunosorbent assay (ELISA; PerkinElmer, Inc.). EC50 values, defined as the drug concentration inducing a 50% decrease in virus production, were calculated using XLFit™ software from at least two independent experiments performed in triplicate.
Determination of cell culture equivalent Cmin
The clinical minimum drug concentration (Cmin), defined as the steady-state trough plasma drug concentration present at the end of a dosing interval, was obtained from individual drug package inserts. 30 –36 A previously described equilibrium dialysis assay was used to directly measure the differences between free drugs in human plasma (HP) versus cell culture medium. 37 Briefly, 100% HP containing drug was added to one dialysis chamber and CCM (supplemented with 10% FBS, CCM) containing the same amount of drug was added to the second dialysis chamber. The chambers were then rotated for 3 h in a 37°C water bath after which time the drug concentration in each chamber was determined by liquid chromatography-mass spectrometry (LC-MS). The resulting ratio, representing the fold difference in drug concentration in HP and CCM, identified the human plasma shift value for each drug. This shift was used to generate the cell culture equivalent (CCE) Cmin drug concentration (clinical Cmin/HP shift) that was used for all viral breakthrough studies.
MT-2 cell viral breakthrough assay
MT-2 cells were infected with HIV-1IIIB at a relatively high MOI ( = 0.05) for 3 h and plated in 24-well plates at 2 × 10⁵ cells per well. Drugs were added immediately postinfection or 16 h later to a minimum of quadruplicate wells at fixed multiples of their CCE Cmin concentrations. Every 3–4 days, cells were diluted (1:5) into freshly prepared CCM containing the same CCE Cmin drug concentration and monitored for virus-induced CPEs over a period of 32 days. Cell-free viral supernatants were harvested from wells showing >80% CPE and kept frozen at −80°C until further analyzed.
Primary human CD4+ T-cell viral breakthrough assay
Mitogen-activated primary human CD4+ T cells were infected in bulk culture with a high inoculum of HIV-1BaL (50 ng p24 per 106 cells) by gently rocking at a density of 3 × 10⁶ cells/ml for 4 h at 37°C, washed to remove unabsorbed virus, and plated at 5 × 10⁵ cells per well in 96-well plates. Unless otherwise noted, drugs were added 16 h later to a minimum of 24 replicate wells at fixed multiples of their CCE Cmin concentrations and maintained in complete RPMI supplemented with IL-2 (5 ng/ml) for the duration of the experiment. Every 7 days, two-third volumes of cell-free supernatants were exchanged with fresh 1 × drug media containing 3.5 × 10⁵ freshly activated CD4+ T cells. After 35 total days, supernatants were frozen at −80°C until analyzed for infectivity on CEM-NKR-CCR5-Luc indicator cells and/or the presence of virus by p24 ELISA. The infectivity of breakthrough viruses was measured following transfer of cell-free supernatants onto CEM-NKR-CCR5-Luc indicator cells (1:1 mixture) in solid white 96-well plates (Corning Life Sciences) supplemented with 20 μg/ml DEAE-Dextran (Sigma-Aldrich). After 3 days, an equal volume of Bright-Glo™ reagent (Promega) was added to each well and the amount of chemiluminescence signal measured using an EnVision plate reader (PerkinElmer, Shelton, CT). Culture supernatants that produced relative light units at least fivefold over background (mock-infected controls) were considered infectious in the presence of 0.5 × the test drug CCE Cmin concentration and indicated the potential presence of drug-resistant virus variants.
Genotypic analysis of breakthrough viruses
Total RNA was purified from the cell-free supernatants obtained from each CPE-positive and p24-positive well (typically ca. 100 ng p24/ml) using the QIAGEN Viral RNA Isolation Kit (QIAGEN, Valencia, CA). The coding regions targeted by each drug were amplified by reverse transcriptase (RT) and polymearse chain reaction (PCR) using the One Step RT-PCR kit (QIAGEN) and the products subjected to DNA sequencing. Sequence changes were identified by alignment with input virus sequences using Sequencher (Gene Codes Corp., Ann Arbor, MI) and amino acid substitutions determined.
Deep sequencing of ARV target genes
The pol sequence of HIV-1IIIB and HIV-1BaL input viruses was determined from concentrated viral stocks using the Illumina next-generation sequencing (NGS) platform using two independent amplicons covering the protease/reverse transcriptase (PR/RT) and integrase (IN) regions. Viral RNA was isolated from 0.5 ml of concentrated viral supernatants (>1 μg p24/ml) using the QIAGEN Viral RNA Isolation Kit according to the manufacturer's protocol. Reverse transcription and amplification of segments encoding HIV-1 protease (PR) and partly RT were carried out using SuperScript III One-Step RT-PCR System with Platinum® Taq High Fidelity (Life Technologies, Darmstadt, Germany) and primers 1RES, 5′-GAAGAAATGATGACAGCATGTCAGGG-3′ (nt 1,819–1,844, HXB2 numbering) and 2RES, 5′-TAATTTATCTACTTGTTCATTTCCTCCAAT-3′ (nt 4,173–4,202). Nested polymerase chain reaction was carried out with Platinum Taq High Fidelity (Life Technologies) and the following inner primer pair: RES3, 5′-AGACAGGCTAATTTTTTAGGGA-3′ (nt 2,074–2,095) and RES4, 5′-ATGGYTCTTGATAAATTTGATATGTCC-3′ (nt 3,559–3,585). Primers used for RT-PCR of HIV-1 IN were 5′-INT, 5′-ATTGGAGGAAATGAACAAGT-3′ (nt 4,173–4,192) and 3p31, 5′-ATCCTGTCTACYTGCCACACAA-3′ (nt 5,087–5,066). All amplicons were purified using the Agencourt AMPure® XP system on a Biomek NX workstation (Beckman Coulter, Brea, CA), quantified fluorometric on a FLUOstar Optima (BMG LABTECH, Ortenberg, Germany) using Quant-iT PicoGreen dsDNA reagent (Life Technologies). Library preparation for Illumina deep sequencing was done using Nextera® XT DNA Sample Preparation and Index Kit (Illumina, San Diego, CA) according to the manufacturer's manual. Resulting libraries were normalized and pooled for subsequent sequencing on an Illumina MiSeq platform using the 2 × 250 cycle paired-end sequencing protocol. Baseline pretreatment plasma samples (1 ml each, baseline viral load ranged from 10,000 to 2,500,000 HIV-1 RNA copies/ml) from 106 treatment-naive HIV-infected patients were selected under informed consent from clinical study GS-US-264–0110 (STAR, n = 76) and study GS-US-236–0128 (WAVES, n = 30) and the pol sequence from each of these clinical isolates was analyzed by NGS in a similar manner.
For each viral strain and patient plasma sample, we targeted at least 10,000 amplicon reads per position during deep sequencing to ensure sufficient target gene coverage. In practice, we achieved a much higher sequence coverage (mean number of reads from each end of each fragment = 282,070, with a range from 145,040 to 658,240). Control NGS studies were performed using clonal HIV-1 pNL4.3 plasmid mixtures comprising fixed ratios of wild-type and mutant sequences and indicated an estimated noise level of ca. 0.5% in these sequencing assays. However, certain mutations and sequence contexts resulted in higher amplification and/or sequencing error rates (1%–1.5%), with transition mutations not surprisingly being more readily observed compared to transversion mutations. A conservative cutoff of 2% prevalence was thus selected for added stringency during NGS data analysis across different targets and HIV subtypes. The target gene RAMs assessed by NGS are detailed in Supplementary Table S1 (Supplementary Data are available online at
Results
Determination of cell culture equivalent Cmin drug concentrations
Excluding periods of noncompliance, patients on ARV therapy are at the greatest risk of developing drug resistance whenever their systemic blood plasma drug concentrations are at their lowest levels (i.e., immediately before their next dose). These clinically observed minimal drug plasma concentrations (Cmin) are therefore a suitable benchmark to establish fixed-drug concentrations in evaluating the barrier to in vitro drug resistance as they provide direct clinical relevance not currently afforded by dose-escalation resistance selections. To determine the CCE of the clinical Cmin concentrations for use in these in vitro resistance selections, drug clinical Cmin concentrations were corrected for HP protein binding by correcting the known clinical Cmin values using the ratio of drug protein binding observed in HP and cell culture medium, as measured by equilibrium dialysis. Table 1 shows the CCE Cmin concentrations determined for a panel of seven FDA-approved ARVs that were subsequently used herein to evaluate HIV-1 resistance emergence at therapeutically relevant drug concentrations. This drug panel spans four different inhibitor drug classes and includes the nucleoside reverse transcriptase inhibitor (NRTI) FTC, the non-nucleoside reverse transcriptase inhibitors (NNRTIs) EFV and RPV, the HIV protease inhibitors (PIs) ATV and NFV, and the integrase strand transfer inhibitors (INSTIs) EVG and RAL. Among the ARVs tested in this study, RPV and NFV had the lowest CCE Cmin values of 8 and 25 nM, respectively, whereas FTC, EFV, and ATV had the highest CCE Cmin values of 364, 250, and 301 nM, respectively. EVG and RAL showed intermediate CCE Cmin values of 48 and 59 nM, respectively.
QD, once per day; BID, twice per day.
Ratio of drug protein binding in human plasma versus cell culture media.
Cell-culture media adjusted Cmin drug concentration (clinical Cmin/human plasma shift).
ARV, antiretroviral; ATV/r, atazanavir boosted with ritonavir; CCE, cell culture equivalent; EFV, efavirenz; EVG/c, elvitegravir boosted with cobicistat; FTC, emtricitabine; INSTI, integrase strand transfer inhibitor; NFV, nelfinavir; NNRTI, non-nucleoside reverse transcriptase inhibitor; NRTI, nucleoside reverse transcriptase inhibitor; PI, protease inhibitor; RAL, raltegravir; RPV, rilpivirine.
Antiviral activity at CCE Cmin drug concentrations
The antiviral activity (EC50) for each ARV tested was measured in transformed (MT-2) and primary human CD4+ T cells. For each drug, the measured EC50 values varied minimally (less than twofold) between the two cell types, except for FTC, which was ∼57-fold more potent in CD4+ T cells versus MT-2 cells (Table 1), consistent with the respectively lower intracellular dNTP levels in primary cells. 22 Table 1 also shows the ratio of CCE Cmin drug concentration to EC50 values in MT-2 cells and primary CD4+ T cells to illustrate the relative drug pressure associated with the therapeutic drug concentrations. CCE Cmin concentrations of EFV, EVG, and ATV were 278-, 32-, and 40-fold above their respective antiviral EC50 values and resulted in relatively high antiviral drug pressure in MT-2 cells. The CCE Cmin concentrations for RPV and RAL were 16-fold and 7.7-fold above their respective EC50 values and provided moderate levels of antiviral drug pressure in MT-2 cells. At their CCE Cmin values, FTC and NFV were present at drug concentrations well below or near their respective EC50 values in MT-2 cells and resulted in low drug pressure on the virus at these concentrations. In contrast, FTC showed increased drug pressure on the virus in primary CD4+ T cells due to its enhanced potency in these cells versus MT-2 cells. Although we have attempted to profile FTC in a similar manner as other drug classes, it should be noted that for FTC and NRTIs in general, the Cmin value is of limited utility to quantify drug pressure in vitro and in vivo. This is due to the complex intracellular pharmacology and mechanism of action of NRTIs involving intracellular activation to triphosphate that persists and thus can accumulate over multiple drug doses to a steady state intracellular concentration that may differ from the NRTI concentrations achieved in plasma. Hence, it is significantly more difficult to properly mimic the clinically relevant drug pressure of NRTIs in vitro.
Analysis of virus inoculums for the presence of RAMs
Before their use in viral breakthrough selections, each input virus (HIV-1IIIB and HIV-1BaL) was first subjected to deep sequencing of the entire HIV pol gene to identify any preexisting drug RAMs within PR, RT, or IN. In total, 27, 13, and 25 amino acid positions were analyzed in HIV-1 RT, PR, and IN proteins, respectively, for previously described RAMs (Supplementary Table S1); however, no RAMs were detected in any of these target proteins above the 2% limit of detection in either input virus (Supplementary Fig. S1).
HIV-1 breakthrough selections in transformed T cells
To better characterize the barrier to resistance at therapeutically relevant drug concentrations, we first conducted fixed-dose resistance breakthrough assays with each drug from the ARV test panel in cultured MT-2 cells infected with HIV-1IIIB using multiples of CCE Cmin drug concentrations added 16 h postinfection (Fig. 1 and Table 2). This drug addition time point was selected because it occurs after the early phases of reverse transcription and HIV integration, but before the later particle maturation phase, 38 thereby creating a population of cells constitutively producing infectious virus. This allows for a balanced comparison of drugs active in the early stage of the virus life cycle to those with late stage activity. Under this assay format, FTC selected for early breakthrough of virus that emerged 7–10 days postinfection at drug concentrations as high as 123 × its CCE Cmin and encoded the clinically observed RT RAMs M184V or M184I. No viral breakthrough was observed with EFV at its CCE Cmin concentration, but at one-fourth its CCE Cmin, breakthrough of virus containing one of the RT RAMs L100I, K103N, or G190E was observed 14–21 days postinfection. At subclinical drug concentrations equal to one-half its CCE Cmin, the selective pressure of RPV was insufficient, which resulted in breakthrough of wild-type virus in all wells. However, at 1 × its CCE Cmin concentration, RPV selected for breakthrough of virus 14–18 days postinfection encoding the RT RAMs E138K, Y181C, or M230I. The PI ATV showed no viral breakthrough with as low as one-eighth its CCE Cmin concentration, consistent with a high barrier to resistance. This property is not necessarily intrinsic to all PIs since the low antiviral activity of NFV at 1 × its CCE Cmin concentration resulted in wild-type PR virus breakthrough by 8 days postinfection and the emergence of virus containing the PR RAM D30N by 11–24 days when tested at 3 × its CCE Cmin. Surprisingly, despite highly suppressive drug concentrations at their respective 1 × CCE Cmin, equal to 32-fold and 8-fold their respective EC50 values, no IN RAMs were similarly observed in breakthrough viruses selected in the presence of INSTIs EVG or RAL. Increasing the concentration of both INSTIs to 2 × their respective CCE Cmin had no effect on the rapid emergence of virus containing wild-type IN sequence. Additional studies, discussed below, were performed to further characterize virus breakthrough in the presence of EVG and RAL.
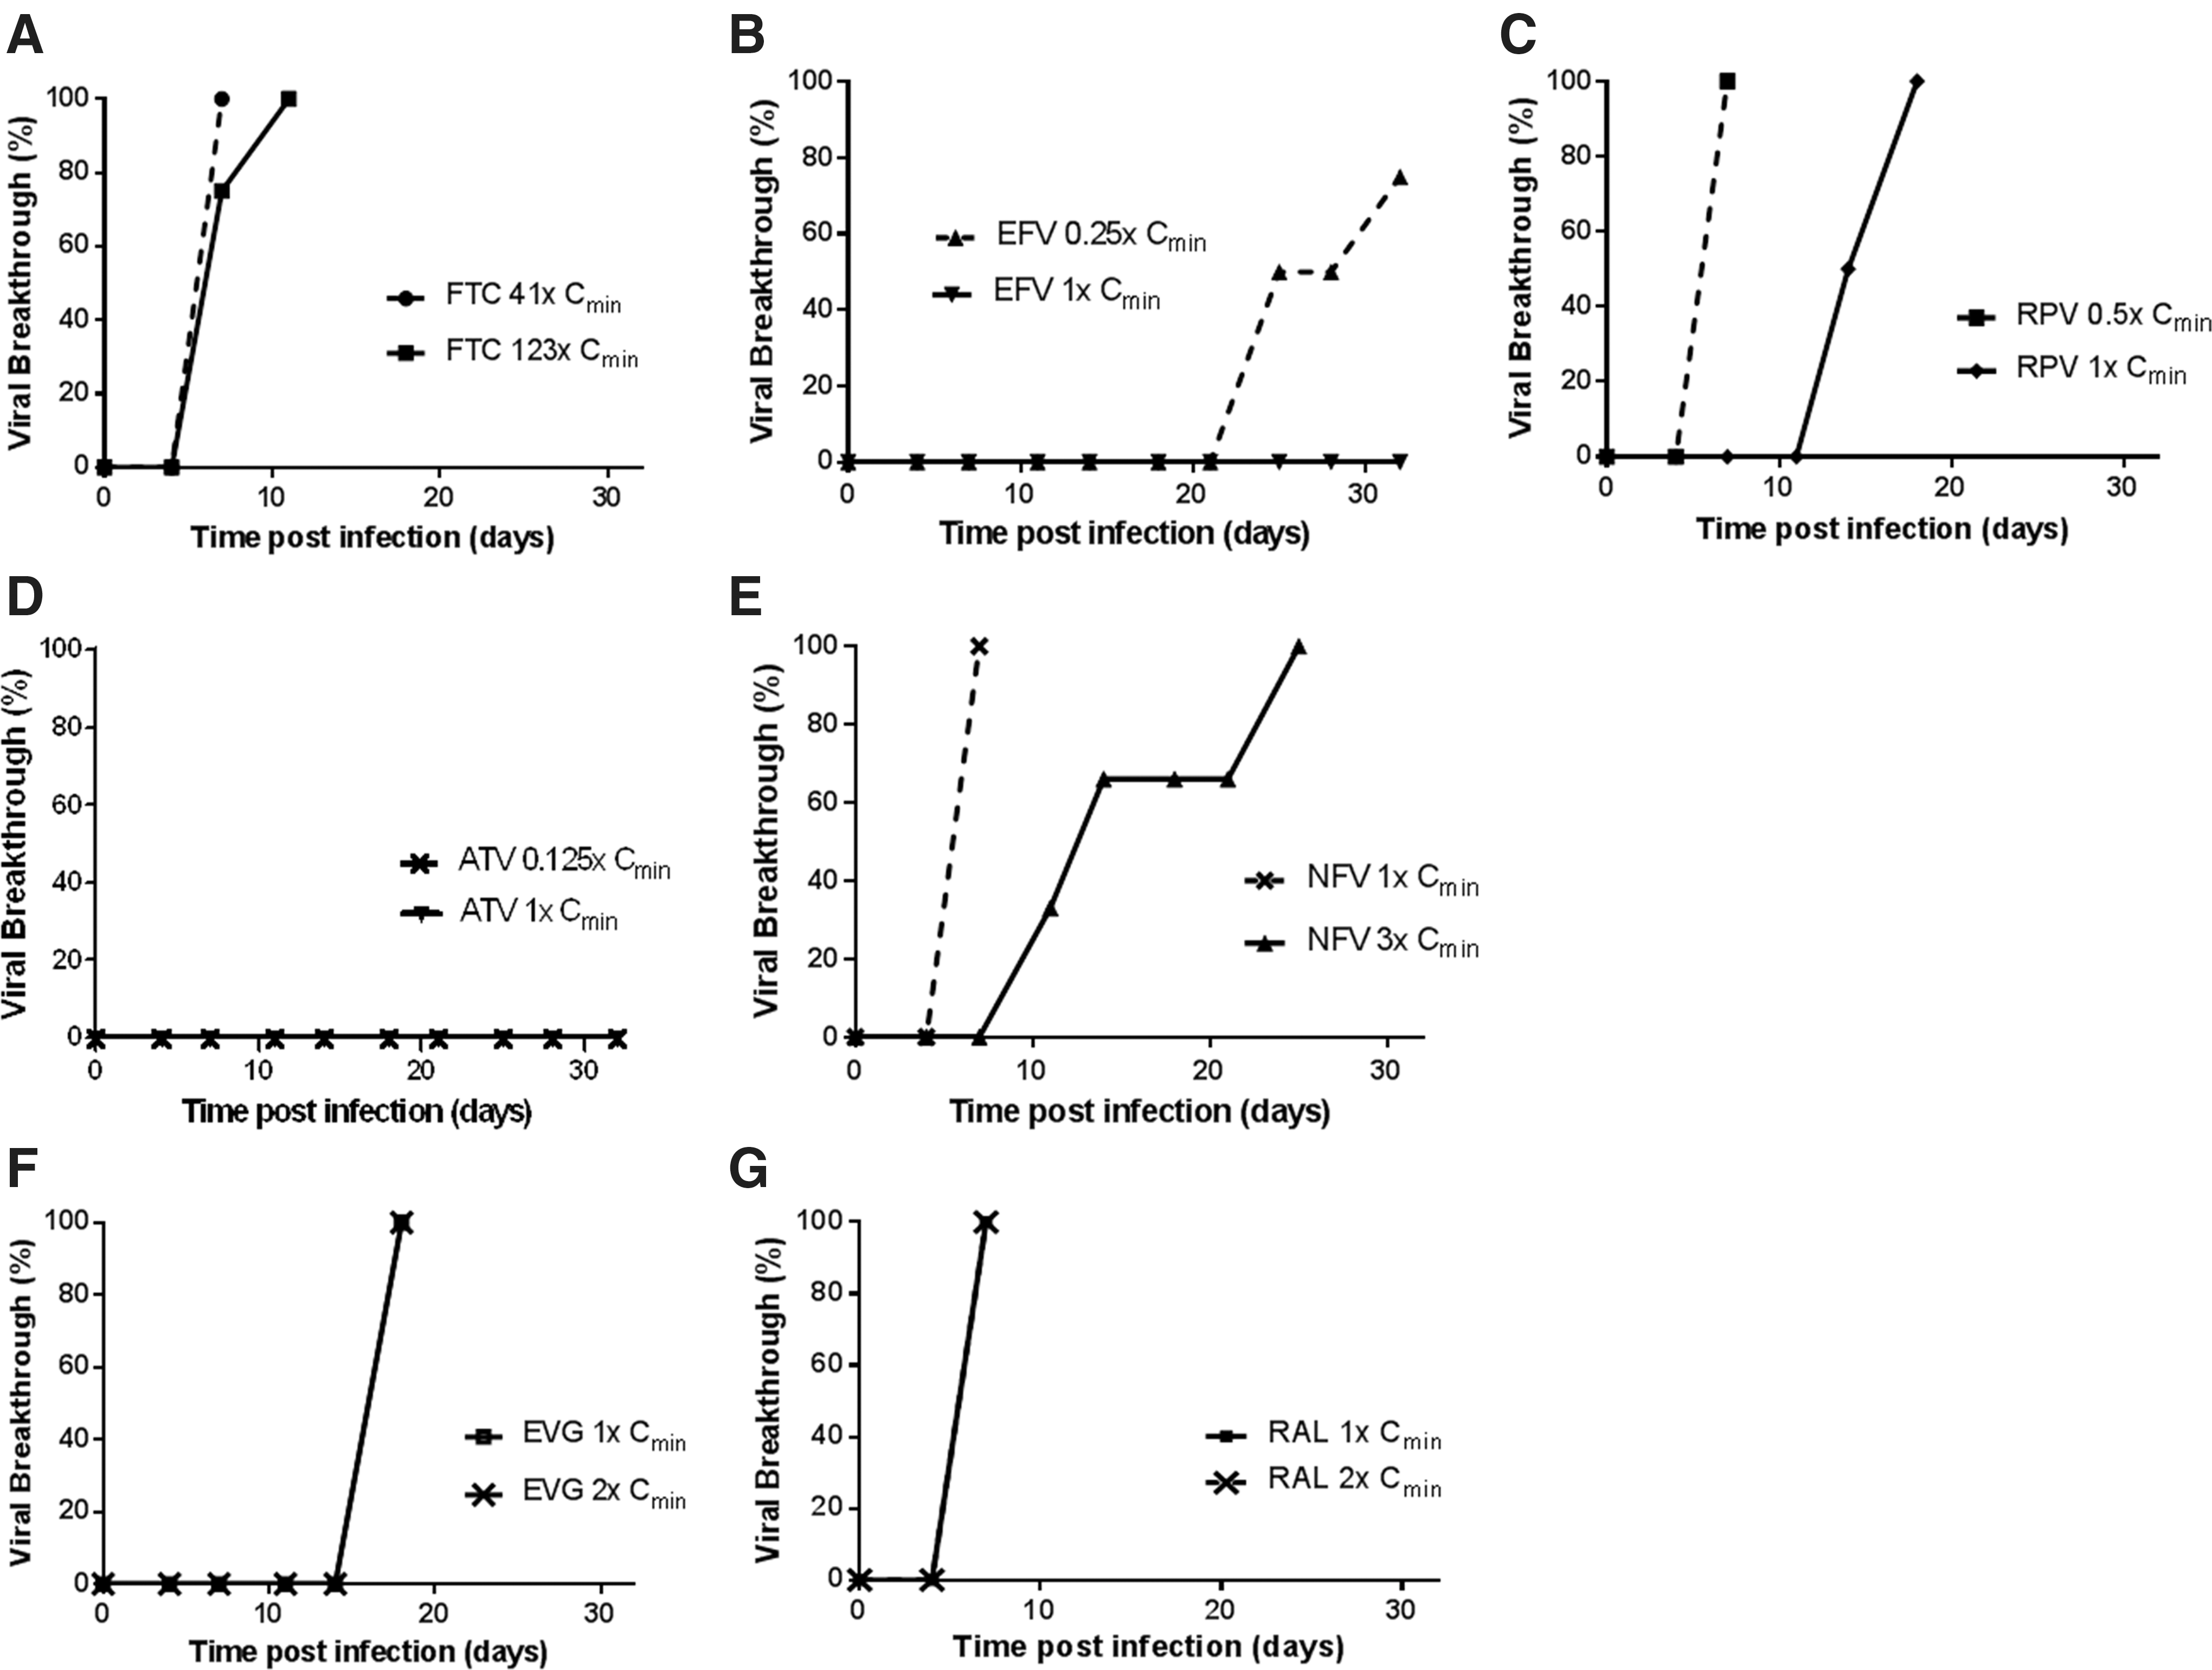
HIV-1IIIB breakthrough kinetics in MT-2 cells. MT-2 cells were infected with a high inoculum of HIV-1IIIB and then monitored for the development of virus-induced cytopathic effect (i.e., viral breakthrough) over a period of 32 days in the presence of a fixed, therapeutically relevant concentration of inhibitor. Each graph shows the percentage of wells exhibiting viral breakthrough over the course of the resistance selection assay and the concentration of drug used relative to Cmin.
Drugs added 16 h postinfection.
IN, integrase; PR, protease; RAMs, resistance-associated mutations.
HIV-1 breakthrough selections in primary human CD4+ T cells
The above studies indicate that breakthrough selections performed with MT-2 cells can facilitate the rapid in vitro identification of drug resistance mutations that may emerge with clinically relevant ARV concentrations. However, the intracellular pharmacology of ARVs, especially that of NRTIs, may differ between immortalized cell lines and primary cells. In addition, the immortalized cell line approach does require the passaging of cell cultures every few days to maintain an optimal cell density and is at least partially reliant on the qualitative observation of CPEs in each culture. Since frequent cell passaging may theoretically restrict peak virus levels and/or result in the premature removal of rare cells harboring resistant variants before their widespread expansion in the culture, breakthrough selections were also performed in primary human CD4+ T cells infected with HIV-1BaL as an independent assessment of the resistance barrier (Table 3). Resistance selections in CD4+ T cells were optimized for use in a 96-well format to increase the number of replicates being assessed (n = 24 wells per condition) and involved the weekly addition of fresh CD4+ T lymphocytes to each well, rather than cell passaging, to maintain maximal virus diversity in each culture. As these infections were also noncytopathic, the emergence of breakthrough variants in primary cells required monitoring for virus production by p24 ELISA for up to 35 days postinfection (end of experiment) and by periodic infectivity measurements in CEM-NKR-CCR5-Luc indicator cells.
Drugs added 16 h postinfection.
Percentage of at least 24 replicate wells scoring p24-positive and infectious 35 days postinfection.
The drugs used for CD4+ T-cell breakthrough assays were the same as those in the MT-2 cell breakthrough assay and were similarly added 16 h postinfection. FTC concentrations 4.4-fold above its CCE Cmin resulted in viral breakthrough (i.e., elevated p24 signal above baseline) in 58% of wells that encoded one of three commonly observed NRTI-associated mutations (M184I/V/T). Concentrations of EFV equal to 1 × and 0.25 × its CCE Cmin resulted in virus breakthrough in 17% and 58% of wells, respectively. The most commonly observed RAM was L100I, but additional RAMs V108I, V179E, G190A/S, and M230L were also observed. RPV tested at 1 × its CCE Cmin resulted in viral breakthrough in 25% of wells with RAMs L100I, K101E, E138K, Y181C, F227C, and M230I/L. ATV showed no viral breakthrough at concentrations as low as one-eighth its CCE Cmin, whereas NFV at 1 × its CCE Cmin showed breakthrough of both wild-type and resistant virus containing the D30N PR substitution in 83% and 17% of wells, respectively. In contrast to the MT-2 assay, 1 × CCE Cmin concentrations of IN inhibitors EVG and RAL resulted in breakthrough virus encoding RAMs in 50% of wells for both drugs. The observed EVG RAMs were T66A/I, E92A/G/V, Q148R, and N155H, whereas RAL selected for Q148K/R and N155H. However, similar to the MT-2 assay results, a large proportion (50%) of breakthrough viruses in the presence of INSTIs contained wild-type IN sequence.
To determine whether or not the wild-type viruses that emerged under selection with EVG and RAL were bona fide infectious particles, viral supernatants from breakthrough wells were tested for infectivity following incubation with CEM-CCR5-Luc indicator cells. Surprisingly, wild-type breakthrough viruses were infection competent (as evidenced by markedly elevated luciferase production over baseline) and their infectivity could be readily inhibited by the addition of EFV. These wild-type IN viruses also readily expanded over the course of 7 days in activated PBMCs following drug removal, but not in the presence of therapeutic INSTI concentrations (data not shown). Based on these collective data, we hypothesize that, in contrast to (N)NRTIs or PIs, infectious wild-type virus can emerge in the presence of INSTIs under the in vitro assay conditions used herein. This outcome appears to be specific to the cell culture system since the majority of HIV-infected patients treated with INSTIs experience profound virus suppression, with more rapid kinetics of viral load drop compared to other ARV classes. 39 –41 This issue is further addressed in the Discussion section.
Effect of time of drug addition on the emergence of drug-resistant virus
The INSTIs, EVG and RAL, did not prevent a spreading infection in the MT-2 cell breakthrough assay when added 16 h postinfection, resulting in the recovery of wild-type IN virus in all wells 17 and 7 days postinfection, respectively. The emergence of wild-type virus in the presence of these two INSTIs was in contrast to that of NRTIs (FTC) and NNRTIs (EFV and RPV) evaluated in parallel, each of which potently suppressed the emergence of wild-type virus and, in some cases, selected for resistance mutations. Although low-drug selective pressure may account for the breakthrough of wild-type virus, such as observed with the use of NFV at its 1 × CCE Cmin concentration, the INSTIs were tested at significantly higher drug pressures in these selection experiments. Therefore, additional breakthrough studies in both MT-2 cells and CD4+ T cells were conducted in which FTC, RPV, EVG, and RAL were each added 3 h postinfection (Table 4). Early addition of FTC resulted in a minor delay (2–3 days) in viral breakthrough kinetics in MT-2 cells, but ultimately selected for M184I/V mutants in both MT-2 and CD4+ T-cell breakthrough assays. In contrast, early RPV addition resulted in the absence of breakthrough in MT-2 cells and a 2.5-fold reduction (from 83% to 33%) in the percentage of wells positive for viral breakthrough in CD4+ T cells relative to late RPV addition. In contrast to drug addition 16 h postinfection, EVG added 3 h postinfection significantly delayed virus breakthrough in MT-2 cells, but ultimately resulted in breakthrough of both wild-type and resistant virus containing the T66I RAM in IN at day 32. Similarly, addition of RAL 3 h postinfection resulted in suppression of HIV infection in MT-2 cells and late viral breakthrough in 50% of wells at day 28–32 with virus containing the Q148R RAM in IN. Interestingly, earlier addition of EVG or RAL in the CD4+ T-cell assay had no effect on breakthrough rate and resulted in breakthrough of both wild-type virus and a nearly identical collection of resistant HIV IN variants for each INSTI as observed during late compound addition. These data indicate that the resistance selections performed in this study with the INSTI class are especially sensitive to the time of drug addition in the immortalized MT-2 cell line and, thus, requires earlier addition of compound to adequately suppress HIV infection while still enabling the selection of drug-resistant mutants. The increased sensitivity of the primary CD4+ T-cell assay to detecting emergent HIV mutants with INSTI RAMs relative to the MT-2 cell assay may be related to differential rates of replication and virus output, virus-mediated CPEs, and/or reservoir sizes between these two cell systems.
RAMs observed in treatment-naive HIV-positive patients
The genotypic analysis of target HIV pol regions evaluated in the in vitro resistance selection assays was further expanded by deep sequencing of clinical isolates from a cohort (n = 106) of treatment-naive HIV-1-infected patients to compare the spectrum of potentially preexisting RAMs between authentic patient isolates and HIV strains used for the assessment of viral breakthrough in vitro. Table 5 lists the major treatment-emergent RAMs observed clinically, their emergence in each in vitro breakthrough selection assay, and the number of patient-derived isolates in which these RAMs were observed above the 2% detection cutoff limit of deep sequencing.
Boldface letters denote specific mutations detected by deep sequencing of 106 HIV-infected treatment naive clinical isolates.
Mutations detected using 3 h postinfection compound addition format.
Importantly, the majority of RAMs reported in patients treated with the respective ARVs were also observed in breakthrough viruses recovered in our in vitro assays and the patient isolate analysis showed a generally low prevalence of these RAMs preexisting in circulating transmissible virus populations (Supplementary Fig. S2). Of the transmitted drug-resistant HIV-1 variants that were detected in ∼10% of patient isolates, most possessed mutations associated with resistance to NRTI and NNRTI classes, and their prevalence varied from 2.3% to 77% within each individual patient isolate. In contrast, none of the RAMs detected in the analyzed patient isolates were observed in the HIV-1IIIB and BaL inoculums used in the virus breakthrough in MT-2 and primary CD4+ T cells, respectively, underscoring the stringency of the in vitro resistance breakthrough assays (Supplementary Fig. S1).
Discussion
We have described the development of two complementary in vitro resistance selection assays for the rapid characterization of ARV barrier to resistance. These new assays have been validated in cultured MT-2 and primary CD4+ T cells using nonclonal passaged HIV-1 IIIB and Ba-L strains, respectively, with high replication capacity to increase the depth of potential RAMs that might emerge in the presence of therapeutically relevant concentrations of clinically approved ARVs. With the exception of INSTIs, little difference was seen between MT-2 and primary CD4+ T-cell assays in both the frequency of viral breakthrough and the drug-resistant mutations that emerged. Importantly, in both assays, all drugs tested with the exception of ATV selected for RAMs that are consistent with those observed in patients failing ARV therapy. For ATV, the high resistance barrier seen clinically was confirmed in vitro in both breakthrough assay formats.
Analysis of input viruses used in these breakthrough assays showed no pol mutations above the 2% detection limit, suggesting that breakthrough HIV-1 variants observed herein were most likely generated during virus replication rather than selected from a subset of low-frequency drug–resistant variants that preexisted below the detection limit. Consistent with this notion, clonal NL4.3 and HXB2D virus also led to the emergence of a similar, but much more limited set of resistance-associated HIV-1 variants in MT-2 viral breakthrough assays after an extended period of selection relative to the use of the propagated HIV-1 IIIB strain described herein (data not shown). While the incidence of RAMs in treatment naive patient isolates was also low, several mutations found in breakthrough viruses were found to preexist above the 2% cutoff detection limit. However, the impact of these transmitted low-frequency variants (<20%) on the clinical response to subsequent antiviral therapy is presently unclear. 42,43
Although the high multiplicity of viral infection used in these assays and/or the absence of a drug combination component are likely to promote more frequent resistant viral breakthrough than what might be expected during their clinical use as a part of optimized ARV regimens, these assays do provide a simple and rapid means to identify the major resistance mutations that could be expected to emerge clinically. In addition, these assays offer the flexibility to increase the number of experimental replicates as needed while being amenable to using alternative viral agents such as specific mutant viruses, clinical isolates, and/or swarms of variant HIV species.
Surprisingly, INSTIs were unable to prevent a spreading infection in MT-2 cells when added 16 h postinfection, but could effectively control the infection when added before the first integration step. This behavior was in sharp contrast to that observed in primary CD4+ T-cell assays in which the time of INSTI addition had little discernible effect on the breakthrough of wild-type virus and which produced a wide diversity of clinically observed RAMs. Although the shallow in vitro dose–response inhibition slopes associated with INSTIs are in contrast with NNRTIs and PIs and could in theory enable a small percentage of virus to remain insensitive to drug pressure, this possibility seems unlikely considering that FTC also has similar inhibitory slopes and yet effectively prevented the emergence of wild-type virus. 44 A more likely scenario is that in the process of preventing HIV integration, inhibition by INSTIs also results in some level of leaky viral gene expression from the abortive integration products (namely linear DNA plus 1-LTR and 2-LTR circles), as recently reported. 45 –47 This expression of viral proteins despite suppressive INSTI drug concentrations is likely sufficient to induce CPE in the MT-2 assay, thereby ending the selection process before RAMs may have sufficient time to evolve, and in CD4+ T cells that appear to result in the production of wild-type infectious virus that can infect new cells and produce incrementally more abortive integration products. While the distinct behavior of INSTIs in the described in vitro resistance breakthrough assays compared to the other classes of ARVs needs to be considered when the assays are used to characterize compounds from the INSTI class, it is important to remain mindful of the many reports on the effective and durable suppression of HIV viremia by INSTIs in infected patients, 39,40,48 indicating that the phenomena of wild-type virus emergence associated with the use of INSTIs is unique to the in vitro conditions used herein.
In further expanding the utility of these new assays, the primary cell breakthrough assay could be modified to evaluate more relevant primary HIV-1 isolates in place of the HIV-1 Ba-L strain used herein and is readily amenable to the use of total PBMCs in place of isolated CD4+ T cells. This would serve to further simplify future primary cell resistance selection assays by eliminating the need to routinely purify CD4+ T cells and, by including additional immune cell subsets, which may facilitate the evaluation of drug resistance under conditions of cellular immune pressure. This may be especially useful for characterizing new classes of HIV inhibitors where the immune system may play a role (attachment and capsid inhibitors, broadly neutralizing antibodies) and may enable studying the impact of cellular immune response on resistance selections. 14,49 –51
In summary, we have developed modified assays for the rapid in vitro selection of HIV drug resistance mutants that utilize CCE clinical trough concentrations. These assays effectively complement existing methodologies by substantially increasing the throughput, timeframe, and clinical relevance of emergent drug-associated mutations and should facilitate ongoing drug discovery efforts, including the facile screening and identification of new ARVs with a high barrier to resistance. 52
Footnotes
Acknowledgments
The authors thank members of the Medicinal Chemistry and Drug Metabolism Departments at Gilead Sciences, Inc. for compound synthesis and HP shift measurements, respectively. Special thanks to George Kukolj and Michael Miller for critical review of this article. The CEM-NKR-CCR5-Luc cells, originally provided by Drs. John Moore and Catherine Spenlehauer, 26,27 were obtained through the NIH AIDS Reagent Program, NIAID, NIH. Designed experiments (A.M., S.R.Y., and T.C.), performed experiments (A.M., D.H., A.T., D.P., G.S., K.W., and S.R.Y.), wrote article (A.M. and S.R.Y.), and provided comments (D.H., D.P., and K.W.).
Author Disclosure Statement
A.M., S.R.Y., T.C., K.W., D.H., and D.P. have stock ownership in Gilead Sciences, Inc.
References
Supplementary Material
Please find the following supplemental material available below.
For Open Access articles published under a Creative Commons License, all supplemental material carries the same license as the article it is associated with.
For non-Open Access articles published, all supplemental material carries a non-exclusive license, and permission requests for re-use of supplemental material or any part of supplemental material shall be sent directly to the copyright owner as specified in the copyright notice associated with the article.