
Abstract
Central and Eastern African HIV sequence data have been most critical in understanding the establishment and evolution of the global HIV pandemic. Here we report on the extent of publicly available HIV genetic sequence data in the Los Alamos National Laboratory Sequence Database sampled from 1959 to 2013 from six African countries: Uganda, Kenya, Tanzania, Burundi, the Democratic Republic of Congo, and Rwanda. We have summarized these data, including HIV subtypes, the years sampled, and the genomic regions sequenced. We also provide curated alignments for this important geographic area in five HIV genomic regions with substantial coverage.
S
Comprehensive data sets that include viral sequences from a wide range of geographic locations collected over many years can help phylogenetic studies achieve more representative samples,
1
improve resolution of focused phylogenetic studies by resolving discrete subepidemics, and provide novel information on the introduction and ongoing spread of HIV in human populations.
2
To compile such a data set, detailed knowledge of existing HIV sequence data is useful. Here, we reviewed the HIV Sequence Database at Los Alamos (
All HIV sequences from the six Central and East African countries of interest (n = 18,424) were downloaded along with the following annotations: Genbank accession number, sequence name, subtype, country, year, and sequence start and stop location according to HXB2 numbering and sequence length. We identified multiple clones within a gene, as well as data from multiple genomic regions of the same patient. One clone per subject was retained for a given gene region. A summary of the unique sequence data available and their sequence locations in the HIV genome is shown in Figure 1. Using these sequence data, we defined five HIV genomic regions with relatively high coverage: Region 1, gag (HXB2 location 700–2,100); Region 2, 5′-pol domain (protease and RT genes, HXB2 location 2,240–3,900); Region 3, gp120 (HXB2 location 6,100–7,900); Region 4, gp41 (HXB2 location 7,900–8,200); and Region 5, the nearly full-length genome (HXB2 location 1–9,720). In comparison, the regulatory and accessory genes vif, vpr, vpu, 5′-tat, 5′-rev, nef, and the 3′ pol regions covering the RNase and integrase genes had limited coverage.
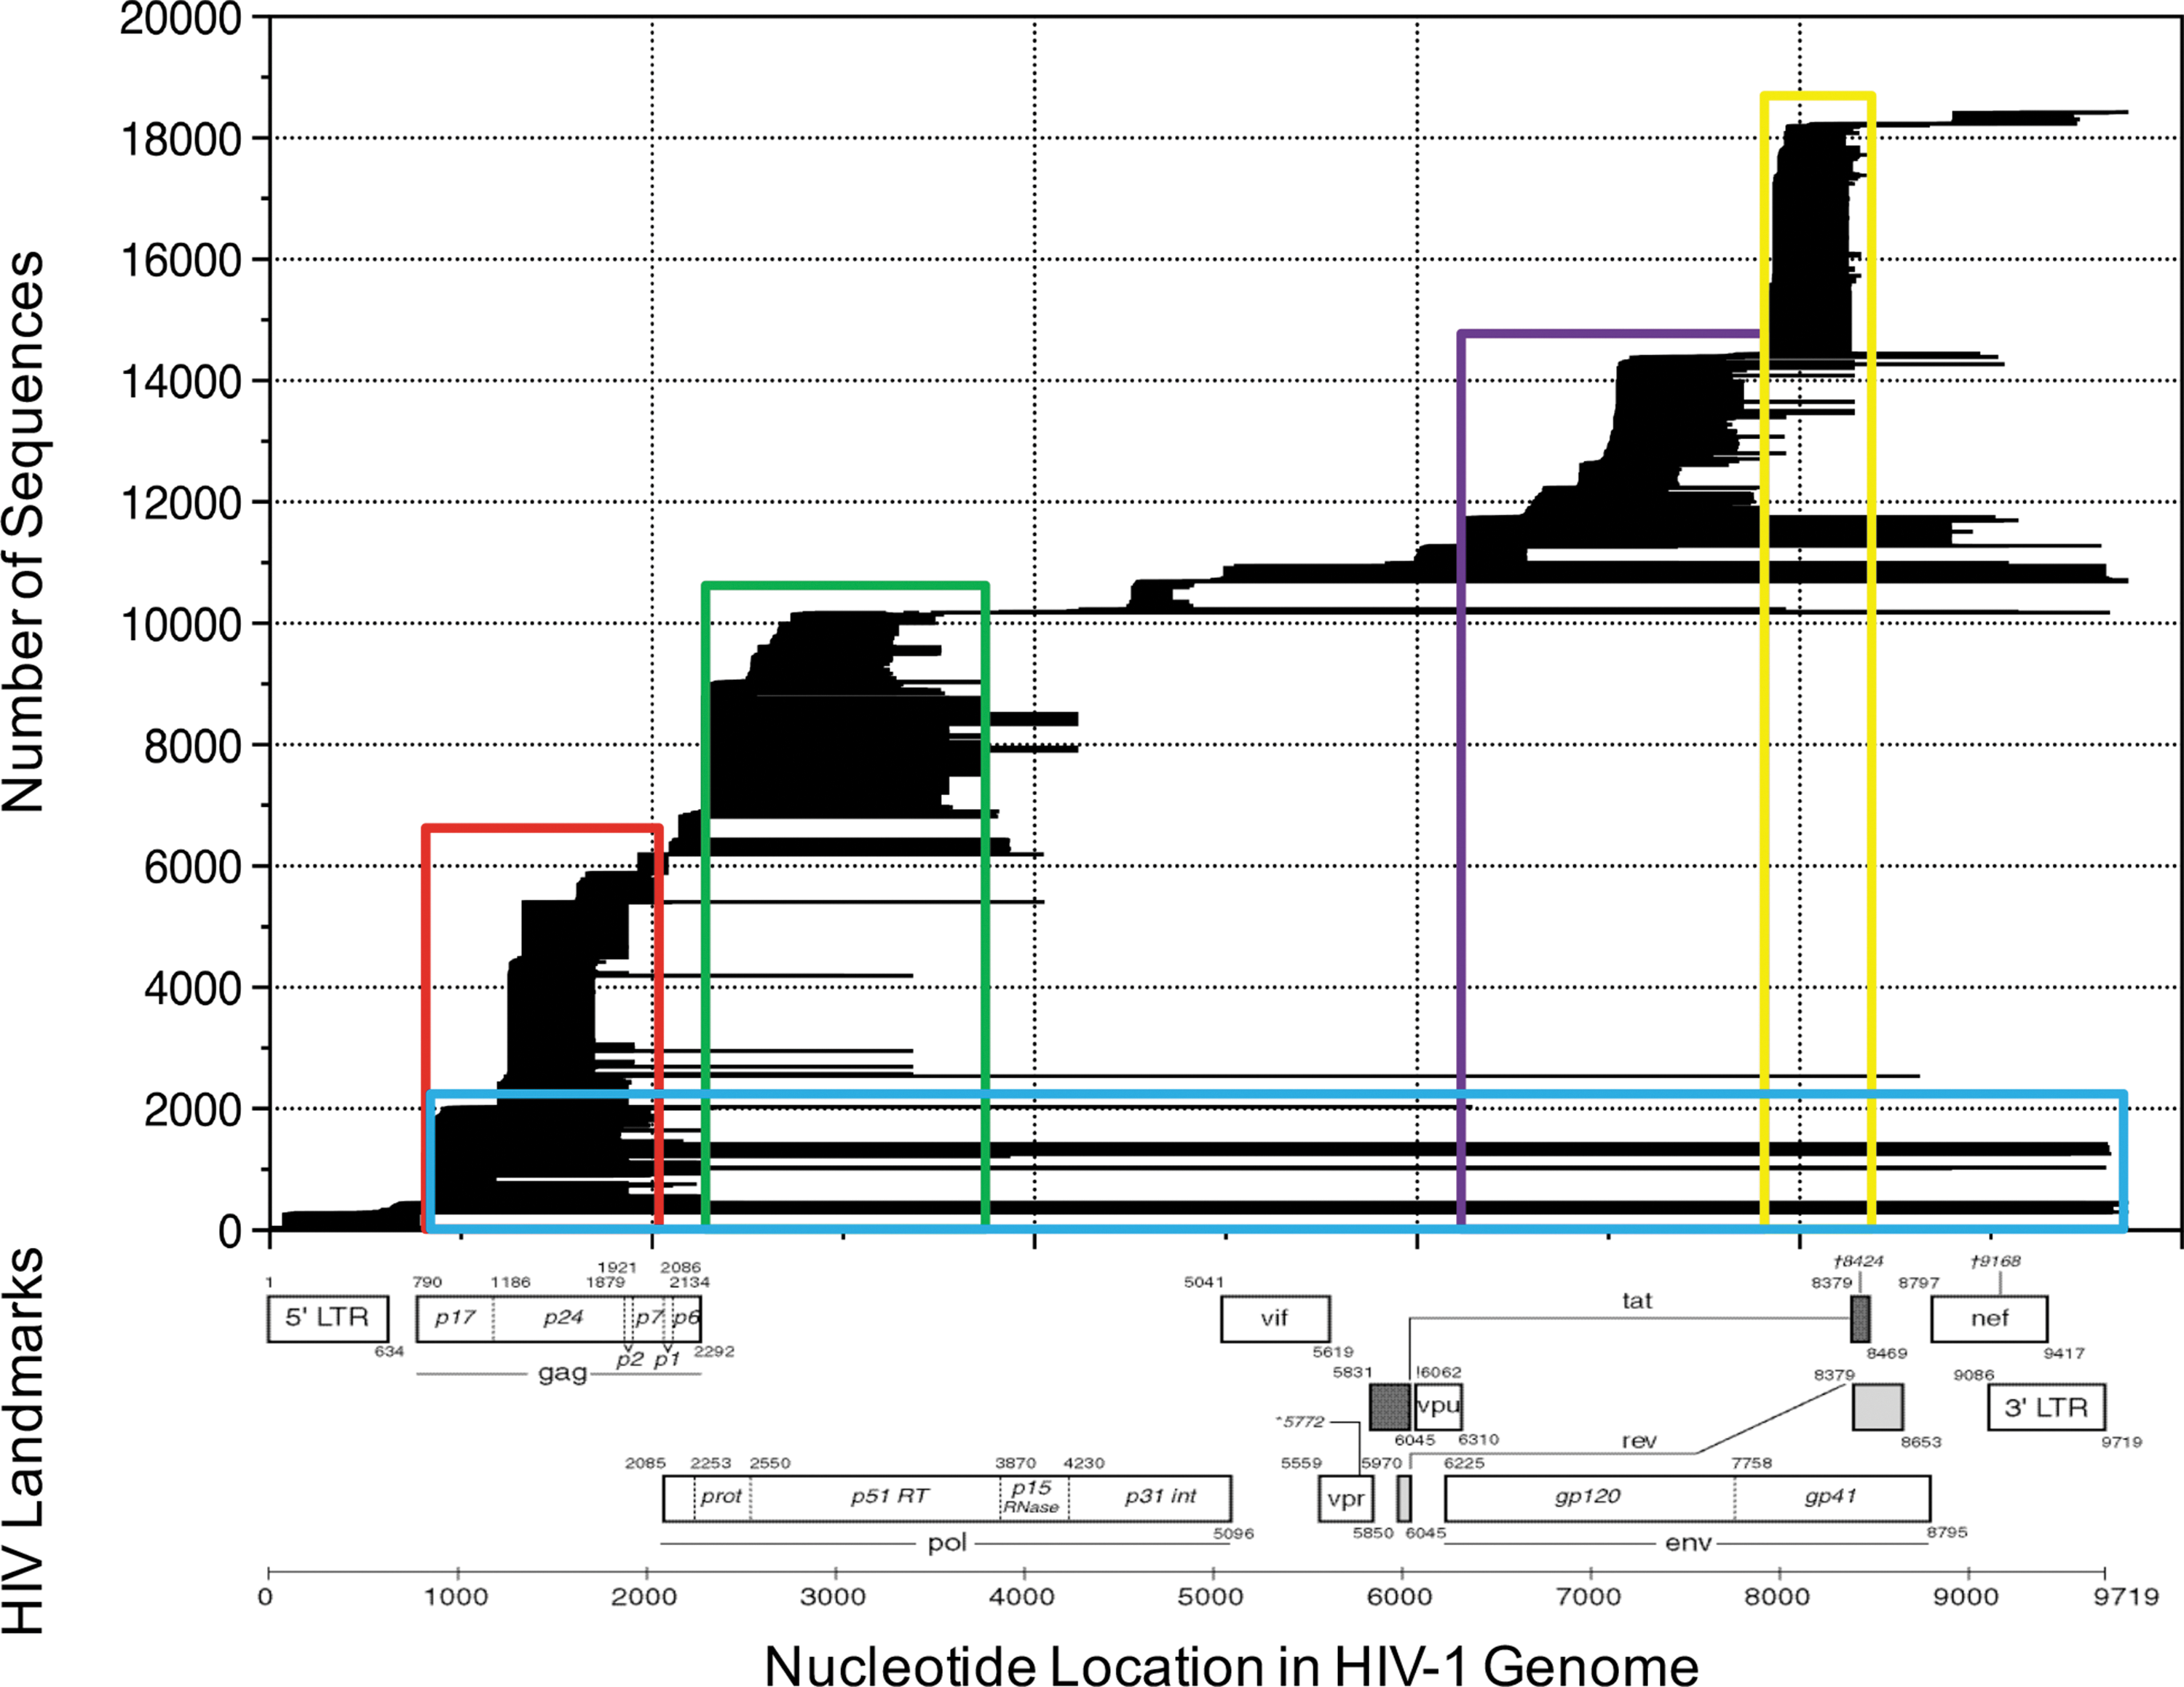
Combined sequence coverage for Central East Africa. Individual sequences are represented by black horizontal bars that span their HIV genomic location (x-axis). Sequences are stacked by their start location according to HXB2-HIV genomic coordinates. The number of sequences is displayed on the y-axis. Landmarks of the HIV genome are shown below the graph (image from
We next downloaded all sequences from each of the six countries that were at least 250 nucleotides in length using the “one sequence per patient” option and defined sequence coordinates for each genomic region. The program ElimDupes (
The final regional alignments, which include Genbank accession numbers, sampling years, sequence coordinates, and country embedded in the sequence name, are publicly available (Supplementary Data are available online at
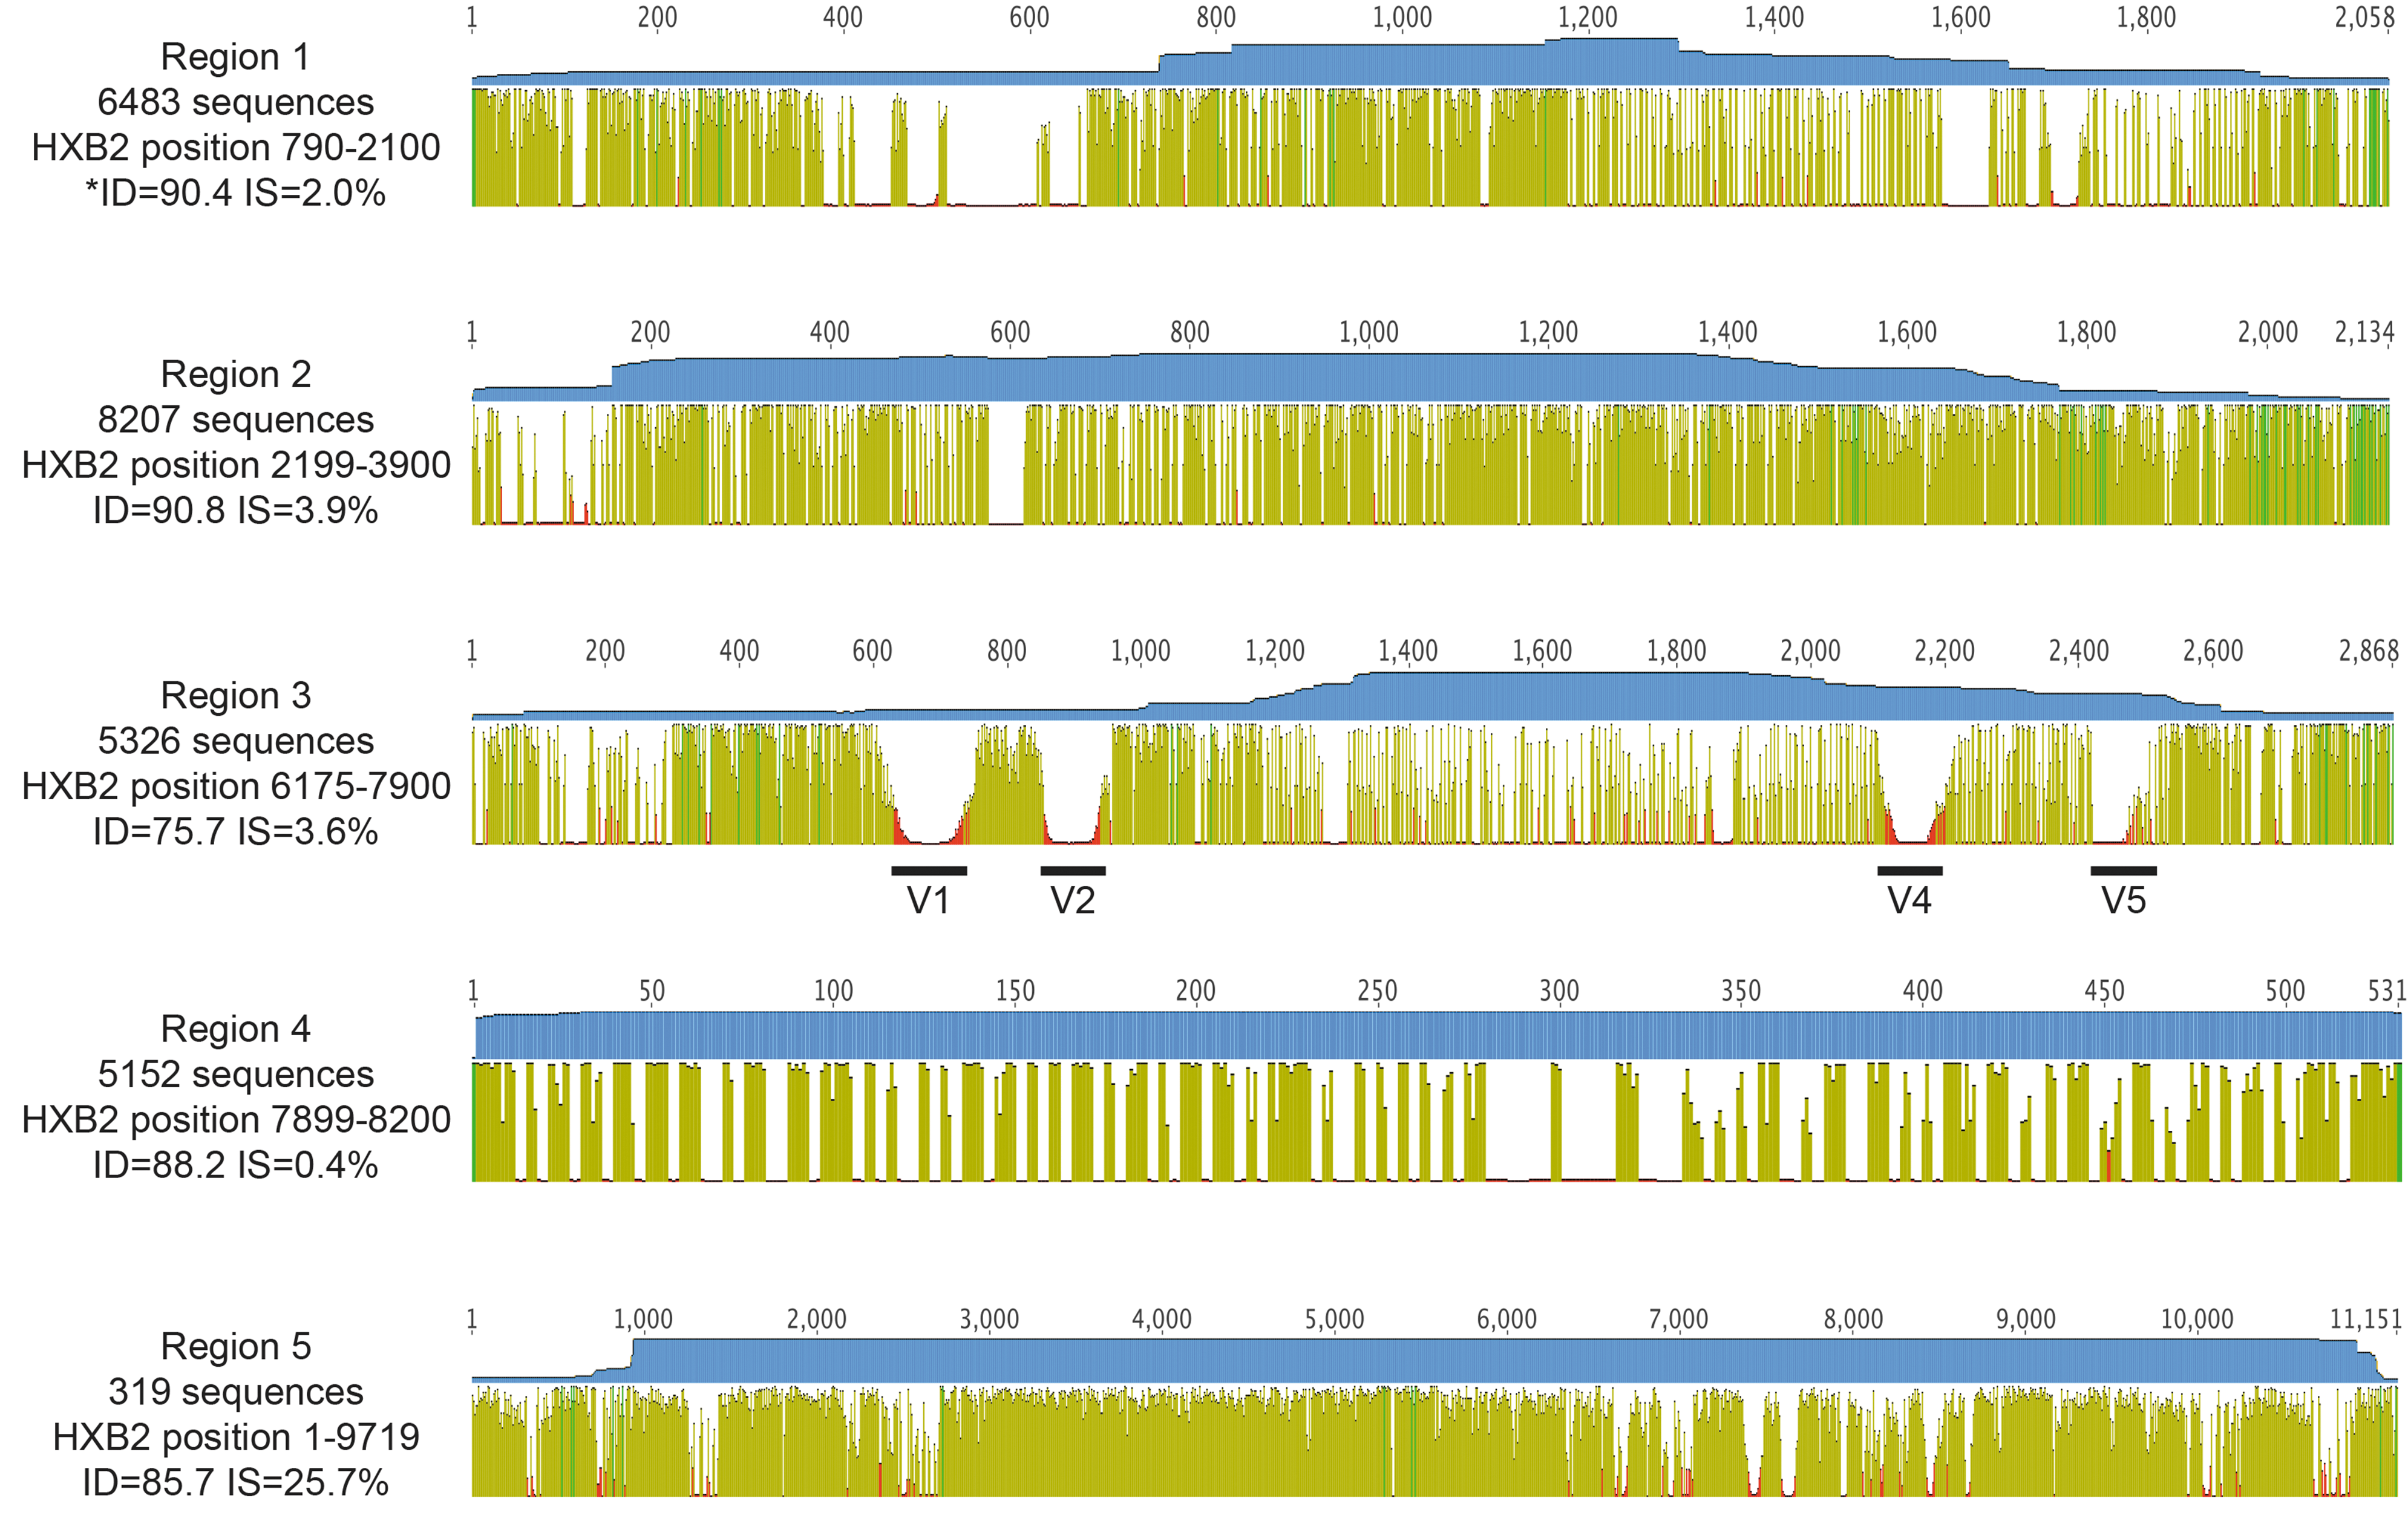
Alignment coverage and identity. For Regions 1–5 identified in Figure 1, an alignment was generated. The final number of sequences, the HIV region covered by each alignment according to HXB2-HIV numbering, the percentage pairwise sequence identity (ID), and percentage IS for the overall alignment are shown to the left for each region. The graphic is numbered for each region according to the final alignment length. Each alignment is composed of sequences of variable length, as represented by the top blue horizontal coverage bar, which portrays the number of nonend nucleic acid characters at each position along the alignment. For Region 1, the maximum height of the coverage bar at any site is 5,947 nucleotides, which indicates that there are 536 nonoverlapping sequences in this alignment (total number of sequences minus maximum coverage at any position), for Region 2 the maximum coverage is 7,739 nucleotides (468 nonoverlapping sequences), for Region 3 the maximum coverage is 5,023 (303 nonoverlapping sequences), for Region 4 the maximum coverage is 5,208 nucleotides (all sequences overlap), and for Region 5, the maximum coverage is 5,152 nucleotides (all sequences overlap). Below the coverage graphic, the mean pairwise identity over all pairs in each column of the alignment correlates with the height of each vertical bar along the length of the sequence and is colored as follows: dark green, 100% identity; light green, 30%–100% identity; red, less than 30%. In Region 3, we also highlighted the variable domains V1, V2, V4, and V5 where no sequence alignment was attempted. IS, identical sites.
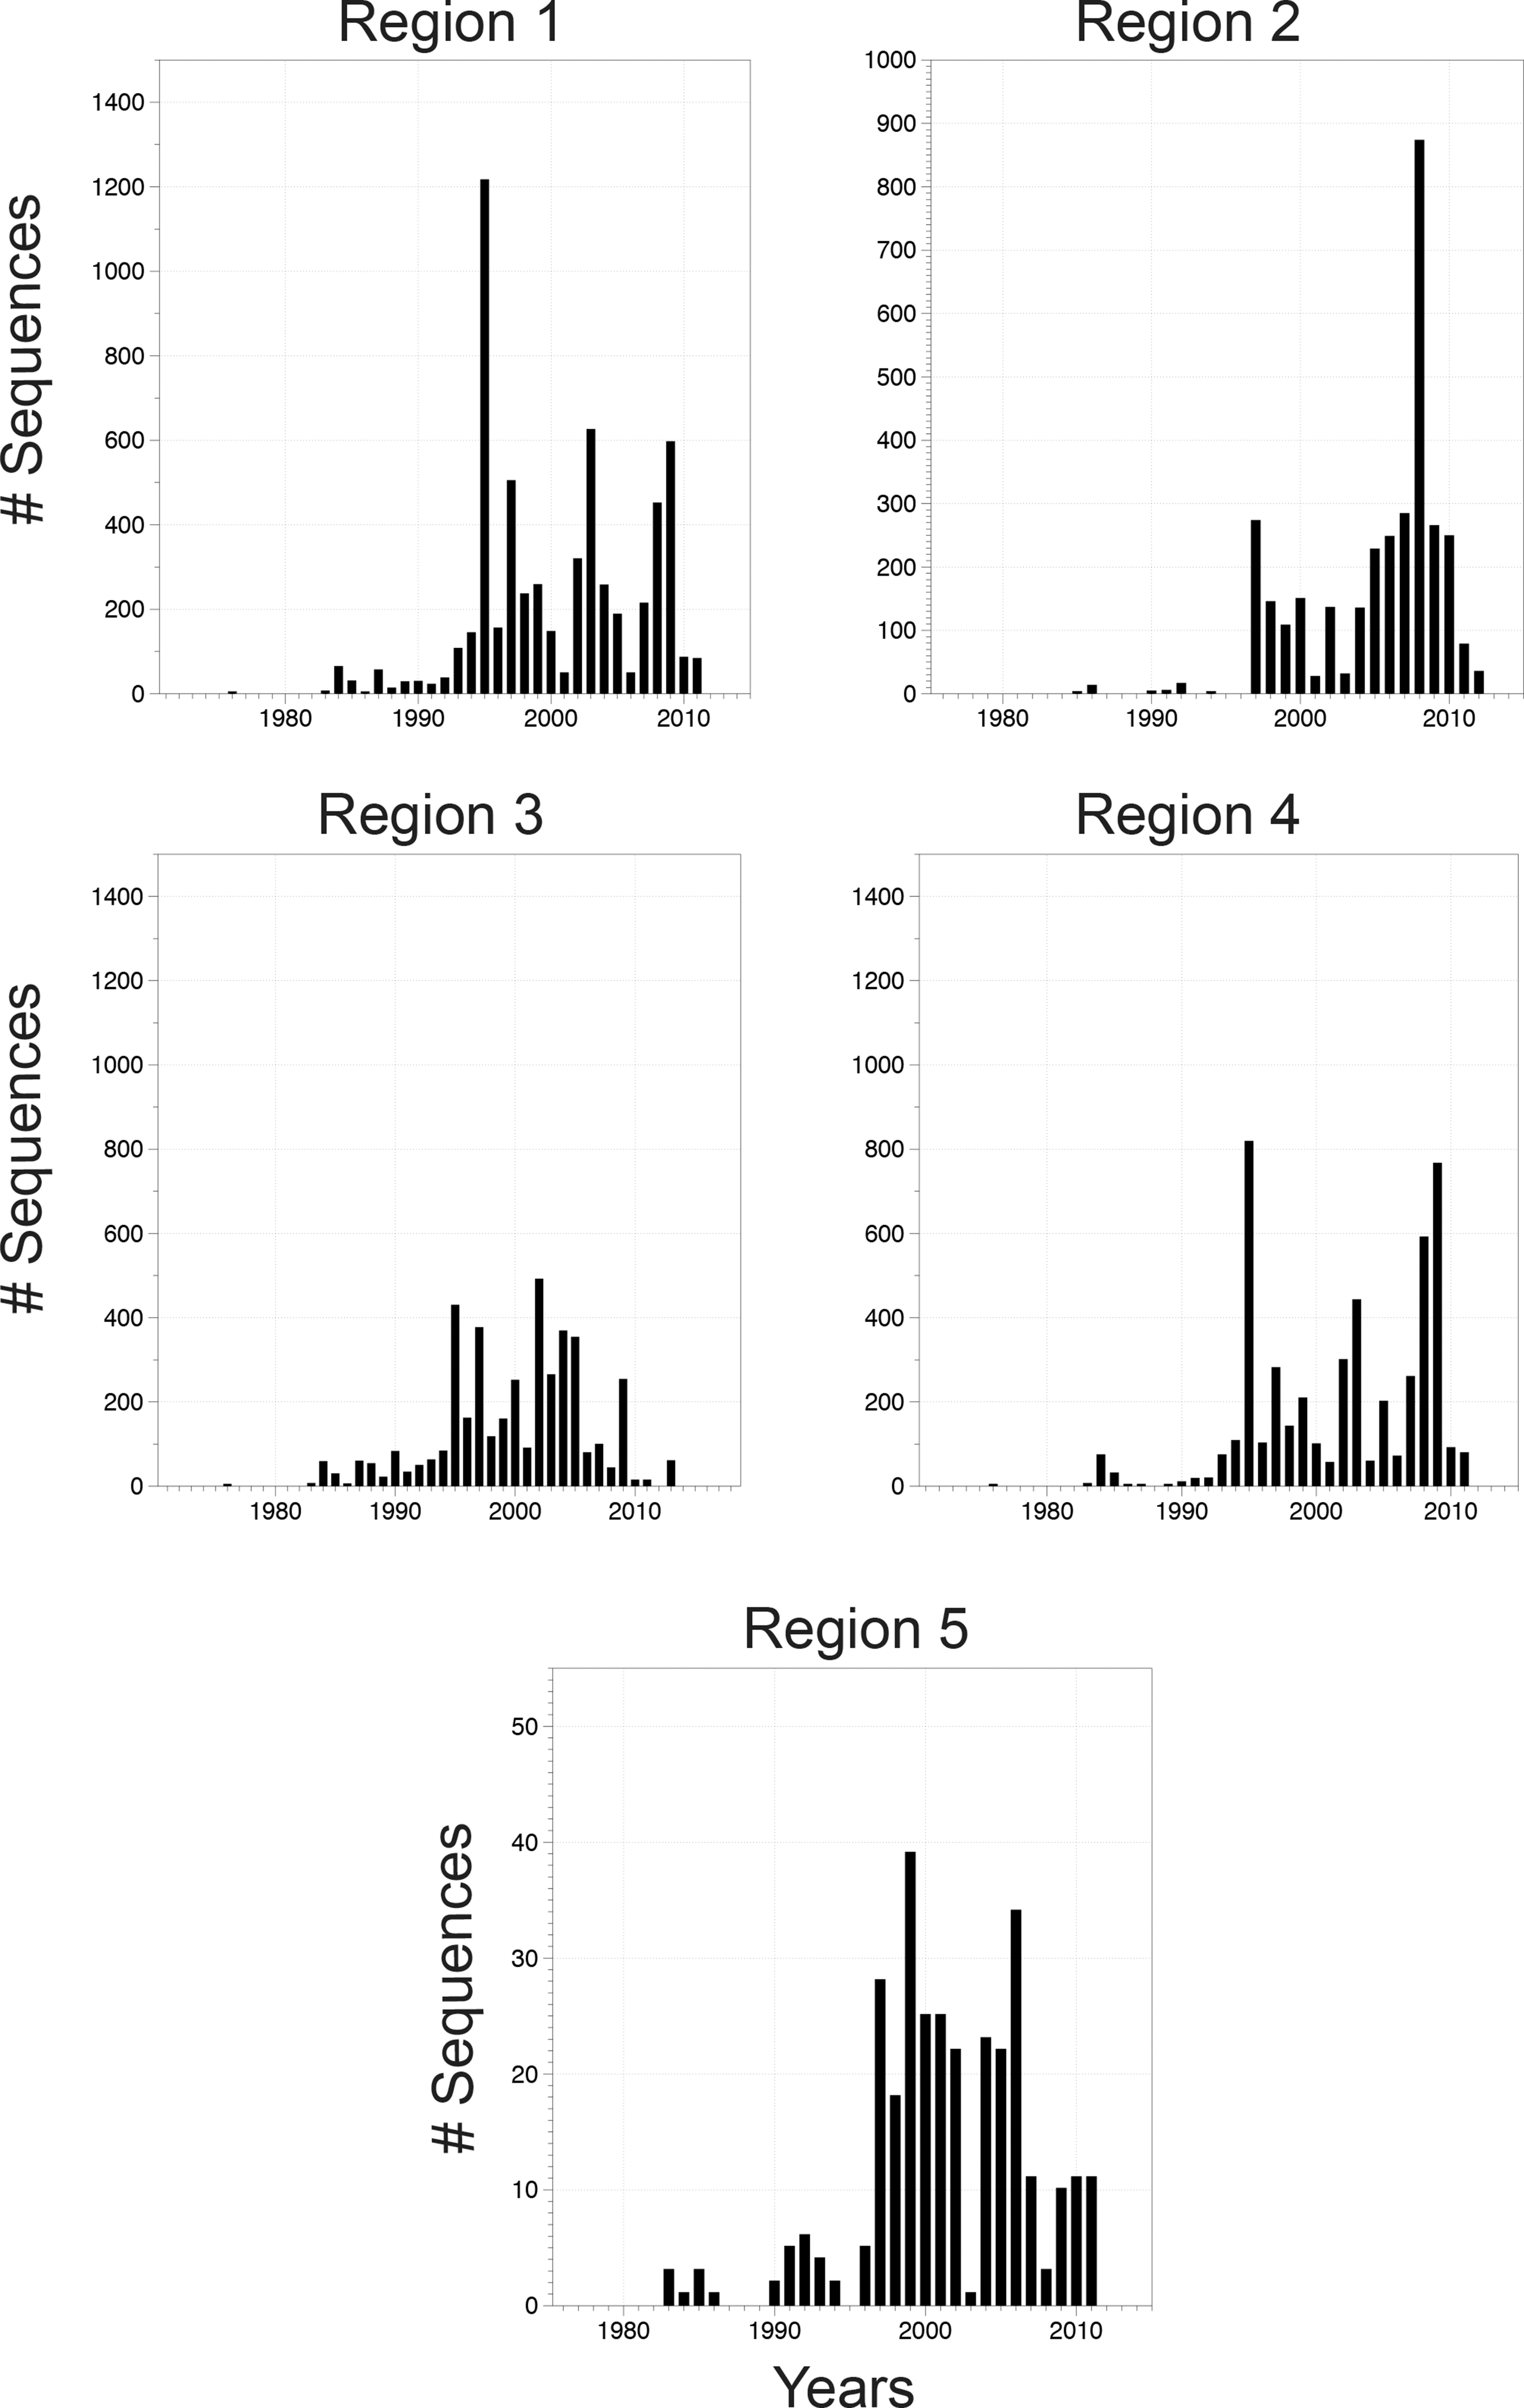
The number of sequences and years sampled in each regional alignment.
Includes any sequences that were either not given a subtype by the Los Alamos database, are recombinant sequences, or circulating recombinant forms.
As of 2013, most published viral sequence data from Eastern Africa come from Kenya and Uganda (73.6%) (Table 2), and 97.4% of all sequence data were collected after 1990 (Fig. 3). The greatest number of HIV sequences generated in a single year was in 1995. The majority (n = 1,517) of the Ugandan sequence data come from a single population-based study in Rakai District, Uganda, in 1995, the Rakai Community Cohort Study (RCCS). 3 Additional sequences from the RCCS (and in some cases from the same RCCS participants) are also available in large numbers in more recent years (2002–2003, 2008–2009). 4,5 Many (60.4%) Kenyan sequences were obtained from women and children with high exposure to HIV in the Pumwani area of Nairobi, Kenya. 6 –8 Sequences from the DRC include multiple HIV subtypes, as studies in this region have frequently focused on the varied recombining subtypes in the country. 9 A number of sequences (n = 608, 17.2%) from Tanzania were from 428 infected pregnant women. 10 Many of the sequences from Burundi (n = 220, 39%) were obtained from samples collected during a single surveillance study of 119 individuals living in urban and rural districts. 11
Notably, some of the oldest sequences from SSA were excluded from our final alignments due to their short length. These include multiple sequences from one individual that span <170 bp of env and pol, which were derived from stored plasma from a subject who died in 1959 from AIDS-like illnesses (Accession numbers AF030667–AF030686), 12 and five short sequences (<82 bp) generated from a paraffin-embedded lymph node sample that was collected in 1960 from the DRC (Accession numbers EU580739, EU589218, EU580803, EU580840, EU580849). 13 The oldest sequences included in the alignments (Regions 1–4) are molecularly cloned 1976 Zaire isolates, which have been used to study the evolutionary divergence of HIV in Africa previously (Accession numbers U76035, M15896). 14
In summary, we provide curated alignments of existing HIV sequence data from the Los Alamos HIV database in five genomic regions from six Central and Eastern African countries. In the process of creating these alignments, we identified gaps in HIV sequence information that could be addressed going forward. Notable deficits include data before the 1990s. Data from Tanzania, Burundi, and Rwanda are particularly sparse. In addition, most HIV sequence data within countries come from only a few studies, suggesting limited population and geographic diversity at the subnational scale. Initiatives such as PANGEA-HIV may help to address some of these data gaps moving forward.
This research was supported, in part, by the Division of Intramural Research, National Institute of Allergy and Infectious Diseases. The authors would like to thank Brian T. Foley at The Los Alamos HIV Sequence Data base and James J. Dollar at the University of Florida for assistance with codon-based alignments.
Footnotes
Author Disclosure Statement
No competing financial interests exist.
References
Supplementary Material
Please find the following supplemental material available below.
For Open Access articles published under a Creative Commons License, all supplemental material carries the same license as the article it is associated with.
For non-Open Access articles published, all supplemental material carries a non-exclusive license, and permission requests for re-use of supplemental material or any part of supplemental material shall be sent directly to the copyright owner as specified in the copyright notice associated with the article.