
Abstract
We investigated the effect of combination antiretroviral therapy (cART) on immune recovery, particularly on the percentages of PD-1-positive cells within the major leukocyte subsets. Cryopreserved peripheral blood mononuclear cells and plasma samples collected longitudinally from a subset of 13 children and adolescents (between 9.7 and 18.2 years old) who were enrolled in the International Maternal Pediatric Adolescent AIDS Clinical Trials (IMPAACT) P1066 were used for this study. Immunophenotyping by flow cytometry was performed to determine the effect of raltegravir-containing cART regimen on the distribution of leukocyte populations, on the expression of PD-1 on T cell subpopulations, and on the expression of well-established markers of T cell activation (CD38 and HLA-DR) on CD8 T cells. C reactive protein (CRP), lipopolysaccharide (LPS), IL-6, and soluble CD163 were assayed in plasma samples by an enzyme-linked immunosorbent assay. Plasma viral loads were decreased in all subjects (by an average of 2.9 log units). The cART regimen, including raltegravir, induced changes in CD8 T cell subsets, consistent with an effective antiretroviral outcome and improved immunologic status, including increased percentages of CD8 stem cell memory T cells (Tscm). The percentages of CD8 PD-1-positive cells decreased significantly as compared with baseline levels. Among the proinflammatory markers measured in plasma, sCD163 showed a decline that was associated with cART. cART therapy, including raltegravir, over 48 weeks in children is associated with immune restoration, consistent with effective antiretroviral therapy, namely decreased percentages of PD-1+ CD8+ T cells, an increase in CD8 Tscm cells, and decreased levels of sCD163.
Introduction
T
The International Maternal Pediatric Adolescent AIDS Clinical Trials (IMPAACT) P1066 study was performed to determine the safety and pharmacokinetics of raltegravir in HIV-infected children aged 4 weeks to <19 years by using three different formulations. P1066 enrolled participants in 5 age cohorts that received different formulations of raltegravir. 7 Entry criteria included plasma HIV RNA >1,000 copies/mL, previous exposure to ARV but naïve to integrase inhibitors, laboratory values below grade 3 toxicity criteria, and absence of opportunistic infections or current cancer. 1 In addition to providing information on proper dose selection, the P1066 study evaluated the safety, efficacy, and pharmacokinetics properties of raltegravir in children. 1
The programmed-death 1 (PD-1) protein is inductively expressed on CD4+, CD8+, NK T cell subsets, B cells, and monocytes on activation. PD-1 expression is induced in T cells by antigen receptor ligation. 8 PD-1 is transiently expressed in viral-specific CD8 T cells after infection but once the infection is resolved and T-cell receptor (TCR) signaling diminishes, PD-1 expression decreases. 8 Conversely, PD-1 expression is maintained during chronic infections, primarily due to continuous TCR ligation. 9
Upregulation of PD-1 on HIV-specific CD8+ T cells leads to reversible immune dysfunction, preventing the renewal of the functionally competent HIV-specific CD8+ T cell repertoire. 10 During chronic HIV infection, virus-specific CD8+ T cells undergo functional exhaustion, lose effector functions, and fail to control viral infection. HIV-specific CD8+ T cells express high levels of co-inhibitory molecule PD-1 during chronic infection and are characterized by decreased proliferation, cytokine production, and cytotoxic abilities. 11 PD-1 is likewise upregulated on HIV-specific CD4+ T cells, and its expression level correlates with viremia and inversely with CD4+ T cell counts. 11
Conflicting findings have been reported on the changes in PD-1 levels after combination antiretroviral therapy (cART): Some studies concluded that PD-1 levels on CD4 and CD8 T cells remain high after administering cART to HIV-infected individuals, 12 whereas others showed evidence that PD-1 expression declines after cART 13 or is not significantly different in the HIV-1-infected cART-treated group when compared with uninfected controls. 14
We used cryopreserved peripheral blood mononuclear cells (PBMC) purified from blood samples collected longitudinally (at entry, 8, 24, and 48 weeks) from a subset of participants in the P1066 study. Cryopreservation results in non-linear loss of PD-1 expression that is measured as number of molecules/cell, 15,16 which complicates the interpretation of findings obtained from retrospective studies. To mitigate this shortcoming, we analyzed the percentage of PD-1-positive cells rather than antigen density on target cells.
Our aims were to determine the effects of the raltegravir-containing cART regimen on the percentages of PD-1-positive cells within T cell subpopulations (naïve, central memory, effector memory, terminally differentiated, and stem cell-like memory) and on well-established markers of T cell activation: CD38 and HLA-DR. 17 –19 We also studied the effect of cART on monocyte subsets as defined by the expression of CD14 and CD16 20,21 and on plasma markers of inflammation.
Materials and Methods
Subjects
We used cryopreserved blood and plasma samples from a subset of participants in the IMPAACT P1066 study “Safety and Pharmacokinetics of Raltegravir in HIV (Human Immunodeficiency Virus)-Infected Children and Adolescents” (
The cells used in this immunophenotyping study were obtained from blood samples collected both before and after treatment with raltegravir at four time points: entry, 8, 24, and 48 weeks. Plasma HIV RNA (RNA) concentrations were determined by using the HIV-1 MONITOR Test, version 1.5 (Roche Molecular Diagnostics) or RealTime HIV-1 (Abbott Molecular). 1 PBMCs were isolated and cryopreserved, and plasma was frozen and stored at −80°C until it was subsequently analyzed.
We used cryopreserved PBMCs from 12 children aged 12.1–18.2 years who were enrolled in cohort I and one child aged 9.7 years who was enrolled in cohort 2A of the P1066 study. Blood for immunology storage was collected at entry, 8, 24, and 48 weeks. We selected only subjects for whom a sufficient number of PBMC were cryopreserved at all four time points. The availability of sufficient cryopreserved PBMC with cell viability rates >75% was the limiting factor that prevented us from extending the study to a larger number of participants. All blood samples used in the present study were collected between May 2008 and November 2010.
Immunophenotyping by multicolor flow cytometry was performed to measure the percentages of PD-1-positive cells within the main subpopulations of T lymphocytes: naïve (Tn), central memory (Tcm), effector memory (Tem), effector (Te), and stem cell-like memory (Tscm), as previously described. 22 –24
CD38 and HLA-DR were used as markers of CD8+ T cell activation, and percentages of cells expressing either CD38 or both CD38 and HLA-DR were determined. Percentages of B cells, natural killer cells, and classic (CD14-high CD16 low) and non-conventional (CD14 low, CD16 high) monocytes were also determined.
Flow cytometry
Multicolor flow cytometry assays were performed by using two panels of antibodies on cryopreserved PBMCs, thawed, and washed in RPMI containing 10% fetal bovine serum and then in phosphate-buffered saline. Since cells can be damaged by cryopreservation, we used a fixable viability dye to exclude dead cells from analysis. Thawed cells were first stained with the Live/Dead blue viability dye (Life Technologies, Grand Island, NY) to exclude non-viable cells.
For identifying T cell subpopulations and PD-1 expression, PBMCs were then incubated for 30 min at room temperature in the dark with the following antibodies: CD3-BUV395 (clone UCHT1), CD4-BV650 (OKT4), CD8-BV711 (RPA-T8), CD45RO-BV421 (UCHL1), CD197-FITC (G043H7), CD95-APC (DV2), PD-1-PE (EH12.2H7), CD27-PECy7 (O323), HLA-DR-APC-Cy7 (L243), and CD38-PerCP-Cy5.5 (HB-7). This combination of antibodies was used to measure the percentages of T cell subsets, mainly based on the expression of CCR7 (CD197), CD45RA, and CD27. The expression of PD-1 on each subset, and the percentages of activated CD8+ T cells (CD38+ or HLA-DR+ and CD38+) were also determined. Gating of naïve (Tn), central memory (Tcm), effector memory (Tem), and terminally differentiated effector (Te) T cells was performed as shown in Figure 1 on each of the CD4+ and CD8+ T cell population, following a strategy previously described. 24

Gating strategy for identifying T cell subpopulations and the expression pf PD-1. PBMCs were separated from blood samples by centrifugation on Ficoll, and cells were cryopreserved in liquid nitrogen until flow cytometry analysis was performed. Viable T cells were identified as CD3+ and L/D Blue-dim cells
Other lymphocyte subtypes and monocytes were studied on cells stained with CD3-BUV395 (clone UCHT1), CD56-BV421 (HCD56), CD19-BV650 (H1B19), CD14-BV711 (M5E2), CD312-FITC (2A1), CD163-PE (MAC2-158), CD16-PE-Cy7 (3G8), CD97-APC (VIM3b), HLA-DR-APC-Cy7 (L243), and CD38-PerCP-Cy5.5 (HB-7). The identification of the main populations of leukocytes was performed as previously described. All antibodies were purchased from BioLegend (San Diego, CA), except antibodies for CD163 (Trillium Diagnostics Bangor, ME), CD312 (AbD Serotec, Raleigh, NC), CD97 (eBiosciences, San Diego, CA), and CD3-BUV395 (BD Biosciences, San Jose, CA). Optimal concentrations of antibodies were determined in preliminary titration experiments.
Data acquisition and analyses were performed by using an LSRFortessa flow cytometer and FACSDiva software (BD Biosciences, San Jose, CA). Compensation for fluorescence spillover was performed for each panel of antibodies in FACSDiva by using OneComp eBeads from eBiosciences (San Diego, CA) stained with each antibody individually and PBMCs stained with Live/Dead blue dye. Gating strategy for identifying the T cell subsets and the expression of PD-1 is shown in Figure 1.
IL-6 and CRP quantitations were performed by using solid-phase sandwich enzyme-linked immunosorbent assay (ELISA) kits from Invitrogen/Life Technologies (Grand Island, NY).
Soluble CD163 was measured by using an ELISA kit from R&D Systems (Minneapolis, MN). The procedures provided by the manufacturer were used for each kit, and the absorbance of each well was measured on a BioTek PowerWave XS (BioTek, Winooski, VT).
Lipopolysaccharide (LPS) was measured by using the endpoint chromogenic Limulus Amebocyte Lysate (LAL) test for gram-negative bacterial endotoxin from Lonza (Allendale, NJ), following the procedure recommended by the manufacturer. The absorbance of each sample was measured on a Tecan Sunrise ELISA plate reader (Tecan Systems, San Jose, CA).
Statistical analyses
Two-tailed paired Student's t-test was used to test for significant differences, and Bonferroni correction for multiple comparisons on longitudinal samples was applied; 0.01667 was considered the limit for rejecting the null hypothesis, accounting for comparisons between values measured at entry versus three subsequent time points (8, 24, and 48 weeks).
Results
The cART regimen, including raltegravir, effectively lowered plasma viral loads in all subjects (Fig. 2) from a median value of 23,918 copies/mL at entry to median values of 37, 26, and 14 copies/mL at 8, 24, and 48 weeks, respectively (p < 10−6; Fig. 2a). The range of viral load at entry was between 2.1 × 10³ and 2.8 × 10⁵ copies/mL. After the initiation of cART regimen, all participants had viral loads below 400 copies/mL, except for one subject with viral loads ranging between 424 and 1913 at weeks 24 and 48.
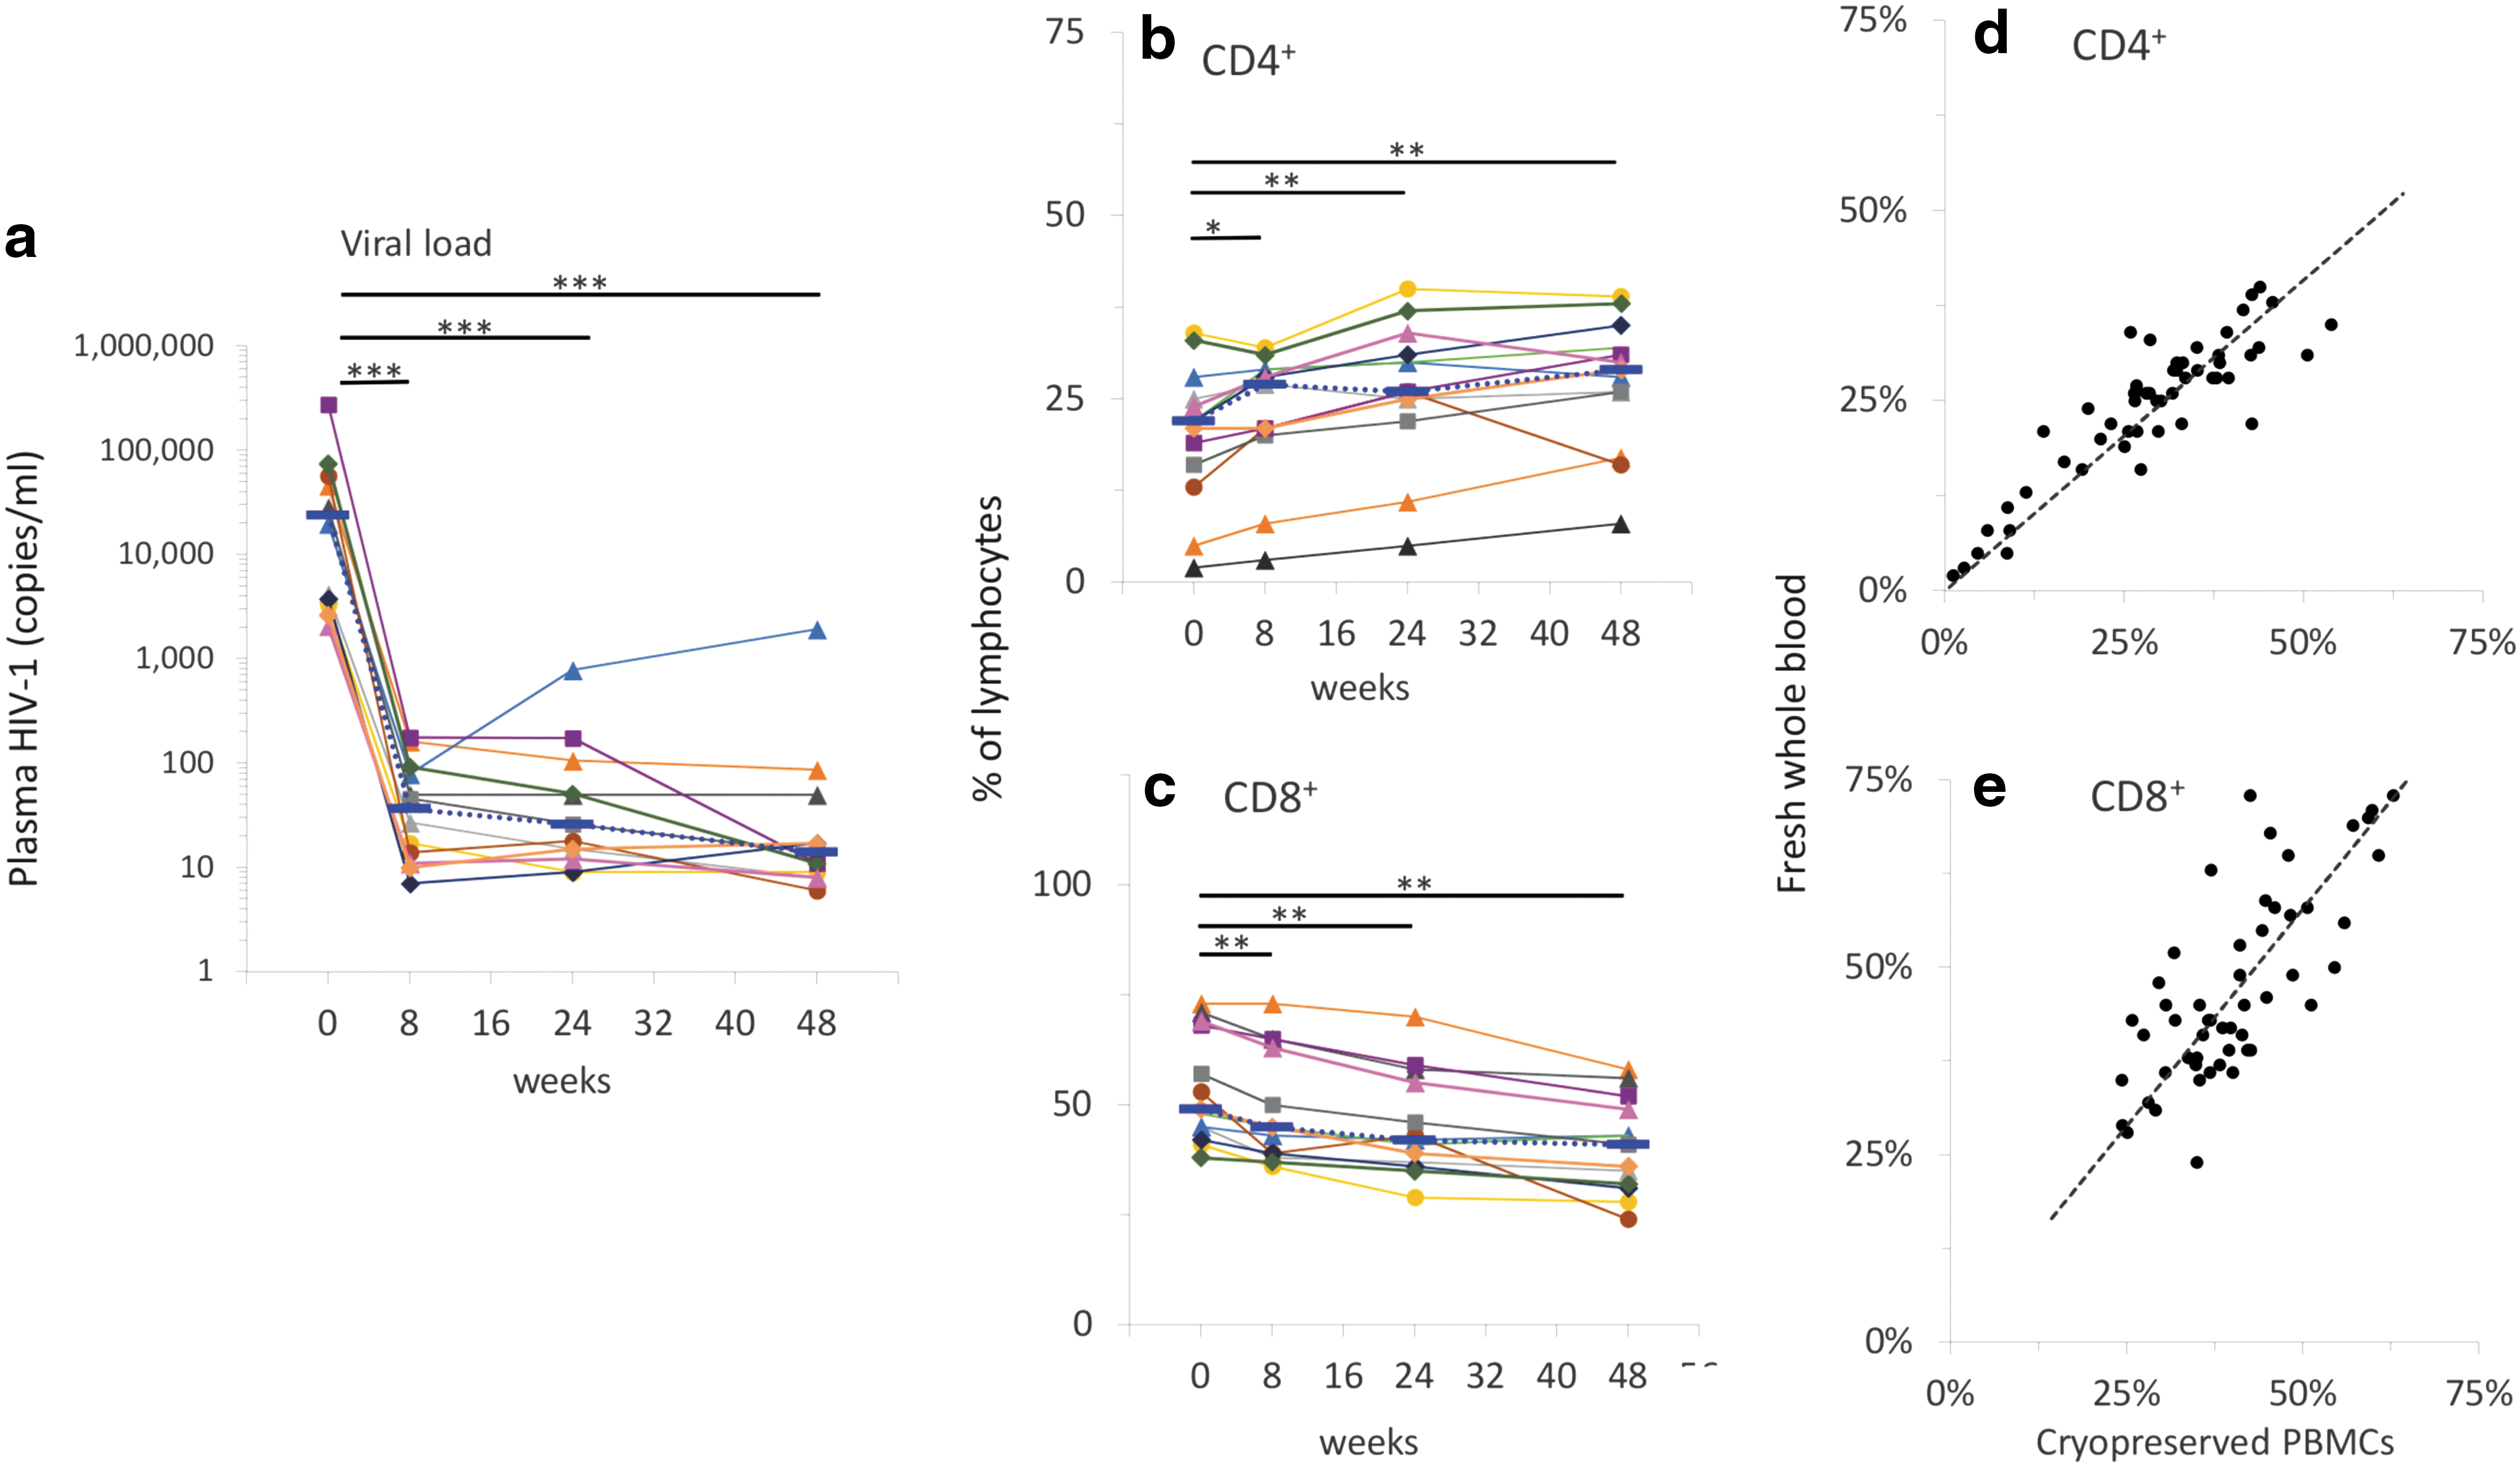
Viral load and percentages of CD4+ and CD8+ T cells. Viral loads
The percentages of CD4+ cells increased after the initiation of cART treatment containing raltegravir; the mean value at entry was 20.3% and increased to 22.9% at 8 weeks, 26.3% at 24 weeks (p < .0001), and 27.3% at 48 weeks (p < .0005; Fig. 2b). Conversely, the percentages of CD8+ T cells decreased from 53.8% at entry to 49.1% at 8 weeks (p < .0005), 45.4% at 24 weeks (p < 10−5), and 40.6% at 48 weeks (p < 10−4; Fig. 2c).
We found significant correlations between the percentages of CD4+ or CD8+ T cells measured in fresh blood samples at the time that the study was conducted with those measured in cryopreserved PBMCs (Fig. 2c, d). Correlations for both CD4 and CD8 were statistically significant (p < 10−6), with Pearson correlation coefficients of 0.89 and 0.75 for CD4% and CD8%, respectively. Differences between median values measured in fresh whole blood samples versus cryopreserved PBMCs were below 4%, consistent with data previously reported. 25
The percentages of naïve (Tn), central memory (Tcm), effector memory (Tem), effector (Te), and stem cell-like memory (Tscm) cells determined by polychromatic flow cytometry in CD4+ (Fig. 3a–e) and CD8+ (Fig. 3f–j) T cells are shown in Figure 3.
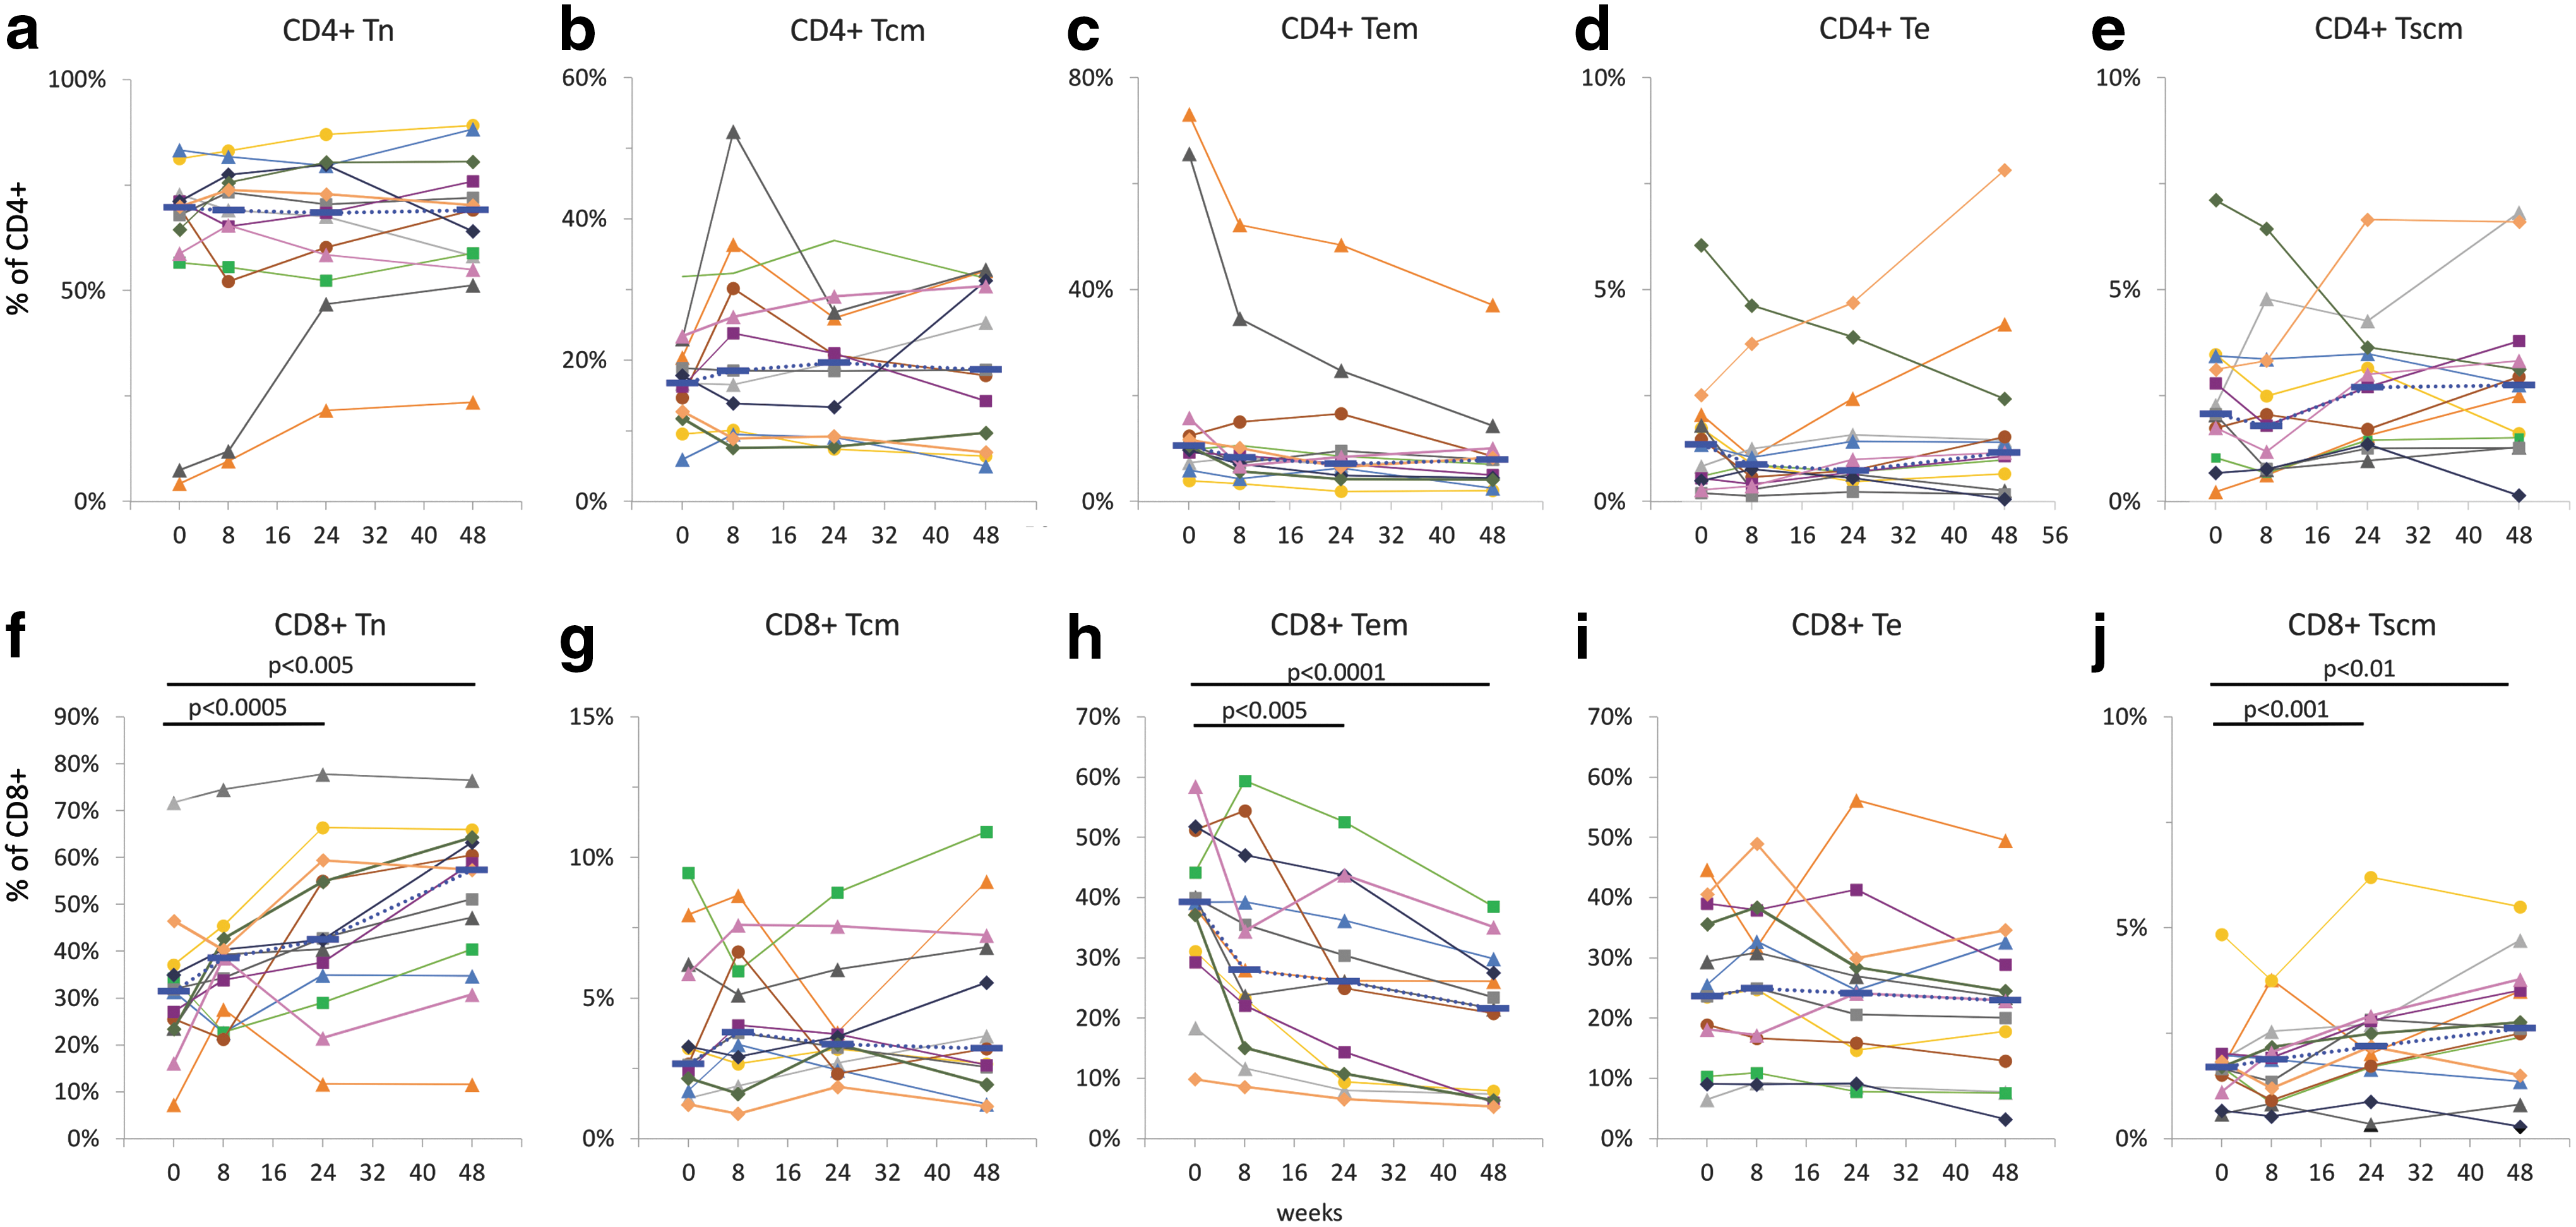
T cell subpopulations in cryopreserved PBMCs. Percentages of naïve (Tn), central memory (Tcm), effector memory (Tem), effector (Te), and stem cell-like memory (Tscm) cells were determined in CD4+
The cART regimen containing raltegravir induced significant changes in the distribution of T cell phenotypes, more prominently in CD8+ T cells. Increased percentages of CD8 Tn were found at 24 and 48 weeks, with median values changing from 31.5% at entry to 42.5% at 24 weeks and 57.4% at 48 weeks, respectively (p < .005; Fig. 3f). A similar trend was observed for CD8+ Tscm cells, with median percentage values increasing from 1.7% at entry to 2.2% and 2.6% at 24 and 48 weeks, respectively (p < .01; Fig. 3j).
Unlike Tn and Tscm cells, median percentage values of CD8 Tem cells decreased from 39.3% at entry to 26.1% and 21.6% at 24 and 48 weeks, respectively (p < .001; Fig. 3h). The median percentage values at 8 weeks were marginally higher for CD8 Tn (Fig. 3f), and lower for CD8 Tem cells (Fig. 3h) as compared with the corresponding entry values, but the differences were not statistically significant. Neither CD8+ Tcm nor CD8+ Te cells were changed during the cART regimen (Fig. 3g, i).
Since the mean fluorescence intensity of PD-1 staining is affected by cryopreservation, 15,16 we measured the percentage of PD-1-positive cells in each T cell subpopulation as a primary outcome of the study.
We found that the percentage of total CD4+ PD1+ cells did not change significantly during the study, although the median values trended toward a decrease from 15.6% at entry to 15.2% at 8 weeks, 14.5% at 24 weeks, and 11.1% at 48 weeks. The percentage of CD8+ PD-1+ cells decreased significantly from a median value of 44.2% at entry to 41.0%, 23.5%, and 18.9% at 8, 24, and 48 weeks, respectively (p < .014; Fig. 4a, g). Percentages of PD-1-positive naïve (Tn), central memory (Tcm), effector memory (Tem), effector (Te), and stem cell-like memory (Tscm) cells were determined for each CD4+ (Fig. 4b–f) and CD8+ (Fig 4h–l) T cell subpopulation in cryopreserved PBMCs. Higher percentages of PD-1+ CD4+ Tcm (Fig. 4c; p < .01) and CD4+ Tscm (Fig. 4f; p < .01) cells were measured at 24 and 48 weeks, respectively, whereas the other subpopulations of CD4+ T cells did not change significantly during the study.
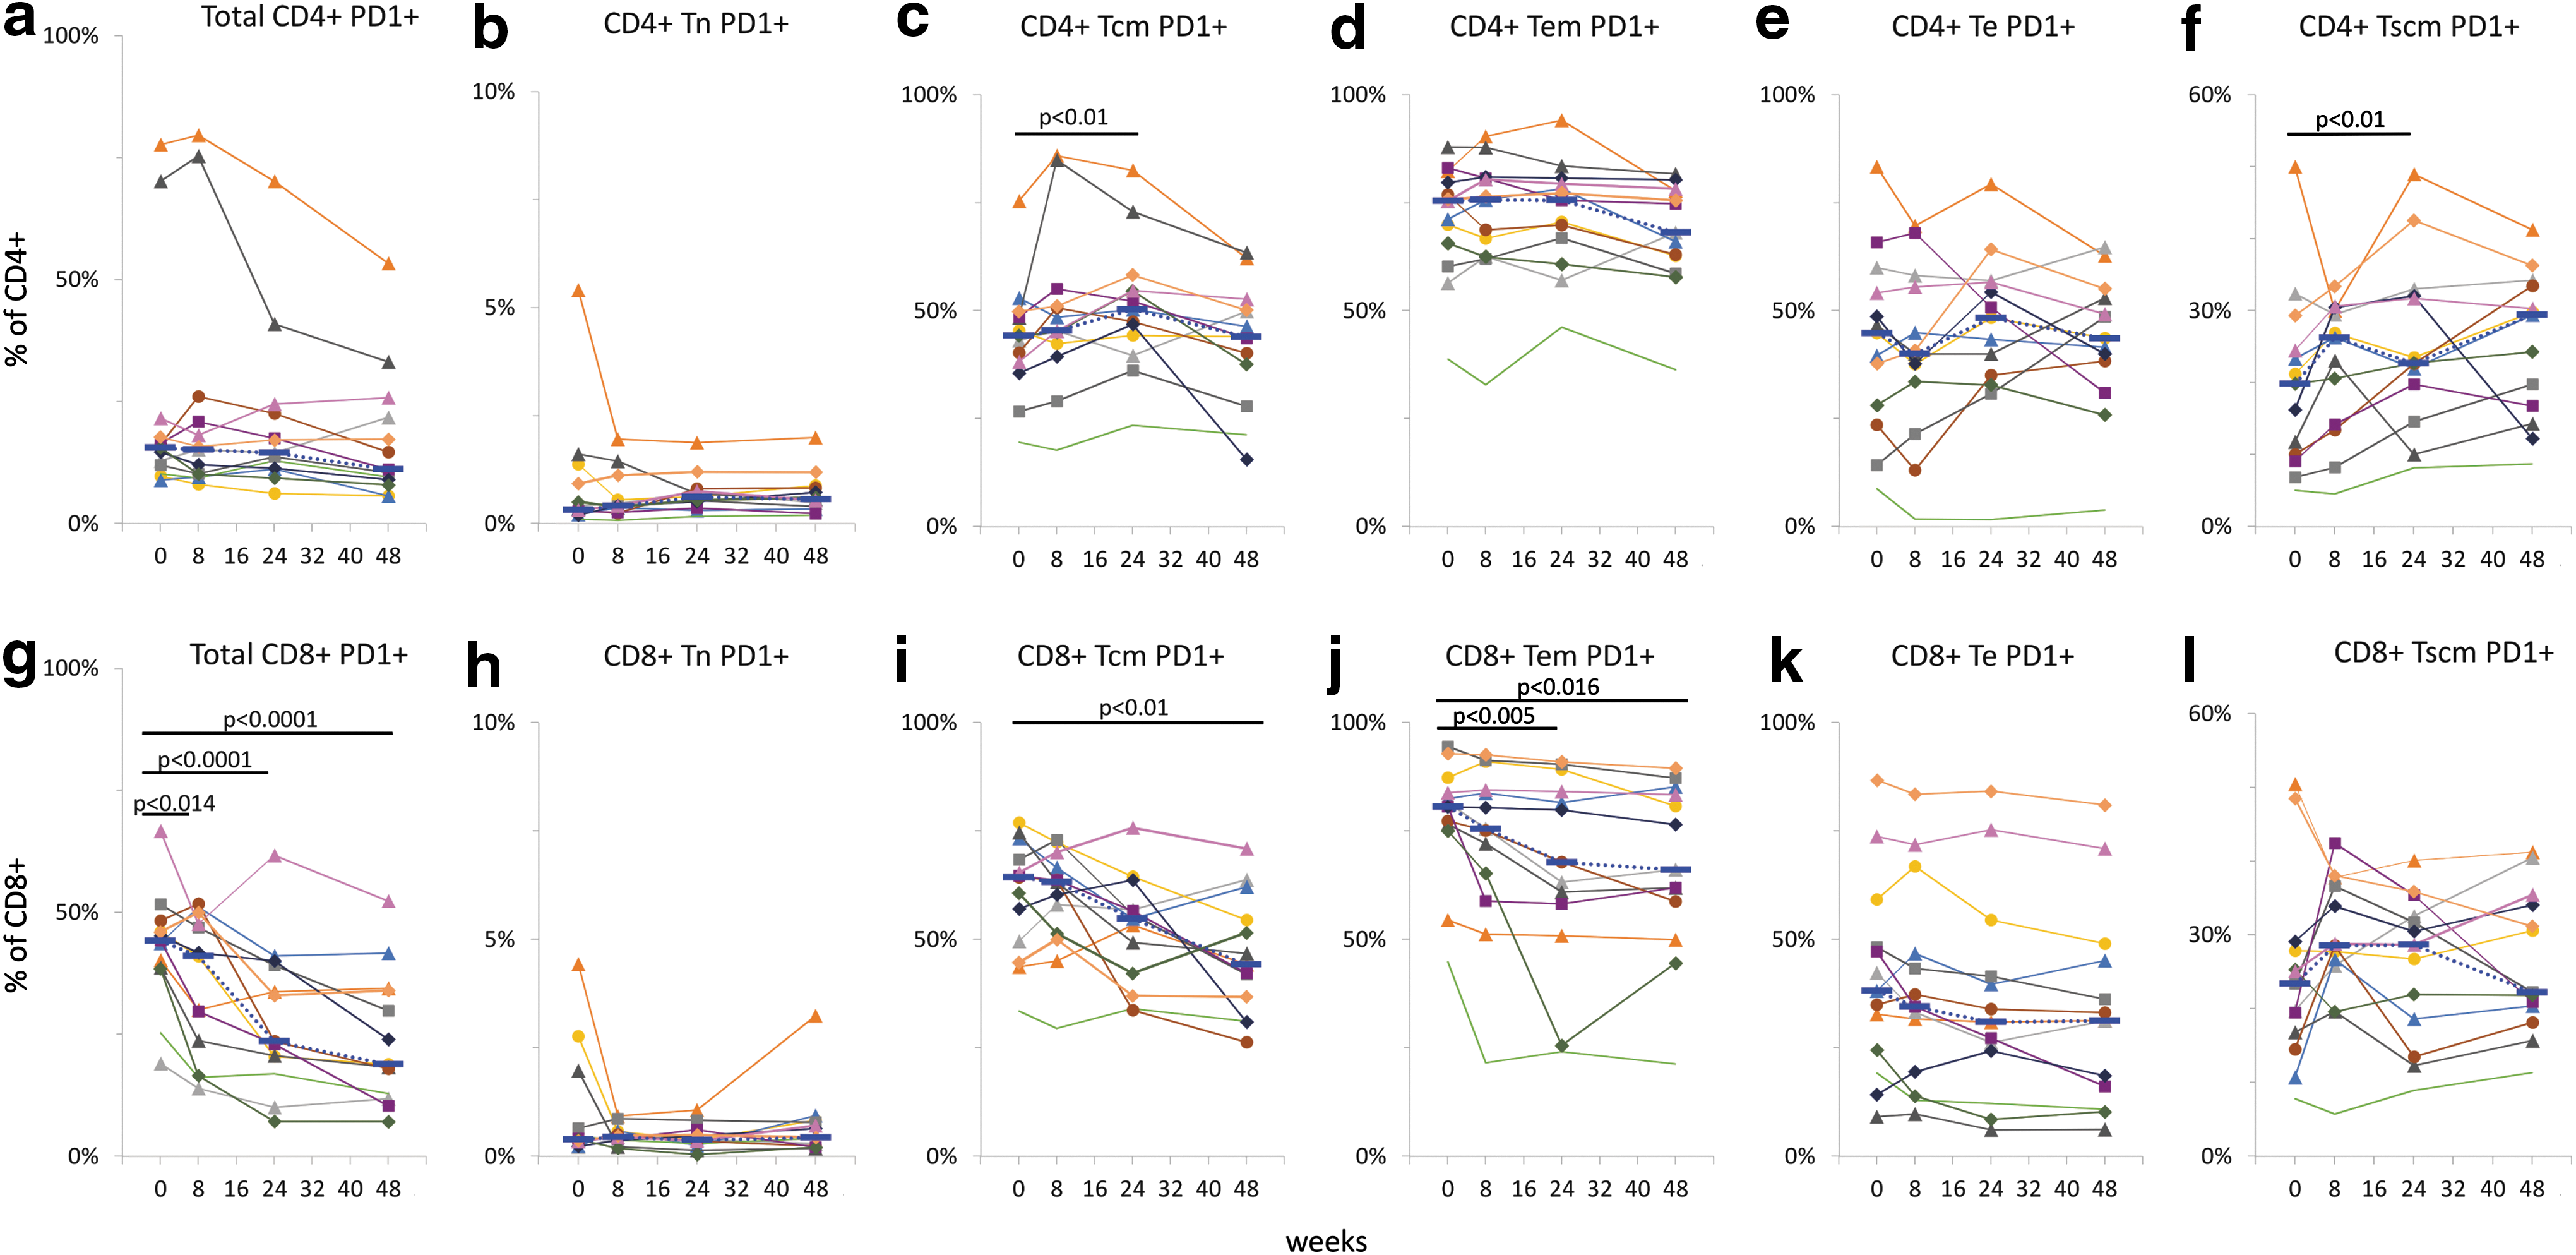
Expression of PD-1 on T cells. Percentages of PD-1-positive T cells, total, naïve (Tn), central memory (Tcm), effector memory (Tem), effector (Te), and stem cell-like memory (Tscm) cells were determined in cryopreserved PBMCs for CD4+
Among the subpopulations of CD8+ T cells, decreased percentages of cells expressing PD-1 were found in CD8+ Tcm (48 weeks; Fig. 4i) and Te (24 and 48 weeks; Fig. 4j) cells.
We measured significant changes in activation markers CD38 and HLA-DR on CD8+ T cells at all time points after the initiation of cART. Percentages of CD38+ CD8+-T cells or dual positive for HLA-DR+ and CD38+ significantly decreased at 8 weeks and remained lower than at the beginning of the study (Fig. 5). Viral loads were significantly correlated with CD8+ CD38+ (Fig 5c) and CD8+ CD38+ HLA-DR+ (Fig. 5d); Pearson coefficients were 0.58 and 0.70, respectively (p < 10−5).
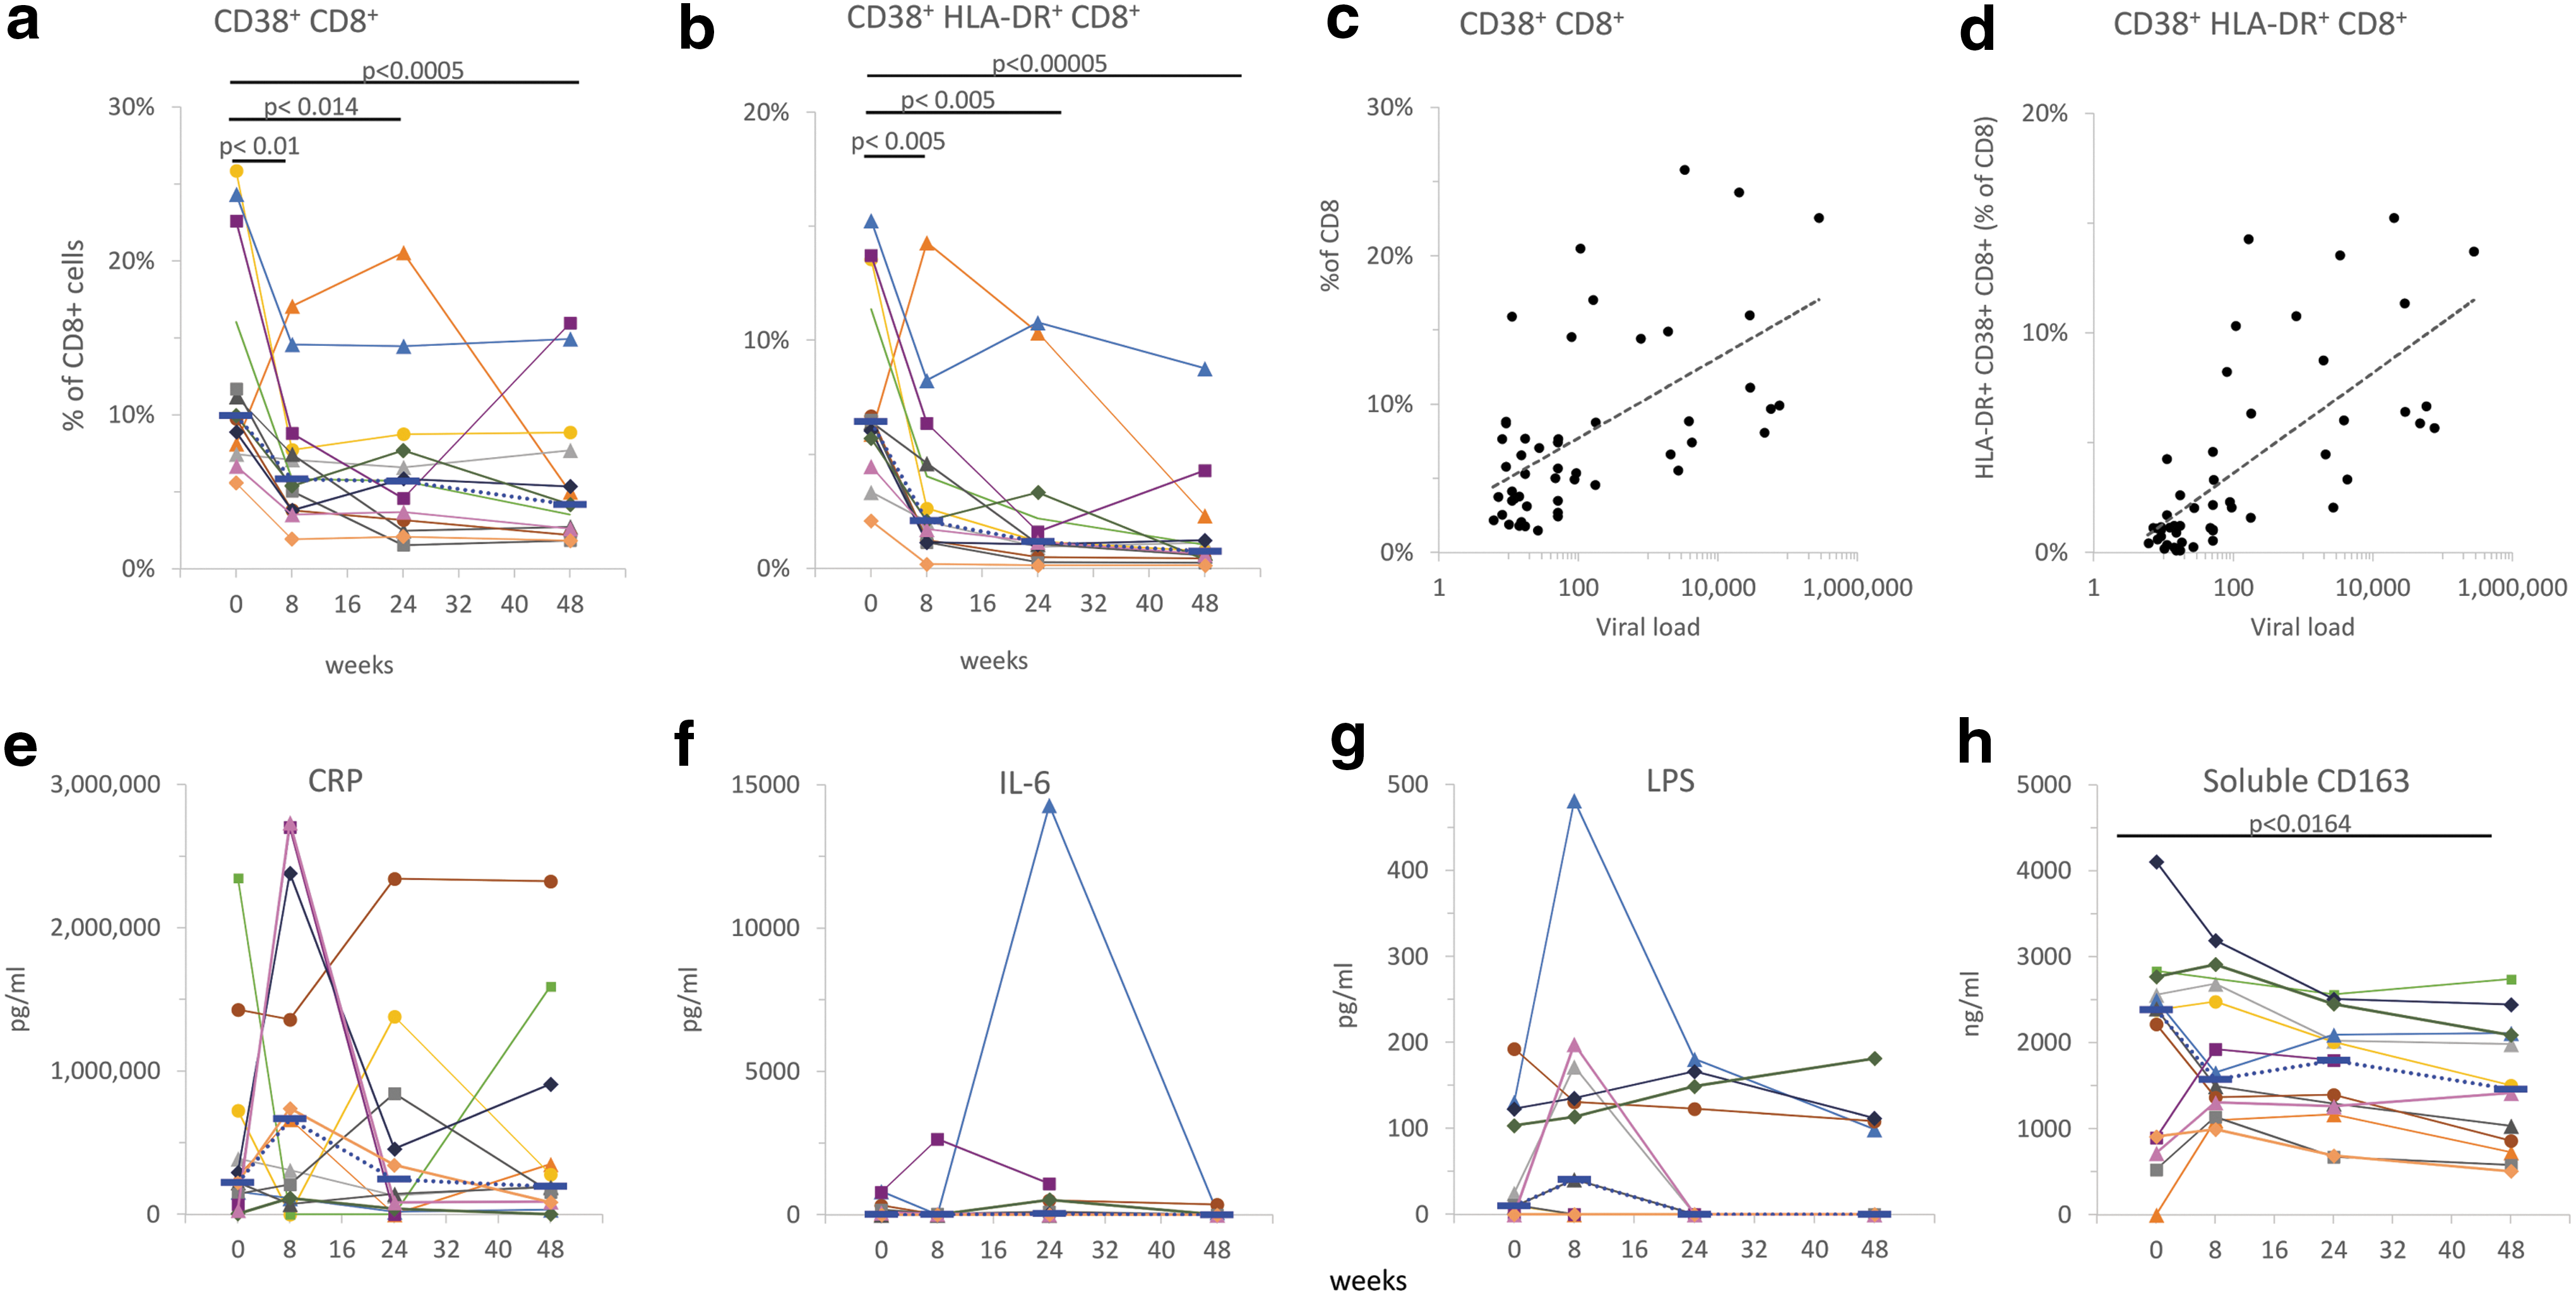
Markers of immune activation on CD8 T cells and inflammation markers in plasma. After the initiation of cART, the percentages of CD8+-T cells positive for CD38 or dual positive for HLA-DR and CD38 significantly decreased at 8 weeks and remained lower than at the beginning of the study (
No significant differences were found between percentages of B cells, monocytes, NK cells, or total T cells measured at entry as compared with the other time points in the study (data not shown).
We measured concentrations of CRP, LPS, IL-6, and soluble CD163 in cryopreserved plasma samples from the same study participants (Fig. 5e–h). No significant differences were detected between the levels of CRP, LPS, and IL6. Mean plasma concentrations of sCD163 significantly decreased from 2.1 μg/mL at entry to 1.5 μg/mL at week 48 (p < .0164; Fig. 5h).
Discussion
Intensification of cART regimen with raltegravir in children and adolescents failing a therapeutic regimen effectively decreased viral loads and increased the percentage of CD4+ cells. We demonstrated that effective antiviral therapy is associated with a decrease in PD-1 expression on CD8+ but not CD4+ cells, an increase in percentage of CD8+ Tscm, and a decrease in markers of immune activation (CD38 and HLA-DR). This is the first report of the effect of antiviral therapy on PD-1 expression by lymphocytes in children and adolescents. By markedly reducing HIV replication, cART eventually triggers an often slow and incomplete recovery of the immune system toward normality. 26 In adults, effective cART leads to a significant decline in viremia and an increase in percentages of CD4 T cells within 1 month from the beginning of therapy, mainly due to increased percentages of central memory CD4+ T cells. 27 –29 After several months of treatment, naïve CD4+ lymphocytes also increase whereas CD8+ T cells decline.
Unlike adults, children respond with a preferential expansion of the naïve T cell pool after initiating successful cART, probably due to the presence of a functioning thymus. 30 HIV infection may not uniformly result in accelerated thymic involution in childhood, but studies based on the assessment of T cell receptor rearrangement excision circles demonstrated that thymopoiesis can occur in adolescents who are perinatally infected, despite lifelong infection. 31 The percentage of CD4+ cells recently emigrated from thymus predicts disease progression and may reflect history of disease in HIV-positive adults and adolescents. 32 Many individuals after up to two decades of infection controlled with antiretroviral therapy have sufficient thymic reserve to compensate for CD4 T-cell loss. 33 Inter-individual responses to cART vary considerably 34 and HIV-specific CD4+ T cell responses are rarely recovered, 35 with normalization of the CD4+/CD8+ T cell ratio occurring in only a minority of cases. 36
Viral loads as well as percentages and absolute counts of CD4+ and CD8+ T cells for all subjects enrolled in the P1066 have already been published (Nachman et al., 2013). 1 The selection of participants depended on the availability of at least four time points of cryopreserved PBMC samples with cell viability rates above 75%.
Consistent with previous studies and guidelines of quality assurance, 25,37,38 we found significant correlations between the percentages of CD4 and CD8 T cells measured in fresh samples versus cryopreserved samples, confirming that the cell surface markers were intact. Nevertheless, it should be noted that the CD4 and CD8 assays in fresh blood were performed in different laboratories, and inter-laboratory variability is expected for these type of assays. Furthermore, the PBMC isolation procedure may also be a source of variability.
The distribution of CD4 T cell subtypes did not change significantly. However, two of the subjects had low percentages of CD4 T cells (2% and 5%), low CD4 naïve (4.2% and 7.4% respectively), and corresponding high percentages of CD4 effector memory T cells (73.1% and 65.7%, respectively) at entry. One of these two patients had multiple infections (pneumonia, recurrent varicella, sinusitis, and oral candidiasis) and presented generalized and persistent lymphadenopathy; the other subject with low CD4 counts had oral candidiasis but no other infections. Both patients were men and showed improved immunologic status during the regimen with raltegravir. The other 11 subjects had CD4 Tn cells above 50% throughout the study. Taken together, this group of subjects did not show significant changes in CD4 T cell distribution. This finding may be the consequence of previous cART treatment and the very brief 3 weeks of interruption of cART before starting the raltegravir regimen.
Tscm CD4 cells are potential cellular targets for reducing HIV reservoirs, 39 and high levels of PD-1 expression on CD4 cells predict suboptimal CD4 T cell recovery after long-term cART. 12 The PD-1 expression on CD4 T cells subsets did not decrease over time, possibly due to the fact that the subjects were previously under cART.
We found a significant increase of CD8 Tn and Tscm CD8 T cells at 24 and 48 weeks as compared with baseline and percentages of CD8 Tem cells decreased significantly at 24 and 48 weeks, consistent with decreased immune activation induced by effective cART therapy.
The frequency of CD8 Tscm has been reported to decrease in all individuals with chronic, untreated HIV-1 infection. cART has a restorative effect on this subset, and high levels of circulating Tscm cells are associated with improved prognosis in chronic HIV-1 infection. 40 Our data provide further evidence that CD8 Tscm cells increase with cART, and this finding may be used as an indicator of effective cART therapy.
PD-1 has been investigated for its possible roles in HIV pathogenesis. 41 Cryopreservation has an impact on the level of expression of PD-1. 15,16 However, due to a limited availability of fresh human PBMC, cryopreserved cells were used to study PD-1 expression. 13,41 In general, mean fluorescence intensity correlates with the frequency of PD-1+ cells. 13 Based on our experience of the greater effect of cryopreservation on mean fluorescence intensity of PD-1 staining, 15,16 we focused on measuring the percentages of PD-1-positive cells. The percentage of Tcm CD4 cells that expressed PD-1 was higher at 24 weeks than at baseline, but this change did not persist at 48 weeks. An increase of Tscm CD4 cells that expressed PD-1 was detected for the Tscm cells at 24 weeks, but the differences were not significant at 8 or 48 weeks.
Effective cART along with immune restoration is associated with a decrease in PD-1 expression by CD4 T cells. 42,43 We detected a moderate increase in the percentage of PD-1 expressing CD4-positive T cells during the first 2 months of cART therapy in an adult cohort. 44 The transient increase in PD-1 levels may be due to incomplete viral suppression, leading to continued exposure of the immune system to low levels of viral antigens or/and to early T cell reconstitution from a lymphoid tissue where PD-1 expression may be higher. 43
The most important changes in PD-1 expression were detected for the CD8 T cells. Percentages of total PD-1-positive cells were lower than at baseline, due mainly to decreased percentages of Tcm and Tem cells. Tcm displayed significantly lower levels of PD-1 expression at 48 weeks only, whereas Tem showed a significant decrease at both 24 and 48 weeks. Breton et al. 41 showed higher expression levels for PD-1 measured as mean fluorescence intensity on all T cell subsets in chronic HIV-infected subjects without treatment versus subjects on cART. We found a decrease of PD-1 expression (measured as percentage of total PD-1-positive cells) in CD8+ T cells after the initiation of cART (Fig. 4g). However, the percentages of PD-1-positive CD4 T cells did not change significantly after cART (Fig. 4a–f). The percentages of activated CD8 T cells that express CD38 and/or HLA-DR were the most rapid changes that signaled effective therapy (Fig. 5a, b).
We also measured the percentages of NK cells, B cells, and monocyte subsets but we did not find significant changes over time. Although we anticipated to find decreased percentages in CD16+CD14low non-conventional monocytes after the initiation of effective cART, we did not observe such a decrease, possibly due to small sample size.
An increase in the plasma levels of proinflammatory markers is associated with HIV infection, whereas the suppression of HIV replication with antiviral therapy leads to at least partial resolution of chronic inflammation. 45 –49 Among plasma levels of several proinflammatory markers measured, CRP, IL6, sCD163, and LPS, only sCD163 was significantly decreased by week 48, consistent with other reports. 18 Lack of changes in CRP levels despite viral suppression was also previously reported. 18 Long-term cART has been associated with a decrease in plasma LPS levels in adults. 50 We observed no change in the plasma LPS level in this study of children. These may be due to patient age and study duration.
Our data indicate that raltegravir improves immune status, consistent with effective antiretroviral therapy. Decreased expression of PD-1, CD38, and HLA-DR on CD8+ T-cells, an increase in CD8 Tscm cells, and decreased levels of sCD163 are markers of immune restoration in response to cART with raltegravir intensification.
Footnotes
Acknowledgments
This work was supported by U.S. National Institutes of Health (NIH) grants P01 MH105303 (to SDD), R21 AI 108296 (to SDD), Penn Mental Health AIDS Research Center (P30 MH097488), and Penn Center for AIDS Research (P30 AI045008).
Overall support for the IMPAACT Group was provided by the National Institute of Allergy and Infectious Diseases (NIAID) of the NIH under award numbers UM1AI068632 (IMPAACT LOC), UM1AI068616 (IMPAACT SDMC), and UM1AI106716 (IMPAACT LC), with co-funding from the Eunice Kennedy Shriver National Institute of Child Health and Human Development (NICHD) and the National Institute of Mental Health (NIMH). The content is solely the responsibility of the authors and does not necessarily represent the official views of the NIH.
Members of the P1066 Protocol Team include: Nan Zheng MA, Terence Fenton, Ed D, and Carmelito Alvero, MS, Statistical and Data Analysis Center, Harvard School Public Health, Boston, MA; Edward Acosta, Pharm D, University of Alabama at Birmingham, Birmingham, AL; Hedy Teppler, MD, Brenda Homony, MS, Xia Xu, PhD, Larissa Wenning, PhD, Matthew Rizk, PhD, Merck&Co.,West Point, PA; Carrie Fry, BS and Bobbie Graham, BS, Frontier Science and Technology Research Foundation, Amherst, NY; Stephen A. Spector, MD, University of California, San Diego and Rady Children's Hospital San Diego, La Jolla, CA; Lisa M. Frenkel, MD, University of Washington Children's Hospital, Seattle, WA; Carol Worrell, MD, Pediatric Adolescent and Maternal AIDS Branch, Eunice Kennedy Shriver National Institute of Child Health and Development, Bethesda, MD; Ed Handelsman, MD, Paul Sato, MD, Division of AIDS, National Institute of Allergy and Infectious Diseases, Bethesda, MD.
Author Disclosure Statement
No competing financial interests exist.