




Abstract
Objectives:
Estimating HIV incidence is critical for identifying groups at risk for HIV infection, planning and targeting interventions, and evaluating these interventions over time. The use of reliable estimation methods for HIV incidence is thus of high importance. The aim of this study was to compare methods for estimating HIV incidence in a population-based cross-sectional survey.
Design/Methods:
The incidence estimation methods evaluated included assay-derived methods, a testing history-derived method, and a probability-based method applied to data from the Ndhiwa HIV Impact in Population Survey (NHIPS). Incidence rates by sex and age and cumulative incidence as a function of age were presented.
Results:
HIV incidence ranged from 1.38 [95% confidence interval (CI) 0.67–2.09] to 3.30 [95% CI 2.78–3.82] per 100 person-years overall; 0.59 [95% CI 0.00–1.34] to 2.89 [95% CI 0.86–6.45] in men; and 1.62 [95% CI 0.16–6.04] to 4.03 [95% CI 3.30–4.77] per 100 person-years in women. Women had higher incidence rates than men for all methods. Incidence rates were highest among women aged 15–24 and 25–34 years and highest among men aged 25–34 years.
Conclusion:
Comparison of different methods showed variations in incidence estimates, but they were in agreement to identify most-at-risk groups. The use and comparison of several distinct approaches for estimating incidence are important to provide the best-supported estimate of HIV incidence in the population.
Introduction
R
While estimating HIV prevalence in a population is relatively simple, the estimation of HIV incidence is less straightforward. The gold standard in estimating HIV incidence is through a prospective cohort study. This method has limitations, including high costs, complex study designs, and participation biases. 2,3
Alternative methods for estimating population-based HIV incidence have also been used. These include assay-based approaches, including testing for acute infection among HIV-seronegative samples and identifying recent infection among HIV-seropositive samples using a recent infection testing algorithm (RITA), 4 –10 back-calculation of AIDS or HIV diagnoses based on HIV surveillance data, 11 –13 and inferring HIV incidence from changes in HIV prevalence in repeated cross-sectional surveys. 14 –18
Given the limitations of all methods for estimating HIV incidence, incidence estimates generated from various methods in the same population should be synthesized to provide the best-supported estimate of HIV incidence in the population of interest. 19 The aim of this study was to compare methods for estimating the HIV incidence in a high HIV prevalence population in the subcounty of Ndhiwa in western Kenya, where HIV prevalence rates averaged at 24% in 2012. 20
Materials and Methods
The Ndhiwa HIV Impact in Population Survey
The 2012 Ndhiwa HIV Impact in Population Survey (NHIPS) was a two-stage cluster sample household survey conducted in the subcounty of Ndhiwa (Nyanza Province, Kenya) between September and November 2012. 20 –22 All residents aged 15–59 years were considered eligible and, after being informed about the study, invited to participate and consent to the survey.
Household questionnaires collected sociodemographic information from household members and individual questionnaires collected sociodemographic, behavioral, and medical information from participants. Blood specimens were collected to test for HIV antibodies and, if HIV positive, CD4 cell count and HIV RNA concentration. Participants were tested for HIV in the home using a serial rapid testing algorithm based on Kenyan national guidelines, 23 using Determine Rapid HIV1/2 antibody (Abbott Laboratories, Abbott Park, IL), followed by Unigold Rapid HIV test (Trinity Biotech Plc, Bray, Ireland). Participants with discordant or equivocal results on rapid testing were retested using an enzyme immunosorbent assay (EIA) to determine the final HIV serostatus.
The PIMA CD4 analyzer (Alere, PIMA, Jena, Germany) was applied to HIV-positive samples to determine CD4 cell count. The COBAS AmpliPrep/COBAS TaqMan platform (Roche Diagnostic System Branchburg, NL) was conducted to determine HIV RNA concentration among HIV-positive samples. Samples with HIV RNA concentration <300 copies/ml, the minimum concentration detectable on the assay, were considered to be virally suppressed.
Compared approaches for estimating incidence
Assay-derived incidence
Presence of HIV RNA in HIV-seronegative individuals (acute infection)
Specimens from participants who were found to be HIV seronegative by the serial rapid HIV testing algorithm were tested for HIV RNA using nucleic acid amplification testing (NAAT; COBAS AmpliPrep/COBAS TaqMan platform; Roche Diagnostic System Branchburg, NL) for detection of acute infection. For the purposes of this analysis, the mean duration of recent infection (MDRI) for RNA positivity was 28 days.
24
Since the MDRI could be shorter for HIV RNA, we also performed a sensitivity analysis using an MDRI of 14 days.
25,26
The RNA-based incidence rate during this time period, denoted by IRRNA
, was estimated using the following formula:
where A was the number of individuals found in acute infection by the test, ωRNA the MDRI of the HIV RNA test, and nseronegative the number of individuals found to be HIV seronegative by the serial rapid HIV testing algorithm (i.e., including those found in acute infection). The denominator was the sum of person-time at risk for infection: (i) seronegative individuals who did not have acute infection were assumed to be at risk of infection during the MDRI period; (ii) seronegative individuals with acute infection were assumed to be at risk of infection during half the MDRI. Ninety-five percent Poisson confidence intervals (CIs) for RNA-derived incidence were calculated.
Recent infection in HIV-seropositive individuals: BioRad and LAg tests
Specimens from participants who were found to be HIV positive by rapid HIV testing were tested for recent infection using two tests for recent infection (TRIs): the BioRad avidity assay (modified Genetic Systems™ HIV-1/HIV-2 PLUS O; BioRad, Redmond, WA) and the limiting antigen avidity enzyme immunosorbent assay (LAg) (Sedia Biosciences Corp., Portland, OR).
The avidity index cutoff to distinguish recent from long-standing infection on BioRad was 30. The normalized optical density (OD-n) cutoff value to distinguish recent from long-standing infection on LAg was 1.5. We applied summary MDRIs for LAg and BioRad based on results from the Consortium for the Evaluation and Performance of HIV Incidence Assays (CEPHIA), where the composite MDRI across clade A, B, C, and D infections was 248 days (95% CI 221–277) for BioRad and 141 days (95% CI 123–160) for LAg. 27 To minimize TRI misclassification, 19 the following RITA was used: HIV-seropositive individuals who reported that they had initiated ART or with an HIV RNA <300 copies/ml were presumed to have been infected for at least 1 year and were reclassified as having a long-standing infection.
A residual proportion of false recent (PFR) of 2.4% (coefficient of variation CoV = 20%) for BioRad-based RITA and 0.5% (CoV = 50%) for LAg-based RITA, based on data collected from the surveyed population, was included in the calculation for TRI-based incidence. 28 For comparison purposes, we also estimated TRI-based incidence assuming that the residual PFR for the RITA was 0% for both assays. Moreover, because growing evidence suggests that MDRI values vary by subtype and clade A and D infections dominate in western Kenya, 29,30 we also estimated incidence using CEPHIA MDRI values for subtype A and D infections for LAg (i.e., 211 days for subtype A and 273 days for subtype D) and BioRad (i.e., 364 days for subtype A and 467 days for subtype D based on an avidity index cutoff of 40). 29
Assay-derived incidence rate (IRTRI
) was estimated using the following formula:
where
We also computed HIV incidence based on samples found in acute infection and those found in recent infection (separately for BioRad and LAg-based RITA) based on the following formula (using previous notations):
In the calculation, the MDRI of each TRI-based RITA (ωTRI ) was increased by the duration of acute infection (ωRNA ) while the PFR of each TRI-based RITA was used.
Testing history-derived incidence
Given the HIV status, the self-reported ART status, and the CD4 cell count at the time of the survey, we derived individuals' status during the past year from the individuals' histories (self-reported dates of first positive HIV test, last HIV test and its result, and ART initiation) and CD4 measurement. 31 We used only the previous year to minimize the recall bias and avoid making too strong assumptions about individuals' histories.
More precisely, HIV-negative individuals at the date of the survey were considered as previously HIV negative. Depending on the date of the first positive HIV test and/or the result of the last HIV test, untreated HIV-positive individuals with CD4 cell counts >350 cells/mm3 were considered to have been already HIV positive (positive test result) or HIV negative (negative test result) 1 year before the survey.
Logical or probabilistic rules were applied when the retrospective information was incomplete or lacking (6.3% and 1.2% of all cases, respectively). The logical rules consisted in the following assumptions: (i) HIV-positive individuals under a treatment initiated within the previous year were considered to have been already HIV positive 1 year preceding the survey; (ii) untreated HIV-positive individuals with low CD4 cell counts were considered to have been already HIV positive 1 year preceding the survey; (iii) untreated HIV-positive individuals with high CD4 cell counts, but no information about previous testing, were considered to have been HIV positive at least 1 month preceding the survey.
Individuals who were classified as HIV negative 1 year before the survey and tested HIV positive at the time of the study were considered HIV seroconverters. The incidence rate, IRTH
, was estimated using the following formula:
The numerator was the number of individuals who reported testing HIV negative during the year preceding the survey and tested HIV positive at the time of the survey. The denominator was the sum of person-time at risk for infection. Seronegative individuals (nseronegative
) were assumed to be at risk of infection during 1 year. Individuals who reported testing HIV negative at a time
Probability-based incidence
A probability-based method for estimating incidence based on a single survey was applied to sex- and age-stratified HIV seroprevalence data from NHIPS using a method previously described by Misiri et al. 17
Suppose that two cross-sectional surveys of HIV prevalence were performed in years t and t + 1. The probability of an individual to be infected and alive at age a + 1 in t + 1 depended on the probability of the individual to be infected and alive at age a in t, the probability of the individual to be still alive in t + 1, and the probability of acquiring HIV infection. Assuming constant HIV prevalence in each age group during t and t + 1, the age-specific prevalence from a single survey can be used to estimate the HIV incidence according to the following equation (for more details, see the Supplementary Data; Supplementary Data are available online at
where πa was the predicted prevalence at age a, p(a) was the observed prevalence at age a, μI,a the mortality rate for HIV-positive individuals aged a, μS,a the mortality rate for HIV-negative individuals aged a, and λa was the incidence rate. We used the mortality rates that we had previously estimated. 31
The parameter of interest, λa
, was modeled using four assumptions: a 44-parameter function (one for each age from 15 to 59 years), a 3-parameter step function (one for each age category: 15–24, 25–34, and 35–59 years), a 9-parameter step function (one for each 5-year age class), and the log-normal function. We used maximum likelihood estimates, assuming that the number of seropositive individuals of age a (
where Na was the number of individuals aged a. Comparisons of predicted estimates by this modeling and observed prevalence are provided in Supplementary Figure S1.
The confidence intervals for probability-based HIV incidence were calculated using sex- and age-stratified bootstrap by simulating 500 samples.
A sensitivity analysis assuming 25% and 50% increased age-specific HIV-related mortality rates was performed to study the effect on incidence estimates.
Outcomes
For each incidence estimation method, we present overall incidence, incidence stratified by sex and age, and cumulative incidence as a function of age (Supplementary Data).
Ethics
This study received approval from the Kenya Medical Research Institute ethics review committee and from the National Center for HIV, Hepatitis, and Sexually Transmitted Diseases at the US Centers for Disease Control and Prevention.
Results
Of a total of 3,330 households selected, 6,833 household members were eligible for the study and 6,076 (89%), including 2,321 men and 3,755 women, agreed to participate and were tested for HIV infection (Fig. 1). Of this group, 4,630 (76%) tested HIV seronegative and 1,446 (24%) tested HIV seropositive.
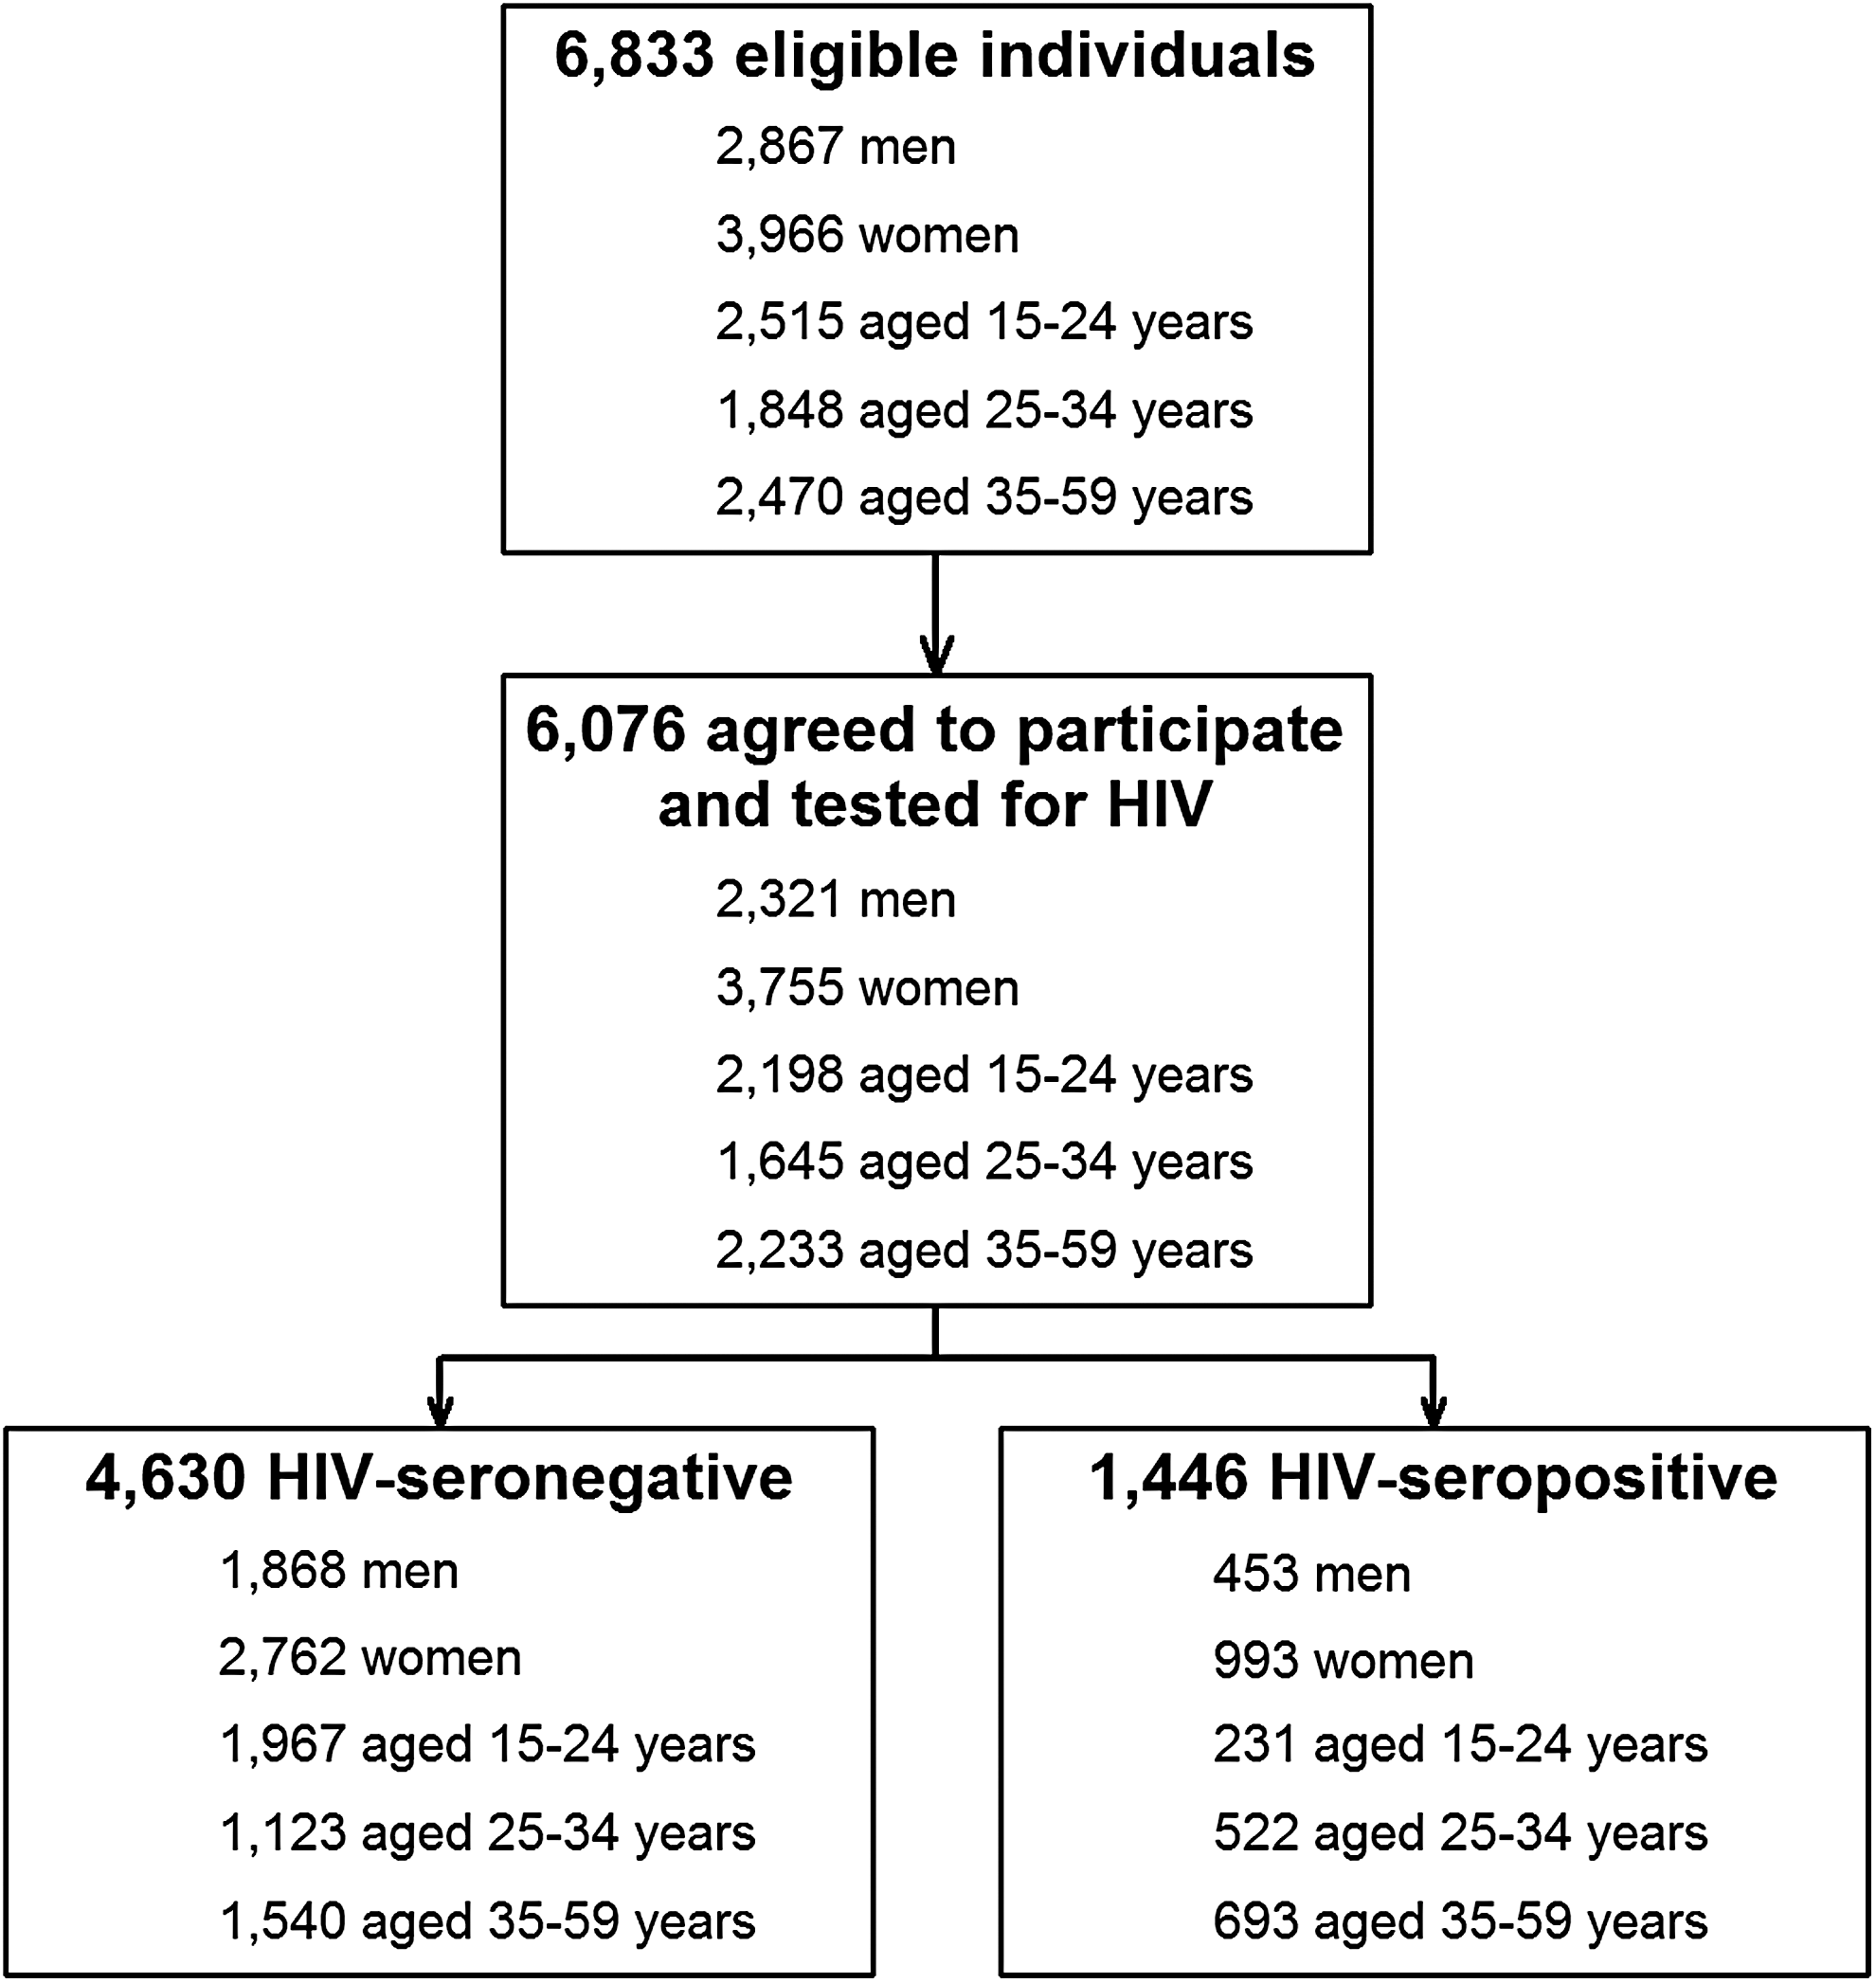
Study flowchart.
A total of 1,346 (93%) of 1,446 HIV-seropositive specimens were tested by both LAg and BioRad; 31 were classified as recent by the LAg-based RITA and 72 were classified as recent by the BioRad-based RITA (Table 1). Among seronegatives, 4,442 (96%) were available to be tested for acute infection (RNA-based method) and, of those, 11 (0.2%) were classified as acute cases (Table 1). Among HIV-seropositive individuals, 157 (11%) reported testing HIV negative during the year preceding the survey (Table 1).
RNA-positive samples among HIV-seronegative ones.
HIV-seropositive individuals reporting testing HIV negative during the year preceding the survey.
RITA, recent infection testing algorithm.
Overall HIV incidence by estimation method
HIV incidence estimate per 100 person-years (PY) was 1.38 [95% CI 0.67–2.09] using BioRad-based RITA and 1.46 [95% CI 0.71–2.22] using LAg-based RITA. Using the RNA-derived method with an MDRI of 28 days, HIV incidence was higher at 3.23 [95% CI 1.61–5.30]. Using an MDRI of 14 days for RNA, HIV incidence doubled at 6.46 [95% CI 3.20–10.56] per 100 PY. However, when the RNA-derived method (acute infections) was combined with the RITA-derived method, HIV incidence was lower at 1.78 [95% CI 1.04–2.52] using the combination of RNA and LAg-based RITA and 1.59 [95% CI 0.89–2.28] using the combination of RNA and BioRad-based RITA. For the probability-based method, HIV incidence was low in level, ranging from 1.60 [95% CI 0.81–2.69] to 1.65 [95% CI 0.92–2.47]. However, for the testing history-derived method, HIV incidence was higher at 3.30 [95% CI 2.78–3.82].
Sex- and age-specific HIV incidence by estimation method
Figure 2 shows sex-specific HIV incidence estimates by estimation method. In men, HIV incidence per 100 PY ranged from a low of 0.59 [95% CI 0.00–1.34] using LAg-based RITA to a high of 2.89 [95% CI 0.86–6.45] using the RNA-derived method. In women, HIV incidence per 100 PY ranged from a low of 1.62 [95% CI 0.16–6.04] using the probability-based method to a high of 4.03 [95% CI 3.30–4.77] using the testing history-derived method. Using an MDRI of 14 days for RNA, HIV incidence was 5.79 [95% CI 1.71–12.80] in men and 6.93 [95% CI 2.82–12.67] in women per 100 PY.

Incidence estimates among men and women by estimation method. RNA + LAg: combination of RNA (acute infections) and LAg-based RITA. RNA+BioRad: combination of RNA (acute infections) and BioRad-based RITA. Sample sizes: see Table 1. RITA, recent infection testing algorithm.
Figure 3 shows HIV incidence stratified by sex and age group by incidence estimation method. Among men aged 15–24 years, HIV incidence ranged from a low of 0.25 [95% CI 0.00–0.73] per 100 PY using BioRad-based RITA to a high of 1.16 [95% CI 0.67–1.83] per 100 PY using the probability-based method. Among men aged 25–34 years, HIV incidence ranged from 0.96 [95% CI 0.00–2.79] per 100 PY using LAg-based RITA and a high of 4.10 [95% CI 2.21–6.00] per 100 PY using the testing history-derived method. Among men aged 35–59 years, HIV incidence ranged from 0.68 [95% CI 0.00–2.41] per 100 PY using the BioRad-based RITA to 2.72 [95% CI 1.39–4.06] per 100 PY using the testing history-derived method.
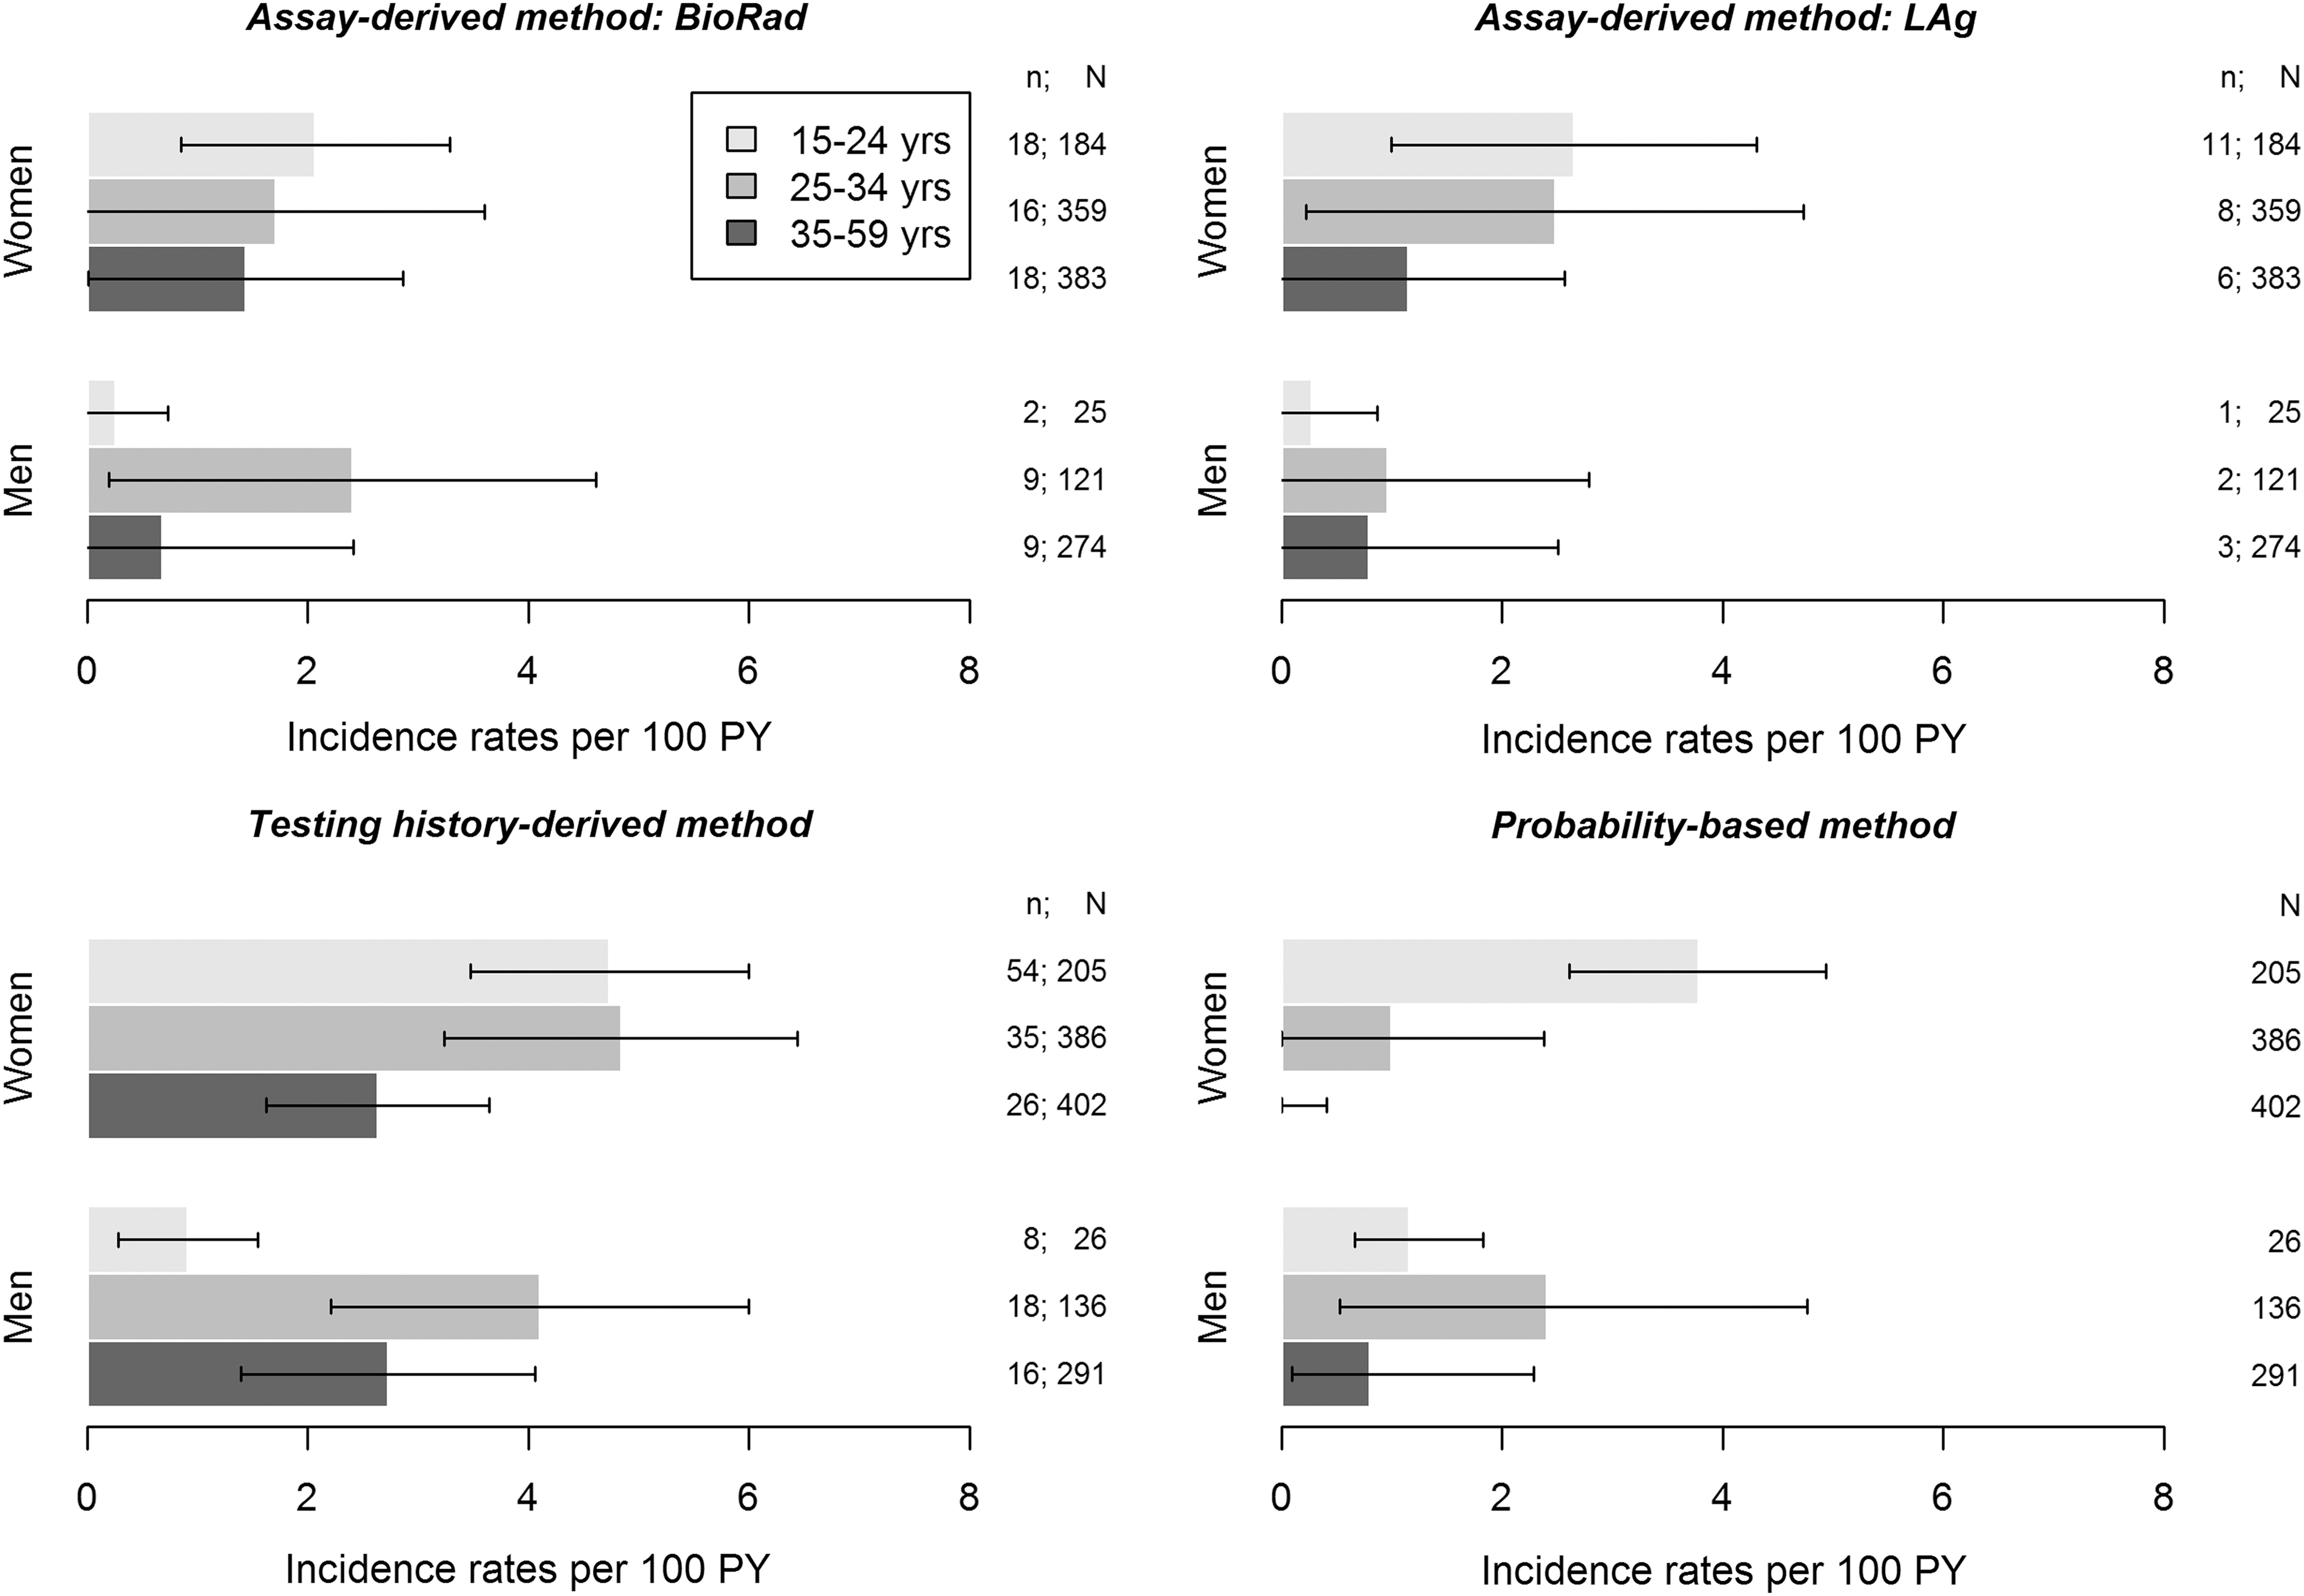
Incidence rate estimates by age group in men and in women by estimation method. The modeling of the infection rate in the probability-based method was a 9-parameter step function. n: number of individuals classified as recent or incident cases; N: number of HIV-positive individuals tested on BioRad or LAg or number of HIV-positive individuals.
In women aged 15–24 years, HIV incidence ranged from a low of 2.07 [95% CI 0.85–3.29] per 100 PY using the BioRad-based method to a high of 4.74 [95% CI 3.47–6.00] per 100 PY using the testing history-derived method. Among women aged 25–34 years, HIV incidence ranged from 0.99 [95% CI 0.00–2.37] per 100 PY using the probability-based method to 4.84 [95% CI 3.24–6.44] per 100 PY using the testing history-derived method, and among women aged 35–59 years, HIV incidence was 0% using the probability-based method to 2.63 [95% CI 1.62–3.64] per 100 PY using the testing history-derived method. We did not stratify incidence estimates by sex and age group for RNA-derived incidence due to small sample size.
Cumulative HIV incidence by estimation method
Figure 4 shows the cumulative incidence as a function of age by incidence estimation method. In men, the cumulative incidence from those aged 15–30 years ranged from 0.148 [95% CI 0.055–0.366] using LAg-based RITA to 0.345 [95% CI 0.093–0.841] using the RNA-derived method, and the cumulative incidence from those aged 15–50 years ranged from 0.415 [95% CI 0.147–0.633] for the probability-based method to 0.739 [95% CI 0.350–0.985] using the RNA-derived method. In women, the cumulative incidence from those aged 15–30 years ranged from 0.260 [0.179–0.370] using BioRad-based RITA to 0.659 [0.402–0.894] using the RNA-derived method, and the cumulative incidence from those aged 15–50 years ranged from 0.374 [0.232–0.555] using the probability-based method to 0.761 [0.688–0.829] using the testing history-derived method.
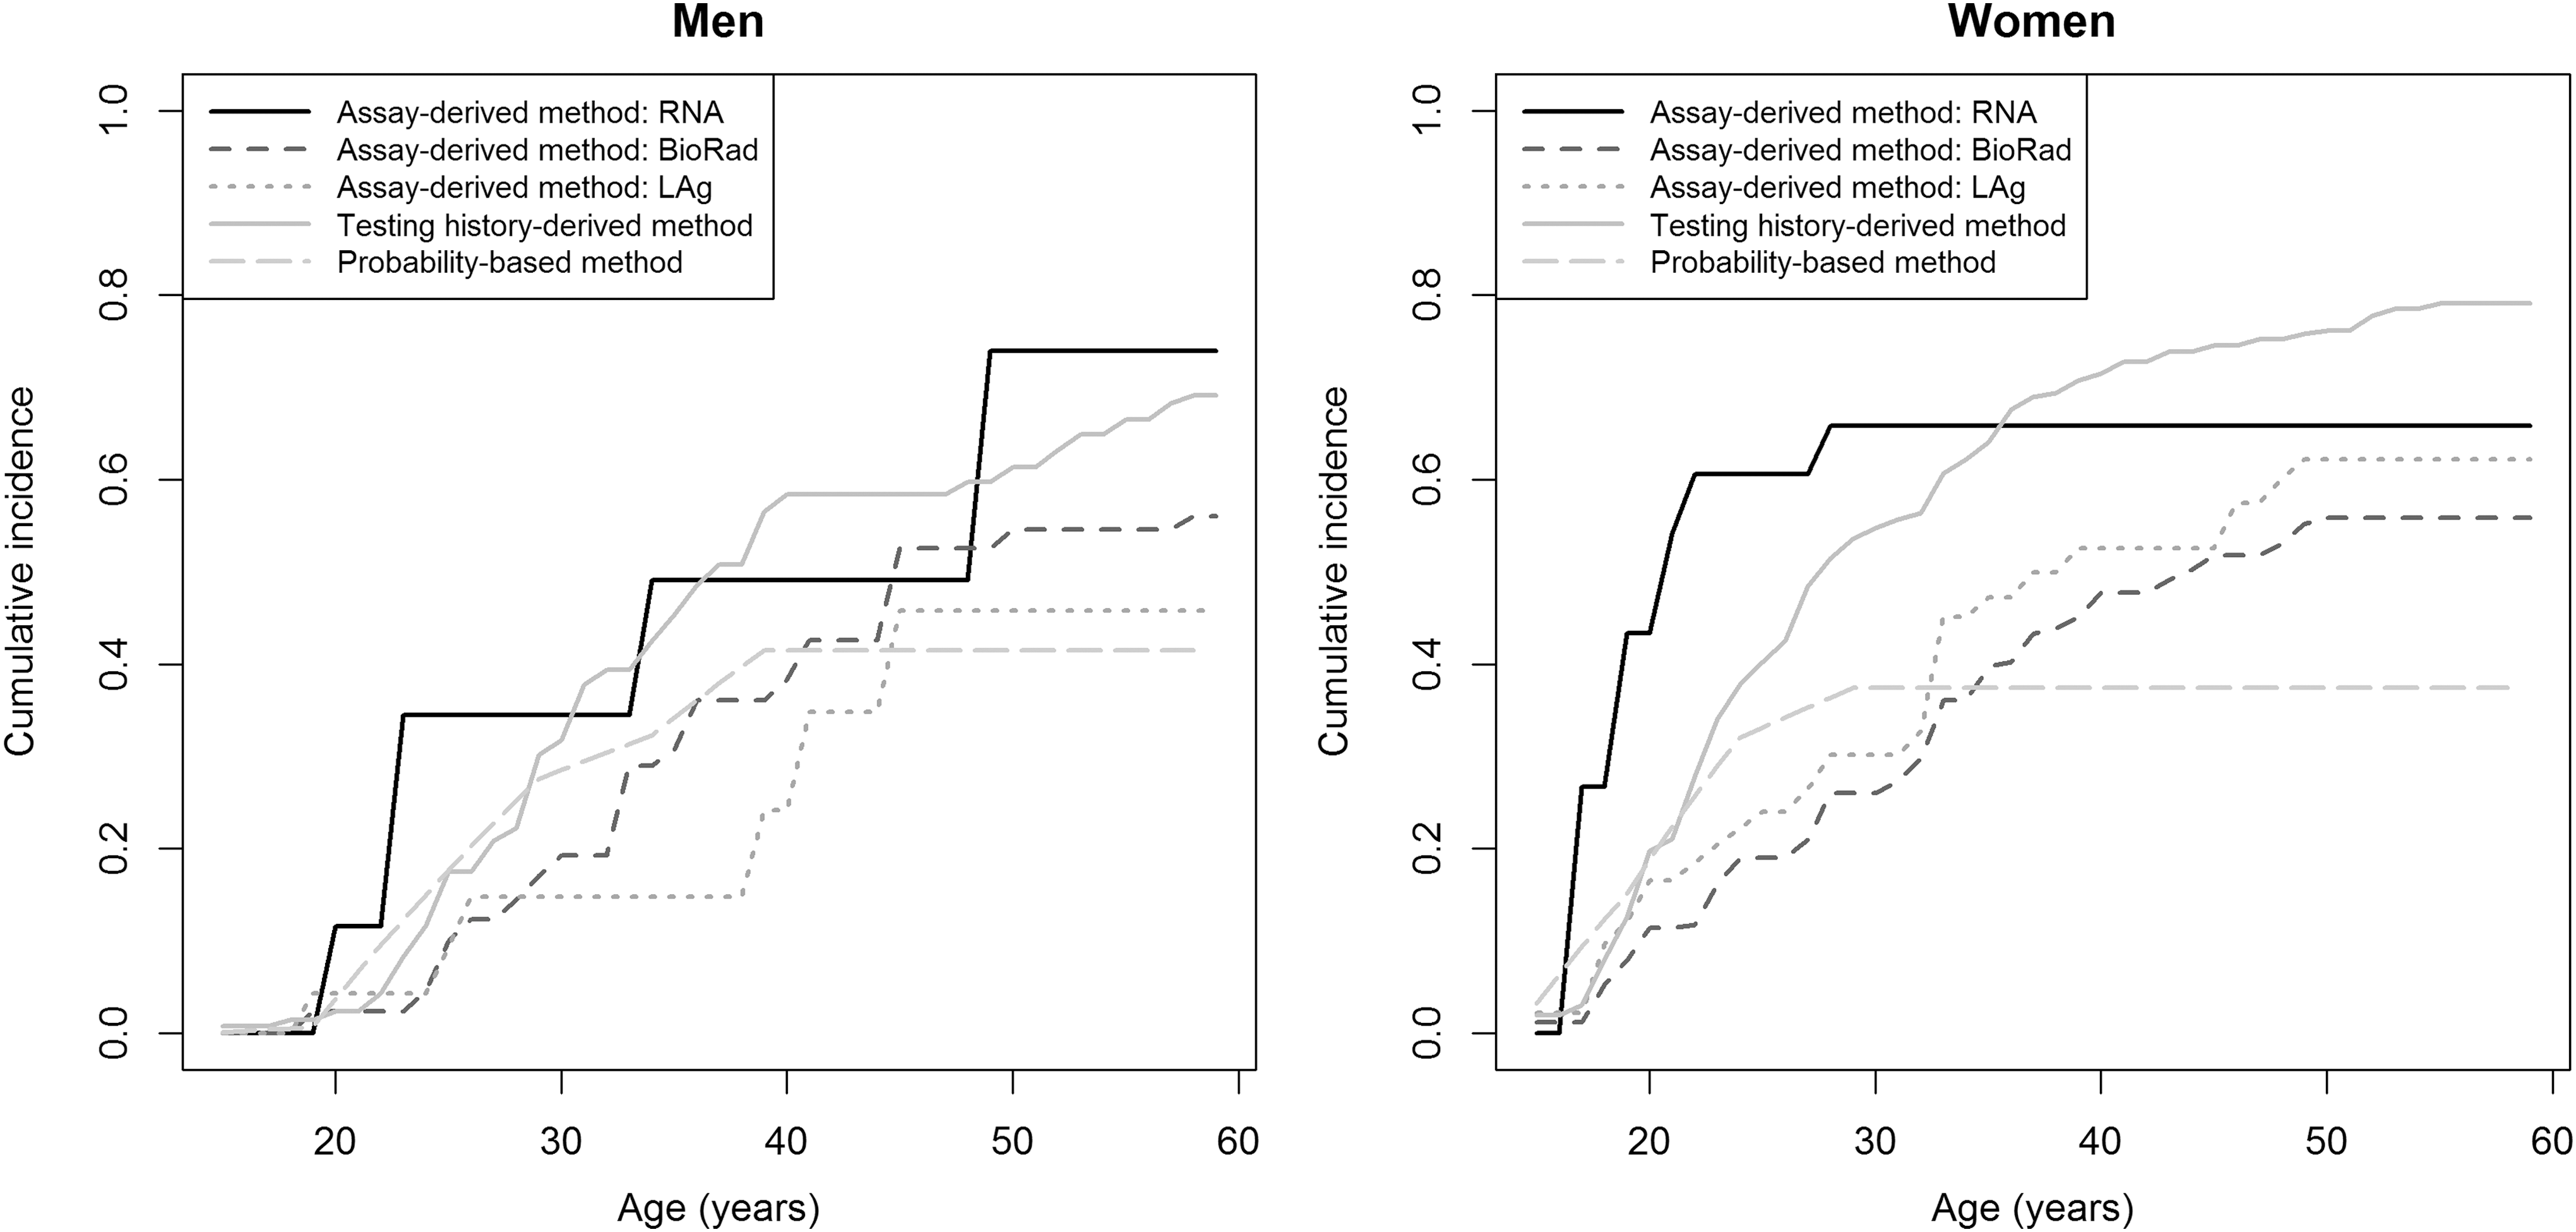
Cumulative incidence as a function of age in men and in women by estimation method. The modeling of the infection rate in the probability-based method was a 9-parameter step function.
Comparing the cumulative incidences as a function of age between methods showed that in men, the methods provided similar increases, although the LAg-based RITA estimates were lower than the estimates from the other methods. In women, the cumulative incidence started at a higher level than in men. Between those aged 15 and 30 years, estimates from the BioRad-based RITA, LAg-based RITA, and probability-based method had similar increases, while testing history-derived and RNA-derived estimates increased sharply. Over the age of 30 years, probability-based estimates remained stable. Between those aged 30 and 50 years, the estimates from the other methods continued to increase, but stabilized thereafter.
Impact of false-recent cases on RITA-based incidence estimates
Table 2 compares the estimates of BioRad and LAg with and without adjustment for the assay's PFR. Estimates that assumed a PFR of 0% were higher than those that were adjusted using the observed PFR. In the unadjusted analysis, overall HIV incidence estimates were 2.44 [1.84–3.04] for BioRad-based RITA and 1.86 [1.20–2.51] for LAg-based RITA. Estimates were higher among women than among men: 2.94 [2.11–3.77] versus 1.69 [0.95–2.43] for BioRad-based RITA and 2.50 [1.52–3.48] versus 0.90 [0.20–1.59] for LAg-based RITA.
MDRI, mean duration of recent infection; PFR, proportion of false-recent.
In men, estimates ranged from 0.35 [0.00–0.83] in persons aged 15–24 years to 3.45 [1.27–5.63] in persons aged 25–34 years for BioRad-based RITA and from 0.31 [0.00–0.90] in persons aged 15–24 years to 1.44 [0.00–3.03] in persons aged 35–59 years for LAg-based RITA. In women, estimates ranged from 2.67 [1.46–3.88] in persons aged 15–24 years to 3.59 [1.84–5.34] in persons aged 25–34 years for BioRad-based RITA and from 1.68 [0.35–3.00] in persons aged 35–59 years to 3.18 [1.02–5.33] in persons aged 25–34 years for LAg-based RITA.
Impact of subtype-specific MDRI on RITA-based incidence estimates
Using CEPHIA MDRI values for subtype A, overall HIV incidence estimates were 0.98 [95% CI 0.40–1.55] per 100 person-years for LAg-based RITA and 0.94 [95% CI 0.43–1.45] per 100 person-years for BioRad-based RITA. Using values for subtype D, HIV incidence estimates were 0.75 [95% CI 0.27–1.24] per 100 person-years for LAg-based RITA and 0.73 [95% CI 0.34–1.13] per 100 person-years for BioRad-based RITA.
Impact of HIV-related mortality rates on probability-based incidence estimates
Estimates that assumed 25% or 50% increased mortality rates were higher than those calculated with initial mortality rates. Using a 9-parameter step function, the incidence rates varied from 1.34 with initial rates to 1.44 (resp. 1.57) per 100 PY in men and from 1.77 to 1.88 (resp. 2.00) in women assuming a 25% (resp. 50%) increase in mortality rates. Variation in mortality rates had higher effect in the older age group than in the younger: in men, the incidence rates varied from 0.80 to 1.07 (resp. 1.46) in the age group 35–59 versus from 1.16 to 1.17 (resp. 1.18) in the age group 15–24 and from 2.40 to 2.44 (resp. 2.49) in the age group 25–34; in women, the incidence rates varied from 0 to 0.07 (resp. 0.21) in the age group 35–59 and from 0.99 to 1.31 (resp. 1.52) in the age group 25–34 versus from 3.78 to 3.80 (resp. 3.83) in the age group 15–24.
Discussion
In Ndhiwa subcounty in 2012, the overall estimated incidence rate ranged from 1.38 [95% CI 0.67–2.09] per 100 person-years to 3.30 [2.78–3.82] per 100 person-years. Recent mathematically modeled estimate of HIV incidence for Homa Bay County, where Ndhiwa subcounty is located, was consistent with our estimates. This recent analysis estimated HIV incidence to be 2.98% in 2013. 32 –34 This level of HIV incidence is very high, approximately seven times the national average, at 0.44%. 32
Irrespective of estimation method evaluated, women had higher HIV incidence compared with men. The highest infection rates were seen in women in younger age groups, including those aged 15–24 years and aged 25–34 years, whereas the highest infection rates were seen in men aged 25–34 years. These results are consistent with those of other studies in sub-Saharan Africa that reported that women acquire the virus at younger ages than men. 32,35 –37 Programs designed to reduce risk, especially among young women, are therefore essential to prevent new infections in the population.
Estimating incidence using assay-derived approaches, including RNA and RITA-based methods, was feasible and resulted in estimates of HIV incidence that were comparable with incidence derived from other methods. We improved the accuracy of the RITA-based method by including viral load and self-reported ART use to reclassify long-standing infections. Nonetheless, given the low number of recent infections observed using both RNA and RITA-based methods, uncertainty around the sex- and age-specific incidence rates was high, making it difficult to detect differences in HIV incidence across subpopulations.
Our study found that if we assumed that the PFR for the RITA was 0%, incidence estimates were plausible. However, among individuals aged 35–59 years, estimates from BioRad-based RITA were higher than those from LAg-based RITA. In a recent study of HIV incidence in South Africa, RITA-based estimates without adjustment for PFR were similar to mathematically derived estimates of HIV incidence. 38
We found that the four models we evaluated for probability-derived incidence provided similar results, but estimates were lower than other methods for estimating incidence, particularly for the oldest age group. Notably, discrepancies in HIV incidence in older age groups between probability-based incidence estimates and observed incidence estimates from closed cohort studies have been reported elsewhere. 15 The difference is likely due to a variety of factors, including the low number of infections in older persons and inaccurate assumptions on mortality rates inputted in the model, as shown in our sensitivity analysis of mortality rates. Moreover, the precision may be lower in older compared with younger age groups due to low number of individuals in old age classes.
Compared with all methods evaluated, testing history-derived incidence produced the highest levels of HIV incidence. Provided that self-reported information on previous testing history is accurate, this method can be used to identify HIV seroconversion. However, self-reported HIV serostatus collected in cross-sectional surveys is prone to underestimation due to social desirability bias 39 and can lead to higher than expected levels of presumed HIV seroconversion and HIV incidence. Memory bias (e.g., telescoping effect) could also be another bias. Indeed, an individual could report a recent event that was in reality a remote one, or vice versa. However, to correct for potential misclassification of self-reported HIV status, we used additional data on the self-reported date of the first positive HIV test from HIV-positive respondents, CD4 cell count, and self-reported ART use.
To minimize or avoid these biases, the testing history-derived method could be improved using additional data (e.g., surveillance data or medical booklet data). Recently, another approach has been proposed for estimating HIV incidence based on HIV testing history data, 40 avoiding making assumptions on individuals' status during the past year.
Results on cumulative incidence were consistent with those reported in a recent study in a rural area in KwaZulu-Natal, although the epidemics in Eastern and Southern Africa are different. Using an indirect estimation method, this study estimated that cumulative incidence by age 50 years ranged between 0.663 and 0.717 in men and between 0.713 and 0.768 in women, depending on the calendar period. 41
This analysis had the following limitations. Participants with discordant or equivocal results on rapid HIV testing were retested using an EIA for final HIV serostatus. However, there is potential that false positives were included in the sample of HIV-positive specimens that were tested by the incidence assays because of imperfect specificity of EIAs. Because HIV-seronegative cases will misclassify as recent on LAg and BioRad, this would result in an overestimate of HIV incidence. We were able to address this limitation through the quality assurance procedures for LAg testing, which required repeat HIV serology for specimens that had LAg OD-n values of less than 0.4 on the initial screening run for the assay. After repeat serology was conducted, we identified 12 false HIV-seropositive cases with LAg OD-n values of less than 0.4 that were negative on the EIA and subsequently reclassified as HIV seronegative in the final survey database.
The MDRI values used in this analysis for estimating RITA-based incidence were based on CEPHIA summary MDRI values for LAg and BioRad that combined clade A, B, C, and D infections together. However, growing evidence suggests that there is wide diversity in MDRI values by HIV-1 subtype, with markedly higher MDRI values for clade A and D infections, which dominate in western Kenya. 29,30 Had we applied CEPHIA MDRI values for subtype A and D infections for LAg and BioRad, HIV incidence would have been lower than what we reported for this analysis, ranging from 0.75 (95% CI 0.27–1.24) to 0.98 (95% CI 0.40–1.55) per 100 person-years for LAg-based RITA and 0.73 (95% CI 0.34–1.13) to 0.94 (95% CI 0.43–1.45) per 100 person-years for BioRad-based RITA.
In addition, both LAg and BioRad have been shown to have differential PFR by HIV subtype, with exceptionally high PFRs among clade D infection. 29,42 However, a strength of this analysis is that we were able to control for this bias by applying an LAg and BioRad PFR that was estimated directly from the surveyed population. 28
The MDRI for the RNA-based method ranges from 14 to 28 days due to within-individual variability of the immune response and dependence on the characteristics of tests used in detecting antibodies. Our sensitivity analysis found that application of the lower MDRI resulted in implausibly high incidence. Additionally, a standardized coefficient of variation for the MDRI for the RNA-based method was not available; therefore, estimates may be overly precise.
Moreover, we relied on self-reported data on HIV testing history and ART use for the testing history-derived method and RITA-based method. Additional collection of data during surveys (e.g., medical booklet data or antiretroviral drug presence test) could improve these methods. Although our sample size was robust enough to estimate overall HIV incidence levels reliably, we were not able to obtain precise estimates of HIV incidence across sex and age groups due to the rarity of recent infection. To appropriately monitor changes in HIV incidence across populations and time, repeated surveys with larger samples sizes will be needed.
Despite the limitations noted, in combination, the incidence estimation methods evaluated allowed us to determine relative differences in HIV incidence to identify subgroups at highest risk for acquiring HIV infection to inform targeted interventions. However, when evaluated separately, we found that the reliability in each of the methods was variable, with estimates ranging from conservative to rather high. This variability highlights the challenges that continue to prevail in the quest for establishing robust estimates of HIV incidence in a population with one simple method.
Given that biases for a single method will not likely change, the use of a single method over time to monitor trends in HIV incidence can still provide meaningful insight into the changing dynamics of an epidemic. However, until a single method for estimating incidence is validated to provide reliable measures of incidence to inform decision-making in countries, these data support the synthesis of various methods for estimating incidence to provide the best-supported insight around HIV incidence levels overall and across subpopulations.
Footnotes
Acknowledgments
The authors are grateful to the Ndhiwa community, the NHIPS field study team, and the study participants. They are also grateful to S. Masson, I. Nabaasa, S. Crisan, J. Ben Ferhat, and S. Balandine from Epicentre; to A. Heinzelmann, W. Hennequin, J. Coyne, and A. Munger from Médecins Sans Frontières; to J.O. Lusi, I. Masoni, J. Ocholla, and A. Nyibaye from the Kenyan Ministry of Health; and to V. Opollo and S. Omondi from the Kenya Medical Research Institute.
Funding
This study was funded by Médecins Sans Frontières. S.B. was financially supported by Agence Nationale de Recherche sur le SIDA et les hépatites virales, ANRS (France REcherche Nord & sud SIDA-HIV Hépatites: FRENSH), France. The findings and conclusions in this report are those of the authors and do not necessarily represent the official position of the U.S. Centers for Disease Control and Prevention.
Author Disclosure Statement
No competing financial interests exist.
References
Supplementary Material
Please find the following supplemental material available below.
For Open Access articles published under a Creative Commons License, all supplemental material carries the same license as the article it is associated with.
For non-Open Access articles published, all supplemental material carries a non-exclusive license, and permission requests for re-use of supplemental material or any part of supplemental material shall be sent directly to the copyright owner as specified in the copyright notice associated with the article.
