




Abstract
HIV-1 reservoirs are most often studied in peripheral blood (PB), but not all lymphocytes recirculate, particularly T follicular helper (Tfh) CD4+ T cells, as well as germinal center (GC) B cells, in lymph nodes (LNs). Ultrasound-guided fine needle biopsies (FNBs) from inguinal LNs and PB samples were obtained from 10 healthy controls (HCs) and 21 HIV-1-infected subjects [11 antiretroviral therapy (ART) naive and 10 on ART]. Tfh cells and GC B cells were enumerated by flow cytometry. HIV-1 DNA and cell-associated (CA) RNA levels in LNs and PB were quantified by real-time polymerase chain reaction. FNBs were obtained without adverse events. Tfh cells and GC B cells were highly elevated in ART-naive subjects, with a median GC B cell count >300-fold higher than HCs, but also remained higher in 4 out of the 10 subjects on ART. GC B cell counts and Tfh cell counts were highly correlated with each other, and also with activated T cells in LNs but not in blood. Levels of HIV-1 DNA and CA RNA viral burden in highly purified CD4+ T cells from FNBs were significantly elevated compared with those in CD4+ T cells from PB in the ART-naive group, but only trended toward an increase in the ART patients. FNBs enabled minimally invasive access to, and parallel measurement of residual activated T and B cells and viral burden within LNs in HIV-1-infected patients. These FNBs revealed significant GC activity that was not apparent from corresponding PB samples.
Introduction
L
HIV-1 and simian immunodeficiency virus (SIV) infections are notable for induction of hyperplastic germinal centers (GCs) in lymph nodes (LNs) and hypergammaglobulinemia. 3 T follicular helper (Tfh) cells, a CD4+ T cell subset found within lymphoid tissues, are concentrated in these GCs 4 and increased in number during HIV-1 or SIV infection, but Tfh cells also harbor very high levels of HIV-15–7 or SIV DNA, 8 respectively (reviewed in Phetsouphanh et al. 9 ). Also, there is relative exclusion of virus-specific CD8+ T cells from GCs, altogether making GCs an increasingly important site in which to study HIV-1 pathogenesis and viral reservoirs. 10,11
Antiretroviral therapy (ART) leads to a dramatic decrease in both HIV-1 plasma viremia and productively infected cells in LNs, 12 but HIV-1 DNA levels show limited reduction, even when ART is commenced during primary HIV-1 infection, although early ART has been shown to somewhat limit the size of the HIV-1 reservoir. 13 –20 Ongoing immune activation within lymphoid tissue may play a role in the maintenance of the HIV-1 reservoir, 21,22 and persistent low level reactivation of latent HIV-1 possibly contributes to this activation. Also, concentrations of antiretroviral drugs may be lower within LNs, correlating with continuing HIV-1 replication. 23 Therefore, HIV-1 reactivation, cell infection, and virion retention within lymphoid tissues all continue, to some extent, during suppressive ART.
Consequently, there is an imperative to better characterize the HIV-1 reservoir in lymphoid tissue. 24 We recently demonstrated the feasibility of using FNBs to study Tfh cells and GC B cells in peripheral LNs in a nonhuman primate model of SIV infection, 25 yielding lymphocytes representative of the total LNs. FNBs could be repeatedly and reproducibly performed on the same subject without adverse events. 25 Previous studies of viral burden using FNBs during HIV-1 infection 26 –29 were before the identification of Tfh cells and their association with GC hyperplasia.
The aim of this study was, therefore, to extend our findings in the nonhuman primate model of SIV infection to human HIV-1 infection, assessing the safety, tolerability, and utility of ultrasound-guided FNBs of inguinal LNs to isolate resident lymphocytes sufficient for simultaneous analysis of both complex T and B cell phenotypes by polychromatic flow cytometry, the quantification of HIV-1 reservoirs and transcriptional activity by real-time quantitative polymerase chain reaction (RT qPCR), and to derive pathogenic insights.
Materials and Methods
Study participants and ethics
Ten healthy controls (HCs) and 21 HIV-1-infected individuals, 10 of whom had received ART for at least 1 year (ART group) and 11 who had never received ART (ART-naive group), were recruited through St. Vincent's Hospital (Darlinghurst, Australia). Inclusion and exclusion criteria are described in Supplementary Methods (Supplementary Data are available online at
Demographic data on the HIV+ subjects are shown in Supplementary Table 1. Two subjects (patient Nos. 18 and 32) from the ART-naive group had previously been enrolled as long-term survivors in an observational long-term survivor cohort. 30
This study was approved by the St. Vincent's Hospital Human Research Ethics Committee (HREC 12/SVH/232). All participants provided written informed consent.
Ultrasound-guided FNBs
Ultrasound-guided FNBs were performed under local anesthesia and used five passes of a 25-gauge needle into a single LN in the inguinal chain. A representative ultrasound image of a superficial inguinal LN is shown in Supplementary Figure 1. A portion of the first pass was taken for cytological examination, and the remaining passes were transferred into R10 medium [RPMI1640 (Life Technologies, Grand Island, NY) supplemented with 10% fetal calf serum (Bovogen, East Keilor, Australia)]. Cells were pelleted by centrifugation at 400 × g for 7 min, then resuspended in 1 ml R10.

Absolute number of cells and CD4+ T cell to CD8+ T cell ratios in LN FNB specimens. Column bars show medians with interquartile range for absolute number of cells of:
Peripheral blood (PB) was also collected and peripheral blood mononuclear cells (PBMC) were isolated on Ficoll-paque (GE Healthcare, Uppsala, Sweden) as previously described. 17,30
Immunophenotypic analysis of FNB cells
T and B lymphocyte subsets were counted by immunophenotyping in Trucount™ tubes (BD Biosciences, San Jose, CA) according to the manufacturer's directions. Monoclonal antibodies (mAbs) used in this study, the three 10-color immunophenotyping panels of mAb to study PB, and staining and flow cytometric analysis of LN FNB cell suspensions are described in Supplementary Table 2.
CD4+ T cell purification and HIV-1 DNA/RNA quantification
CD4+ T cells were purified from the LN FNB cell suspensions, or PBMC, respectively, by cell sorting on a FACSAria II (BD Biosciences), using CD3-Pacific Blue, CD4-PE, and CD8-APC-Cy7 (BD Biosciences). Isolated cells were lysed in TRIzol® (Life Technologies) and stored at −80°C. Total DNA and RNA were extracted from lysates using the back extraction buffer modification for DNA isolation. Total HIV-1 DNA levels were quantified by qPCR. 17 Extracted RNA was treated with DNase I (Promega, Madison, WI), 31 and cell-associated (CA) HIV-1 RNA transcripts were analyzed by qPCR (details in Supplementary Methods).
Statistics
Unpaired data between groups were compared using the Mann–Whitney test and paired data were compared using the Wilcoxon matched pairs signed rank test. Correlations were analyzed by Spearman's rank correlation. All statistical tests were performed in GraphPad Prism v6 (GraphPad Software, San Diego, CA).
Results
FNB safety and tolerance
The 10 HCs included 5 males and 5 females, with a median age of 42 years. All 21 HIV+ patients studied were male Caucasians. The 10 HIV+ patients receiving ART (ART group) were fully suppressed for at least 6 months before enrollment [plasma viral load (pVL) <20 copies/ml], with a median CD4+ T cell count of 567 cells/μl. The 11 untreated HIV+ subjects (ART-naive group) had a median pVL of 15,500 copies/ml and a median CD4+ T cell count of 486 cells/μl (Supplementary Table S1). In the ART-naive group, five subjects were within 12 months of diagnosis, whereas four subjects had been diagnosed ≥9 years earlier, with pVL ≤5,000 copies/ml, suggestive of relatively slow progression.
All 31 LN FNB procedures were performed without any adverse events. Superficial LNs in the inguinal region were easily identified by ultrasound (Supplementary Fig. S1). All subjects reported minimal to no discomfort both during and after the procedure, and were able to engage in their usual daily activities immediately after.
Absolute cell counts in LN FNB specimens
There were no significant differences between patient groups in total lymphocytes recovered, with an overall median total of 1.5 × 10⁶ lymphocytes recovered for all subjects (Fig. 1A). Similarly, there were no significant differences between the patient groups in B cell counts (Fig. 1B) or T cell counts (Fig. 1C). The flow cytometry gating strategy for lymphocyte counts in LN FNB specimens is shown in Supplementary Figure S2.
Total CD4+ T cell counts from LN FNB samples were also similar among the three subject groups, with an overall median of 0.8 × 10⁶ CD4+ T cells recovered for all subjects (Fig. 1D). However, relative to the HC group, CD8+ T cell counts were increased in both the ART and ART-naive groups (Fig. 1E). As a result, the CD4:CD8 ratio was significantly lower in the ART group relative to HC and was further reduced in the ART-naive group (Fig. 1F).
The vast majority of CD45+ cells found in LN FNB samples were lymphocytes; neutrophils were virtually absent (Supplementary Figs. S2 and S3A), indicating that FNB samples were not contaminated by PB. Similarly, natural killer cells were also only seen at very low levels in LN FNB samples (Supplementary Figs. S2 and S3B).
Tfh cells and regulatory T cells in LN FNBs
Memory CD4+ T cells were first gated, then we identified PD-1highCXCR5high Tfh cells, and CD25+CD127dim regulatory T (Treg) cells within the non-Tfh memory CD4+ T cells. The flow cytometry gating strategy to identify Tfh cells and Treg cells is shown in Supplementary Figure S4A–D.
There was a higher proportion of CD4+ T cells that were Tfh cells in both the ART (median: 3.7%, interquartile range: 0.4%–8.6%) and ART-naive groups (3.3%; 2.4%–4.1%) than the HC (0.67%, 0.4%–2.7%), but only the ART-naive group difference was significant (Fig. 2A). Notably, 5 out of 10 HIV+ ART subjects had Tfh cell frequencies that were more than the highest Tfh cell frequencies in HC subjects (Fig. 2A). Similarly, absolute number of Tfh cells were increased in LN FNB samples from the two HIV+ groups compared with HC (Fig. 2B), but only the ART-naive group difference was significant. Importantly, compared with LN FNBs, PD-1highCXCR5high Tfh cells were not observed in PB (Supplementary Fig. S5A).
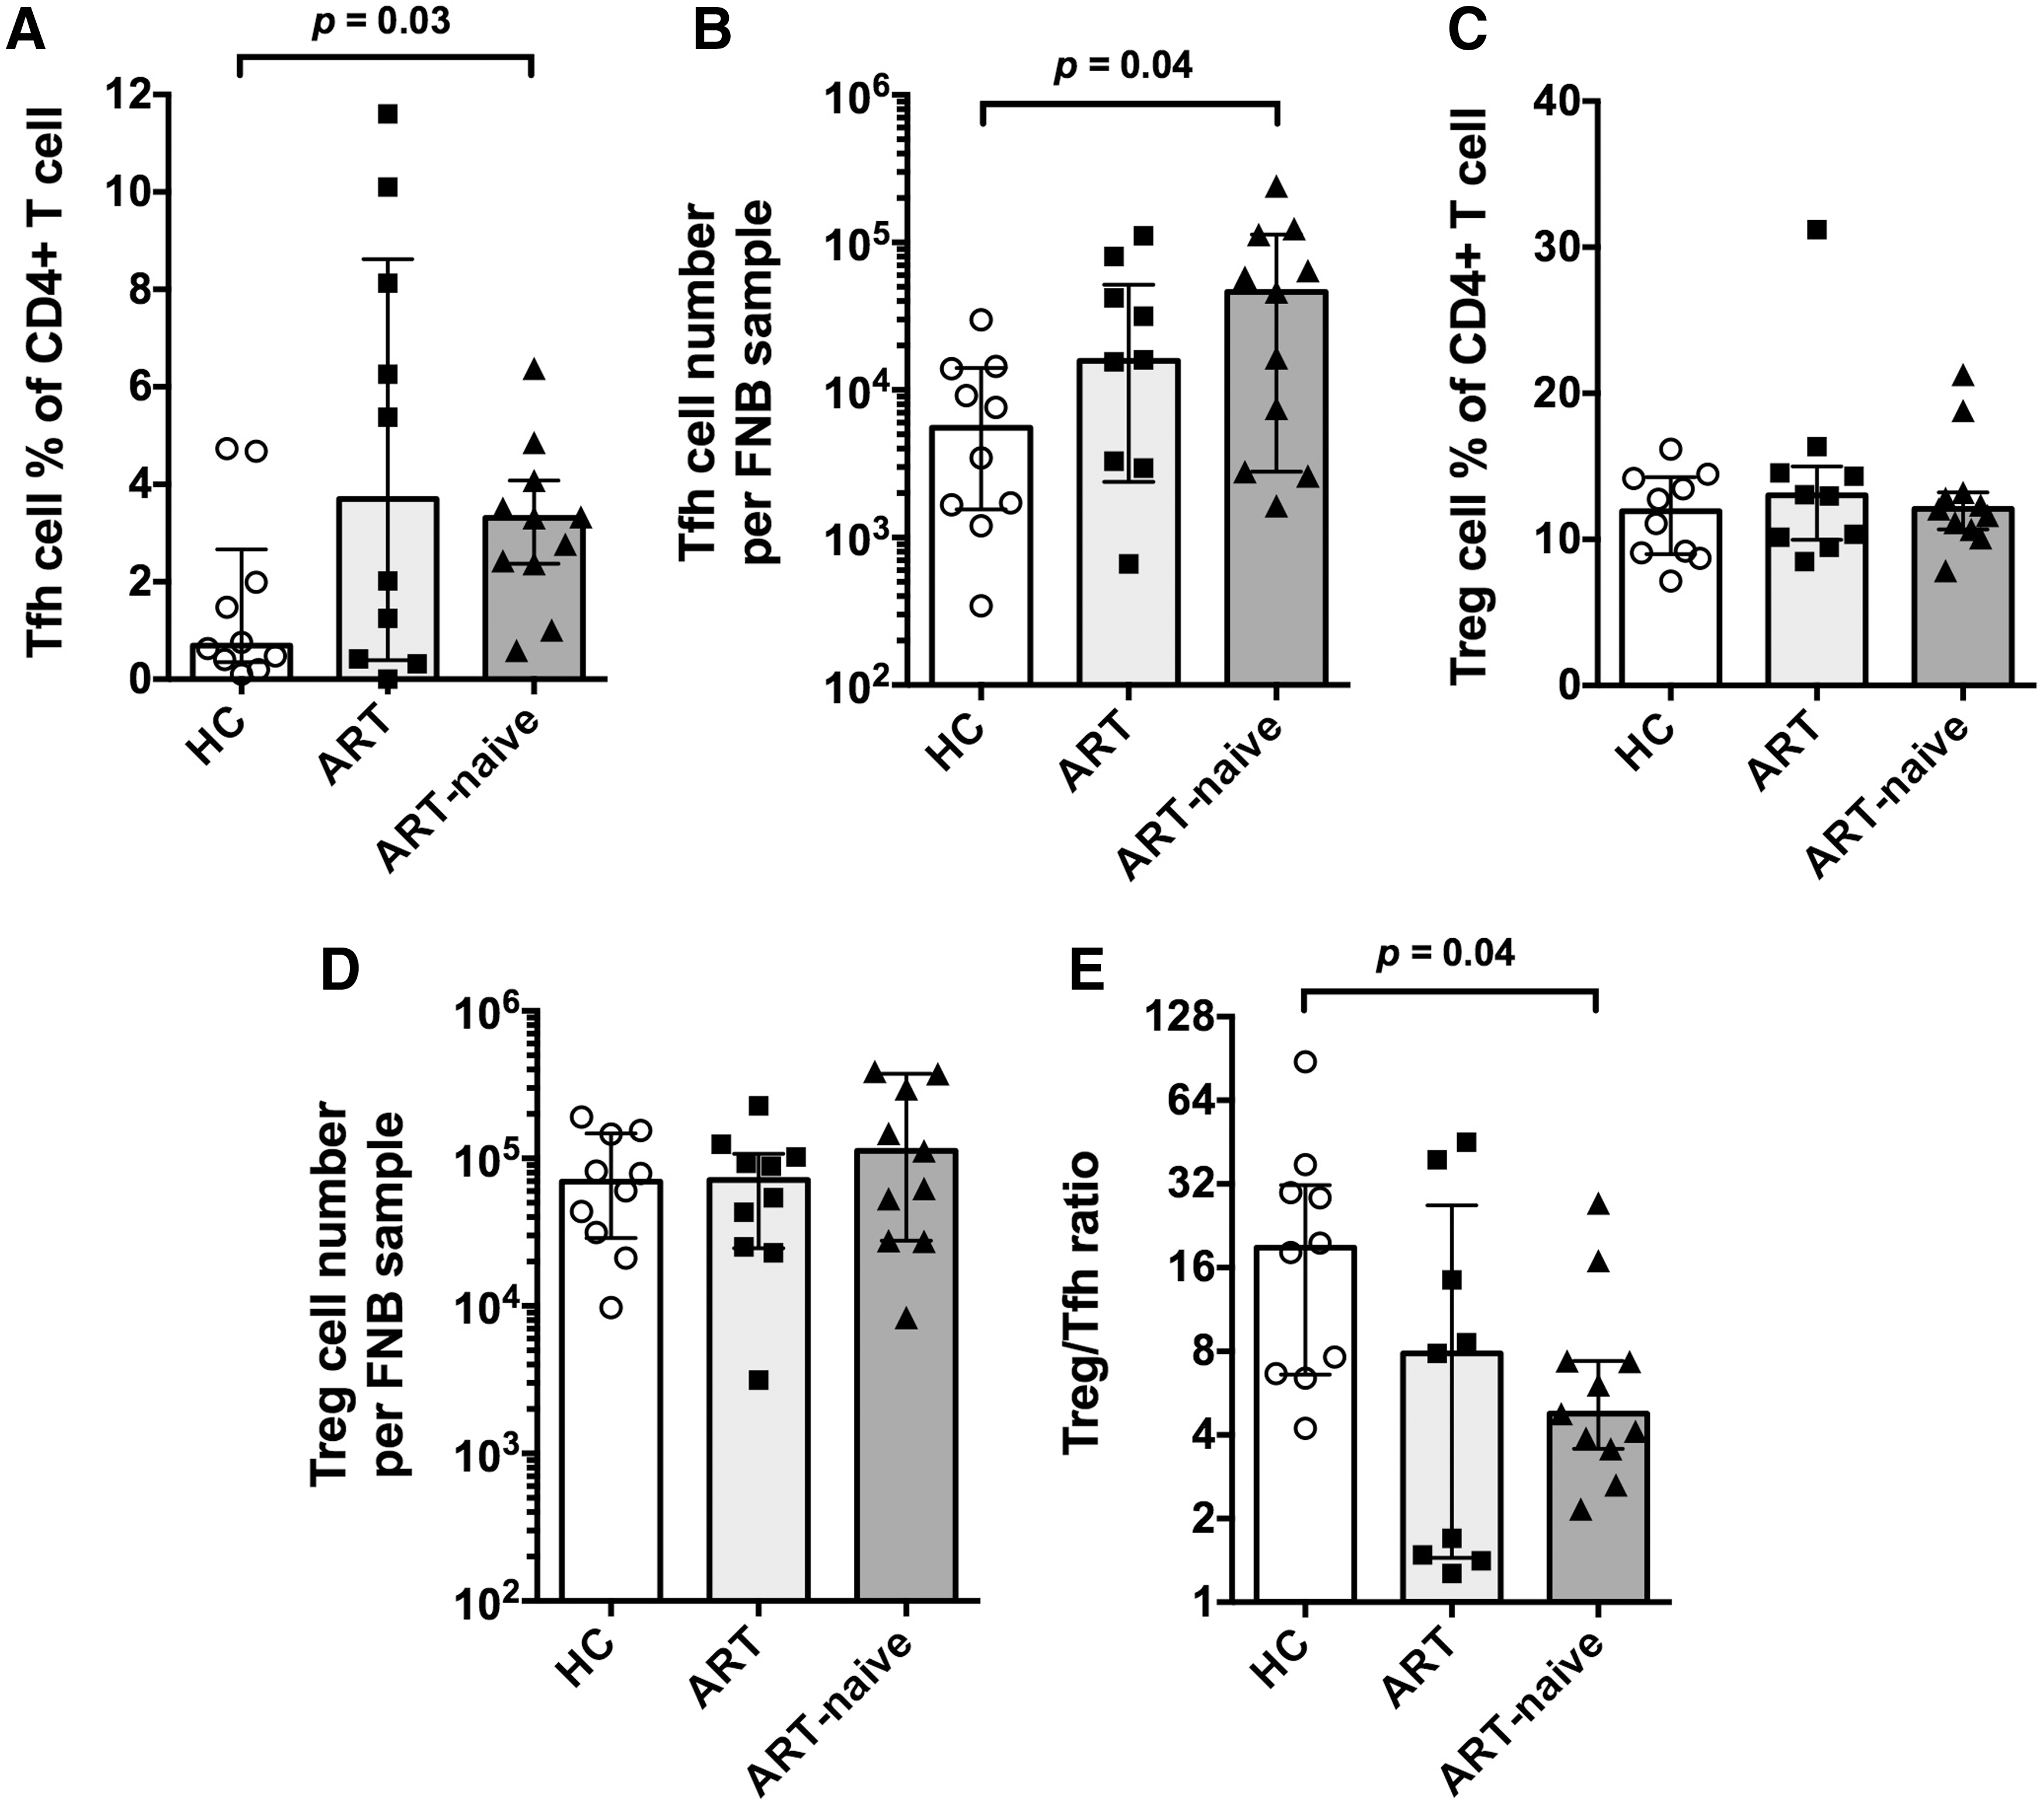
Tfh cells and Treg cells in LN FNB specimens. Column bars show medians with interquartile range for
For CD25+CD127dim Treg cells in the LN FNB samples, no significant difference was observed between the subject groups, for either Treg cell percentage of CD4+ T cells (Fig. 2C) or number of Treg cells (Fig. 2D). However, the ratio of Treg cells to Tfh cells in LN FNB was significantly decreased in samples from the ART-naive group compared with HC, because of increased number of Tfh cells in HIV-1 infection (Fig. 2E). CD25+CD127dim Treg cells were present in both LNs and PB, but the proportion was significantly higher in LNs than in PB (Supplementary Fig. S5B).
GC B cells and plasmablasts
CD45+CD3−CD19+ B cells were subdivided into five subpopulations based on differential expression of CD38 and IgD, plus CD20, CD27, Bcl-6, and Ki-67: (i) naive B cells were identified as CD38+/−IgD+CD27−, (ii) memory B cells were identified as CD38+/−IgD−CD27+, (iii) GC B cells were identified as CD38++IgD−CD20highBcl6+ cells, and (iv) plasmablasts were identified as CD38+++IgD−CD20−CD27+ cells. The flow cytometry gating strategy to identify B cell subsets is shown in Supplementary Figure S6.
The absolute number and frequencies of GC B cells were significantly increased in the ART-naive group, and they tended toward an increase in the ART group compared with HC (Fig. 3A, B). Again, 5 out of 10 HIV+ ART subjects had GC B cell frequencies that were more than the highest GC B cell frequency in HC subjects. In contrast, GC B cells were not seen in PB, as expected (Supplementary Fig. S7A).
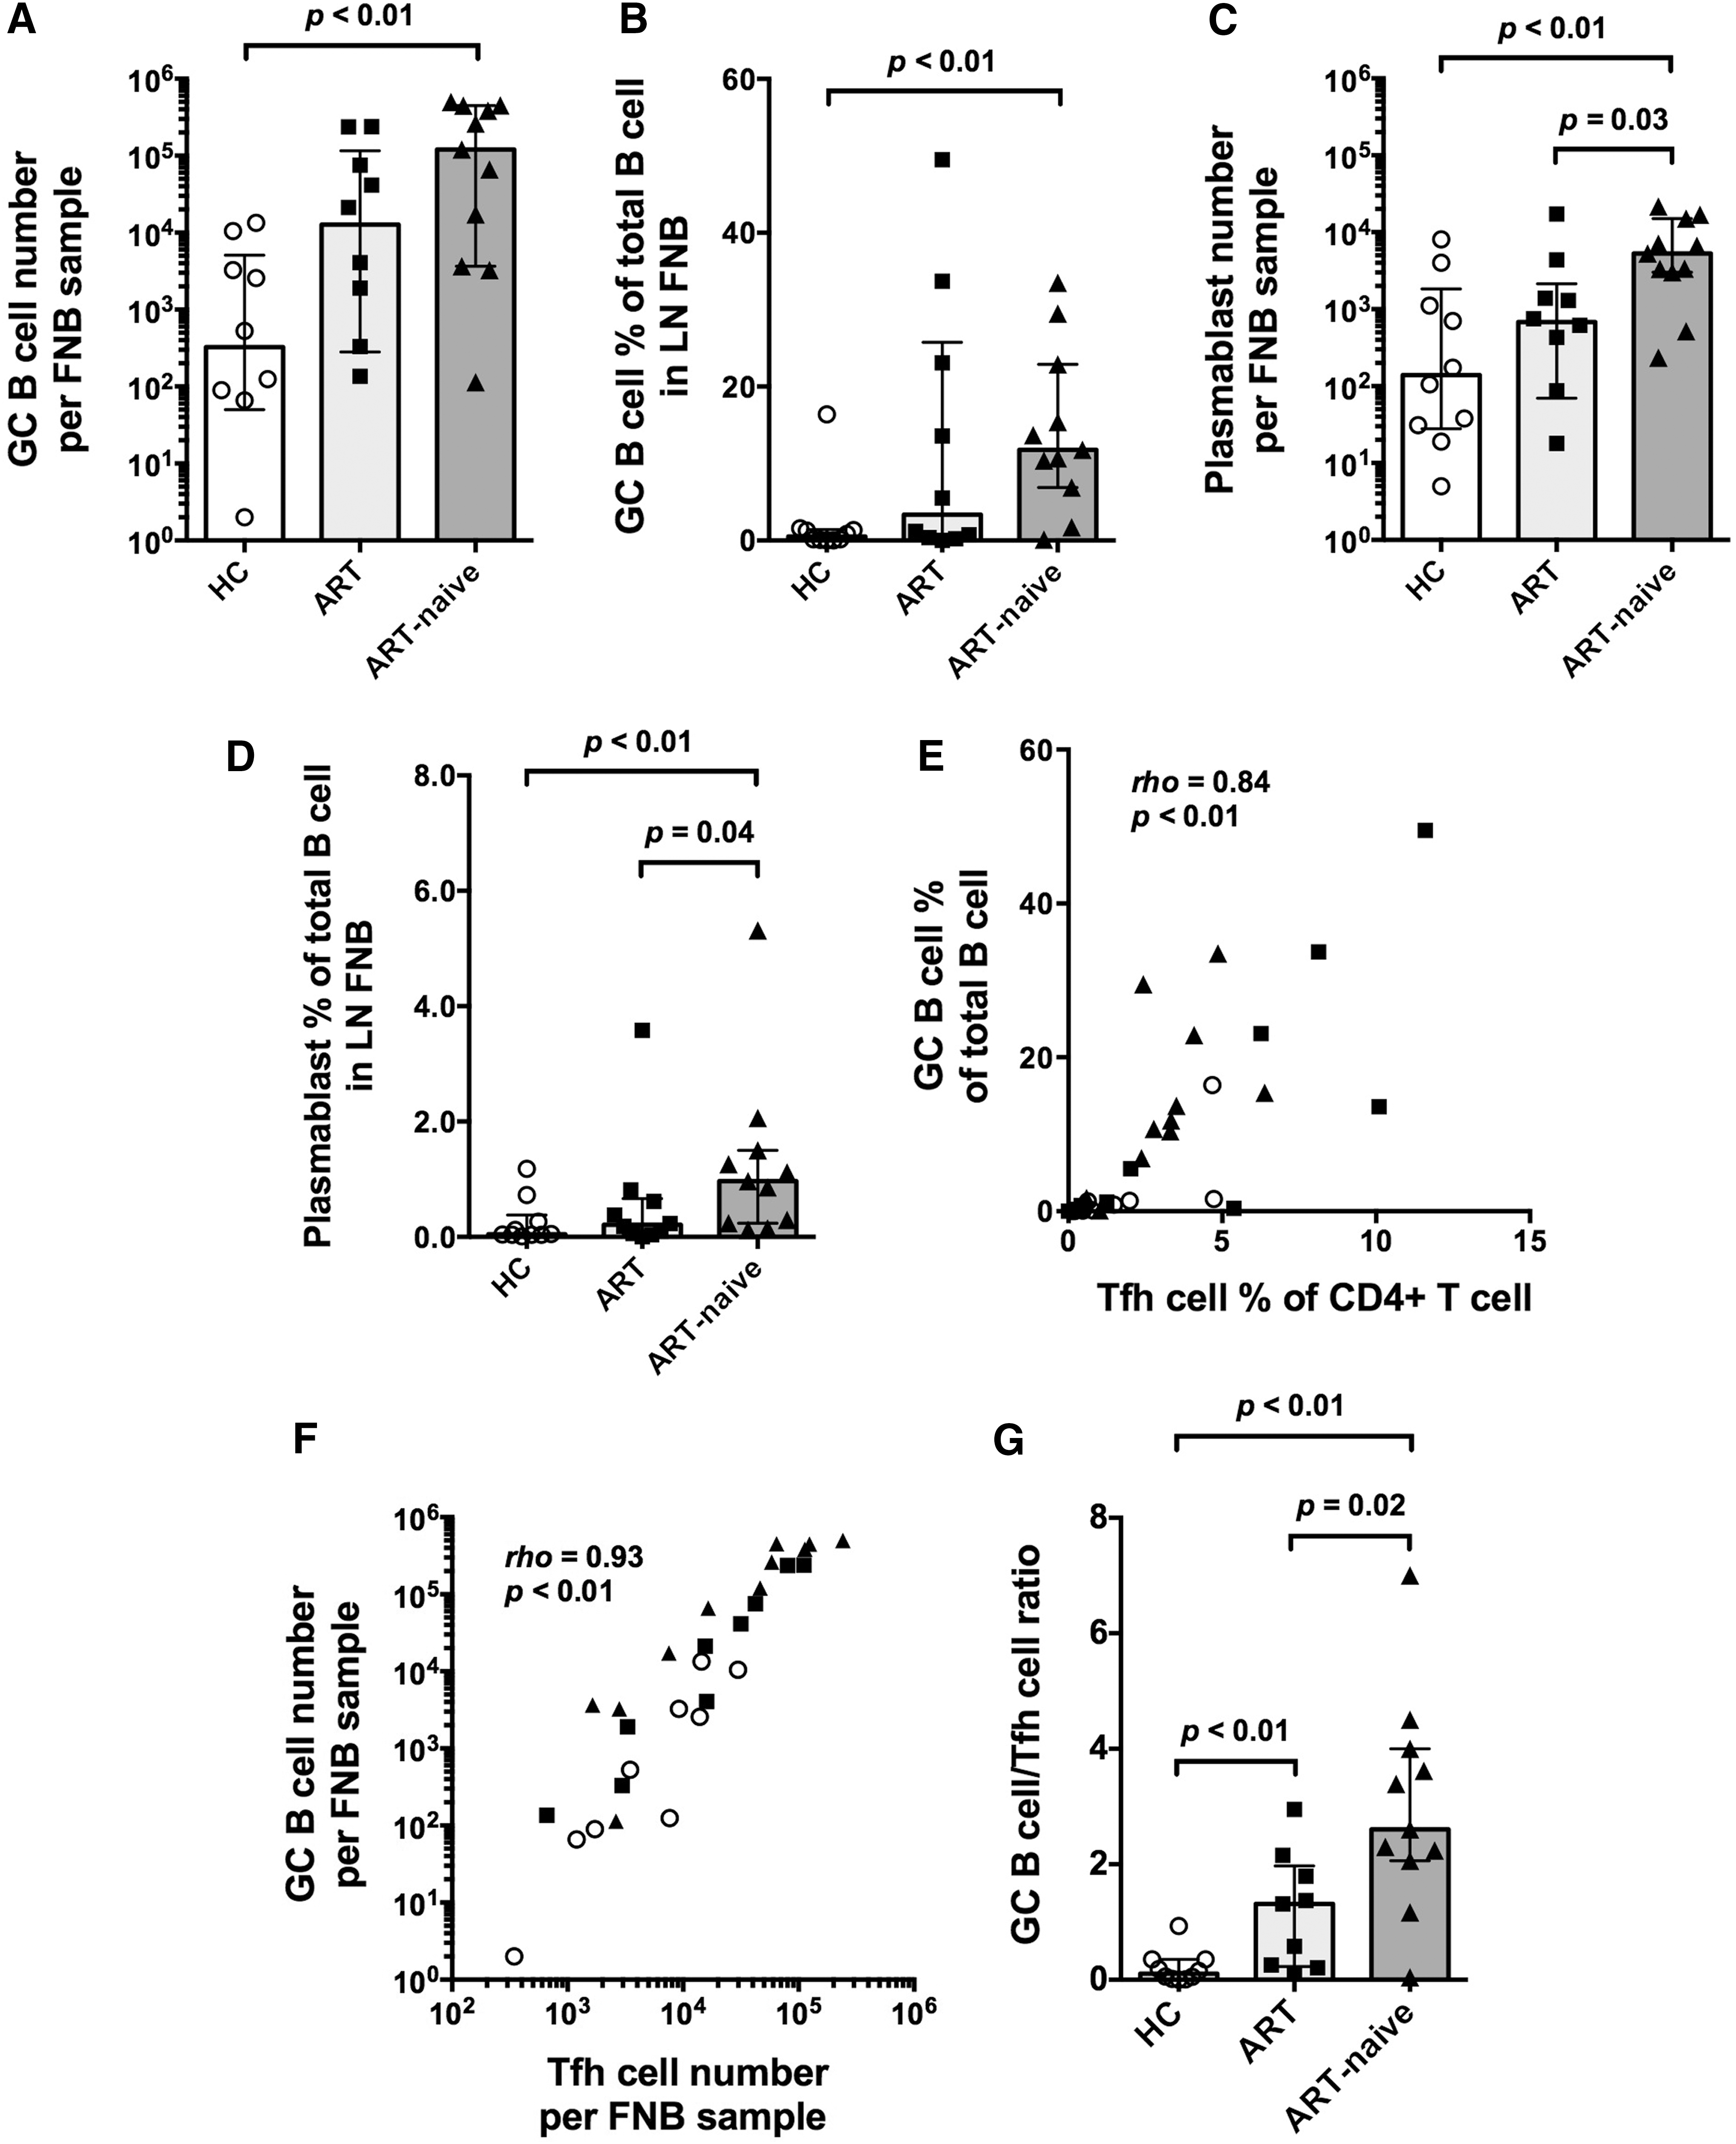
GC B cells and plasmablasts in LN FNB specimens. Column bars show medians with interquartile range for
Numbers of plasmablast cells and frequencies were ∼10 times lower in LN FNB samples than seen for GC B cells (Fig. 3C, D). Samples from the ART-naive group had the highest numbers of plasmablast cells and frequencies (Fig. 3C, D). Plasmablasts were seen in both LN FNB and PB, trending higher in the PB (Supplementary Fig. S7B).
GC B cell frequencies strongly correlated with Tfh cell frequencies (rho = 0.88, p < .01, Fig. 3E). There were four HIV+ ART patients who exhibited increases of both GC B cell and Tfh frequencies (Fig. 3E). GC B cell counts also strongly correlated with number of Tfh cells (rho = 0.94, p < .01, Fig. 3F). Two subjects who had previously been defined as long-term survivors (patient Nos. 18 and 32 from Supplementary Table S1) did not appear to be distinct from other HIV+ ART-naive subjects, and were not outliers on any of the analyses (data not shown).
The ratios of GC B cell to Tfh cell were significantly higher in the HIV+ groups than in the HC group, particularly in the ART-naive group (Fig. 3G). As Tfh cells are a limiting factor for GCs, the higher ratio of GC B cells to Tfh cells indicates long-term, ongoing B cell expansion in GC reactions in the HIV+ subjects.
Relationship between GC activity and T cell activation
As expected, in both LN and PB compartments, the frequencies of activated T cells [measured as the proportion of CD3+ T cells coexpressing CD38 and Ki-67 (Supplementary Fig. S8)] were significantly higher in the HIV+ groups, in particular the ART-naive group, than in the HC group (Fig. 4A, B). The frequencies of activated T cells in LNs and PB were significantly correlated (rho = 0.75, p < .01, Fig. 4C).
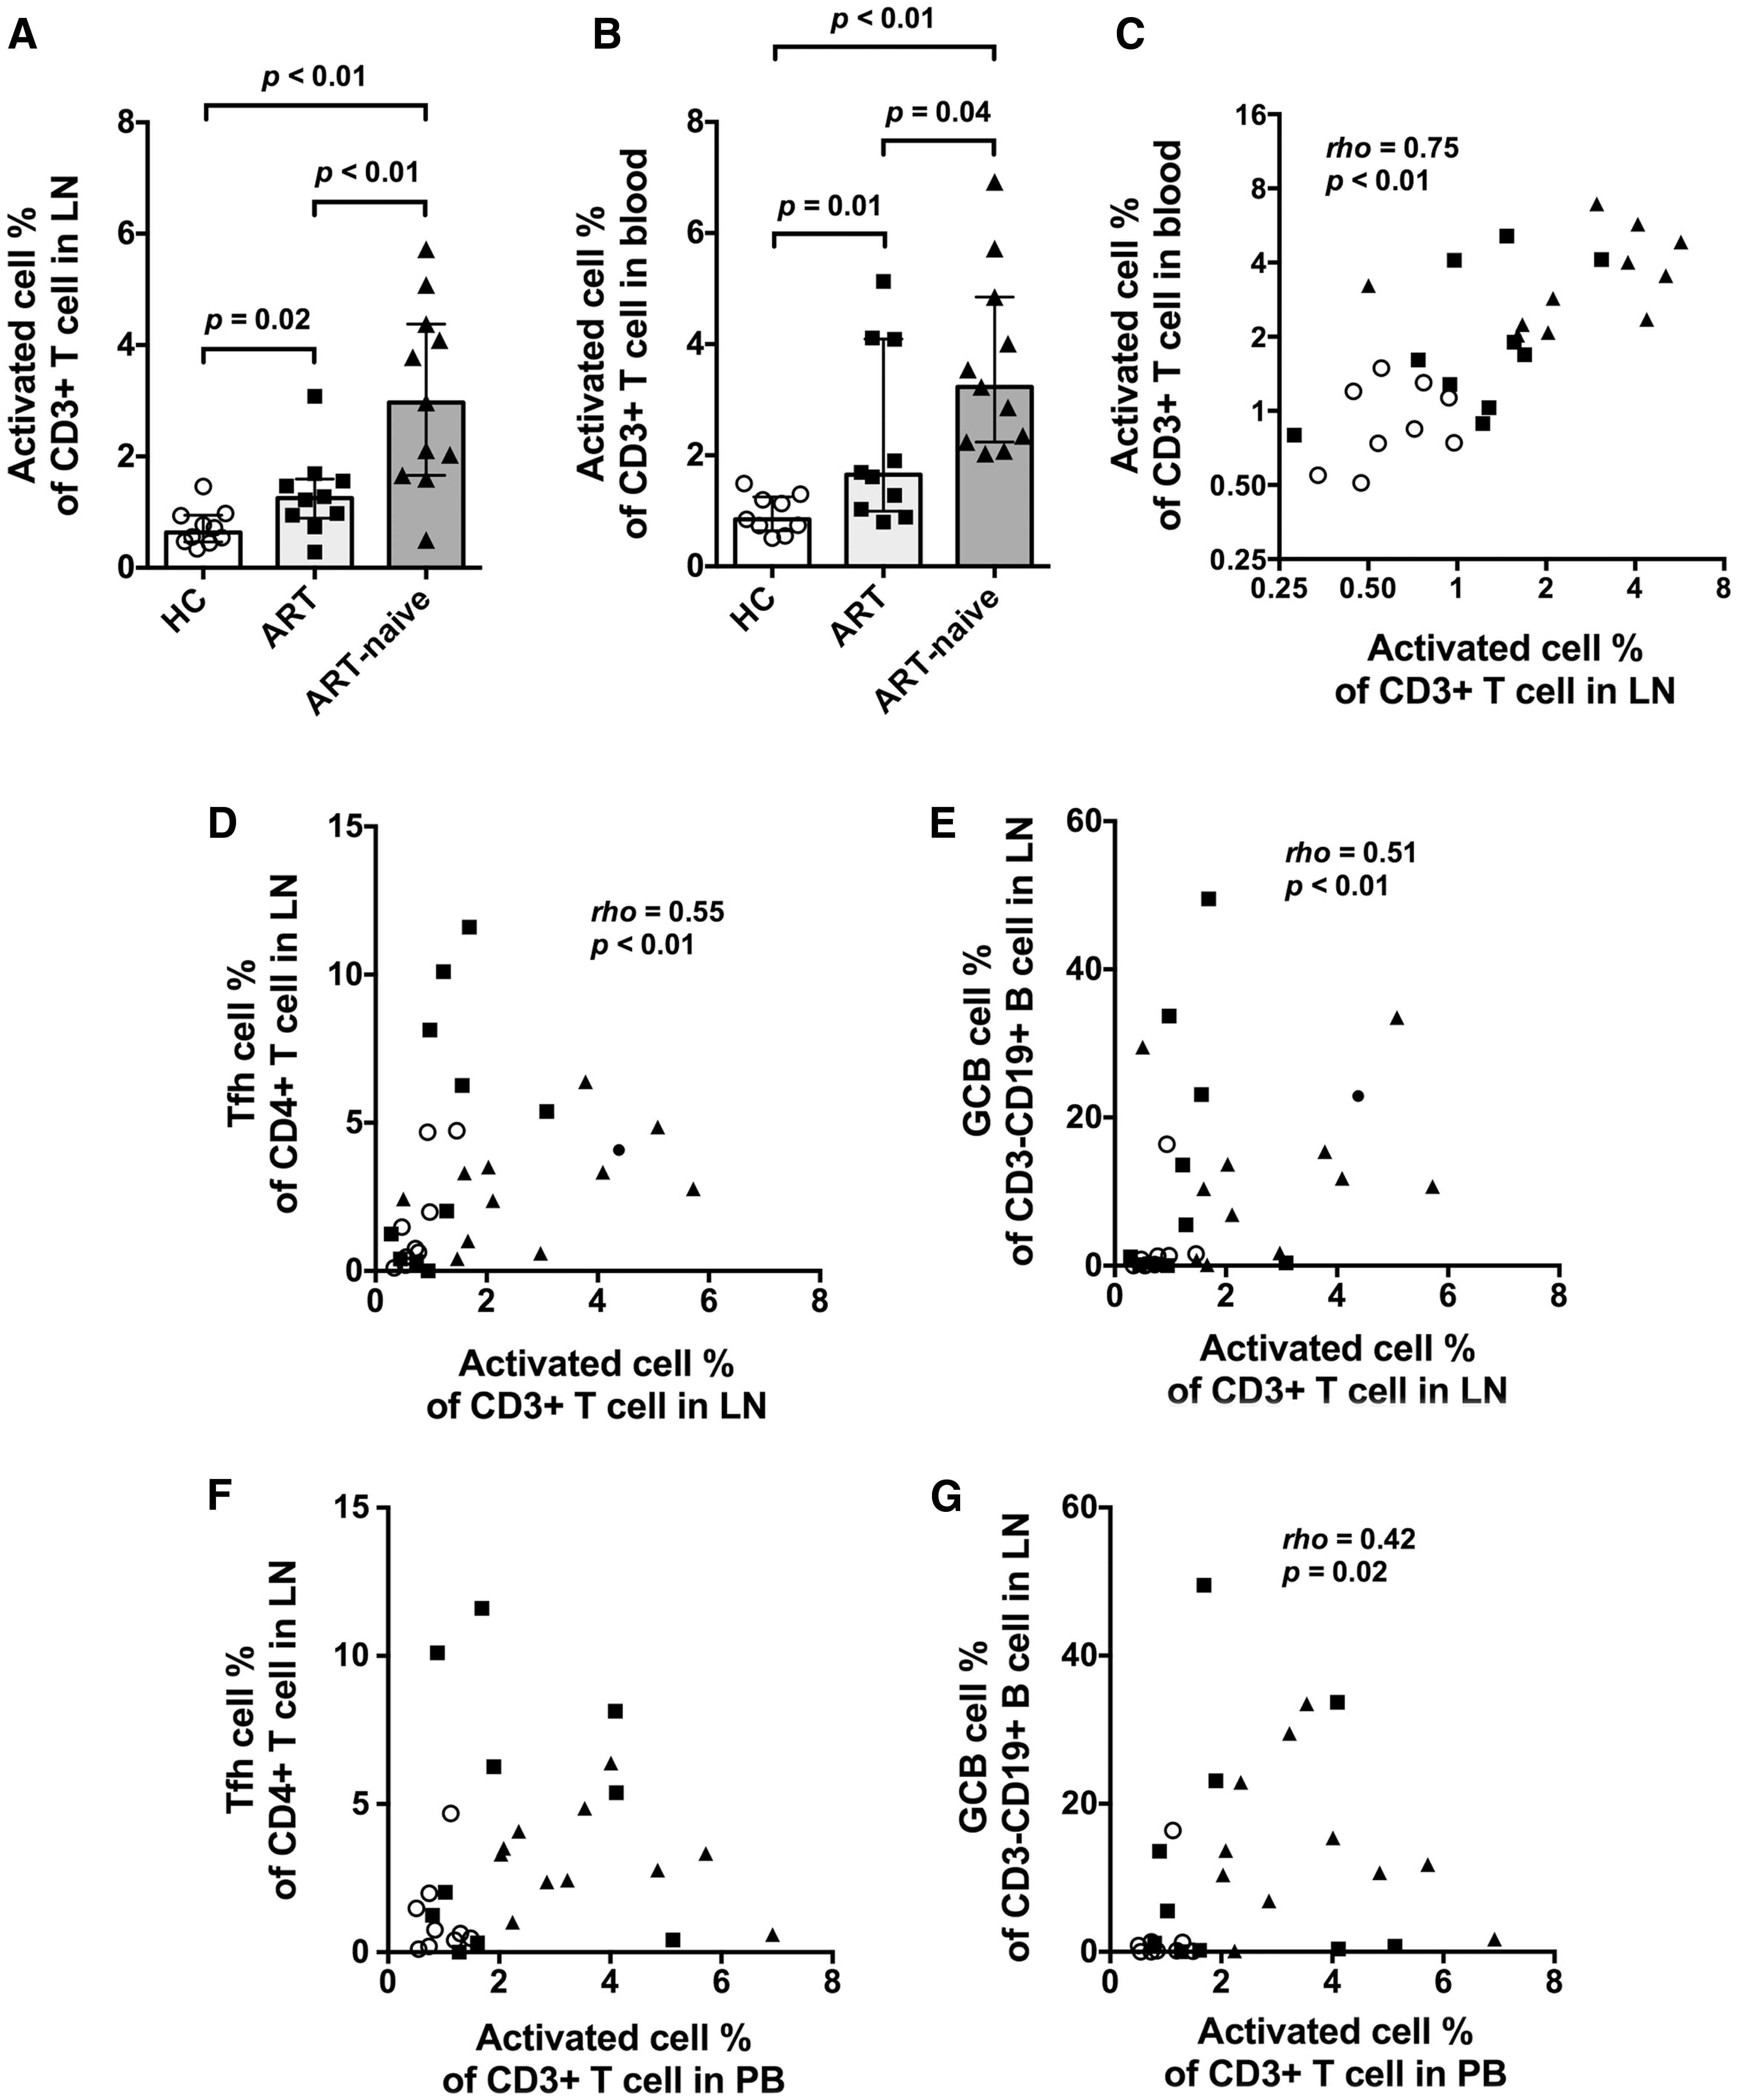
Activated T cells in LNs and PB and their relationship between Tfh and GC B cells. Column bars show medians with interquartile range for
A moderate correlation was observed between the frequencies of activated T cells in the LNs and the frequencies of Tfh cells or GC B cells (Fig. 4D, E), but there was no direct correlation between the frequencies of activated T cells in PB and the frequencies of Tfh cells (Fig. 4F), and weakened correlation between the frequencies of activated T cells in PB and the frequencies of GC B cells (Fig. 4G). These results suggest that GC activity is more highly correlated with activated T cells in the LNs than with the same parameter in PB.
The correlation between activated T cells and GC activities, seen for all samples, appeared to reflect the overall trend of higher activated T cell frequencies in LN and GC activities in the HIV+ groups, but does not completely explain the unusually high GC activities in some individual patients on ART (Supplementary Fig. S9A, B, E, F).
HIV-1 DNA and CA RNA in LN FNB CD4+ T cells
A median of 3.0 × 10⁵ CD4+ T cells (range 1.8 × 10⁴ to 2.2 × 10⁶) were purified by cell sorting from LN FNB samples, with an average sort recovery of 49%, and purity of 96% and higher. DNA and RNA extracted from purified CD4+ T cells were analyzed by qPCR and RT qPCR, respectively (Fig. 5). For HIV-1 DNA quantification, two samples were excluded because β-actin was not detected, indicating insufficient DNA yield. For the HIV-1 RNA quantification, three samples from the ART group were excluded as samples had been fixed with paraformaldehyde.

HIV-1 DNA and CA HIV RNA in CD4+ T cells purified from PB and LN FNB specimens. Total HIV DNA levels are significantly higher in FNB LN cells than in PB in all HIV patients
Overall, HIV DNA copies were significantly higher in FNB CD4+ T cells than in PB (p = .024, Fig. 5A). Comparing PB and FNB HIV DNA values in the ART-naive and ART groups separately, these differences were significant in the ART-naive group (p = .0195), but not when comparing PB and FNB values in patients on ART (p = .1289) (Fig. 5B).
Similarly, CA HIV RNA values in CD4+ T cells from LNs were significantly higher than in PB (p = .007 Fig. 5C). Again, these differences were more pronounced in CD4+ T cells from ART-naive patients (p = .0029) than from patients on ART (p = .686, Fig. 5D).
Discussion
The aim of this study was to evaluate the safety and use of FNBs of peripheral LNs for the simultaneous assessment of residual T and B cell activation and HIV-1 persistence in LN resident cells. The procedure was very well tolerated in all subjects with no adverse events. Accessing LN tissues by FNBs yielded sufficient material for the assessment of T and B cell activation, characterization of subsets including Tfh and GC B cells, and the quantitation of HIV persistence by measurement of HIV-1 DNA/CA HIV RNA levels in isolated CD4+ T cells.
Similar to previous studies in macaques and humans, 1,25,32 LN FNB cell suspensions contained LN-resident Tfh and GC B cells and were not contaminated by PB. Consistent with earlier results from our group and others, using excision lymphoid tissue biopsies, we confirmed an increase in Tfh and GC B cells in HIV+ ART-naive subjects compared with HCs, 4 –8,33 but also an increase in Tfh cells and GC B cells in 4 of the 10 patients receiving ART. This suggests that dysregulation of GC activity may persist in a subset of patients despite ART, and this finding is consistent with an earlier histological study that observed continued hyperplasia in LNs after ART. 34
A moderate correlation was observed between GC activity and general T cell activation in LNs, but not T cell activation levels in PB, highlighting the importance of studying tissue samples. We also observed a higher frequency of CD25+CD127dim Treg cells in LN FNB samples, relative to PB, 35,36 but Treg cell levels in LN FNBs were comparable in both the treated and untreated HIV+ groups as well as in the HC group. Previous reports have suggested that number of Treg cells may be decreased in PB compared to LNs in untreated chronic HIV+ patients. 36,37 These different findings may be explained by different patient characteristics and/or our definition of CD25+CD127dim Treg cells, because in our study we did not include CD39 expression 37,38 for phenotyping of Treg cells.
Although Tfh cells provide indispensable help to B cells, and study of these cells is important for vaccine development, they are also major targets for HIV-1/SIV infection, potentially providing a significant CD4+ T cell compartment for viral replication and HIV reservoir retention. 5,6,8,9,33 Interestingly, in our study, we found a correlation between overall LN T cell activation and the proportion of Tfh cells, which in turn was associated with an increased GC B cell proportion. The increase of GC B cells in HIV+ patients was even more dramatic than the increase of Tfh cells, implying that Tfh function, at least in terms of facilitating B cell proliferation, may not be adversely affected by HIV-1 infection. Nevertheless, the expansion of B cells may result in impaired memory cell formation. 7,39 A previous report had suggested that B cells in LNs from HIV+ subjects overexpressed PD-L1, which led to dysfunctional Tfh cells as measured in vitro. 40 Although analysis of PD-L1 expression was not performed in this study, the dramatically elevated GC activity argues somewhat against a significant inhibition of basic Tfh function in vivo. In association with the elevated GC activity, we observed a significant increase in plasmablasts in LN FNBs from the HIV+ subjects, also consistent with dysregulation of B cell activation in HIV-1 infection. 39
In this study, FNBs of peripheral LNs yielded sufficient cells for quantitation of HIV-1 DNA and RNA in highly purified CD4+ T cells. Our results confirm and extend previous studies of LN FNBs for the assessment of HIV-1 reservoirs and transcriptional activity in LNs. 26 –29 We found significantly higher levels of HIV DNA and CA HIV RNA in LN CD4+ T cells than in PB, in particular in the ART-naive group in which HIV-1 DNA and RNA levels were clearly elevated in LNs than in PB. These observations are consistent with LNs acting as significant contributors to HIV-1 replication during untreated infection, and possibly HIV-1 reservoirs during treated infection.
This study was designed as a proof of principle study to use FNBs to assess LN resident cells and quantify HIV-1 nucleic acids in isolated CD4+ T cells. The size of the study population, and also the yield of cell subsets after flow cytometry, sets limits to the generalizability of our findings, but it is, to our knowledge, the largest and only study to date assessing both T and B cell activation, including GC activity, and HIV DNA and CA RNA levels in PB and LN FNB specimen in parallel.
One advantage of FNBs is that cells require no specific manipulation after collection, compared with density centrifugation of PB samples. Conversely, one limitation of FNBs is that the finite number of CD4+ T cells obtained, typically around 1 × 10⁶ cells, means that it may be required to prioritize the questions that can be addressed with one sample, for example, phenotyping for rare cell types, versus cell sorting and nucleic acid extraction. Another limitation during this study was that we could not detect follicular dendritic cells as single cells by flow cytometry using CD21 or CD35 (data not shown), possibly because of the location, size, and/or morphology of these cells, 41 in conjunction with the use of relatively weak capillary forces for cell uptake into the needle used for FNBs. Also, we could not identify LN macrophages 42 in FNBs. Full LN excisions were not ethically justified in this study protocol, but it is important to note that in our previous macaque study, 25 lymphocyte subsets determined by FNBs showed good concordance with cell counts in whole LN biopsies.
In summary, this study demonstrates that FNBs of peripheral LNs are a safe and minimally invasive means of accessing lymphoid tissue cells, and quantified elevated T and B cell activation in LNs in HIV-1-infected individuals with or without ART, compared with HC subjects. Importantly, even in this initial study, we observed ongoing immune activation that was not reflected in PB samples, and highlight the disparity and indicate that detailed studies of tissues may be required to address specific clinical or pathogenesis questions. Furthermore, we were also able to quantify HIV-1 DNA and RNA in cells isolated from LN samples and compare these values to results obtained in PB.
The minimally invasive nature of the procedure gives it the potential for longitudinal parallel analysis of the immune response to HIV-1, including quantitative assessment of ongoing immune activation and tissue reservoirs in future clinical studies. Understanding the regulation of HIV-1 transcription in vivo in subjects on ART, and its relationship with residual immune activation, is essential to rational development of therapies that target viral reservoirs. 43 Also, currently there is much interest in circulating Tfh-like CD4+ T cells 44 ; however, their relationship with LN Tfh is unclear, 45 so access to LNs is still required to better understand Tfh–GC B cell interactions, particularly in the context of generation of HIV-1-specific broadly neutralizing antibodies, 46 and for human antibody responses in general. 47 Finally, this approach also holds wider promise for systematic monitoring of GC activity and immune responses within LNs during other pathogenic infections, or postvaccination, particularly with the recent availability of single-cell techniques to study immune cell differentiation. 48,49
Footnotes
Acknowledgments
This work was supported by research grants from the St. Vincent's Clinic Foundation (Sydney, Australia) (K.K.K., J.J.Z., A.D.K.), and also by Australian National Health and Medical Research (NHMRC) Program grant no. 1052979. The Kirby Institute is funded by the Australian Government Department of Health and Ageing, and is affiliated with the Faculty of Medicine, The University of New South Wales. We would like to thank all individuals enrolled into this study for their generous participation. We would like to thank Karen MacRae for expert nursing support, Bertha Fsadni, Kim Grassi, Melanie Lograsso, and Kate Merlin for their laboratory support. Also, we are grateful to Dr. Steve Yukl for his valuable contributions with aiding the optimization of DNA and RNA extraction protocols. Finally, we would like to thank Tracey Barrett for outstanding administrative support.
Author Disclosure Statement
No competing financial interests exist.
References
Supplementary Material
Please find the following supplemental material available below.
For Open Access articles published under a Creative Commons License, all supplemental material carries the same license as the article it is associated with.
For non-Open Access articles published, all supplemental material carries a non-exclusive license, and permission requests for re-use of supplemental material or any part of supplemental material shall be sent directly to the copyright owner as specified in the copyright notice associated with the article.
