
Abstract
In perinatally HIV-1-infected youths living in France, we previously reported that Gag-specific CD4 and CD8 T cell proliferation is more frequently detected in patients of black ethnicity than in those of other ethnicities. We observed that black patients had higher levels of dendritic cells (DCs) than other patients. We aimed at studying the association of DC levels with Gag-specific T cell proliferation. The ANRS-EP38-IMMIP study is an observational study of youths aged between 15 and 24 years who were perinatally infected with HIV. A single blood sample was drawn for virological and immunological assays. Data from cART-treated 53 youths with undetectable plasma HIV RNA were analyzed. Gag-specific T cell proliferation was assessed by using a CFSE-based test. Peripheral blood myeloid dendritic cells (mDCs) and plasmacytoid dendritic cells (pDCs) were phenotyped by flow cytometry. Plasma markers were quantified by ELISA or multiplex assays. Logistic regression was used for univariate and multivariate analyses. Patients with Gag-specific CD4 T cell proliferative responses had significantly higher percentages and absolute counts of mDCs and pDCs in the peripheral blood than nonresponding patients. Gag-specific CD4 and CD8 T cell proliferation was associated with lower plasma sCD14 levels. Plasma levels of IFN-α, TRAIL, and chemokines involved in T cell migration to secondary lymphoid organs were not associated with T cell proliferation. Multivariate analysis confirmed the association between Gag-specific CD4 T cell proliferation and pDC levels. In conclusion, DC levels are a robust correlate of the presence of Gag-specific T cell proliferation in successfully treated youths.
Introduction
HIV-
We observed that the levels of myeloid cells and related plasma markers differed between black patients and patients from other ethnic groups. Dendritic cells (DCs) affect T cell responses through antigen presentation, secretion of pro-inflammatory molecules, and transmission of HIV particles to susceptible target cells. 3 Thus, we aimed here at studying the association between DCs and Gag-specific T cell proliferation, focusing on patients with undetectable plasma HIV RNA at the time of the study.
Materials and Methods
Patients
The ANRS-EP38-IMMIP study included 93 patients who acquired HIV-1 infection during the perinatal period and were at least 15 years old at the time of the study.
4,5
The study was approved by the local ethics committees. All patients, and their legal guardians for those less than 18 years of age, received written information and signed an informed consent form. This study was approved by the “Comité de protection des personnes Ile-de-France II” (Registration No. 06-09-08), authorized by the “Direction Générale de la Santé” (Authorization No. 2006-AOO142-49). The ANRS-EP38-IMMIP study is registered as an observational study at
Biological analyses
Freshly isolated peripheral blood mononuclear cells (PBMCs) were labeled with 10 μM CFSE (5-6-carboxyfluorescein diacetate succimidyl ester) and stimulated with pools of Gag peptides (NIH No. 8117). Six days later, the cells were labeled with a combination of anti-CD3-ECD, anti-CD4-PC7, and anti-CD8β-PC5 antibodies (Beckman Coulter, Villepinte, France), and they were analyzed on an FC500 flow cytometer (Beckman Coulter). CFSElow T cells were quantified for CD4 and CD8 T cell subpopulations (see Ref. 2 for gating strategy). Assays were scored positive if the difference in the percentages of CFSElow cells between antigen-stimulated and mock-stimulated cells was above 0.8% and the ratio of these percentages was above 4. This dual criterion cutoff was based on assays performed with uninfected donors, as described. 2 Patients with positive results in the Gag-specific CD4 T cell assay are referred to as CD4 responders (CD4Rs), and those with negative results for this assay are referred to as CD4 nonresponders (CD4NRs). Similarly, CD8Rs and CD8NRs are defined on the basis of the results of the Gag-specific CD8 T cell proliferation assay.
CD4 T cell percentages and CD4 T cell and monocyte counts were determined at the clinical sites as part of the standard follow-up procedure. Myeloid dendritic cells (mDCs) and plasmacytoid dendritic cells (pDCs) were studied with a combination of labeled antibodies: FITC-anti-CD14, FITC-anti-CD16, PE-anti-CD85k, PC5-anti-CD33, and PC7-anti-CD123 (Fig. 1).
6,7
Results were available for 42 patients. Patients with and without DC data were similar regarding age, CD4 T cell count, cell-associated HIV DNA levels, time spent with an HIV RNA level <500 copies, and time spent on highly active antiretroviral treatment (HAART) (data not shown). Plasma samples from 52 out of 53 patients were assayed for cytokines, chemokines, and sCD14, according to the manufacturer's instructions for each kit (references and quantification thresholds are presented in Supplementary Table S1; Supplementary Data are available online at
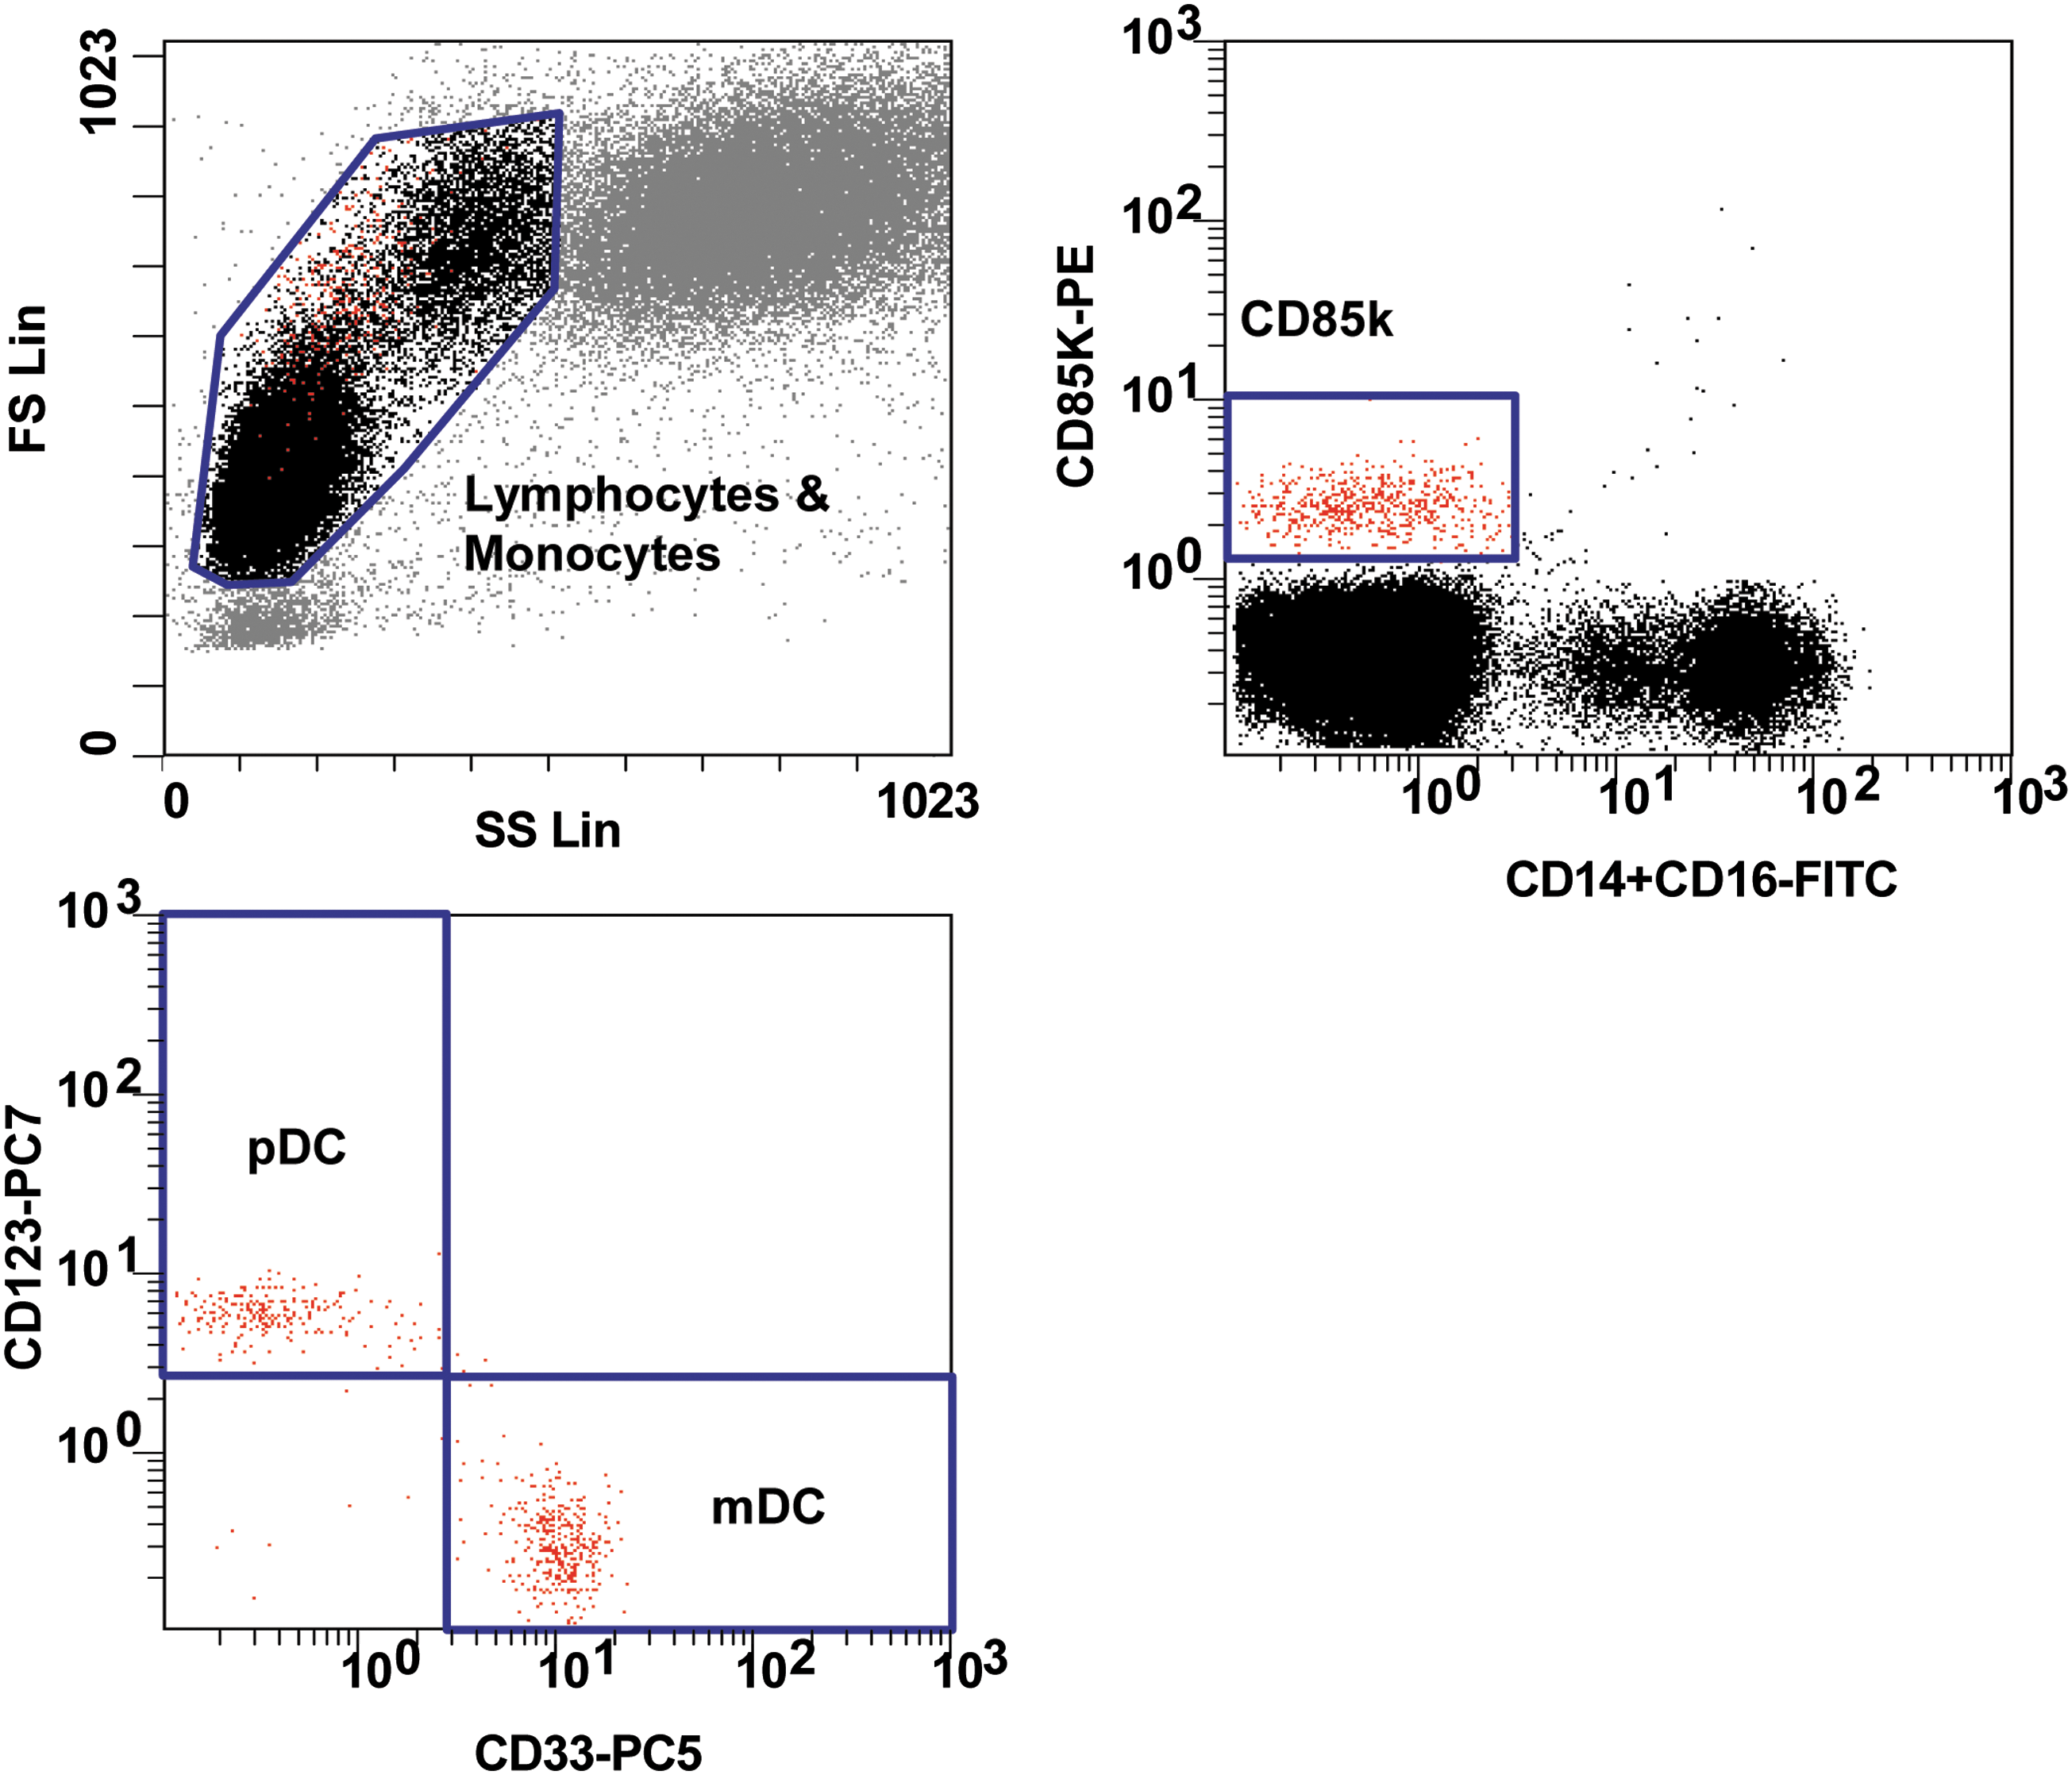
Gating strategy for blood dendritic cell detection. The gating strategy used an FSC-SSC gate to define lymphocytes and monocytes, a CD85k+CD14−CD16− gate applied to lymphocytes and monocytes, a CD123+CD33− gate applied to CD85k+CD14−CD16− cells to define pDCs, and a CD123−CD33+ gate applied to CD85k+CD14−CD16− cells to define mDCs. Gate statistics include the percentages of mDCs and pDCs among lymphocytes and monocytes. Absolute counts of mDCs and pDCs were calculated on the basis of blood cell quantification performed at the clinical sites. mDCs, myeloid dendritic cells; pDCs, plasmacytoid dendritic cells.
Statistical analysis
Associations between ethnicity and immune parameters were assessed by using the Fisher's exact test and the Mann–Whitney test for qualitative and quantitative variables, respectively. Patients were classified according to the detection of Gag-specific CD4 and CD8 T cell proliferation. Logistic regression was used for univariate and multivariate analyses of data. We took ethnic origin into account, by grouping patients originating from sub-Saharan Africa and the Caribbean and comparing them with those of other geographic origins (mainland France, North Africa, and Asia). The patients are referred to as being of black or other ethnicity. Phylogenetic analyses were carried out on the sequences of the Env and RT genes, to determine virus subtype, as described in Ref. 2 The analyses were exploratory and were, therefore, not corrected for multiple testing. For variables associated with Gag-specific T cell proliferation with a p ≤ .20 in univariate analysis, we tested the associations with inclusion of demographic and HIV disease history variables that were previously found to be associated with T cell proliferation. 2 We did not build a model with all immunological parameters, as these were not quantified for all patients, due to a lack of available samples for some of them. Analyses were conducted by using SAS software (version 9.2). A p value of <.05 was considered to indicate statistical significance.
Results
Patients
The analyses described here were restricted to the 53 patients who were receiving HAART, who had undetectable plasma HIV RNA at the time of the study, and for whom a valid proliferation assay had been carried out. Twenty-four of the patients were men, and 19 were of black ethnicity. At the time of the study, the median age of the patients was 18 years (interquartile range [IQR] 16–19 years); patients had been on HAART for a median cumulative duration of 9.1 years (IQR 7.6–9.8 years), and they had a median CD4 T cell count of 635 cells/μl (IQR 522–918 cells/μl) and a median duration of HIV RNA <500 copies/ml of 3.0 years (IQR 1.3–6.3 years).
Gag-specific CD4 T cell proliferation is associated with higher peripheral blood dendritic cell levels
Black patients had higher percentages and absolute counts of mDCs than patients of other ethnic groups (Table 1). They tended to have higher percentages of pDCs and lower monocyte counts. We compared the levels of these antigen-presenting cells (APCs) between patients with and without Gag-specific CD4 T cell proliferation (CD4Rs and CD4NRs, respectively). Data are presented for the two ethnic groups in Figure 2, and results from the logistic regression are reported in Figure 2J and K. CD4Rs had significantly higher percentages and absolute counts of mDCs and pDCs in the peripheral blood than CD4NRs (Fig. 2A–D). The peripheral blood monocyte count was not associated with Gag-specific CD4 T cell proliferation (Fig. 2E). Gag-specific CD4 T cell proliferation was associated with the percentage and absolute count of pDC after adjustment for ethnicity (Fig. 2K). Inclusion of the HIV subtype in the multivariate analysis did not modify the associations (data not shown).

Gag-specific CD4 T cell proliferation is associated with dendritic cell levels and plasma activation markers. Immune parameter levels are presented according to Gag-specific T cell proliferation, and they are stratified by ethnicity. Open and closed symbols represent CD4NRs and CD4Rs, respectively; circles and squares indicate black patients and patients from other ethnic groups, respectively. Myeloid cell phenotyping data were available for 42 patients (black: 14; other: 28), monocyte count was available for 53 patients (black: 19; other: 34), and plasma cytokine evaluations were available for 52 patients (black: 19; other: 33).
Values were calculated for the 53 patients included in the present study. Myeloid cell phenotyping data were available for 42 patients (black: 14; other: 28), monocyte count was available for 53 patients (black: 19; other: 34), and plasma cytokine evaluations were available for 52 patients (black: 19; other: 33).
For quantitative parameters, the medians and IQR were calculated for each ethnic group; for qualitative parameters, percentages and patient numbers are indicated.
Mann–Whitney and Fisher's tests were used to calculate p values.
IQR, interquartile ranges.
Gag-specific CD4 T cell proliferation tends to be associated with lower plasma sCD14 levels
We then quantified plasma markers related to APC activation (sCD14, neopterin, and CCL2) and type I IFN production (IFN-α and TRAIL), because these molecules may suppress or promote T cell proliferation (Fig. 2F–J). Black patients had significantly lower levels of CCL2 and tended to have lower levels of sCD14, neopterin, and IFN-α than patients of other ethnicities (Table 1). CD4Rs tended to have lower sCD14 levels than CD4NRs. Neither IFN-α nor TRAIL plasma levels were associated with Gag-specific T cell proliferation.
We also assessed the levels of chemokines that direct T cell and APC migration to the secondary lymphoid organs in steady-state and inflammatory conditions: CCL3, CCL4, CCL21, CXCL10, and CXCL12. 8 Plasma levels of these five chemokines were not related to ethnicity (Table 1). We observed a trend for lower CXCL12 levels in CD4Rs (Fig. 2J). None of the plasma markers were associated with Gag-specific CD4 T cell proliferation after adjustment for ethnicity (Fig 2K).
Gag-specific CD8 T cell proliferation tends to be associated with lower levels of monocyte activation markers in plasma
A similar analysis was conducted for Gag-specific CD8 T cell proliferation. CD8Rs tended to have higher levels of mDCs than CD8NRs, by univariate analysis only (Fig. 3). CD8Rs had significantly lower plasma concentrations of sCD14 and CCL2 than CD8NRs (Fig. 3F, H). CCL2 was not associated with Gag-specific CD8 T cell proliferation, after adjustment for ethnicity and duration of HIV RNA <500 copies/ml, but we observed a trend for lower sCD14 (Fig. 3K).
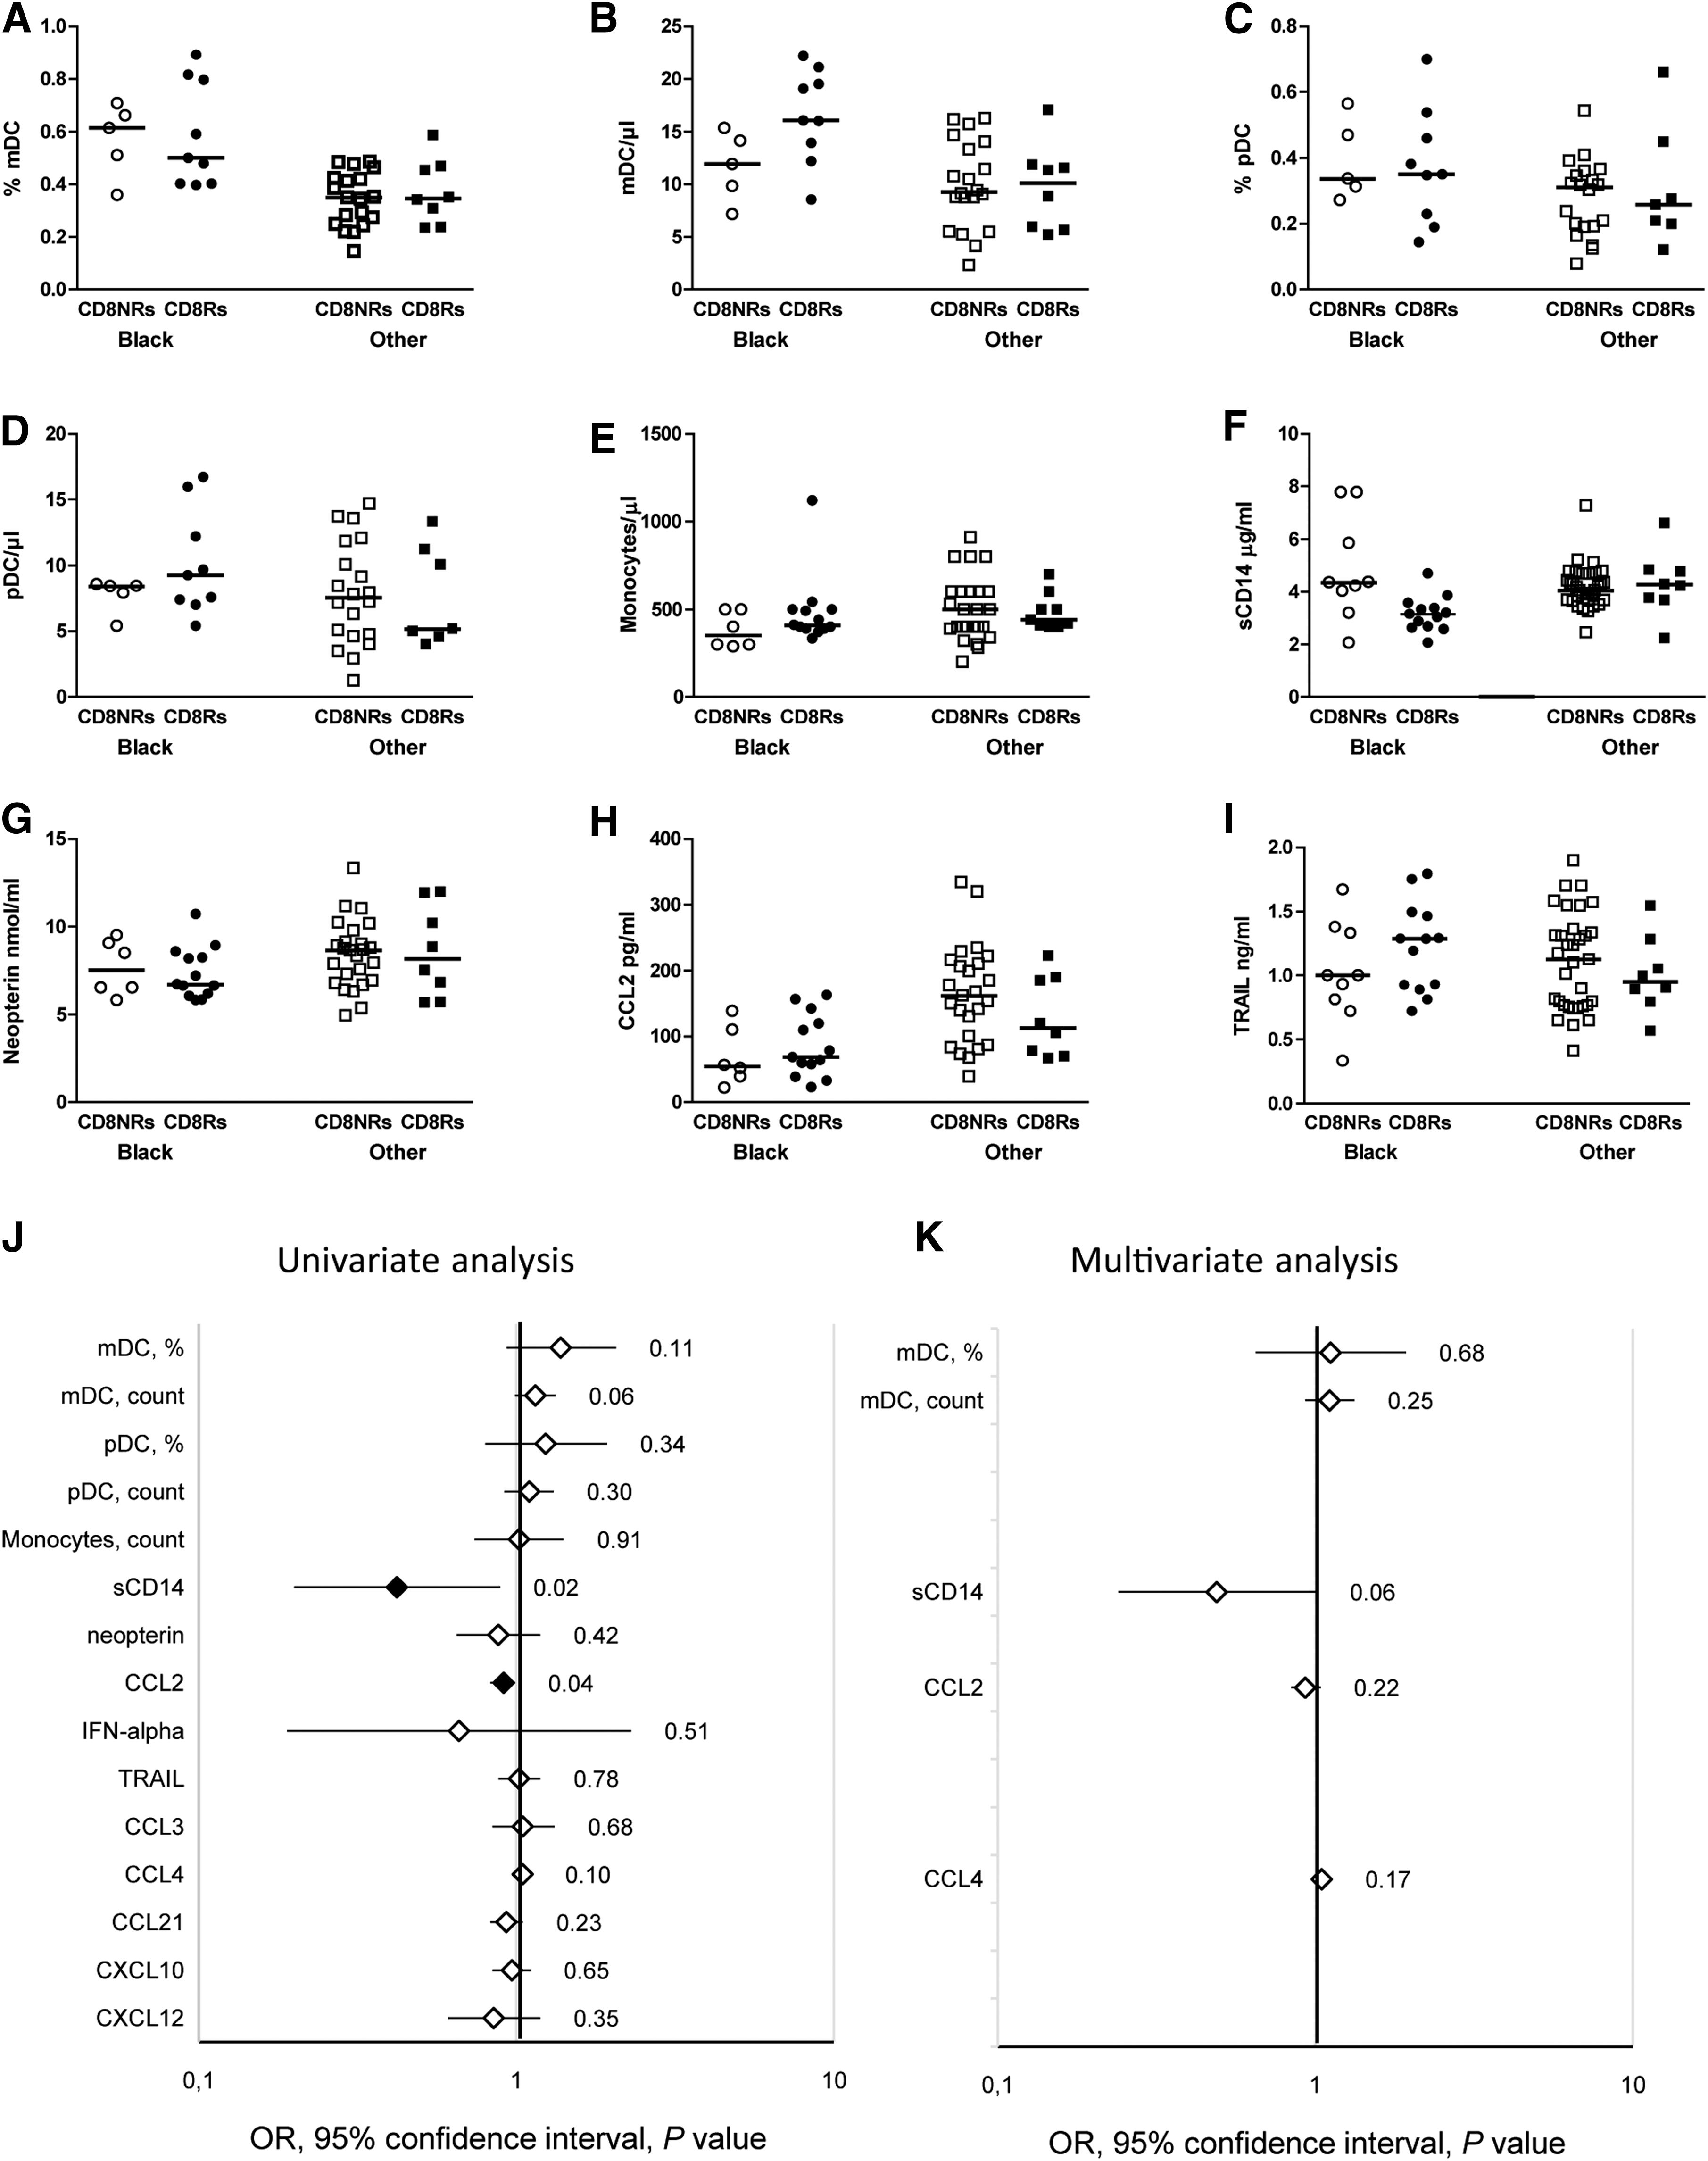
Gag-specific CD8 T cell proliferation is associated with plasma activation markers. Immune parameter levels are presented according to Gag-specific T cell proliferation, and they are stratified by ethnicity. Open and closed symbols represent CD8NRs and CD8Rs, respectively; circles and squares indicate black patients and patients from other ethnic groups, respectively. Myeloid cell phenotyping data were available for 42 patients (black: 14; other: 28), monocyte count was available for 53 patients (black: 19; other: 34), and plasma cytokine evaluations were available for 52 patients (black: 19; other: 33).
Discussion
The ANRS-EP38-IMMIP focused on the first generation of youths with perinatally acquired HIV-1 infection. We previously reported that Gag-specific CD4 and CD8 T cell proliferation is more frequent in black patients than in patients from other groups. 2 We now expand these findings by showing that Gag-specific CD4 T cell proliferation is associated with higher levels of pDCs.
The association between pDC levels and HIV-specific CD4 T cell proliferation may reflect the in vivo cross-talk between innate and adaptive immunity. 9 DC depletion in infected children is similar to that of patients infected as adults, 10 –14 and these cells had reduced T cell stimulatory activity. 15,16 On treatment, viral suppression allows the quantitative and functional restoration of DCs, but to levels usually below those of uninfected controls. 17,18 Our data suggest that functional restoration of CD4 HIV-specific T cells may be limited by that of DCs.
In vivo, non-progressive HIV infection is associated with a high capacity of DCs to stimulate T cell proliferation. 19 In addition, DCs induce a higher frequency of responding T cells than PBMCs loaded with the same antigen in in vitro assays, 20,21 and the transduction of APCs with costimulatory molecules enhances HIV-specific T cell proliferation. 22,23 In adults, pDCs and HIV-specific CD8 T cell frequencies are independent predictors of the viral set-point in the context of planned antiretroviral treatment interruption, and the effect of pDCs appears to be related to the presence of HIV-specific CD8 T cells. 24 However, in our study, we observed the association between pDCs and HIV-specific CD4 T cell proliferation but not between pDCs and HIV-specific CD8 T cell proliferation.
We report the association between Gag-specific CD4 and CD8 T cell proliferation and low levels of myeloid cell activation plasma markers. sCD14 exerts a immunoregulatory function: It suppressed mitogen and antigen-specific T cell proliferation in PBMCs on binding to the surface of monocytes. 25,26 Despite previous reports showing alterations in T cell migration in HIV-infected patients, 27 –30 we observed only a modest trend for the association between Gag-specific T cell proliferation and plasma chemokine levels. This may be because T lymphocytes interact with chemokines that are bound to extracellular matrix molecules or to the surface of endothelial and stromal cells 8 or our study lacked sufficient statistical power to detect modest associations.
Finally, we report that youths of black ethnicity have higher levels of DCs and lower levels of activation and inflammation markers than youths of other ethnicities. A study that compared adults from Uganda and the United Kingdom found no difference in DC levels. 31 However, lower CCL2 levels were reported in African American than in Caucasian patients. 32 Both DCs and immune activation levels may contribute to stronger T cell responses in patients of black ethnicity in our study. This may also be true for other studies that reported stronger HIV or HCV-specific T cell responses in black individuals than in individuals from other races living in a similar environment. 33 –36
These differences in plasma CCL2 levels observed between ethnic groups may be related to different frequencies of patients carrying genetic polymorphisms. As an example, the −2581A/G polymorphism in the promoter of the ccl2 gene affects protein expression that is associated with tuberculosis risk in certain ethnic groups. 37 Other polymorphisms in the ccl2 gene coding sequence have been described in West Africans. 38 To the best of our knowledge, the impact of these genetic polymorphisms on the quantification of plasma CCL2 levels by the currently available assays is unknown, and such knowledge would be relevant for further biomarkers studies. Overall, our results suggest that ethnicity may affect the capacity of DCs to produce immune activation molecules and to respond to activation and inflammatory signals.
The strength of our study has been to compare biological differences among patients of various ethnic origins, who shared similar exposure to the virus, access to treatment, and environmental factors. This study has some limitations. First, we cannot exclude that some differences in immune restoration may be affected by non-biological factors such as socioeconomic factors that affect access to care, although there were no major differences in HIV infection history for either ethnic group, as discussed in Ref. 2 Unfortunately, there were no genetic studies, and no HLA-tissue typing, as specific consent is required for genetic investigations in France. We did not include such tests as a requirement for inclusion in the study, as we were concerned that this would have reduced the willingness of subjects to participate. For the biological variables presented in this study, patients from sub-Saharan Africa had values similar to those from patients from the Caribbean, but different from those of patients of other ethnic origins (data not shown). Therefore, these patients were compared with all patients of other ethnicities. The small number of patients in the Caribbean, North Africa, and Asia groups precluded their independent analysis. Finally, this was an exploratory analysis; the sample size was sufficient for the results to be conclusive for some but not all immune parameters tested.
We provide new information on higher DC levels related to both the black ethnic background and the recovery of HIV-specific CD4 T cell proliferation under cART. Our results highlight the need to expand our knowledge on the impact of ethnicity on immune-mediated clinical events, such as the immune reconstitution syndrome, and on potentially useful immune markers for clinical management, such as sCD14.
Footnotes
Acknowledgments
Peptides were provided by the NIH AIDS Research and Reference Reagent Program. The authors are grateful to all the patients who agreed to participate in this study. They wish to thank the nurses and staff members from the various clinical sites. They would also like to thank Sandrine Leveillé (Hôpital Robert Debré), Geneviève Vaudre (Hôpital Trousseau), Sylvie Tassi (Hôpital Jean Verdier), Nora Boudjoudi (Hôpital Port Royal), Marie-Christine Mourey (Hôpital Necker), Thierry Wack (CESP INSERM U1018), Yassine Benmebarek, and Naima Bouallag-Bonnet (former members of CESP INSERM U1018). They thank Yves Rivière for his role in this collaborative work; Elisabeth Monchâtre, Pauline Louche, and Céline Clairet for their expert technical assistance. This text has been verified by a native English speaker. This work was supported by the 2006-232 and 2009-165 grants from the “Agence Nationale de recherche sur le SIDA et les Hépatites” (ANRS,
Author Disclosure Statement
No competing financial interests exist.
References
Supplementary Material
Please find the following supplemental material available below.
For Open Access articles published under a Creative Commons License, all supplemental material carries the same license as the article it is associated with.
For non-Open Access articles published, all supplemental material carries a non-exclusive license, and permission requests for re-use of supplemental material or any part of supplemental material shall be sent directly to the copyright owner as specified in the copyright notice associated with the article.