




Abstract
Laboratory tests that can distinguish recent from long-term HIV infection are used to estimate HIV incidence in a population, but can potentially misclassify a proportion of long-term HIV infections as recent. Correct application of an assay requires determination of the proportion false recents (PFRs) as part of the assay characterization and for calculating HIV incidence in a local population using a HIV incidence assay. From April 2009 to December 2010, blood specimens were collected from HIV-infected individuals attending nine outpatient clinics (OPCs) in Vietnam (four from northern and five from southern Vietnam). Participants were living with HIV for ≥1 year and reported no antiretroviral (ARV) drug treatment. Basic demographic data and clinical information were collected. Specimens were tested with the BED capture enzyme immunoassay (BED-CEIA) and the Limiting-antigen (LAg)-Avidity EIA. PFR was estimated by dividing the number of specimens classified as recent by the total number of specimens; 95% confidence intervals (CI) were calculated. Specimens that tested recent had viral load testing performed. Among 1,813 specimens (north, n = 942 and south, n = 871), the LAg-Avidity EIA PFR was 1.7% (CI: 1.2–2.4) and differed by region [north 2.7% (CI: 1.8–3.9) versus south 0.7% (CI: 0.3–1.5); p = .002]. The BED-CEIA PFR was 2.3% (CI: 1.7–3.0) and varied by region [north 3.4% (CI: 2.4–4.7) versus south 1.0% (CI: 0.5–1.2), p < .001]. Excluding specimens with an undetectable VL, the LAg-Avidity EIA PFR was 1.2% (CI: 0.8–1.9) and the BED-CEIA PFR was 1.7% (CI: 1.2–2.4). The LAg-Avidity EIA PFR was lower than the BED-CEIA PFR. After excluding specimens with an undetectable VL, the PFR for both assays was similar. A low PFR should facilitate the implementation of the LAg-Avidity EIA for cross-sectional incidence estimates in Vietnam.
Introduction
T
Identifying subpopulations at high risk for new HIV infection is critical for halting the transmission of HIV. Currently most HIV programs worldwide track the epidemic by monitoring trends in HIV prevalence in a population. Although prevalence is an important measure, it provides a limited understanding of the most recent spread of infection or HIV incidence. HIV incidence can identify current transmission dynamics to effectively target interventions and allocate resources. In addition, HIV incidence provides data for evaluating the success of prevention programs. 3 However, obtaining HIV incidence rates have been challenging. Longitudinal prospective cohort studies are the gold standard for estimating HIV incidence, yet they are lengthy, costly, complicated, and may be unrepresentative of the general population due to self-selective enrollment of participants, among other issues. 3 In response, laboratory assays were developed that can distinguish recent from long-term HIV infection based on immunologic markers of disease progression and can be applied to cross-sectional surveys to estimate HIV incidence. 4 The World Health Organization's (WHO) guidelines for estimating HIV incidence in the population have incorporated the use of one or more tests as part of an algorithm to estimate cross-sectional HIV incidence. 3
A significant limitation of current HIV incidence laboratory assays is that they overestimate HIV-1 incidence by misclassifying a proportion of individuals with long-term infection (defined in this study as infection ≥1 year) as recent infection, which can lead to errors in incidence estimations. 4,5 The proportion of individuals with long-term infection that misclassify as recent infection on the incidence assay is termed in this study as the assay's proportion false recent (PFR). Because the PFR has been shown to vary significantly by population, HIV subtype, 6 HIV epidemic phases, 7 individual immune status, and antiretroviral (ARV) use, 8 –10 current guidance for estimating incidence recommends that countries determine a local PFR that can be incorporated into the incidence formula for calculating HIV incidence. 3,11 Low viral loads among HIV-infected persons as a result of ARV treatment and among those who naturally maintain an undetectable viral load in the absence of treatment (also known as “elite controllers”) will misclassify as false recent on incidence assays that rely on HIV antibodies to determine recent infection. Experts in the field of HIV incidence assay development recommend that a PFR for a HIV incidence assay not exceed 2% to produce reliable incidence estimates. 6
At the time of this study, the BED capture enzyme immunoassay (BED-CEIA) was the only commercially available assay, and the Limiting-antigen (LAg)-Avidity EIA was in development. However, the new single-well LAg-Avidity EIA was recently described to distinguish recent from long-standing HIV infections for the purpose of estimating incidence in cross-sectional populations. 12 Briefly, the BED-CEIA measures the proportion of anti-HIV IgG relative to total IgG. As anti-HIV IgG increases with time, a lower proportion of anti-HIV IgG to total IgG would indicate a recent infection. 13,14 In contrast, the LAg-Avidity EIA determines the avidity or “binding strength” of the HIV-1 antibodies. Because antibodies mature and become more specific over time, antibodies from a recently infected individual would have a weaker binding strength to the virus than an individual infected for a longer duration. 12,15 While the BED-CEIA has shown relatively high PFR in a standardized multiclade specimen set derived from persons with long-standing HIV infection, the PFR for the LAg-Avidity EIA has been shown to be substantially lower in the same samples. 16 However, subtype-specific PFR for clade A/E, which predominates in South East Asia, was not included in this evaluation. The purpose of this study was to determine the applicability of the LAg-Avidity EIA and the BED-CEIA in Vietnam by determining the PFR for each assay.
Methods
Study population
This cross-sectional study was conducted from April 2009 to December 2010 in nine purposively selected outpatient clinics (OPCs) in the northern (n = 4) and southern regions (n = 5) of Vietnam. Eligible participants were 18 years of age or older, had a confirmed HIV infection for ≥1 year based on initial HIV diagnosis date, and self-reported no ARV use. A sample size of 1,917 specimens was calculated using the BED-CEIA parameters and assuming an expected PFR of 5% (based on previously published studies), measured with precision of 1% (precision was defined as half the width of the confidence interval), and a refusal rate of 5%. 13,17 –19
Specimen collection
After informed consent was provided, a venous blood sample was collected from each individual, and a chart review was conducted to obtain data on demographics, HIV risk factors, opportunistic infections (OIs), and CD4 count. CD4 count was based on the most recent CD4 result documented in the medical chart at the time of enrollment. The whole blood was processed into plasma aliquots by centrifuging the sample at 3,000 rpm for 10 min and stored at −70°C.
Laboratory testing for recent HIV-1 infection
Specimens were tested with the LAg-Avidity EIA and BED-CEIA according to the manufacturer's instructions (both manufactured by Sedia BioSciences, Portland, Oregon). Normalized optical density (ODn) cutoffs of 1.5 for LAg-Avidity EIA and 0.8 for BED_CEIA were used to distinguish recent from long-term HIV infection. Specimens with final ODn values at or below the ODn cutoff for each respective assay were classified as recent infections, while those with values above the ODn cutoff were classified as long-term infections. BED-CEIA testing was conducted by the Vietnam National Institute of Hygiene and Epidemiology (NIHE) and the Ho Chi Minh City Pasteur Institute (HCMC PI). The LAg-Avidity EIA testing was performed at the Centers for Disease Control and Prevention (CDC) in Atlanta, Georgia, where specimens were tested in duplicate runs to increase confidence of results irrespective of their ODn levels. The mean ODn value was used for final classification. All specimens classified as recent with ODn values lower than 0.4 and 0.3 by the LAg-Avidity EIA and BED-CEIA, respectively, were further tested by western blot to confirm HIV seropositivity at the CDC. All specimens that classified as recent and that had sufficient volume underwent additional testing, including HIV subtyping, viral load analysis, and detection of ARV drugs at the CDC.
HIV-1 subtyping
Subtyping was performed on a random sample of 100 specimens. Nucleic acid was isolated from 200 μL plasma samples using the NucliSENS® system for lysis and extraction (BioMerieux). Nucleic acid was eluted in 25 μL of NucliSENS Extraction Buffer 3 and either immediately used for RT-PCR or stored at −80°C until use. Subtyping of the HIV-1 envgp41 gene was performed following the procedure of a broadly sensitive CDC in-house assay as described in detail previously with the exception of using envgp41 primers as described before. 20,21 The ReCALL software program was used to edit the raw sequences and generate consensus sequences. 22
HIV-1 subtyping for the newly obtained sequences was performed using the REGA HIV-1 Genotyping Tool.
23
Phylogenetic analyses were further conducted using neighbor-joining method included in the MEGA 5 for sequences with unclassifiable subtypes.
23
Reference sequences were obtained from the Los Alamos HIV Database (
Viral load testing
Quantification of plasma RNA was determined using the Abbott RealTime m2000 platform. Due to low sample volumes, plasma samples were diluted fourfold in serum base matrix, resulting in a limit of detection of 600 copies/mL. Specimens with viral load <1,000 copies/mL were considered to have a low viral load.
Detection of ARV drugs
Specimens that classified as recent infection by either assay were tested for the detection of antiretroviral drugs to ensure that individuals were indeed ARV-naive. Antiretroviral (ARV) drugs from first-line regimens in Vietnam [Nevirapine (NVP), Efavirenz (EFV), and Lamivudine (3TC)] were measured in plasma simultaneously by high-performance liquid chromatography–tandem mass spectrometry (HPLC-MS/MS). Drugs from 100 μL of plasma were extracted with 370 μL of acetonitrile containing 270 ng/mL each of the internal standards [NVP-d5 (TRC) for NVP, EFV-d4 (TRC) for EFV, and FTC- 13C 15 N2 (Moravek Biochemicals and Radiochemicals) for 3TC]. Protein precipitates were removed by centrifugation, and the liquid extracts were transferred to the wells of a 96-well polypropylene plate and then evaporated to almost dryness in a vacuum concentrator and reconstituted with 150 μL of mobile phase A (0.1% formic acid in water). A volume of 15 μL of the final processed sample was injected into a Shimadzu Prominence HPLC system, connected to a model 3200 QTRAP mass spectrometer (AB Sciex) that was used to detect the compounds of interest. Data were processed using Analyst 1.5.1 (AB Sciex). The limit of quantification (LOQ) was 25 ng/mL for NVP and 10 ng/mL for both EFV and 3TC.
Calculation of PFR
The PFR was estimated by dividing the number of specimens testing recent on the assay by the total number of specimens in the study population. The PFR was calculated for each assay by select demographic and clinical characteristics and stratified by geographic region (northern versus southern) and clinic. We used the term PFR instead of false recent rate (FRR) as the latter implies a time factor which was not addressed in this study. Statistical significance was assessed using t-test, chi-square, McNemar, and Fisher's exact tests, where indicated. p-values of <.05 were considered statistically significant. Confidence intervals were calculated using the Wilson score interval procedure. Multivariate analysis was not conducted as the study was not powered for such analysis. Data forms were double entered into EpiData by NIHE and HCMC PI. Data analyses were conducted using Stata version 10.0 (StataCorp) and SAS version 9.2 (SAS Institute).
Ethical considerations
The protocol was reviewed and approved by the Institutional Review Boards of CDC and NIHE. Because these incidence assays may not be accurate at the individual level and are approved for surveillance use only, individual-level data were not linked to any identifiers and test results were not returned to participants. Specimens and data forms were labeled with unique study identification (ID) numbers, which were used to merge clinical data and incidence assay results.
Results
Characteristics of the study population
A total of 1,935 samples were collected (north, n = 1,030; south, n = 905). After excluding specimens with missing data, duplicates, and from individuals not meeting the inclusion criteria, including those who were classified as recent but were positive for ARV drugs, the final sample size for analysis was 1,813.
Table 1 shows the demographic, clinical, and risk factor characteristics of the population enrolled in the study. There were regional differences in the age distribution (north: 30.6% were aged ≥35 years versus south: 16.2%); CD4 cell count (north: 28.5% had CD4 count <200 cells/mm3 compared to south: 15.8%); and duration of HIV infection (north: 30.9% had documented HIV infection >3 years compared to south: 11.5%). There were limited data on OIs; however, the most common documented OI was TB (11.2% of the study population).
IDU, injection drug users; FSW, female sex workers; MSM, men who have sex with men;
Determination of PFRs
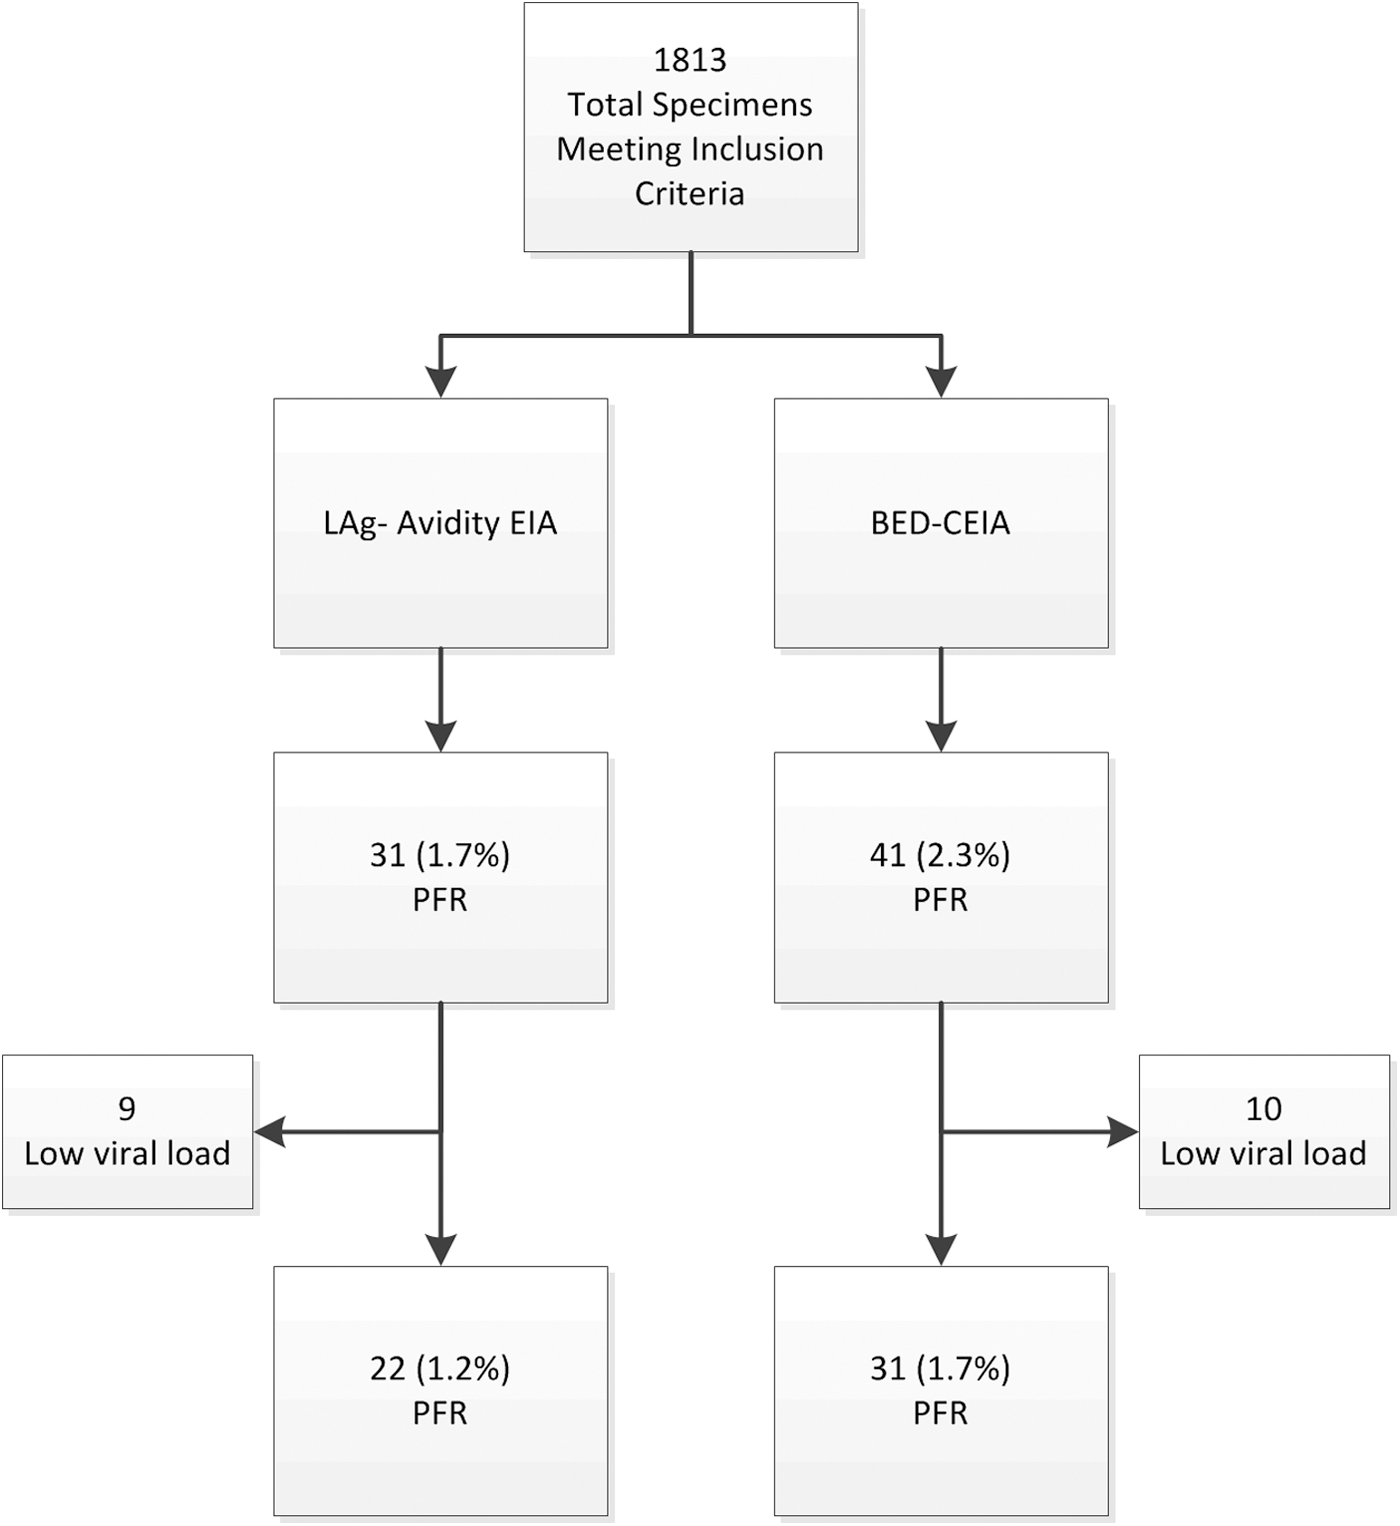
Overall, 31 of 1,813 specimens (1.7%: CI: 1.2–2.4) were classified as recent by the LAg-Avidity EIA (Table 2), and 41 (2.3%: CI: 1.7–3.1) were classified as recent by the BED-CEIA. Twenty-four (77.4%) of 31 LAg-recents were also recent by the BED-CEIA; seven specimens testing recent on the LAg-Avidity EIA did not test as recent on the BED-CEIA. All specimens classified as false recent by either LAg-Avidity EIA or BED-CEIA were recombinant subtype CRFO1_AE. The LAg-Avidity EIA or BED-CEIA PFRs were not statistically significantly different (p-value .06).
McNemar p-value .06.
95% confidence interval calculated using Wilson score interval procedure.
BED-CEIA, BED capture enzyme immunoassay.
Analyses of PFRs
Table 3 summarizes the BED-CEIA PFR, by selected demographic and clinical characteristics, stratified by region. Thirty-two of 942 (3.4%, CI: 2.4–4.7) specimens from the north were false recent compared to 9 of 873 (1.0%, CI: 0.5–1.2) specimens from the south (p < .001). Within northern specimens, the BED-CEIA PFR was similar between sex (3.4% and 3.5% for specimens from men and women, respectively), while within southern specimens, more specimens from women (1.7%) were classified as false recent compared to those from men (0.2%). The differences in PFR by clinical characteristics and risk groups were not significant, and the differences in PFR between OIs were not analyzed due to zero cells.
NA, not applicable.
Table 4 summarizes the PFR for LAg-Avidity EIA and by select demographic and clinical characteristics, stratified by region. Twenty-five of 942 (2.7%, CI: 1.8–3.9) specimens from the north misclassified as recent compared to 6 of 871 (0.7%, CI: 0.3–1.5) from the south (p = .002). There were no statistically significant differences in demographic and clinical characteristics between regions. However, specimens from individuals living with HIV for 1–2 years had a higher proportion of misclassified specimens (2.0% vs. 1.5% among those infected >2 years).
NA, not applicable.
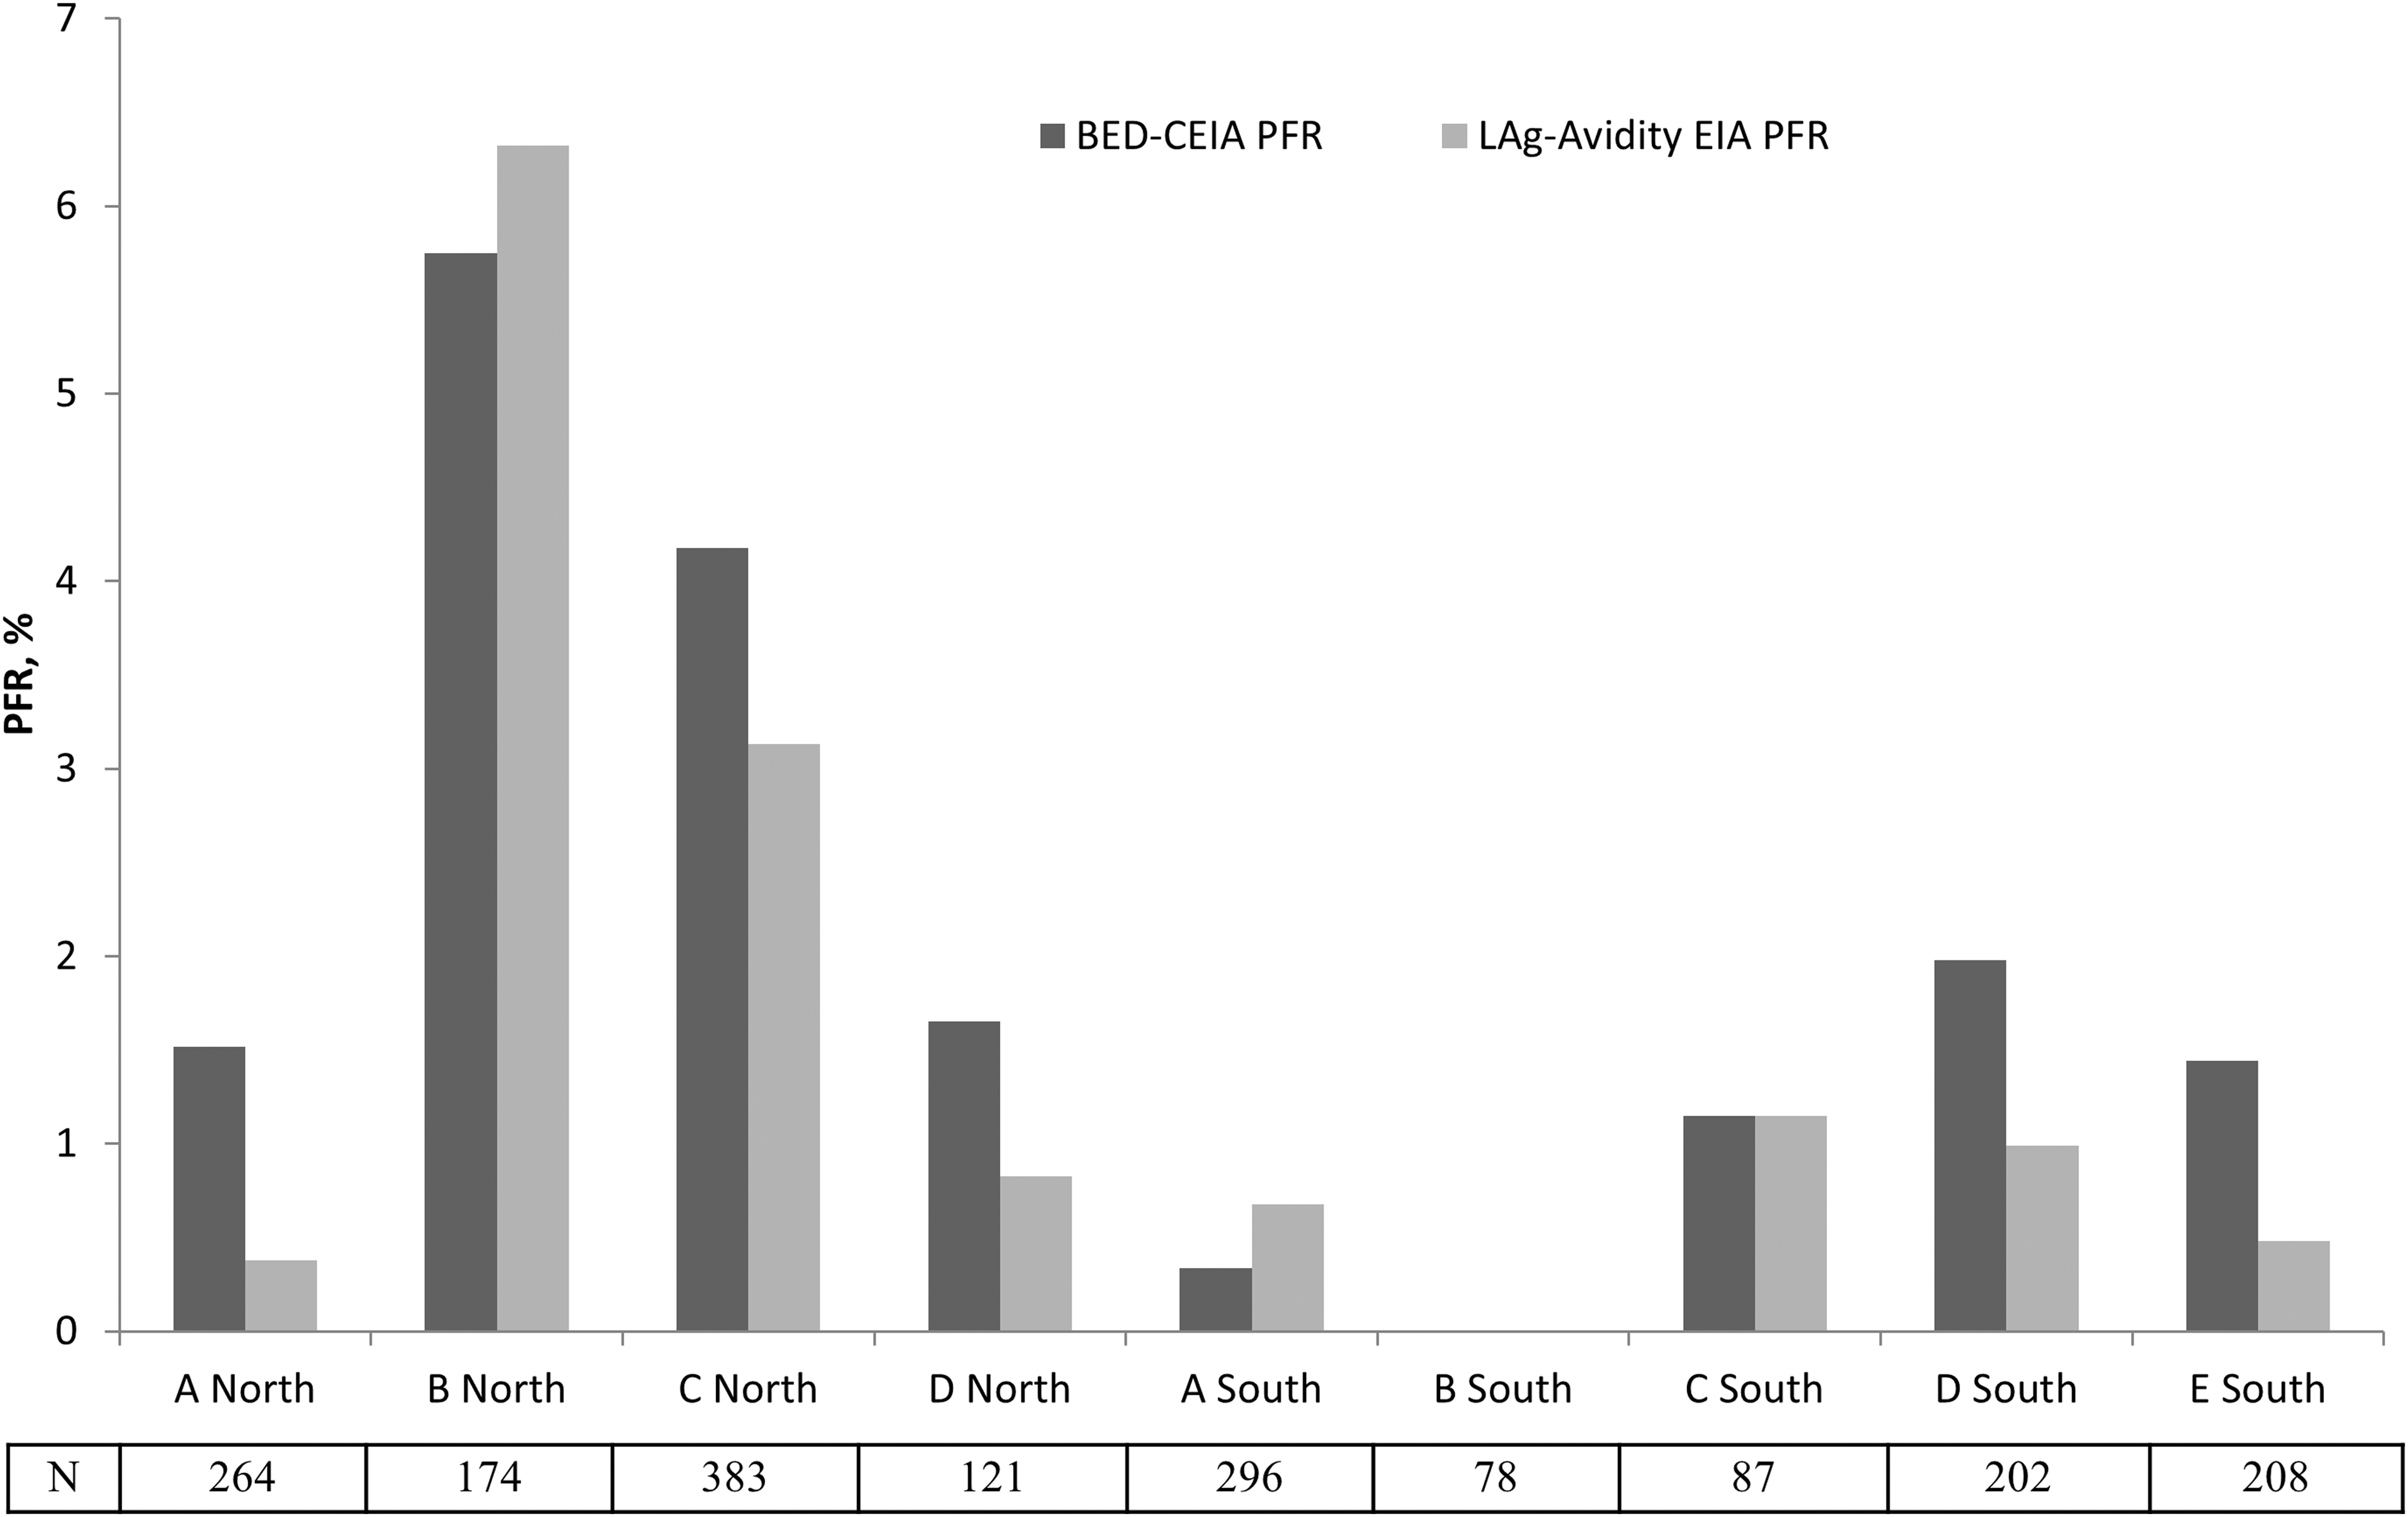
For both assays, the PFR differed significantly by region with northern clinics having a higher PFR on both assays (Table 2). The PFR for both assays differed significantly among the northern clinics (p < .05, Fig. 1). The BED-CEIA PFR for northern clinics B (5.8%; CI: 3.2–10.3) and C (4.2%; CI: 2.6–6.7) was high compared to northern clinics A (1.5%; CI: 0.6–3.8) and D (1.7%; CI: 0.5–5.8). Specimens from northern clinic B (6.3%; CI: 3.6–11.0) had a higher LAg-Avidity EIA PFR compared to northern clinics A (0.4%; CI: 0.1–2.1), C (3.1%; CI: 1.8–5.4), and D (0.8%; CI: 0.2–4.5). The southern clinics had a similar PFR for both the LAg-Avidity EIA and BED-CEIA (p > .1).
The PFR for the LAg-Avidity EIA and the BED-CEIA by clinic site, Vietnam 2009–2010. PFR, proportion false recent;
Residual PFR
Among false-recent specimens, 10 specimens on BED-CEIA and 9 specimens on LAg-Avidity EIA had HIV-1 RNA <1,000 copies/mL (low viral load, Fig. 2). After excluding specimens with low viral load, the residual PFR for BED-CEIA was 1.6% (CI: 1.2–2.4) and for LAg-Avidity EIA was 1.2% (CI: 0.8–1.9) and not significantly different. Regionally, the residual BED-CEIA PFR was 2.0% (CI: 1.3–3.2) for the north and 0.3% (CI: 0.1–1.0) for the south. Similarly, the residual LAg-Avidity EIA PFR was 2.8% (CI: 1.9–4.0) for the north and 0.6% (CI: 0.3–1.4) for the south.
PFR algorithm for the LAg-Avidity EIA and BED-CEIA excluding ARV and ARV plus viral load, Vietnam 2009–2010. ARV, antiretroviral.
Discussion
This is the first study to estimate the PFRs in Southeast Asia for both the LAg-Avidity EIA and BED-CEIA from the same population. Although there was no statistically significant difference between the two assays, the point estimates for the LAg-Avidity EIA PFR were lower than the BED-CEIA, which complements previous demonstrations of improved performance characteristics of the LAg-Avidity EIA compared with the BED-CEIA. 16,25 The better performance of LAg-Avidity EIA is likely attributed to the design of the assay to measure HIV antibody avidity compared to the BED-CEIA, which is a capture EIA that measures the proportion of anti-HIV IgG to total IgG.
After accounting for low viral loads, the PFR decreased to 1.2% for the LAg-Avidity EIA and 1.7% for the BED-CEIA. Both the LAg-Avidity EIA and the BED-CEIA PFR were consistent with recent literature. 26,27 The BED-CEIA PFR is the same as was reported from samples collected only from HCMC in southern Vietnam, however, was lower than previously reported in other populations. 27 –30 The LAg-Avidity EIA was lower than the AxSYM avidity index assay FRR of 2.7% from the HCMC study. 27 The difference in PFR after excluding individuals with low viral loads demonstrates how individuals with long-term infection who are elite controllers with naturally low or undetectable viral loads or potential individuals on ARV therapy who have low antibody levels can misclassify as recent on antibody-based assays. 5,31,32 Therefore, to obtain accurate incidence estimates using current incidence assays, misclassification from low viral loads should be expected and accounted for in a recent infection testing algorithm. Although a residual PFR may still be present after these adjustments, in the context of Vietnam, given that the level of the PFR fell within the WHO recommended threshold (<2%), further adjustments may not be needed.
For example, we demonstrate the impact of the LAg-Avidity PFR on HIV incidence estimates in a key population at high risk for HIV exposure in Vietnam, persons who inject drugs (PWID) using a hypothetical example based on epidemiological data in this population. 33 For this hypothetical example, the MDRI estimates were not adjusted to account for viral load. If we assume that in a sample of 1,000 PWID from the Northern region of the country, 11% are HIV positive and 10% of these are recent on the LAg Avidity, HIV incidence would be 2.4% (CI: 0.9–3.8) using no PFR, 1.9% (CI: 0.4–3.5) using our observed PFR 2.7%, and 2.1% (CI: 0.6–3.6) using our observed residual PFR of 2.0%. Similar calculations for the BED-CEIA would yield an incidence of 2.2% (CI: 0.8–3.6) using no PFR and 1.5% (CI: 0.2–2.9) using our observed PFR 3.4% and 1.7% (CI: 0.3–3.0). The minimal differences observed between the incidence estimates after further exclusion of low viral loads in our study and in the above example suggest that for this hypothetical PWID population example in Vietnam, the inclusion of viral load in the recent infection testing algorithm may not be warranted. Finally, similar to other evaluations, we found that specimens classified as false recent by the LAg-Avidity EIA assay were also false recent on the BED-CEIA 12,15 and a two-test algorithm using the BED-CEIA as the screening assay followed by LAg-Avidity EIA as the confirmatory assay would result in a PFR of 2.2%, which is not significantly different compared to LAg-Avidity EIA alone.
There were statistically significant regional differences in the BED-CEIA and LAg-Avidity EIA PFR between north and south Vietnam and differences by northern clinic site. The differences in age, CD4 count, and duration of HIV infection in the north compared to the south confirm regional differences between the populations of HIV-infected people in care. All false-recent cases were HIV-1 subtype AE, the most dominant subtype in the region, confirming that HIV-1 clade did not contribute to observed regional differences in the PFR. However, there were differences in the PFRs by clinic site suggesting differing populations by OPCs.
This study was subject to several limitations. The majority of the misclassified specimens were from the two northern clinics. In combination, this suggests there may be clinic-specific biases related to data quality from these clinics. This study was not powered to detect differences in the PFR by site of enrollment and demographic and clinical characteristics in the northern and southern regions separately. Furthermore, determining a site-specific PFR is not feasible given the large sample size needed to determine a PFR. Participants were recruited at the point of care at the HIV clinic, and therefore, results are not generalizable to the entire population of persons living with HIV in Vietnam. Furthermore, the southern region was represented only by one province, Ho Chi Minh City, whereas in the northern region, samples were collected from three provinces. Although no population level samples are available to determine a more generalizable PFR, our results are consistent with results from a study in China showing a LAg-Avidity EIA FRR of 1.1% and HCMC showing a BED-CEIA FRR of 1.7%. Finally, since data on OIs were limited, we were unable to assess possible associations between OI and false-recent classification that may be associated with false-recent misclassification due to advanced HIV status and decreased antibody response.
We are continuing to examine the application of the LAg-Avidity EIA in cross-sectional population in Vietnam and elsewhere to assess its utility in providing accurate incidence estimates and trends over time. Use of the PFR may result in an over, under, or even a negative estimate of incidence if the PFR is not derived from a population similar to the one that is being surveyed for incidence estimation or if the PFR is elevated due to sample bias (e.g., ARV use). Therefore, caution should be taken during study design for HIV incidence estimation and sample collection to minimize potential biases. As suggested by the WHO recommendations, a multiassay algorithm that incorporates testing for viral load at a minimum, and testing for ARV drugs where feasible, should be conducted to minimize false recency. 34 The data presented in this study are consistent with a previously described low PFR for the LAg-Avidity EIA and demonstrate a low PFR for the BED-CEIA. 12 Therefore, we believe that both assays have the potential to provide accurate HIV-1 incidence in cross-sectional populations in Vietnam. However, when ARV and viral load testing are not available, because the PFR was slightly lower with the LAg-Avidity EIA (1.7% versus 2.3% with the BED-CEIA without VL testing), the LAg-Avidity EIA should be used for cross-sectional incidence assays and for impact evaluation of combination prevention programs being implemented to reduce the transmission of HIV in Vietnam. Finally, at this time we do not know if the PFR is stable over time and more research is needed to better understand if there is variability to the PFR as HIV epidemic change.
Footnotes
Acknowledgments
The authors thank all those who participated in study and the local organizations that assisted with study enrollment and data collection.
Disclaimer
The findings and conclusions in this article are those of the authors and do not necessarily represent the official position of the Centers for Disease Control and Prevention.
Author Disclosure Statement
No competing financial interests exist.