
Abstract
We compared the behavior of two approaches (Cluster Picker and HIV-TRACE) at varying genetic distances to identify transmission clusters. We used three HIV gp41 sequence datasets originating from the Rakai Community Cohort Study: (1) next-generation sequence (NGS) data from nine linked couples; (2) NGS data from longitudinal sampling of 14 individuals; and (3) Sanger consensus sequences from a cross-sectional dataset (n = 1,022) containing 91 epidemiologically linked heterosexual couples. We calculated the optimal genetic distance threshold to separate linked versus unlinked NGS datasets using a receiver operating curve analysis. We evaluated the number, size, and composition of clusters detected by Cluster Picker and HIV-TRACE at six genetic distance thresholds (1%–5.3%) on all three datasets. We further tested the effect of using all NGS, versus only a single variant for each patient/time point, for datasets (1) and (2). The optimal gp41 genetic distance threshold to distinguish linked and unlinked couples and individuals was 5.3% and 4%, respectively. HIV-TRACE tended to detect larger and fewer clusters, whereas Cluster Picker detected more clusters containing only two sequences. For NGS datasets (1) and (2), HIV-TRACE and Cluster Picker detected all linked pairs at 3% and 4% genetic distances, respectively. However, at 5.3% genetic distance, 20% of couples in dataset (3) did not cluster using either program, and for >1/3 of couples cluster assignment were discordant. We suggest caution in choosing thresholds for clustering analyses in a generalized epidemic.
Introduction
V
Transmission clusters of HIV infections are typically defined using either genetic distances among sequences 4 or genetic distances in addition to branch support values (e.g., bootstrap values). 3 However, genetic distance and branch support cutoffs markedly vary between studies and the rationale for a given cluster definition is rarely specified. 10 –15 Many factors can influence the choice of genetic distance and branch support cutoff values used to define clusters, such as the spatial and temporal scale of analysis, HIV subtype, the underlying mode of transmission (e.g., heterosexual vs. injection drug use), and the viral genomic region(s) being analyzed. Branch support values may also be affected by the statistical model used to reconstruct the phylogenies (e.g., maximum likelihood, Bayesian) and the total amount of viral genetic diversity in the dataset. 10
In this study, we systematically compare two programs used to detect HIV-1 transmission clusters, Cluster Picker 12 and HIV-TRACE, 10 using three separate HIV-1 sequence datasets from HIV-infected participants in the Rakai Community Cohort Study (RCCS). Two of these datasets were generated using next-generation sequence (NGS) methods and included (1) sequential sequences from the same person and (2) sequences from epidemiologically linked heterosexual couples. We used these NGS data to establish appropriate genetic distance and bootstrap threshold values such that known linked sequences clustered together. We next compared the two programs using dataset (3), a cross-sectional population-based sequence dataset consisting of 1,022 RCCS participants. Specifically, the total number and composition of transmission clusters were characterized and then compared.
Materials and Methods
HIV-1 sequence datasets
All HIV-1 sequences used for this study were obtained from HIV-infected participants in the RCCS, a population-based HIV surveillance cohort (n = 15,000) established in southern Uganda in 1994. The RCCS surveys individuals aged 15–49 every 12–18 months, and collects detailed information on sexual behaviors and partnerships as well as healthcare-seeking behaviors and HIV status. 16 Serum samples are also collected for viral sequencing studies. The participation rate in the RCCS cohort is high: ∼90% of persons available at the time of survey agree to participate and the follow-up rate is ∼75% between survey rounds.
Three unique datasets of published HIV-1 sequences from RCCS participants were analyzed in this study. 17 –19 Datasets (1) and (2) contained viral sequences spanning a 325–330 base pair segments of the HIV gp41 gene, generated using the Roche 454 method. 17,18 Dataset (1) comprised of nine epidemiologically linked couples with prior evidence of a virally linked transmission event (donor and recipient). Couples were initially serodiscordant, but the second partner tested positive at a follow-up visit. NGS data were available from an early time point from the donor, and a later time point from both partners, corresponding to the first visit at which the recipient tested positive. 17
Dataset (2) was comprised of viral sequences from 14 HIV-positive individuals who were sampled at two different time points. These sequences were used in a previous study to determine the frequency of HIV superinfection in the RCCS. 18 Individuals who were previously determined to have experienced superinfection were excluded in this study, as the high intrapatient genetic diversity resulting from unrelated strains violates the underlying assumption that genetic diversity is a result of on-going evolution of the initially infectious strain. We refer to the couples and individuals collectively as “pairs.”
We also created two additional unlinked datasets by randomly shuffling the couples in dataset (1), and the individuals in dataset (2), while maintaining the same HIV subtype. The goal was to establish genetic distance threshold cut off values that best distinguish unrelated from related sequences. The NGS data had previously been compressed, so that all similar sequence reads were collapsed into one representative variant, with the overall frequency of the variant retained (Supplementary Table S1; Supplementary Data are available online at
Dataset (3) was derived from a cross-sectional phylogenetic study of the RCCS, and included one consensus sequence of the HIV gp41 region from a total of 1,022 individuals sampled between 2008 and 2009. 19 Consensus sequences were obtained using Sanger sequencing (gp41 fragment, HXB2 nt 7858 to 8260) as previously described. 20 Of the 1,022 individuals, 182 individuals were identified to be part of an epidemiologically linked heterosexual couple (91 couples), where either one or both partners named the other as a sexual partner. 19 Of these 91 couples, 28 were defined as “incident,” in which one (n = 21) or both (n = 7) partners were diagnosed with HIV during the intersurvey interval (∼1.5 years). Couples were defined as “prevalent” otherwise.
Genetic distance and receiver operating curve analysis
Pairwise distances were calculated using the Tamura-Nei 21 substitution model in the HIV-TRACE package. All other statistics were generated using the R statistical software (version 3.2.4). The receiver operating curve (ROC) was plotted, and the optimal genetic distance threshold was selected using both the closest point to the top left corner and the Youden's J statistic (where the optimal cut-off is the threshold that maximizes the distance to the identity line). 22 The area under the curve (AUC) was calculated to determine the prediction value of genetic distance, and the uncertainty calculated with the DeLong method. 23 We removed all intrasample distances to avoid biasing distributions toward lower distances.
Phylogenetic inference
We inferred maximum likelihood (ML) trees using combinations of the general time reversible (GTR) model for nucleotide substitution with gamma-distributed variation of rates among sites (+Γ 4 ) or the Hasegawa–Kishino–Yano (HKY) model +Γ 4 , and the nearest neighbor interchange (NNI) branch-swapping algorithm, both with and without the subtree pruning–regrafting (SPR) algorithm. Branch support was assessed using either 200 bootstrap replicates or the approximate likelihood ratio (aLRT) test. All ML analyses were conducted in PhyMLv3.0. 24 Trees were inferred for datasets (1) and (2) in two ways: first, by only using one variant from each individual/time point (46 sequences from 23 pairs), and second, by using all of the NGS variants (2,199 sequences from 23 pairs). Trees were inferred for dataset (3) with 1,022 Sanger sequences from 1,022 individuals.
Clustering
Two programs were used to identify clusters: Cluster Picker and HIV-TRACE. Cluster Picker [12] is a Java-based program available at:
Results
Genetic distance thresholds of 4%–5.3% separated linked and unlinked pairs
The interquartile range and median pairwise genetic distance between unlinked sequence datasets (i.e., the shuffled pairs) was much higher than in the linked sequence datasets (Fig. 1). Using ROC analyses, the optimal genetic distance threshold was calculated under four scenarios, using as cases/controls: (1) couples from dataset (1), at a single time point for each person in the pair/shuffled couples with two individuals not epidemiologically linked, but infected with the same subtype; (2) couples from dataset (1), with two time points for the donor and one time point for the recipient/shuffled couples; (3) individuals from dataset (2), with two longitudinal time points/shuffled individuals where two time points came from different individuals, but infected with the same subtype; and (4) all couples and individuals from datasets (1) and (2) combined/all shuffled pairs. In all cases, sensitivity and specificity were >94% with a genetic distance of 4%–5.3% and the AUC was >99% (Fig. 2 and Supplementary Table S2). We, therefore, used 5.3% as our highest threshold in subsequent analyses.
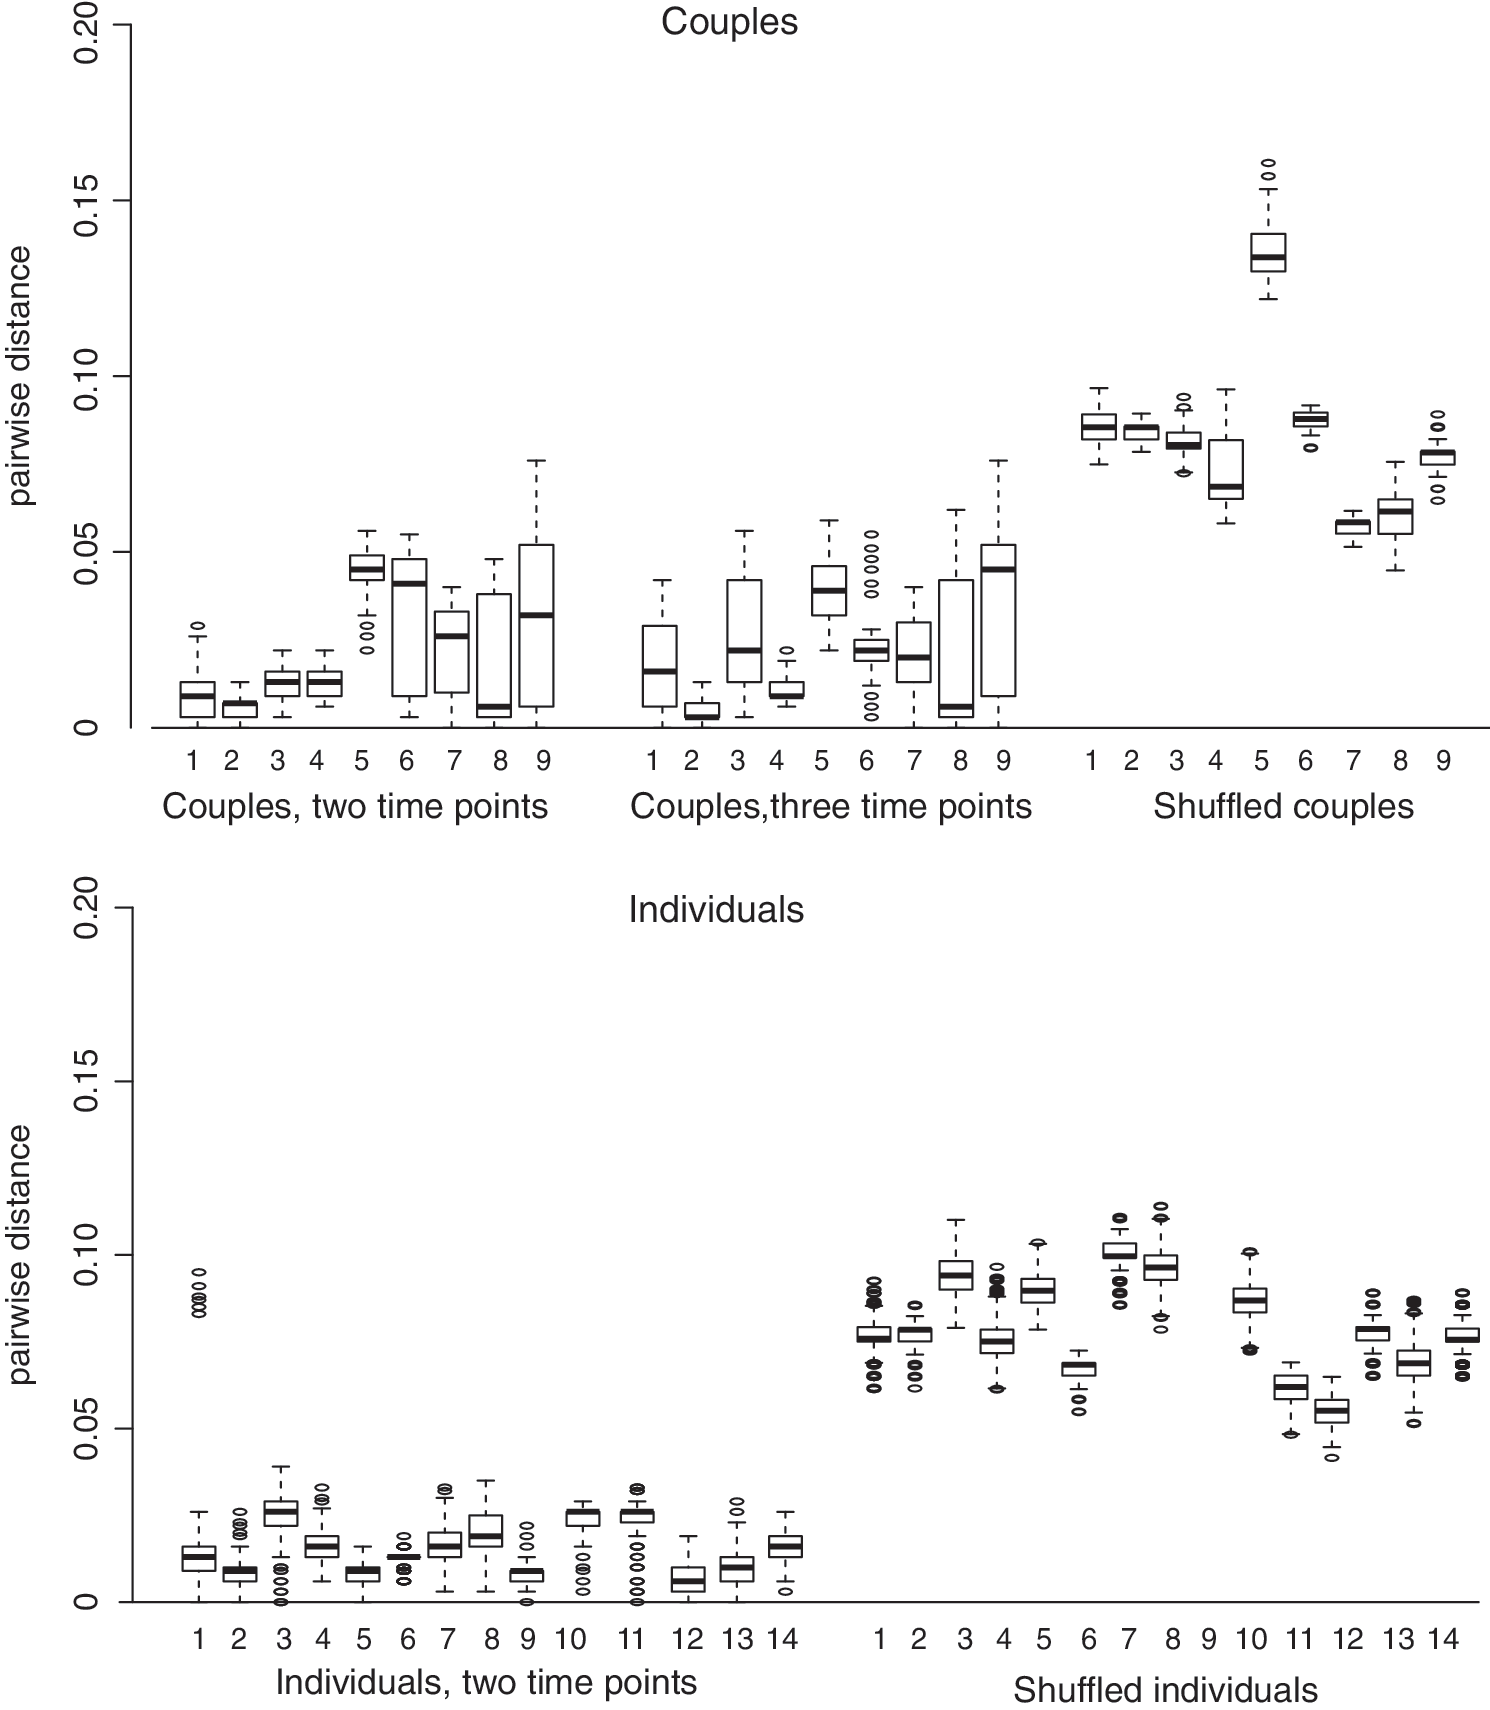
Pairwise genetic distance for NGS datasets. Boxplots indicate 75% interquartile range, median, outliers. All comparisons between sequences from the same individuals and time point were removed. NGS, next-generation sequences.
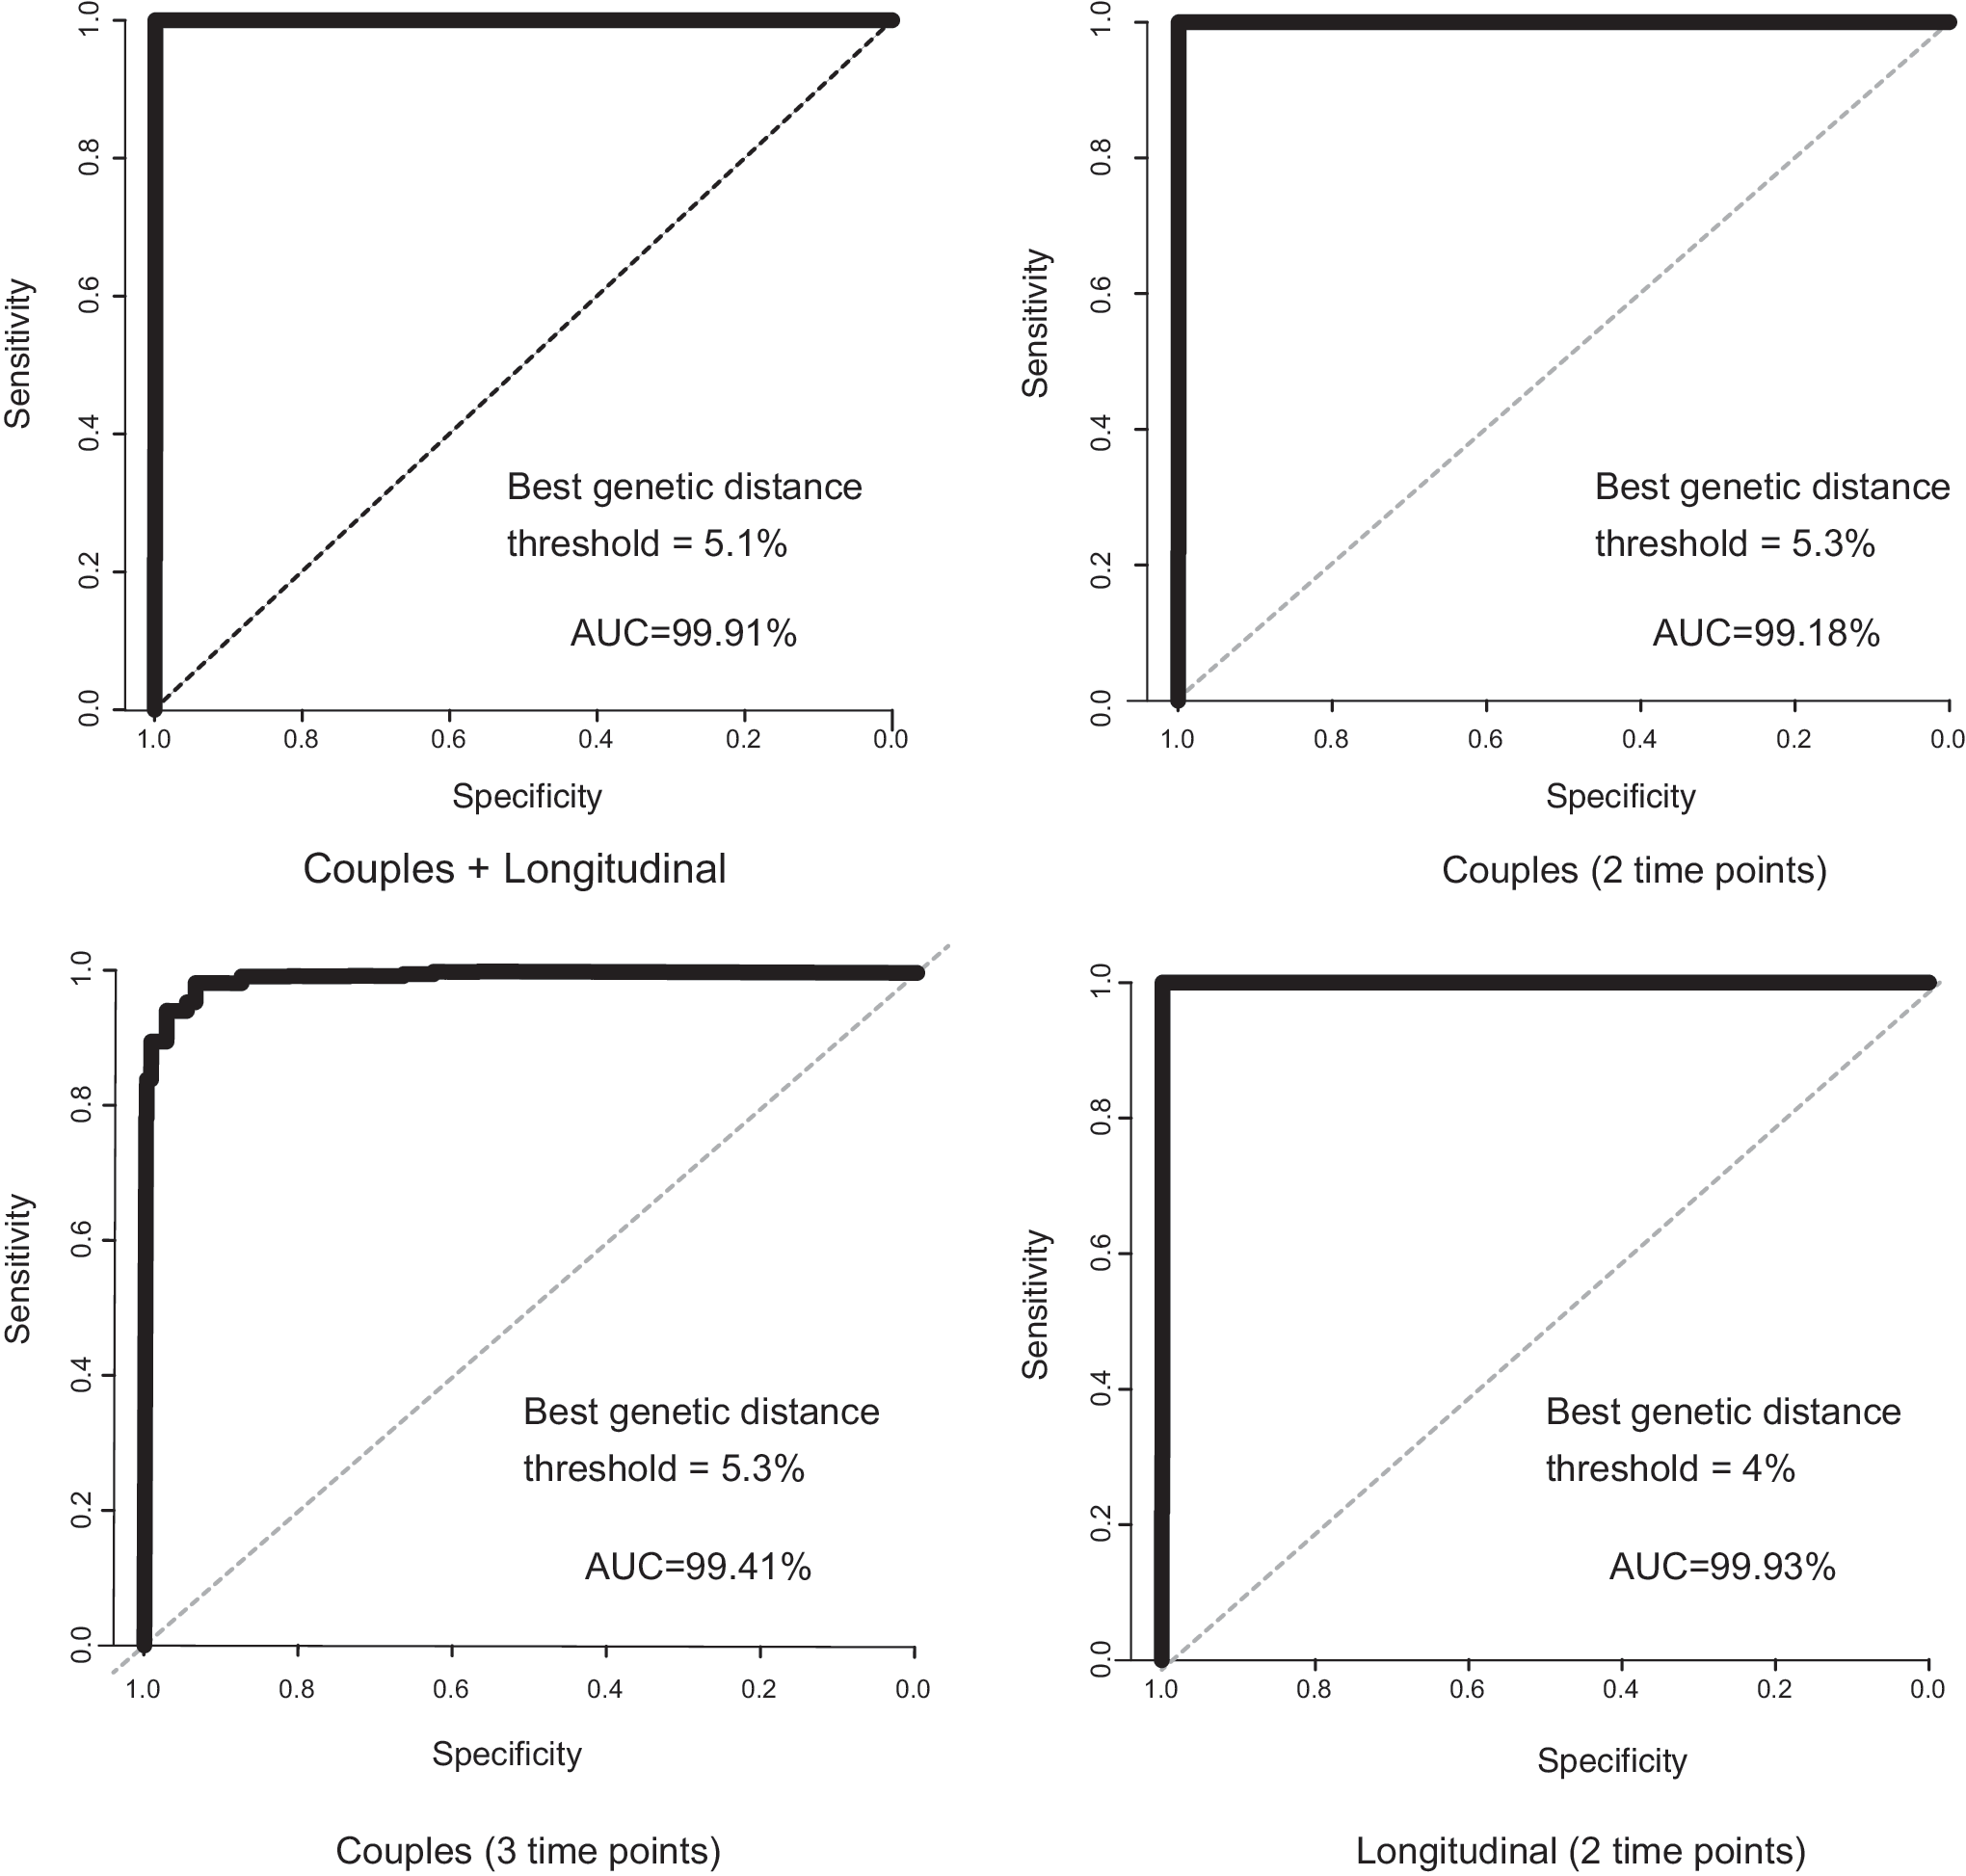
Receiver operator curves for NGS datasets. The best genetic distance threshold is reported for the nearest to top left corner algorithm.
Cluster Picker was biased toward smaller clusters at low genetic distances with NGS data
At genetic distances ≤3%, Cluster Picker detected nearly eightfold more clusters than HIV-TRACE (Fig. 3). As the genetic distance threshold increased >3%, HIV-TRACE detected fewer clusters containing multiple pairs, whereas Cluster Picker detected fewer clusters that contained all of the sequences from given pairs.

Cluster comparison for HIV-TRACE and Cluster Picker for NGS datasets. The total number of sequences in each cluster
HIV-TRACE detected pairs at lower genetic distances than Cluster Picker with NGS data
At the 1% genetic distance threshold, 23/24 pairs from datasets (1) and (2) were detected by HIV-TRACE, but only 8/24 were detected by Cluster Picker (Supplementary Table S3). At 3% genetic distance, HIV-TRACE detected all pairs; however, two sets of couples (couples 2 and 9, and couples 5 and 8) overlapped. At 4% genetic distance, Cluster Picker detected all pairs, with only one overlapping set of couples (couples 2 and 9).
Cluster Picker retains more 2-seq clusters at higher genetic distances with single variant data
Branch support showed little difference among ML trees inferred using different model parameters (Supplementary Table S4). When branch support threshold was set to 0 in Cluster Picker to detect the influence of topology and genetic distance only, both programs performed similarly (Supplementary Table S5). At 5% genetic distance, both programs detected all pairs; however, Cluster Picker retained two-sequence (2-seq) clusters, whereas HIV-TRACE detected larger clusters.
HIV-TRACE detects fewer, larger clusters than Cluster Picker at >3% genetic diversity in the cross-sectional dataset
The number of clusters detected by Cluster Picker varied very little among different parameter settings in the ML trees inferred for dataset (3) (Supplementary Table S6). HIV-TRACE and Cluster Picker detected similar numbers of clusters at genetic distances ≤3% (Fig. 4A) and an average of ∼2 sequences/cluster (Fig. 4B). Cluster Picker continued to detect additional clusters at higher genetic distances with a relatively linear rate. However, the number of clusters detected by HIV-TRACE decreased when genetic distance was >4%. The number of 2-seq clusters again increased with a relatively linear rate as genetic distance increased, whereas HIV-TRACE detected fewer clusters at genetic distances >3%. While HIV-TRACE included a higher total number of sequences in the dataset in some cluster (Fig. 4C), the average number of sequences per cluster increased exponentially as the genetic distance increased. Of the 91 couples in this dataset, HIV-TRACE and Cluster Picker performed similarly at genetic distances >3%, but again the number of couples detected in a 2-seq cluster by HIV-TRACE decreased at higher levels. Cluster Picker detected the maximum number of couples in 2-seq clusters at 5%, and decreased slightly at 5.3%.
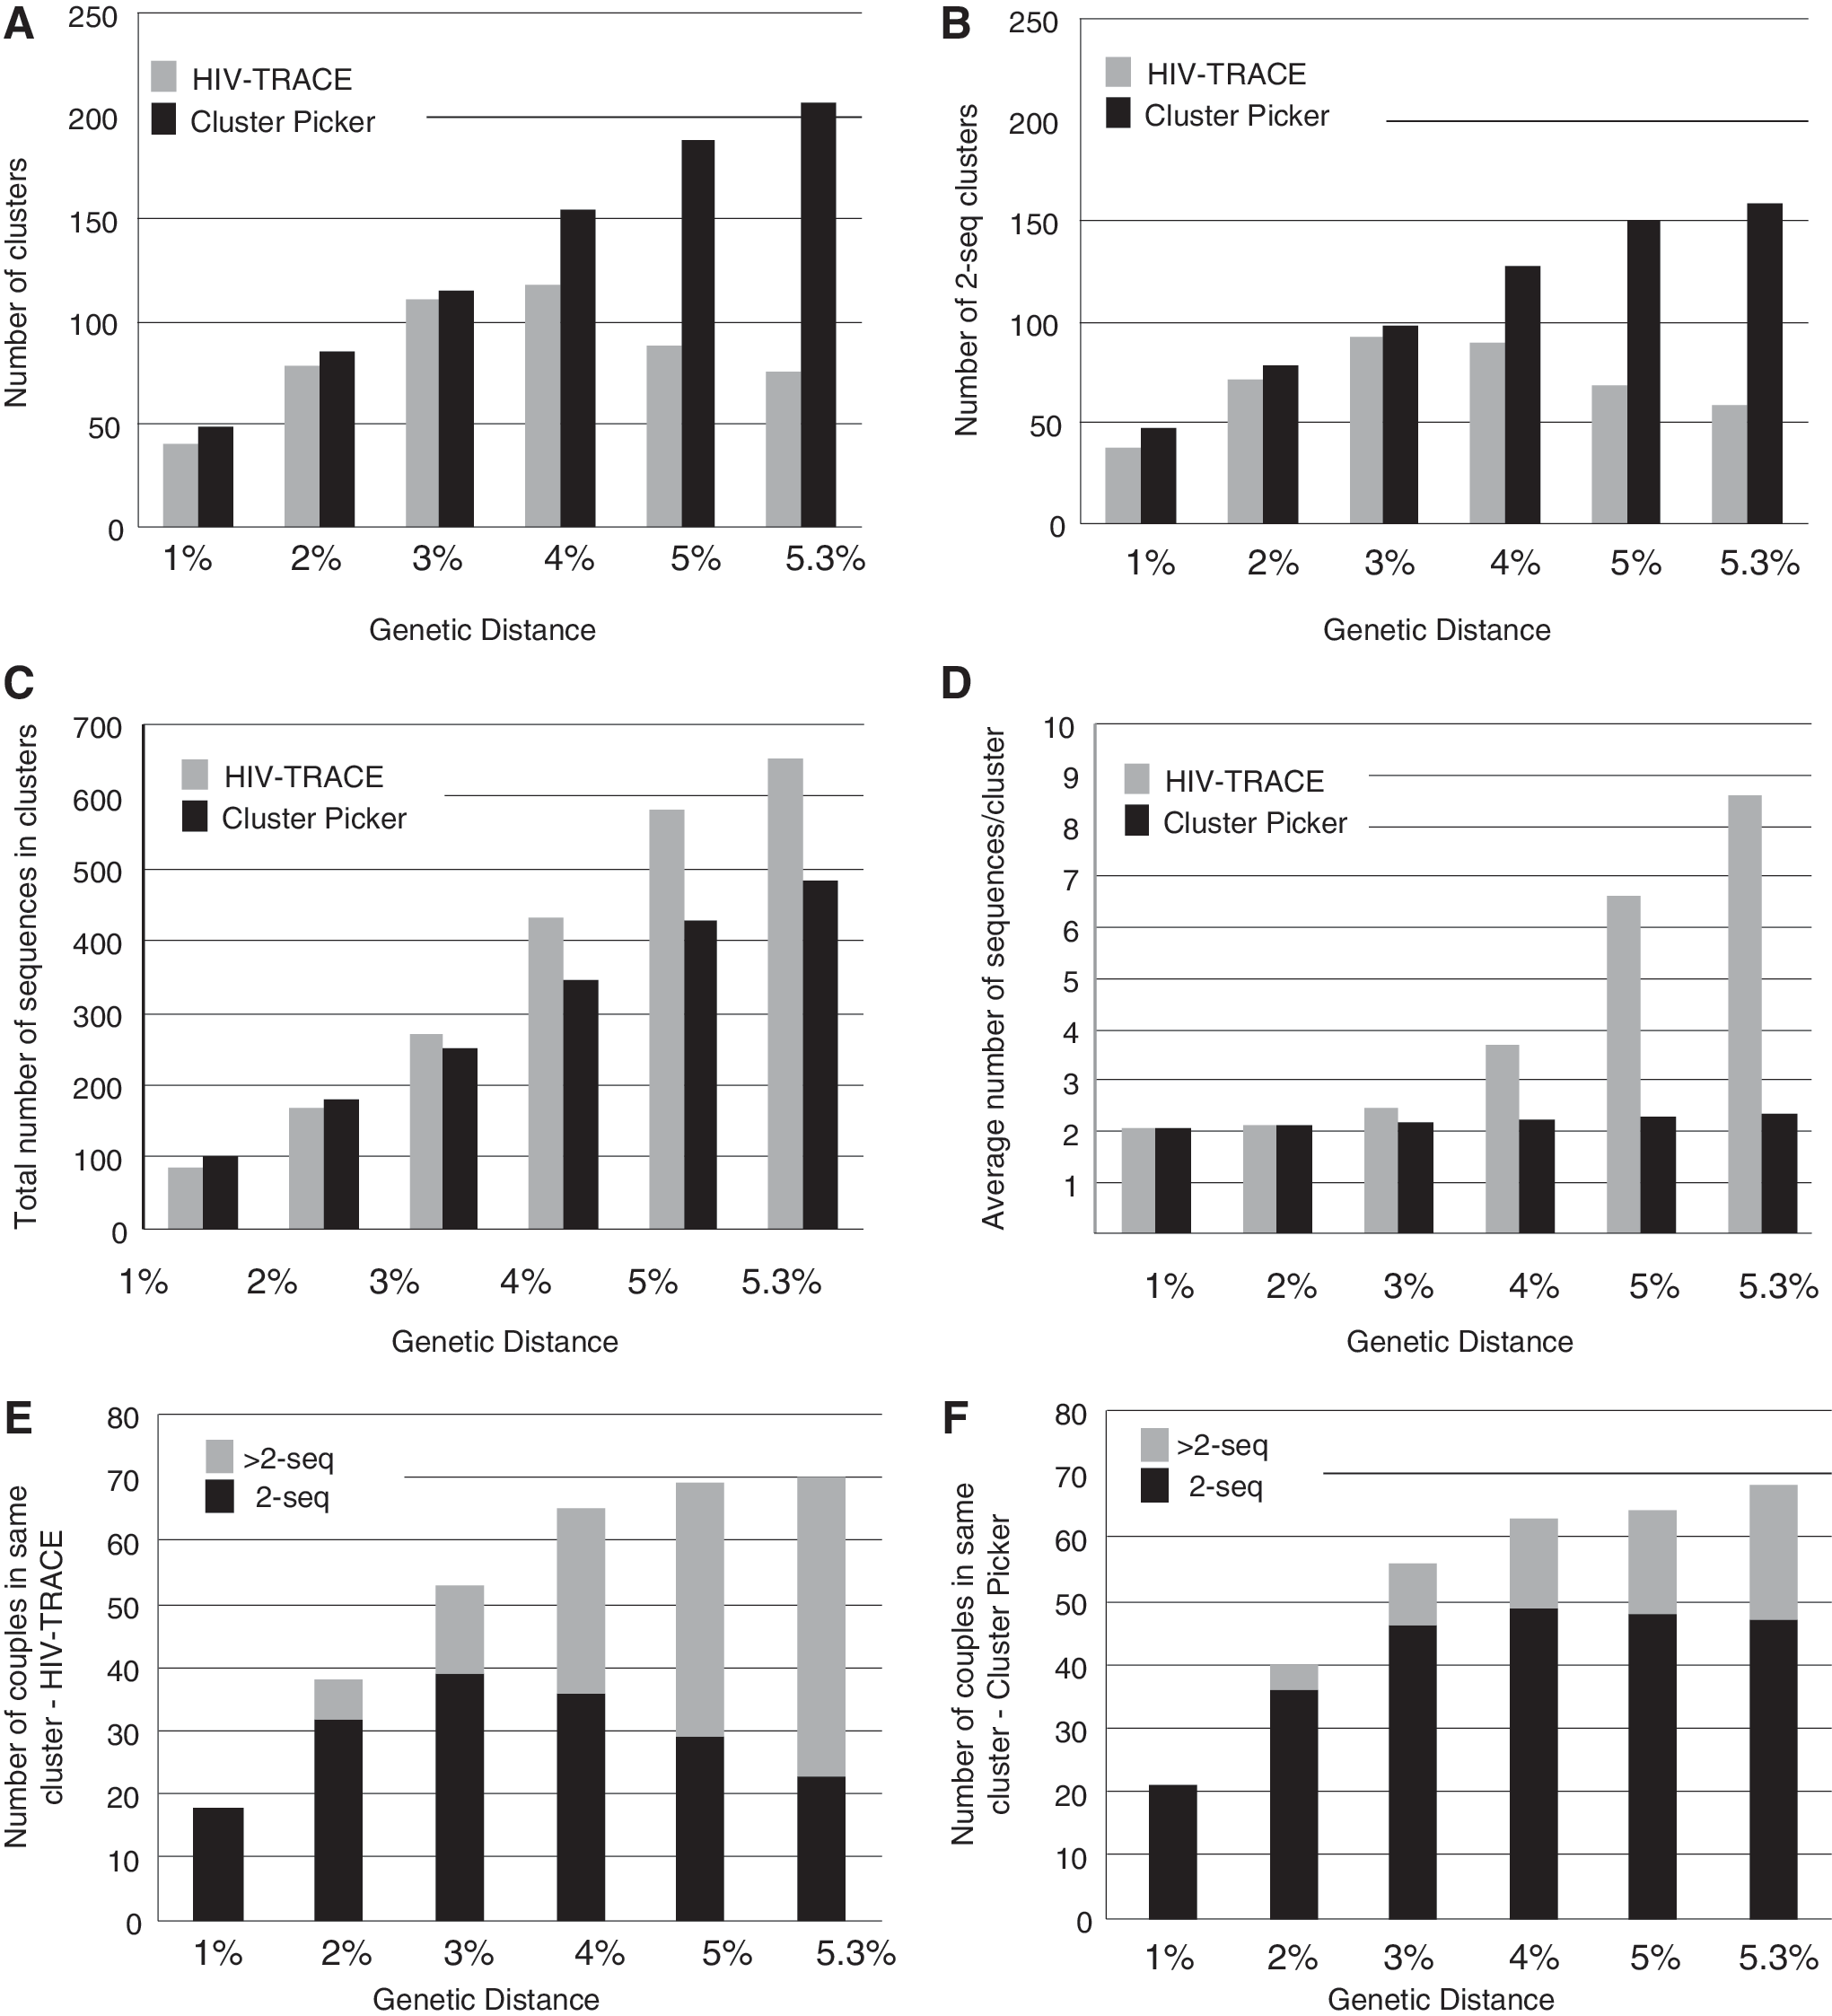
Cluster comparison for HIV-TRACE and Cluster Picker for cross-sectional dataset. Total number of clusters
Most couples detected only at higher genetic distances were in >2-seq clusters
HIV-TRACE was more likely to detect couples in >2-seq clusters than Cluster Picker, as expected from previous results (Table 1). The number of couples detected in 2-seq clusters at the highest genetic distance (n = 22) was only slightly higher than the number detected at 1% (n = 16). On the other hand, the number of couples who did not cluster in either analysis at 1% (n = 68) decreased to only 18 at 5.3%. Most of these couples were assigned to >2-seq clusters by HIV-TRACE or both HIV-TRACE and Cluster Picker. Interestingly, only 5 of 28 couples who were not detected by either program at 5.3% were incident.
2-seq, only two sequences, one from each partner, are in the cluster; >2-seq, additional sequence(s) are also in a cluster with a couple; DNC, do not cluster.
Discussion
The goals of this study were twofold: (1) identify a statistically supported genetic distance threshold to define transmission clusters specific to our data, and (2) compare the behavior of HIV-TRACE and Cluster Picker at detecting clusters at this threshold. Our data were derived from a relatively small geographic region with stable HIV prevalence. We initially used two NGS datasets from epidemiologically linked pairs (couples and longitudinally sampled individuals), in which genetic distances represented evolution within individuals since the time of transmission. The difference in pairwise distributions of the linked pairs and shuffled pairs was striking: for all comparison, the ROC provided optimal genetic distance values with >94% specificity and sensitivity in all cases. Interestingly, the optimal distances were quite high (>4%). We, therefore, used the optimal threshold for couples (5.3% genetic diversity), as well as a range of more typically used values (1%–5%) for the remainder of the clustering analyses.
We found some interesting differences in the number and composition of clusters detected by the two programs. As genetic distances increased past 3%, HIV-TRACE tended to detect larger and fewer clusters than Cluster Picker, whereas Cluster Picker continued to detect more clusters and more 2-seq clusters at higher genetic distances. For the NGS data, Cluster Picker detected nearly eightfold more clusters than HIV-TRACE at 1%, but detected all linked pairs at 4%, and detected only slightly fewer clusters as high as 5.3% (n = 22). HIV-TRACE detected all linked pairs at 3%; however, at 5.3%, only nine larger clusters were detected. This might be an important consideration when the goal is to detect distinct transmission events (i.e., two individuals) that may be separated by a long period of time during which the viral population diverged (and thus higher genetic distance thresholds can be used).
On the other hand, when the goal is to detect larger networks of sequences, HIV-TRACE may offer an advantage. For example, HIV-TRACE may perform better in epidemics with high coverage, where long transmission chains are expected. The similarity between the Cluster Picker and HIV-TRACE results may be different in a broad surveillance setting, which needs to be investigated more thoroughly.
Interestingly, NGS data allowed detection of related samples at lower genetic distance thresholds (3%–4%) in comparison to single sequence data, which required genetic distance thresholds of 5% to detect all pairs for both programs. These results suggest that the most frequent variant from two individuals of a couple or from two time points are not necessarily closely related, and the full information from a deeply sequenced dataset can provide useful information that is otherwise hidden. Previous studies have also found that couples who were initially assessed as unlinked based on consensus sequences were actually found to be linked when gp41 NGS data were used. 7 We also found that branch support was robust to parameter in the ML analysis, therefore, less computationally intensive tree-building methods may be used on these larger datasets allowing practical phylogenetic analyses.
In the cross-sectional dataset, 20% (18/91) of self-identified couples did not cluster at all, even at the highest level of genetic distance tested in this study (5.3%). This observation is similar to the findings from a study of couples involved in the HPTN052 trial, in which 18.4% of couples were determined to be unlinked through consensus pol sequences and gp41 NGS. 7 At the highest genetic distance, couples were nearly equally separated into four categories corresponding to the type of cluster (2-seq, >2-seq, no cluster) assigned by HIV-TRACE and Cluster Picker. More than one-quarter (28%) of couples were in the discordant category of 2-seq by Cluster Picker and >2-seq by HIV-TRACE. Combining this information can potentially provide additional insight into the transmission dynamics.
Clearly, the optimal threshold for detecting clusters defined here of 5.3% may not be appropriate for all datasets, for example, the pol region, which is used by many studies for drug resistance screening and public health surveillance. On the other hand, pol and env have been shown to produce identical phylogenetic clustering patterns with similar statistical support, 1,25 suggesting that branch support thresholds are consistent across genes. Our data were collected from stable epidemic in Uganda in which genetic diversity has accumulated over time, whereas other clustering studies have examined more recent and localized HIV outbreaks 6,26,27 or epidemics 10 in which less diversity is present. Yet, this study clearly demonstrates the value of investigating dataset-appropriate thresholds and using multiple approaches to determine linkage. Additional approaches to define clusters beyond those tested here could also be included, for example, Bayesian probabilistic methods, 7 which may provide additional insight into community transmission dynamics.
HIV phylogenetic analysis is increasingly being used to help understand community transmission dynamics and inform opportunities for intervention. 28 –31 Transmission clusters can provide insight into shifts in social and structural dynamics influencing transmission over time and the role of social distance and other structural influences on transmission, independent of participant-reported history. 32 There is great potential for using these data to help identify segments of the population at highest risk for incident HIV infection, which can inform the mechanisms, upper limits of reach, and targeting for network-based HIV testing and care interventions, PrEP, and other social and behavioral intervention. 33
However, effective public health application relies upon sufficient network completeness and appropriate application of sequencing algorithms to identify transmission clusters. It is also important that data users are able to have confidence in the results of cluster analyses. The results of the current analysis suggest a need for greater appreciation of the nuances involved in identifying genetic linkages for HIV and perhaps an approach that uses multiple methods.
Footnotes
Acknowledgments
The authors would like to acknowledge the support of the participants and staff of the Rakai Health Sciences Program and the Rakai Community Cohort Study, without whom, this research could not have been possible. J.O.W. was supported by an NIH-NIAID Career Development Award (K01AI110181). D.G. was supported by NIH supplement to CFAR award #5 P30 AI094189-04 and K01DA041259. This work was supported in part by the Division of Intramural Research, National Institute of Allergy and Infectious Disease, National Institutes of Health.
Author Disclosure Statement
No competing financial interests exist.
References
Supplementary Material
Please find the following supplemental material available below.
For Open Access articles published under a Creative Commons License, all supplemental material carries the same license as the article it is associated with.
For non-Open Access articles published, all supplemental material carries a non-exclusive license, and permission requests for re-use of supplemental material or any part of supplemental material shall be sent directly to the copyright owner as specified in the copyright notice associated with the article.