
Abstract
HIV-1 has the Vif protein, which binds to human antiviral proteins APOBEC3 to form complexes to be degraded by cellular proteolysis. To further explore HIV-1 diversity at the population level, we analyzed blood samples from 317 treatment-naive patients in Brazil. In this study, we explored the correlations of Vif polymorphisms with clinical parameters of the patients and found that mutation K22H is associated with low CD4+ cell counts and higher viral loads. Phylogenetic analysis of the vif gene indicated that subtype B was predominant in ∼77% (243/317) of the patients, followed by HIV-1 F ∼18% (56/317), and subtype C ∼4% (12/317); five samples were BF recombinants (∼1% of patients), and one was an AG recombinant. On the basis of the vif gene, we detected the presence of one AG and several previously unknown BF intersubtypes in this population. The global mean diversity, measured by pairwise distances, was 0.0931 ± 0.0006 among sequences of subtype B (n = 243), whereas the mean diversity of subtype C sequences (n = 12) was 0.0493 ± 0.001 and that of subtype F (n = 56) was 0.050 ± 0.001.
Introduction
T
It seems that hypermutation is not enough to restrain HIV-1 infection because proviruses with varying numbers of G → A mutations are commonly observed in the host genome. 5,6 Furthermore, the polymorphisms in the vif gene have been associated with better or worse efficacy at neutralizing A3G. 7 –9 It is only logical that when G → A mutations are ineffective at neutralizing viral genomes, A3G activity can increase HIV-1 diversification. 10 –14 In addition, the low diversity of Vif has been implicated in the strong purifying selection detected for this viral protein. 15 Notably, the most conserved sites of Vif are within regions that interact with cellular proteins core-binding factor (CBF) β and Cul5 E3 ligase to form the complex that counteracts with the antiviral APOBEC3 proteins. 16 These findings reveal the key function of Vif in HIV's life cycle and indicate that strategies aimed at disrupting the function of Vif during viral replication will be of great value to AIDS therapy.
In this study, to gain more information about the diversity of the vif gene, we studied a total of 317 HIV-1 infected treatment-naive individuals from Brazil. Our findings include the presence of the AG subtype and BF recombinants previously unreported in Brazilian patients.
Materials and Methods
HIV-1-infected individuals
Proviral DNA was extracted from heparinized peripheral blood obtained from 317 seropositive treatment-naive (untreated) patients (all adults) enrolled in the AIDS program of the Brazilian Ministry of Health. The HIV-1-infected individuals provided blood samples in São Paulo city between 1989 and 2006. All the samples were obtained from HIV-1-infected patients regularly receiving medical assistance at the ambulatory unit of the Federal University of São Paulo. The CD4+ cell counts (cells/mm3) ranged from 20 to 536, and the virus load ranged from 80–2.0 ×10⁶. The study protocol was approved by the Ethics Committee of the Federal University of São Paulo, and the biological samples were obtained in full compliance with the signed informed consent forms.
PCR and sequencing of the vif gene of HIV-1
The vif sequence was amplified by nested PCR. The primers were designed to cover the entire vif gene, according to the reference sequence HXB2 (details of sequences and locations of these primers can be found in Supplementary Table S1; Supplementary Data are available online at
Sequence alignment and phylogenetic inference
Initially, the sequences of the HIV-1 vif gene were aligned using the ClustalX software. 17 The sequences were also manually aligned using the SE-AL program, version 2.0 (Department of Zoology, Oxford University * ). To construct maximum likelihood (ML) trees, we used the HKY model, 18 as implemented in the PhyML software. 19 ML trees were visualized and edited using the FigTree software † . MEGA version 6 20 was also used to calculate the genetic distances and evolutionary rates.
Recombination detection
To determine the extent of recombination among the HIV sequences, we used software RDP v.4, which utilizes a collection of methods, an excellent and detailed explanation of each method implemented in the RDP software can be found in the user's manual
‡
. Breakpoints were identified by means of software Simplot, version 2.5, which is available at
Results
Nucleotide distances
The overall mean diversity, measured by pairwise distances, assuming the HKY model, was 0.0931 ± 0.0006 among the sequences of subtype B (n = 243), whereas the mean diversity of subtype C sequences (n = 12) was 0.0493 ± 0.001 and that of subtype F (n = 56) was 0.050 ± 0.001. There are many features affecting the higher nucleotide diversity of subtype B although at the population level, the main source of diversity is likely the length of time HIV-1 has been circulating in this population.
Amino acid variation
To characterize the sequences of the HIV-1 vif gene from Brazilians, we analyzed the amino acid substitutions on a site-by-site basis. Majority rule consensus sequences of the Vif protein were inferred from Brazilian strains B, F, and C. In addition, consensus sequences were created from one alignment containing 2,553 subtype B references and another containing 720 subtype C references (these sequences were derived from strains isolated in distinct geographical regions, obtained from the HIV databank at the Los Alamos National Laboratory). These consensus sequences indicated that the amino acid composition was relatively conserved among the HIV-1 subtypes (see Supplementary Fig. S1), and all regions with a biological function (binding domains) were equally conserved among the subtypes (lower panel in Fig. 1). For instance, there were only four differences (codons 127, 130, 151, and 167) between worldwide subtype B and subtype B from Brazil. Similarly, between worldwide subtype C and subtype C from Brazil, there were nine differences (codons 31, 39, 51, 67, 128, 130, 159, 176, and 182). Likewise, a comparison of Brazilian subtype B with subtypes F and C revealed 26 and 30 differences, respectively, and a comparison between subtypes F and C yielded 35 differences. Because consensus sequences represent the most frequent residues of a given site, differences in Vif seem to be randomly distributed among the subtypes. We therefore sought to test whether any sites varied in a subtype-specific manner. The results (not shown) indicated that nearly all codons differing among the subtypes were variable, and any given amino acid that was the most frequent in one subtype was also present in another subtype at a lower frequency. For example, in codon 50, subtype B has 72% of R and 28% of K, while subtype C has 86% of K and 14% of R. The lack of distinction among the subtypes in the amino acid composition of Vif became evident when the relative evolutionary rates were estimated. The codon-by-codon rate was estimated for subtypes B, C, and F from samples of the current study (Fig. 1). The results suggested that the overall evolutionary rates of all three subtypes are similar (see the box plot in Fig. 1). Besides, regions of Vif with high evolutionary rates (values >1.0 on the y-axis of the middle panel in Fig. 1) also coincide among the subtypes. It is interesting that most of Vif domains that interact with cellular proteins, although conserved, contain at least one site that is highly variable (lower panels in Fig. 1); these sites are 69YWGL72 (A3G binding), 144SLQYLALA151 (Elongin B/C binding), 160KPPL163 (A3G/F binding), and 171EDRWN175 (A3F binding).

Pattern of evolutionary rates the Vif protein of the HIV-1. The upper panel shows a box plot with the overall mean of the evolutionary rate for the subtypes B (red box), F (green box), and C (blue box). Box limits represent the 25th and the 75th percentiles, horizontal bars are the deviations, and open dots are the outlier values. The mid panel shows the codon-based evolutionary rates of the Vif protein of subtype B (red bars), F (green bars), and C (blue bars). The x-axis is the relative codon position on the Vif protein, and the y-axis represents the relative evolutionary rates per codon. These rates are scaled such that the average evolutionary rate across all sites is one, and thus, codons showing a rate value <1 are evolving slower than the average, and codons with a rate value >1 are evolving faster than average. These rates were estimated under the Jones–Taylor–Thornton (1992) model and gamma correction and the discrete Gamma distribution was used to model evolutionary rate differences among the five categories. The lower panel shows the binding domains of Vif. Domains were represented by one-letter amino acid code, x means variable codon. The objects with distinct shapes and colors represent the binding domains of Apobec3G (A3G), apobec3F (A3F), and the cellular proteins: Cullin5, Elongin B/C, and CBF-β.
Vif and clinical parameters
In previous studies, 9,15 we have evaluated the correlation of mutations in Vif and in APOBEC3G with patients' clinical parameters. We found a weak correlation between diversity of the Vif and CD4+ cell counts only when pairs of codons were considered. The population level approach may limit the ability of statistical methods to find correlations of single mutations with clinical parameters. For instance, mutation K22H in Vif has been frequently observed in patients failing antiretroviral therapy and may indeed be linked to drug-resistance codons in the pol gene. 21 In our dataset, we found only 18 K22H sequences of subtype B, and patients harboring these strains, although not statistically significant, tended to have lower CD4+ cell counts and higher virus loads (Fig. 2).
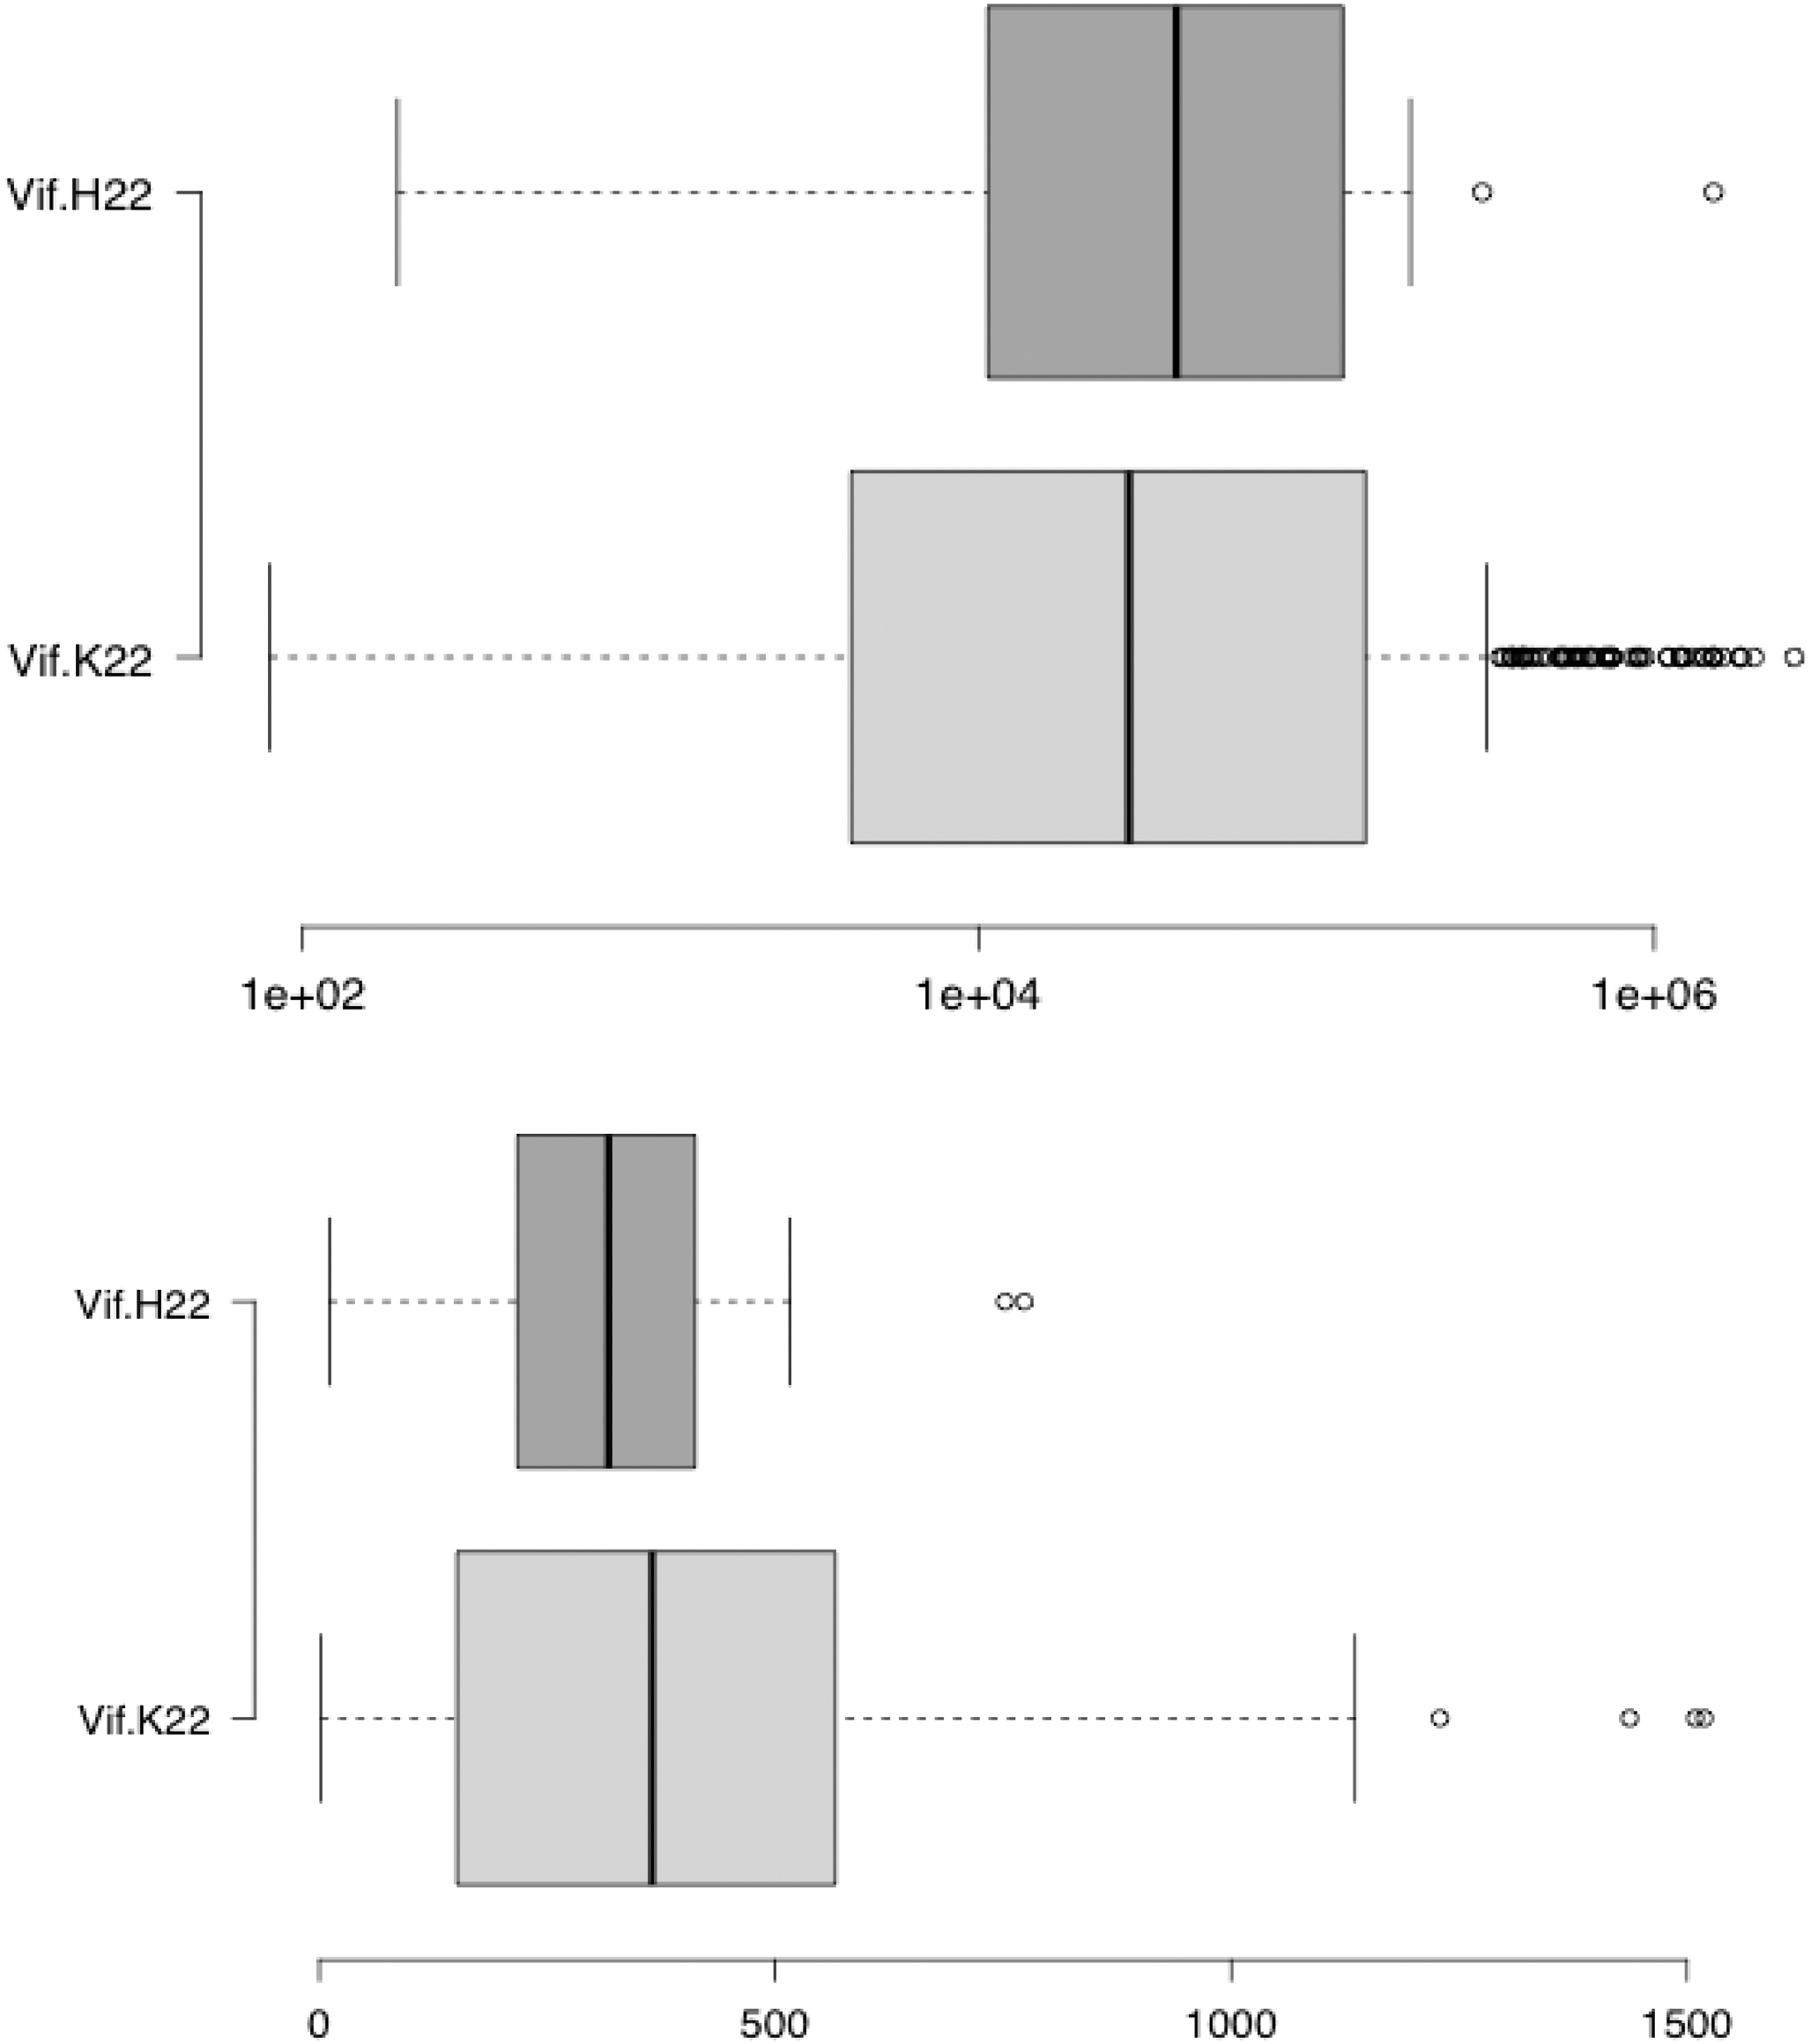
Correlation between the mutation K22H of Vif and clinical parameters. The upper panel shows the plasma viral loads (mRNA levels/mm3) of 18 patients infected by HIV-1 strains having the mutation Vif 22H (dark gray box) and compared with the virus load of all 317 patients of the current study (light gray box). Lower panel shows the values of CD4+ lymphocytes counts (cells/mm3) of 18 patients infected by HIV-1 strains having the mutation Vif 22H (dark gray box) compared with the CD4 counts of all 317 patients of the current study (light gray box). The dark line in the box is the overall mean values, box limits represent the 25th and the 75th percentiles, vertical bars are intervals, and open dots are the outlier values. In this study, the Kruskal–Wallis test was used and significance between groups was verified by Mann–Whitney test.
Phylogenetic analysis
Using the vif gene trees, we found that most isolates were subtype B viruses (∼78%); 12 were subtype C (∼4%); 56 sequences belonged to subtype F (∼18%); five were BF recombinants (∼1%); and one was an AG recombinant. The ML tree, including all the samples, analyzed in this study is shown as a cladogram in Figure 3 (top panel). The cladogram shows the subtype B strains colored red, subtypes F and BF green, subtype C blue, and the AG strain is highlighted in magenta. Figure 3 shows a phylogram with all subtype references and a few isolates from this study for illustrative purposes, because in the large tree (cladogram), details of clade support are not visible. It is important to note that although 56 sequences were assigned to subtype F (based on the vif gene), they are likely BF intersubtypes. Studies based on full-length genomes have shown that nearly all subtype F strains isolated in South America are actually BF recombinants. 22,23
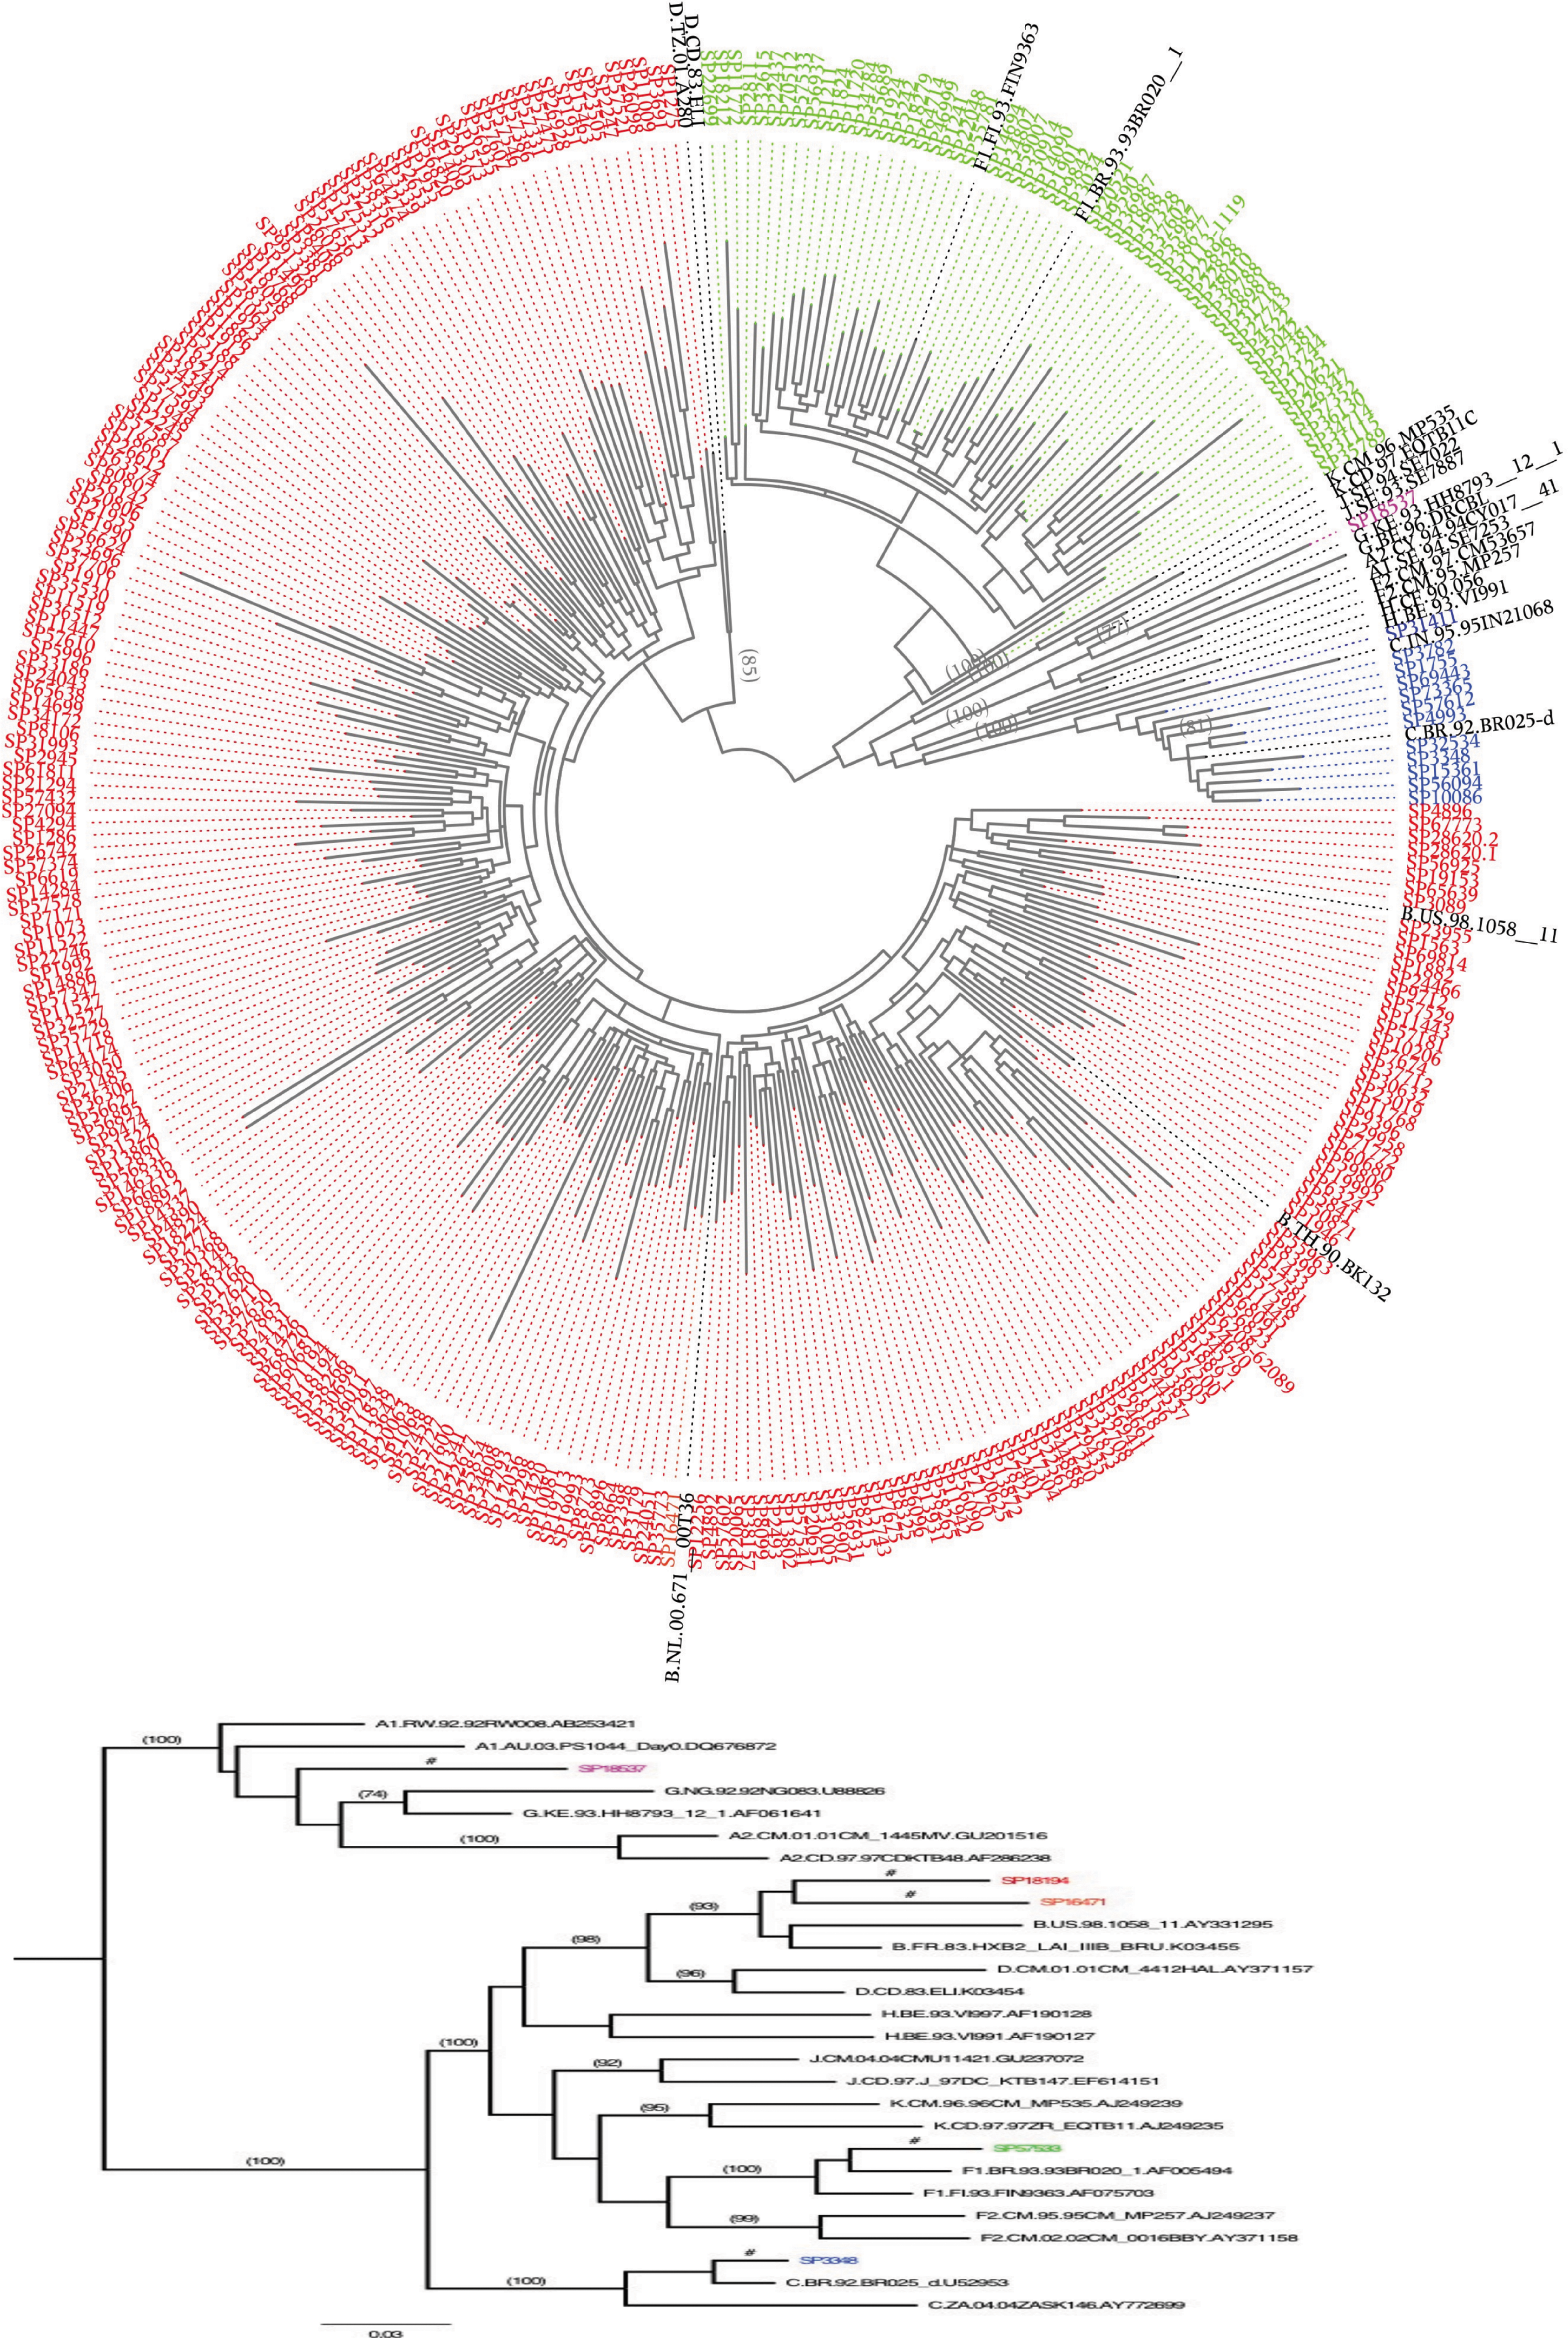
Phylogenetic trees constructed with the vif gene of the HIV-1. The upper circular tree shows the topology of the phylogeny constructed using maximum likelihood method with all 317 strains of this study and references of the main HIV-1 subtypes. Lower tree is small topology that was rooted at its midpoint, showing mainly the high bootstrap support (numbers above each branch) obtained with the vif gene region. This small tree also shows few strains of the present studies (colored sequences) that were included just to exemplify the subtypes identified in Brazil. The isolates of the current study were colored as follows: red subtype B, green subtype F, blue subtype C, and magenta AG. The following references were depicted by their GenBank numbers; subtype A1: AB253421A1, DQ676872; subtype A2: GU201516, AF286238; subtype B: AY331295, K03455; subtype C: AY772699; subtype D: AY371157, K03454; subtype F1: AF005494, AF075703; subtype F2: AJ249237, AY371158; subtype G: U88826, AF061641; subtype H: AF190128, AF190127; subtype J: GU237072, EF614151; and subtype K AJ249239, AJ249235. Figure 3 can be viewed in greater detail online at
Recombination of the vif gene
We used various methods to determine the extent of recombination in putative recombinants of the vif gene identified by the methods implemented in the RDP software. Only the sequences with the highest probability of recombination were assigned to “true” intersubtypes. Next, these intersubtypes were examined to identify the location of the breakpoints in the vif gene. We found two isolates (i.e., 1,009 and 2,247) with breakpoints at locations similar to those of CRF-70 (Fig. 4). Three isolates (i.e., 15463, 57381, and 57352) have breakpoints distinct from any other BF intersubtype previously cataloged in the Los Alamos HIV databank. Figure 4 shows the pattern of breakpoints of the AG strains identified in this study. We used bulk DNA from peripheral blood mononuclear cells, and this approach is associated with false recombination products. To minimize this bias, all intersubtype samples detected by phylogenetic analysis were amplified and sequenced de novo.

Mosaic pattern of the vif gene of HIV-1 intersubtypes. Each panel represents the intersubtype pattern of recombination of the vif gene from HIV-1 isolates identified in Brazilian. Colored lines represent the probability (given in bootstrap value) of genomic regions to belong to a certain parental HIV-1 subtype. The x-axis represents the sequence length in base pairs (bp). The y-axis represents the statistical support (bootstrap) based on 500 replicates. Each plotted line refers to a certain HIV-1 subtype (see the code color on the small panel). Vertical dashed lines represent the recombination break point on the genome region. Analyses were performed using a neighbor-joining method and Kimura two parameters model in windows of 140 bp sliding along sequences in increments of 40 bp. For parental references, nonrecombinant sequences of subtype A, B, C, F, and G were used (these reference are the same described in the legend of the Fig. 3). The bootscan analysis was performed using the program Simplot v.2.5 $ .
Discussion
To evaluate the molecular characteristics of the HIV-1 vif gene, we analyzed blood samples of 317 treatment-naive patients from São Paulo city. Because Vif has a reduced frequency of mutations and hypermutations compared with other HIV-1 genes, 5 it is important to fully characterize the diversity of this viral protein. The amino acid conservancy of Vif observed at the population level is high because Vif is a small (∼200 amino acid residues) multifunctional protein with distinct domains having key biological functions. 16 Comparisons of Vif among subtypes in Brazil indicated that the pattern of variability (regions with conserved and regions with variable sites) is nearly the same among subtypes B, F, and C. This phenomenon is likely a consequence of strong purifying selection present in binding domains of Vif. 15 Besides, we noticed that binding domains of Vif have variable sites, in which amino acid residues with distinct properties can be found (e.g., polar, nonpolar, or positively or negatively charged). This variability of binding domains of Vif is likely to affect the ability of Vif to interact with cellular proteins and form the Vif–Cul5–EloBC–CBFβ–A3 complex.
The phylogenetic analyses—although based on 600 nucleotides of Vif—are informative regarding the overall prevalence of subtypes and recombinant strains. 24 –26 We found high diversity of viral strains among our samples: subtype B was the prevalent strain (∼78%), 12 were subtype C (∼4%), 56 sequences belong to subtype F (∼18%), five are BF recombinants (∼1%), and one is an AG recombinant. These frequencies are consistent with the early worldwide spread of subtype B 27 and the peculiar dynamics of the HIV-1 epidemic in Brazil with a single introduction of subtype B followed by subtype F. 24 The low prevalence of HIV-1 subtype C in our dataset is concordant with other studies. 28,29 Although strain BF was found to have low prevalence in this study, some studies have shown a tendency of this intersubtype to spread with South American HIV-1 infection. 22,24 It is noteworthy that the AG strains detected in this study came from a woman infected before 2006, which is earlier than the first report of strain AG in Brazil. 30 In this country, there is high diversity of HIV-1 intersubtype BF and subtype B isolates with a peculiar GWGR signature in the Gp120 gene region. 31 –36 Thus, full characterization of all HIV-1 genes is crucial for better understanding of this epidemic.
Footnotes
Acknowledgments
We express our sincere gratitude to all the patients who contributed to this study. The authors thank the AIDS program of the Brazilian Ministry of Health for providing access to patients' information and blood samples.
Author Disclosure Statement
No competing financial interests exist.
References
Supplementary Material
Please find the following supplemental material available below.
For Open Access articles published under a Creative Commons License, all supplemental material carries the same license as the article it is associated with.
For non-Open Access articles published, all supplemental material carries a non-exclusive license, and permission requests for re-use of supplemental material or any part of supplemental material shall be sent directly to the copyright owner as specified in the copyright notice associated with the article.