
Abstract
Accurate methods for cross-sectional incidence estimation are needed for HIV prevention research. The Limiting Antigen Avidity (LAg-Avidity) assay has been marketed by two vendors, Maxim Biomedical and Sedia BioSciences Corporation. Performance differences between the two versions of the assay are unknown. We tested a total 1,410 treatment-naive samples with both versions of the assay. The samples came from 176 seroconverters from the Zimbabwe Hormonal Contraception and HIV Study. The correlation between the two versions of the assay was 0.93 for the optical density (OD) and 0.86 for the normalized OD. As the difference was more pronounced for the normalized OD, the difference in assays can be attributed to the calibrators. The mean duration of recent infection (MDRI), the average time individuals infected <2 years appear recently infected, was determined for both versions using an assay cutoff of 1.5 OD-n alone or in combination with a viral load cutoff of >1,000 copies/ml. The MDRI was 137 days for Sedia and 157 days for Maxim, with a difference of 20 days (95% CI 11–30). The MDRIs decreased to 102 and 120 days with the inclusion of a viral load cutoff of >1,000 copies/ml. These results imply that use of the Sedia LAg-Avidity will result in estimates of incidence ∼13% lower than those using the Maxim LAg-Avidity.
A
LAg-Avidity is currently marketed by two companies, Maxim Biomedical (Bethesda, MD) and Sedia BioSciences Corporation (Portland, OR). However, performance differences between these two assays have not been evaluated. The assays from both companies are similar and use a target peptide supplied by the CDC, but each company supplies its own internal calibrator. The assay generates an optical density (OD) result for each sample, which is normalized by dividing the OD by the result of the calibrator (OD-n). We determined the correlation of results between both assays and investigated if these differences impact basic performance characteristics of cross-sectional incidence assays, namely the mean duration of recent infection (MDRI) (the average time individuals infected <2 years appear recently infected by the assay) and the false recent rate (FRR, the frequency of being identified as recently infected for samples from individuals infected >2 years). 8 As the LAg-Avidity assay is strongly affected by viral suppression, we determined the performance of both versions of the assay with and without an additional viral load exclusion criteria. 4 Therefore, a sample was classified as recent if it had an OD-n < 1.5 and had a viral load >1,000 copies/ml. If either of these conditions was not met, the sample was considered long term.
In this study, 1,410 treatment-naïve samples from 176 seroconverters from the Zimbabwe Hormonal Contraception and HIV trial 9 (subtype C endemic area) were tested using both versions of LAg-Avidity. The correlation coefficients (R 2 ) for the OD and normalized OD-n were calculated. In addition, differences in categorical results were examined using a cutoff value of 1.5 OD-n, which is currently recommended by both manufacturers. We further estimated the MDRI and FRR for both assays using an assay cutoff of 1.5 OD-n alone or in combination with a viral load cutoff of >1,000 copies/ml. All statistical analyses were performed using STATA version 14 (StataCorp, College Station, TX).
To estimate the MDRI for a set of assays and cutoffs (for example Sedia LAg-Avidity combined with viral load with cutoffs of 1.5 OD-n and 1,000 copies/ml respectively), we first calculated φ(t), the proportion of samples classified as recent infections as a function of calendar time since seroconversion. Logistic regression models with cubic splines were used to estimate each φ(t), which were then integrated from 0 to 2 years to give a point estimate for each MDRI. To estimate the FRR for a set of assays and cutoffs, we first calculated the proportion of misclassification for each individual for all the samples taken more than 2 years after seroconversion. These probabilities were then summed and divided by the total number of individuals assessed.
Seroconversion dates were sampled from uniform distributions over potential seroconversion intervals defined as the time between the last negative test date and the first positive test date. Forty individual samples (14 seroconverters) were excluded from this analysis since the time from last negative to first positive assay was over a year and half. Individuals with a test which was HIV RNA+/antibody− were assumed to have seroconverted within the following 28 days. The uncertainty in the dates of seroconversion was marginalized by averaging φ(t) estimates and FRR estimates over 1,000 hypothetical seroconversion dates for each individual. Confidence intervals for MDRI and FRR estimates were calculated through a clustered bootstrap, where bootstrap sampling is conducted at the level of the individual. 10 Results for the differences in MDRIs or FRRs between Sedia and Maxim assays were calculated by taking the difference of the imputed MDRIs or FRRs at each step of the above process.
In comparing the Maxim and Sedia LAg-Avidity assay results, we found a higher correlation (R 2 ) in the OD values compared with the OD-n values (0.93 compared with 0.86; Fig. 1A, B). In both cases, there is a clear linear relationship between the results from the two LAg assays, but there is higher variability in the OD-n results. We next determined if there was a difference in classification between the two assays. There was strong agreement between the assays. Specifically, 1,152 samples had OD-n values greater than 1.5 for both assays, and 211 samples had OD-n values less than or equal to 1.5 for both assays (Fig. 1B). However, 47 samples were categorized differently by the assays; 25 samples had OD-n values less than or equal to 1.5 on Maxim LAg-Avidity and greater than 1.5 on Sedia LAg-Avidity. Conversely, 22 samples had OD-n values greater than 1.5 on Maxim LAg-Avidity and values less than or equal to 1.5 OD-n on the Sedia LAg-Avidity. The concordance was 97% and the kappa value was 0.88 for the categorical comparison. One subject had a sample below the Sedia LAg-Avidity cutoff after 2 years of infection. A different individual had one sample below the Maxim LAg-Avidity cutoff after 2 years of infection. These analyses include the 40 samples that were excluded for the MDRI and FRR calculations.
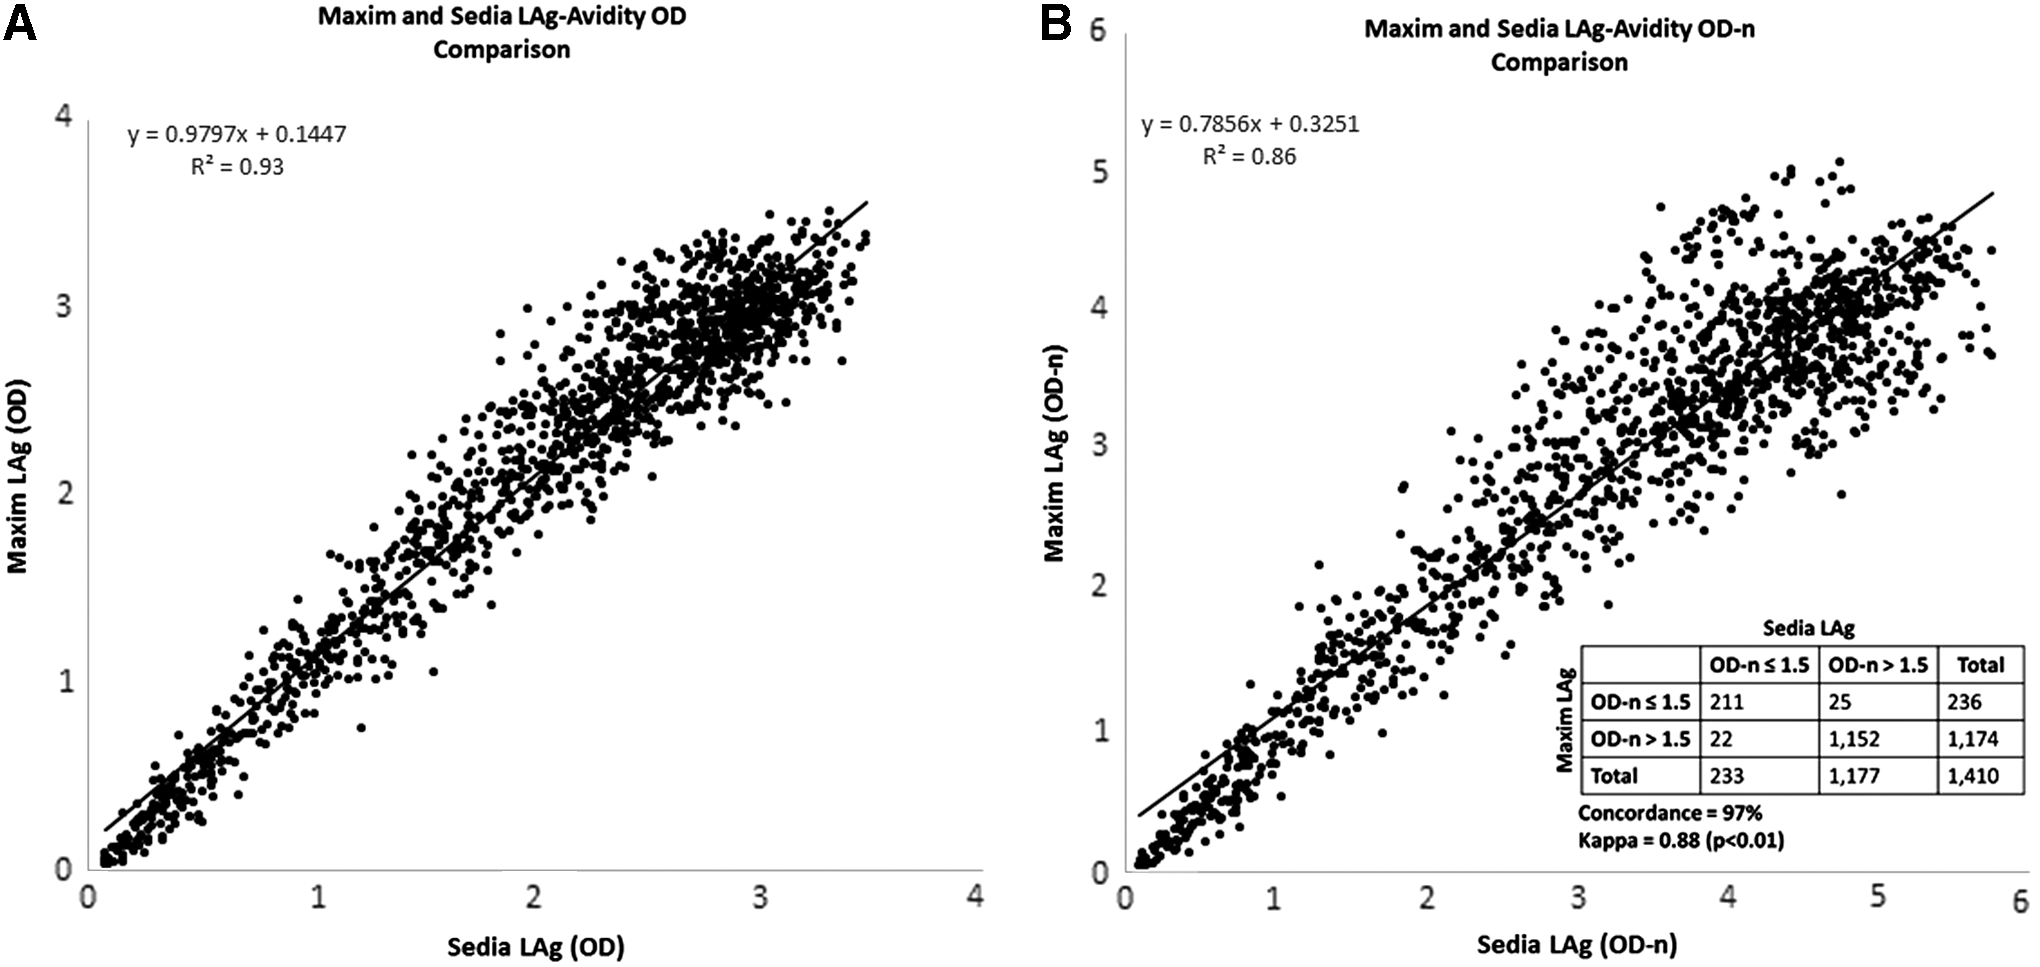
Comparison of continuous and categorical results obtained from Maxim and Sedia LAg-Avidity assays.
The MDRIs for using Sedia and Maxim LAg-Avidity alone with a cutoff of 1.5 were 137 (95% CI 114–162) and 157 days (95% CI 134–181), respectively, and the difference was 20 days (95% CI 11–30). Adding a viral load cutoff of 1,000 copies/ml decreased the MDRI to 102 days (95% CI 82–121) for Sedia LAg-Avidity and 120 days (95% CI 100–140) for Maxim LAg-Avidity with a difference of 18 days (95% CI 10–27). The FRR was ≤0.2% for all testing combinations and was nearly identical for Sedia and Maxim LAg-Avidity. Adding a viral load cutoff is typically done to reduce the FRR. 4 In this dataset, the addition of the viral load cutoff successfully removed the one sample infected >2 years but still classified as recent by Maxim LAg-Avidity, but failed to do the same for the different sample misclassified by the Sedia LAg-Avidity.
In comparison to other investigations of the LAg-Avidity assay, when used in combination with a viral load cutoff, the low FRRs (≤0.2%) match the 0.2% FRR level established for LAg-Avidity by the CDC, although we used a cutoff of 1.5 OD-n, and the CDC used a cutoff of 1.0 OD-n. 5 Moreover, our FRRs are substantially lower than the 3.1% FRR obtained by Rehle and his colleagues in South Africa 6 and the 1.6% FRR calculated by Duong and her colleagues. 11 These discrepancies may be due to differences between the various populations that were tested. 1 A specific FRR should be estimated for any population, in which these assays are to be used, particularly if the population has access to antiviral drugs. Previously, Duong and her colleagues examined seven methods for calculating the MDRI on an independent dataset of 250 seroconverters. The seven point estimates ranged from 130 to 137 days, matching our result of 137 (95% CI 114–162) days. 11 Additional testing with Maxim LAg-Avidity could help confirm the results of this article.
Performance differences between the Maxim and Sedia LAg-Avidity assays are mostly due to differences in the calibrators, since these performance differences are more pronounced for OD-n than OD. Thus, it would also be beneficial to explore how to adjust the calibrator of one or both assays to minimize the differences in the OD-n values, which are ultimately used to calculate incidence estimates. Alternatively, the CDC could dictate the calibrator to be used, as they already provide the target antigen. 5 The difference in MDRIs between the two versions of the assay imply that use of Sedia LAg-Avidity will result in estimates of yearly incidence ∼13% lower than Maxim LAg-Avidity as the incidence estimator is approximately proportional to the inverse of the MDRI. 8
Footnotes
Disclosure Statement
No competing financial interests exist.