
Abstract
The efficacy of antiretroviral (ARV) therapy can be compromised by the emergence and transmission of HIV-1 drug-resistant strains. HIV-1 drug-resistance (DR) genotypic testing thus plays an important role in the selection of optimal treatment regimens for HIV-infected individuals. Given the complexities of the testing procedures and the variety of approaches used, there is considerable potential for results to vary between laboratories. In Thailand, the national External Quality Assessment (EQA) scheme assesses the DR genotype testing performance of laboratories. Here, we evaluated the performance of laboratories in nucleotide sequencing and compared drug-resistance-associated mutations (DRMs) in the HIV-1 protease (PR) and reverse transcriptase (RT) genes during 2010–2015. The EQA samples in the 12 panels showed predominance for the CRF01_AE (85%) and subtype B (15%). Fourteen laboratory datasets were generated: eight using TruGene (TG), two using ViroSeq (VS), and four using in-house (IH) assays. All IH and VS laboratories had penalty scores <7, whereas five of the eight TG laboratories had fluctuating penalty scores. Moreover, seven and six TG laboratories could not amplify the two identical samples, 10B and 10E samples, or the CRF01_AE. Our findings demonstrate the requirement for laboratory participation in the ongoing EQA program and the optimization of kit assays using CRF01_AE samples. Our results also indicate that one advantage of participation is that the laboratories can monitor and investigate the source of laboratory errors.
Introduction
A
Genotypic DR testing by DNA sequencing consists of RNA extraction from plasma, the transcription of DNA, polymerase chain reaction (PCR) amplification, DNA sequencing, sequencing editing, and ARV therapy drug interpretation. The complicated nature of the testing, the variety of testing procedures among laboratories, and uneven laboratory performance all create the potential for variations in laboratory test reports. 2 –7 Moreover, the viral subtype present in a clinical specimen may influence the quality of the report. 2
Medical laboratories that are accredited on the basis of the ISO 15189 standard are regularly reassessed to check whether they are maintaining their standards of technical expertise. These laboratories will also be required to participate in regular external quality assessment (EQA) schemes (also known as proficiency testing) as an ongoing demonstration of their competence. 8
An EQA scheme is defined as a program in which multiple samples are periodically sent to participating laboratories for analysis and/or identification, so that each laboratory's results can be compared with those of other participating laboratories in the group, and these are reported to the participating laboratories. 9 Thus, an EQA scheme for HIV-1 DR testing in Thailand was organized by the Department of Medical Sciences of the Thai National Institute of Health with funding from the Thai National Health Security Office to assess the performance of the country's test laboratories. Our scheme is accredited with respect to ISO/IEC 17043:2010 (Conformity assessment—General requirements for proficiency testing). 10
There are already several EQA schemes for HIV DR testing, such as the Quality Control for Molecular Diagnostics (QCMD) 7 and Virology Quality Assurance (VQA)/World Health Organization (WHO). 11 CRF01_AE samples are rarely available in these EQA schemes. Our EQA samples were specifically prepared to include CRF01_AE, which is a predominant viral strain in Thailand and Southeast Asia. However, all commercial HIV DR genotypic kits were developed based on subtype B. We thus conducted this study to evaluate the performance of laboratories in nucleotide sequencing, and to compare the detection of DR mutations and ARV drug susceptibility using our specialized EQA scheme.
Materials and Methods
Ethical statement
Blood donors provided written consent for the use of their samples in the EQA scheme, and the questionnaire information was reidentified by the hospital reviewer and recoded, so that no information could be linked to any individual blood donor.
Panel samples
Blood specimens were collected from the Barasnaradura Institute during the years 2008–2012. The inclusion criteria of blood donors were HIV-1 patients with ARV failure treatment, and a viral load of >2,000 copies/mL. Diluted HIV-1 isolates with normal plasma and HIV-1 clinical plasma were prepared for the EQA panel. The specimens were kept in 0.6-mL aliquots, labeled and frozen at −70°C until needed. Before the panel shipment, the quality of each specimen was determined in terms of stability and homogeneity.
The viral load was measured with a COBAS Amplicor Monitor assay (Roche Molecular Systems, Branchburg, NJ), and genotyping was determined by both the TruGene™ HIV-1 Genotyping Assay (Siemens Healthcare Diagnostics, Tarrytown, NY) and an in-house (IH) assay 12 developed at the Department of Medical Sciences of the Thai National Institute of Health. All panels were shipped frozen on dry ice to the participating laboratories.
Panel composition and preparation
Two panels were sent every year from 2010 through 2015, and were named panels 1–10. Each panel consisted of five samples (samples A–E) whose content was characterized by DR genotypic testing and viral load before being sent to the participating laboratories. The viral load of the panel sample ranged from 3,500 to 757,000 (average 77,410) copies/mL. We analyzed the HIV subtypes of all samples using the Stanford University HIV-1 Drug Resistance Database (
Participating laboratories
The codes of the participating laboratories were deidentified and recoded, so that no information could be linked to any individual laboratory during analysis. Fourteen laboratories participated in the Thai EQA scheme: three laboratories from Chiangmai University, one laboratory from Ramathibodi Hospital, one laboratory from Chulalongkorn University, one laboratory from Khonkaen University, two laboratories from two public institutes, four laboratories from the regional office of disease prevention and control, one laboratory from a public hospital, and one private laboratory. The methods and codon positions covered are shown in Table 1.
Laboratory Details, Methods Used, and Length of Nucleotide Sequence and Amino Acid
The letters TG, VS, and IH after laboratory code represented TruGene, ViroSeq, and in-house developed kits, respectively.
PR, protease; RT, reverse transcriptase.
Details of manufacturer: Siemens Healthcare, Tarrytown, NY; Abbott Molecular, IL; Chromas Lite, Technelysium, Queensland, Australia; Applied Biosystems (ABI), Foster City, CA.
Eight laboratories used a TruGene (TG) kit, two laboratories used a ViroSeq (VS) HIV-1 genotyping system (Abbott Molecular, Des Plaines, IL), and four laboratories used different IH assays. The letters TG, VS, and IH after the laboratory code represent the platform used: TG, VS, or IH procedures, respectively. All laboratories were requested to perform their own routine protocol testing and to send back reports within 1 month, including (i) nucleotide sequences, and an Excel file composed of (ii) DRMs and (iii) ARV susceptibilities. These DRMs were counted/reported in the output of the kit software or the Stanford database or the International AIDS Society (IAS)-USA DR mutations list, 13 and all mutations were considered in the drug susceptibility interpretation algorithm.
Performance scoring system
All actual sequences were determined in two steps. First, the manual construction of neighbor-joining trees showed that all sequences were clustered closest to other sequences from the same sample rather than with other samples. Outlier sequences were first manually inspected in further analyses if the identity of sequences was <80%. Second, all sequences were further evaluated by a modified scoring system from the VQA Program, which was developed by the Rush University Medical Center Chicago in Illinois. The VQA assigns a score by comparing each sequence in a participating laboratory with the consensus sequences formed by combining data across participating laboratories. A separate consensus sequence is defined for each sample and particular kit on each round of testing. Proficiency scores are obtained by comparing the number of disagreements (called errors) between the consensus and the sequence from a given laboratory with the average number of errors for that gene and sample across all laboratories in which the same kit was used. A p value for the observed error count is obtained from a statistical model under which errors are assumed to occur randomly. Error counts that are associated with small p values are flagged as being unlikely to have occurred by chance; that is, error counts that have low probabilities of occurring by chance are interpreted as evidence of performance problems. Each RT and PR sequence is scored in three stages. First, the total number of errors in a sequence is scored. Second, the total number of errors in a subset of types of errors is scored. Third, the total number of errors in identifying amino acids at resistance-associated codons is scored. The scores were totaled over the two genes and five samples on each panel to produce the total score for a laboratory. The resulting scores have a theoretical range of 0–40 (0–4 points per sequence, ×2 sequences per sample, and ×5 samples per panel). Total scores ≤7 were judged as certified; total scores from 8 to 14 were judged as provisionally certified, and total scores >14 were judged as being on probation.
The only two aspects changed in the modified VQA were (1) all nucleotide sequence data regardless of the kit or assay used were compared together in the same equality of length (called a “watch region”), and (2) the amino acids (aas) or mutations were translated from the actual sequences, and then counted for the penalty score stage 3 as described below. The watch regions are codons 9–97 aa in the PR gene and 40–238 aa in the RT gene. Our scoring system was as follows: In brief, we developed an IH scoring program for making consensus sequences, translating nucleotides to aas, and determining penalty scores. The majority of the results derived from >80% concordance were recorded as consensus sequences. There were three stages of penalty score, as shown in Table 2.
Scoring System Modified and Applied to Evaluate Participants' Performance
Poisson distribution was described by the equation P x = (m x/x!)e −m , where m is the mean count, x is the mean count, x is the number for which the probability is needed and e is the exponential factor (=2.71828).
ARV susceptibility and DRMs
First, we defined the DRM term as the mutation associated with clinical resistance to HIV-1 and contributing to the reduction of virologic response to a drug. 11 In addition to the determination of each laboratory's performance from the actual sequence, the DRMs were reported using each kit's software, and the drug susceptibility interpretation algorithm reported the variation of HIV DR genotyping. The ARV susceptibility and DRMs were generated from the manufacturer's guidelines. The IH assay used the Stanford University Drug Resistance Database, which is freely available and open source, and constitutes the largest CRF01_AE database worldwide.
The level of interpretation of ARV susceptibility differed depending on the platform (Fig. 1). TG and VS have three levels: none, possible resistance, and resistance. The Stanford database has five levels: susceptible, potential low-level resistance, low-level resistance, intermediate resistance, and high-level resistance. In this study, we combined potential low-level resistance and low-level resistance as a single level. Comparisons were made among all participating laboratories using their own interpretation systems and using the Stanford system.
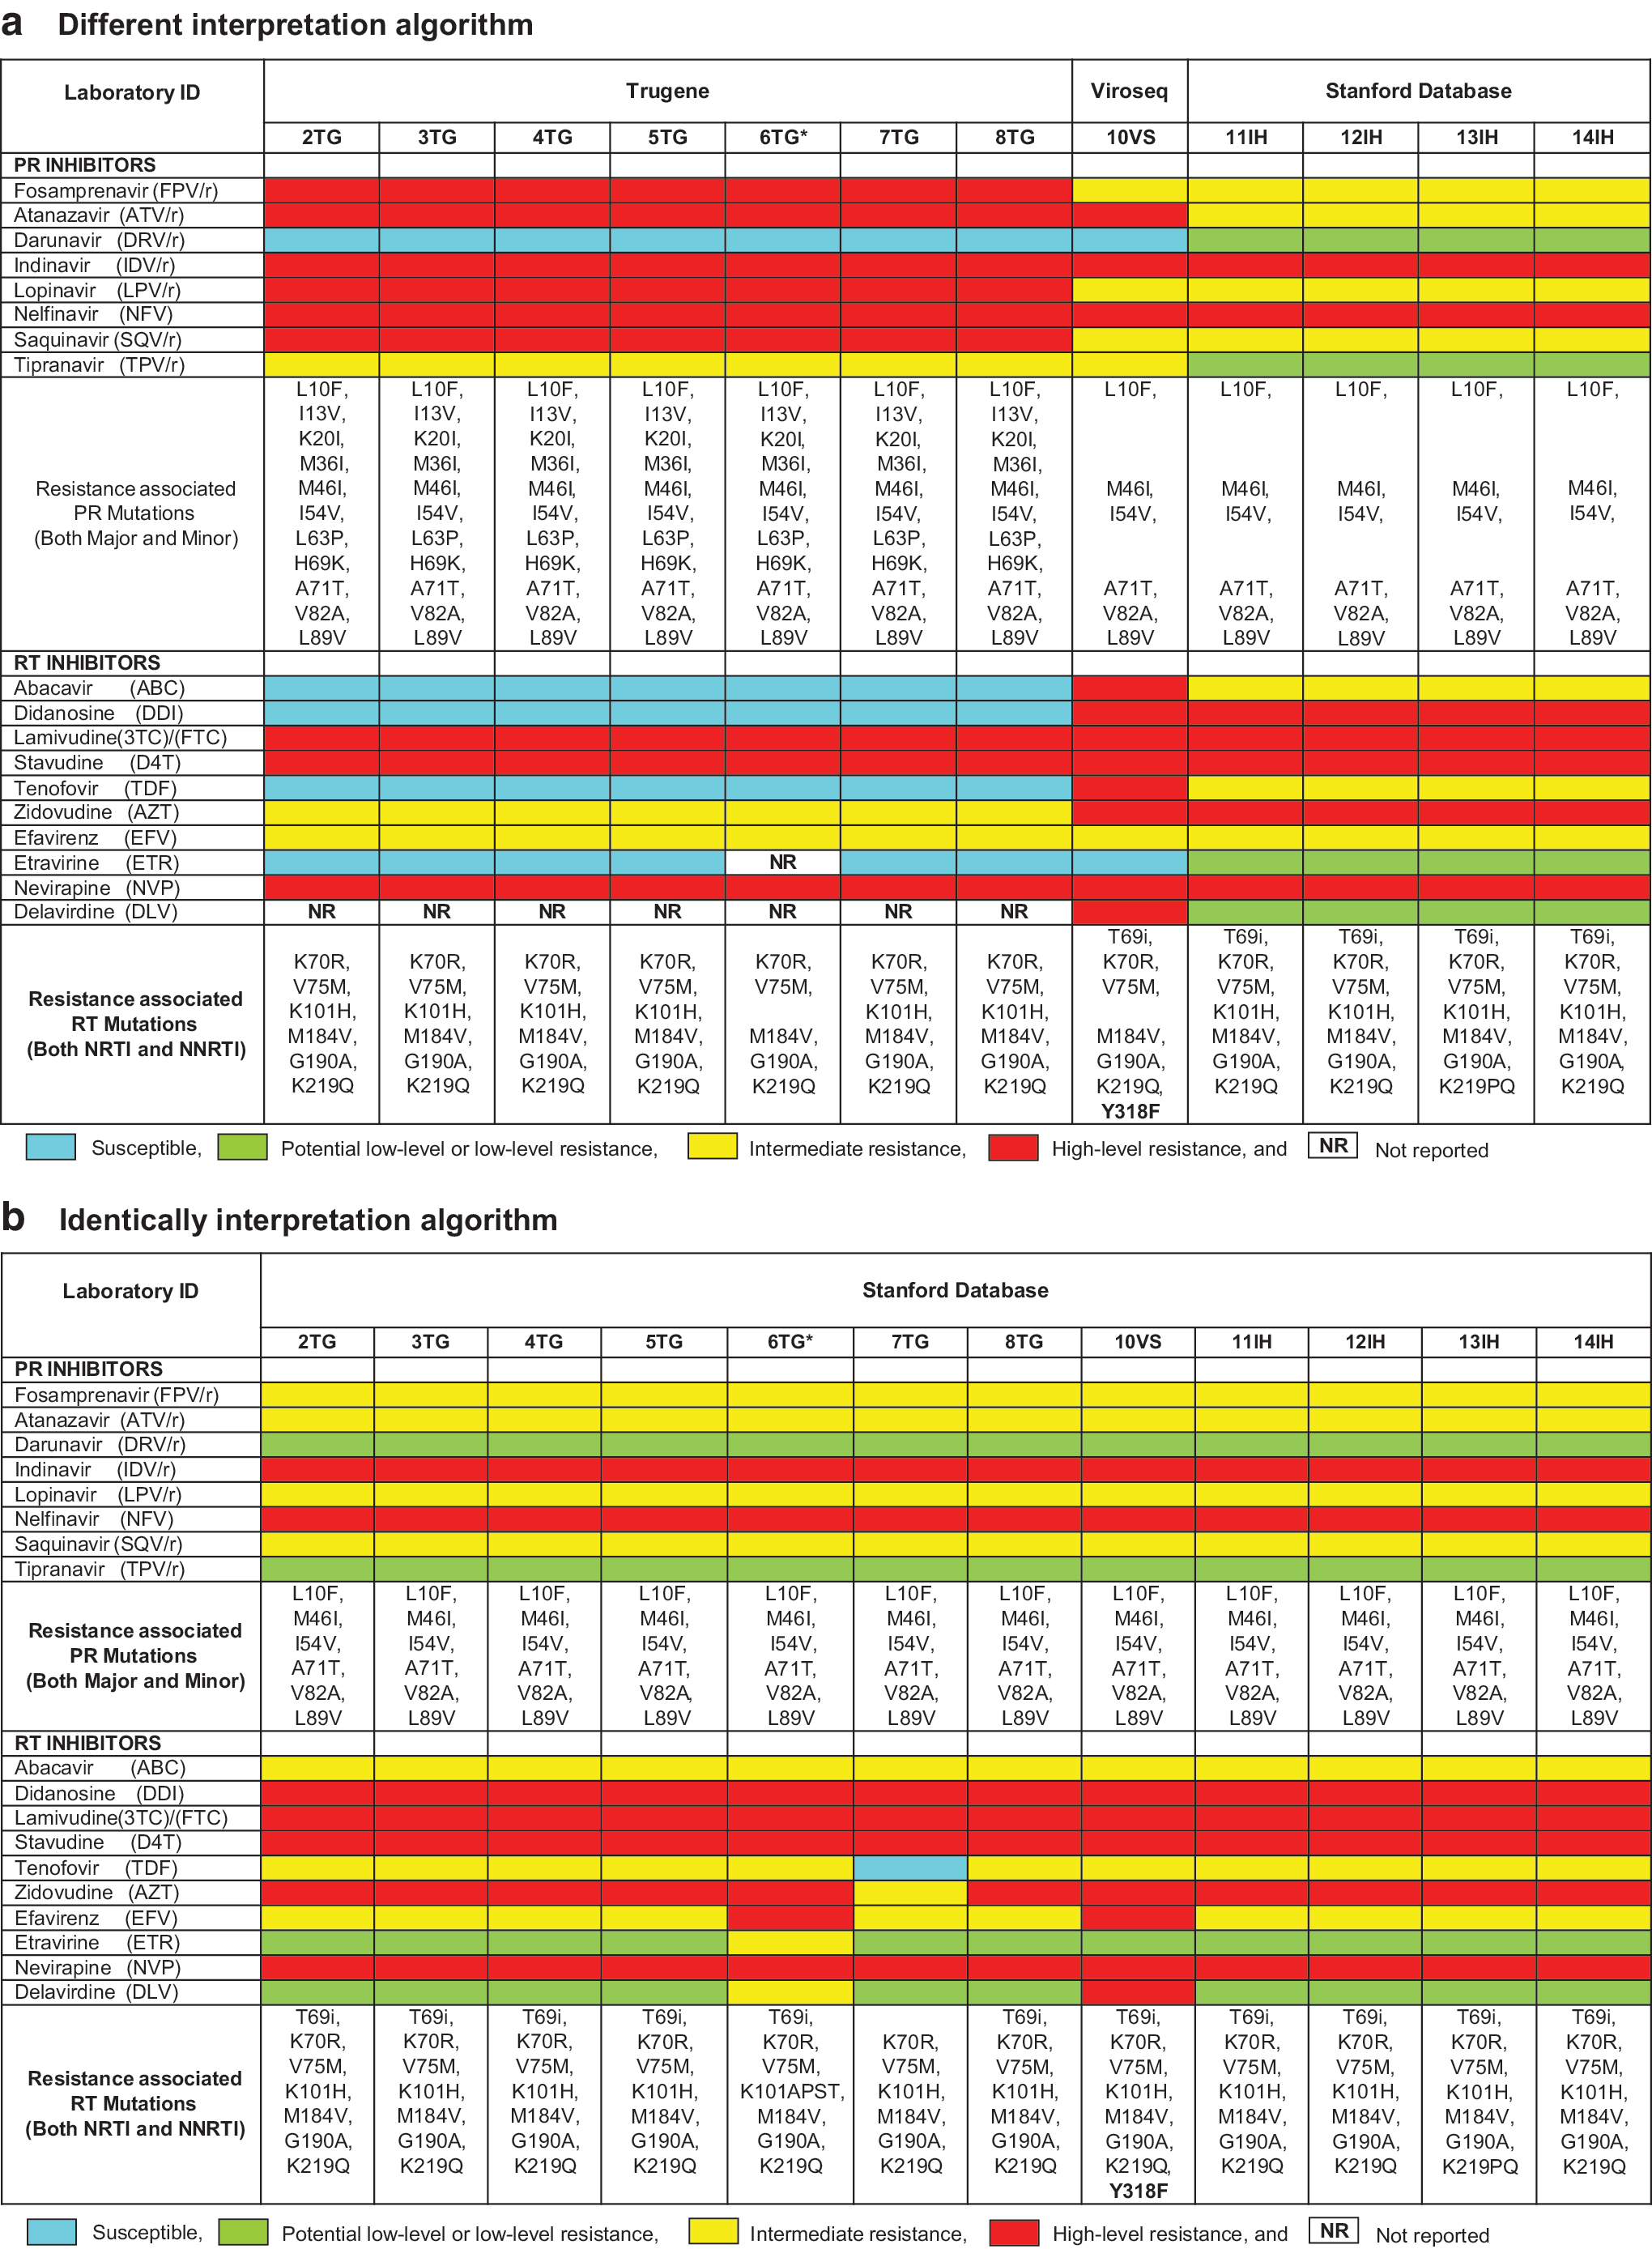
Comparison of ARV susceptibility and DRM among laboratories. Different interpretation algorithms
Results
Enrollment of laboratories
A total of 99.4% (167/168) of datasets were returned from the 14 participating laboratories, with the single exception being that 1TG failed to amplify all samples in panel 2. The 9VS laboratory started participating only at panel 3, and the 6TG laboratory stopped service before panels 11 and 12. As subtypes of the EQA samples, CRF01_AE (85%) and subtype B (15%) predominated in all 12 panels. In some panels, two of the EQA samples were identical, to verify the reproducibility of the results. The majority of laboratories (8/14) in Thailand used the TG kit. Four IH laboratories used different protocols with variations in primers, lengths of nucleotide sequences, editing sequencing software, and ARV interpretation systems (Table 1). All laboratories used an automatic base-calling software, and all reported performing manual checking and editing of automated base calls.
Evaluation of the laboratories' performance
All sequences except those reported by laboratories 1TG, 8TG, and 13IH clustered closer to other sequences of the same sample than to sequences of other samples, with high bootstrap values. Two laboratories, 3TG_5D and 8TG_10E, showed outgroups as shown in Figure 2 of phylogenetic tree, but the identity of the sequence showed >80% homology. Therefore, they were retained for data analysis. Laboratories 8TG and 13IH reported that samples 3D and 5B joined the same cluster of samples 3E and 5E, respectively, suggesting a sample mix-up or contamination.

Phylogenetic tree analysis. A neighbor-joining tree was constructed using the sequences derived from our study. Bootstrap values above 95/100 are indicated at the nodes of the tree. Color images available online at
We assessed the EQA performance over time as illustrated in Figure 3. The “good performance” outcome was defined as a penalty score ≤7. All IH and VS laboratories also showed good performance with penalty scores <7, except for laboratory 9VS in panel 4. There were four laboratories with “excellent” performance—that is, 4TG, 9VS, 10VS, and 14IH—which had lower penalty scores during the 5-year period of this study. Most of the TG laboratories had fluctuating penalty scores (and particularly high penalty scores for panel 10).
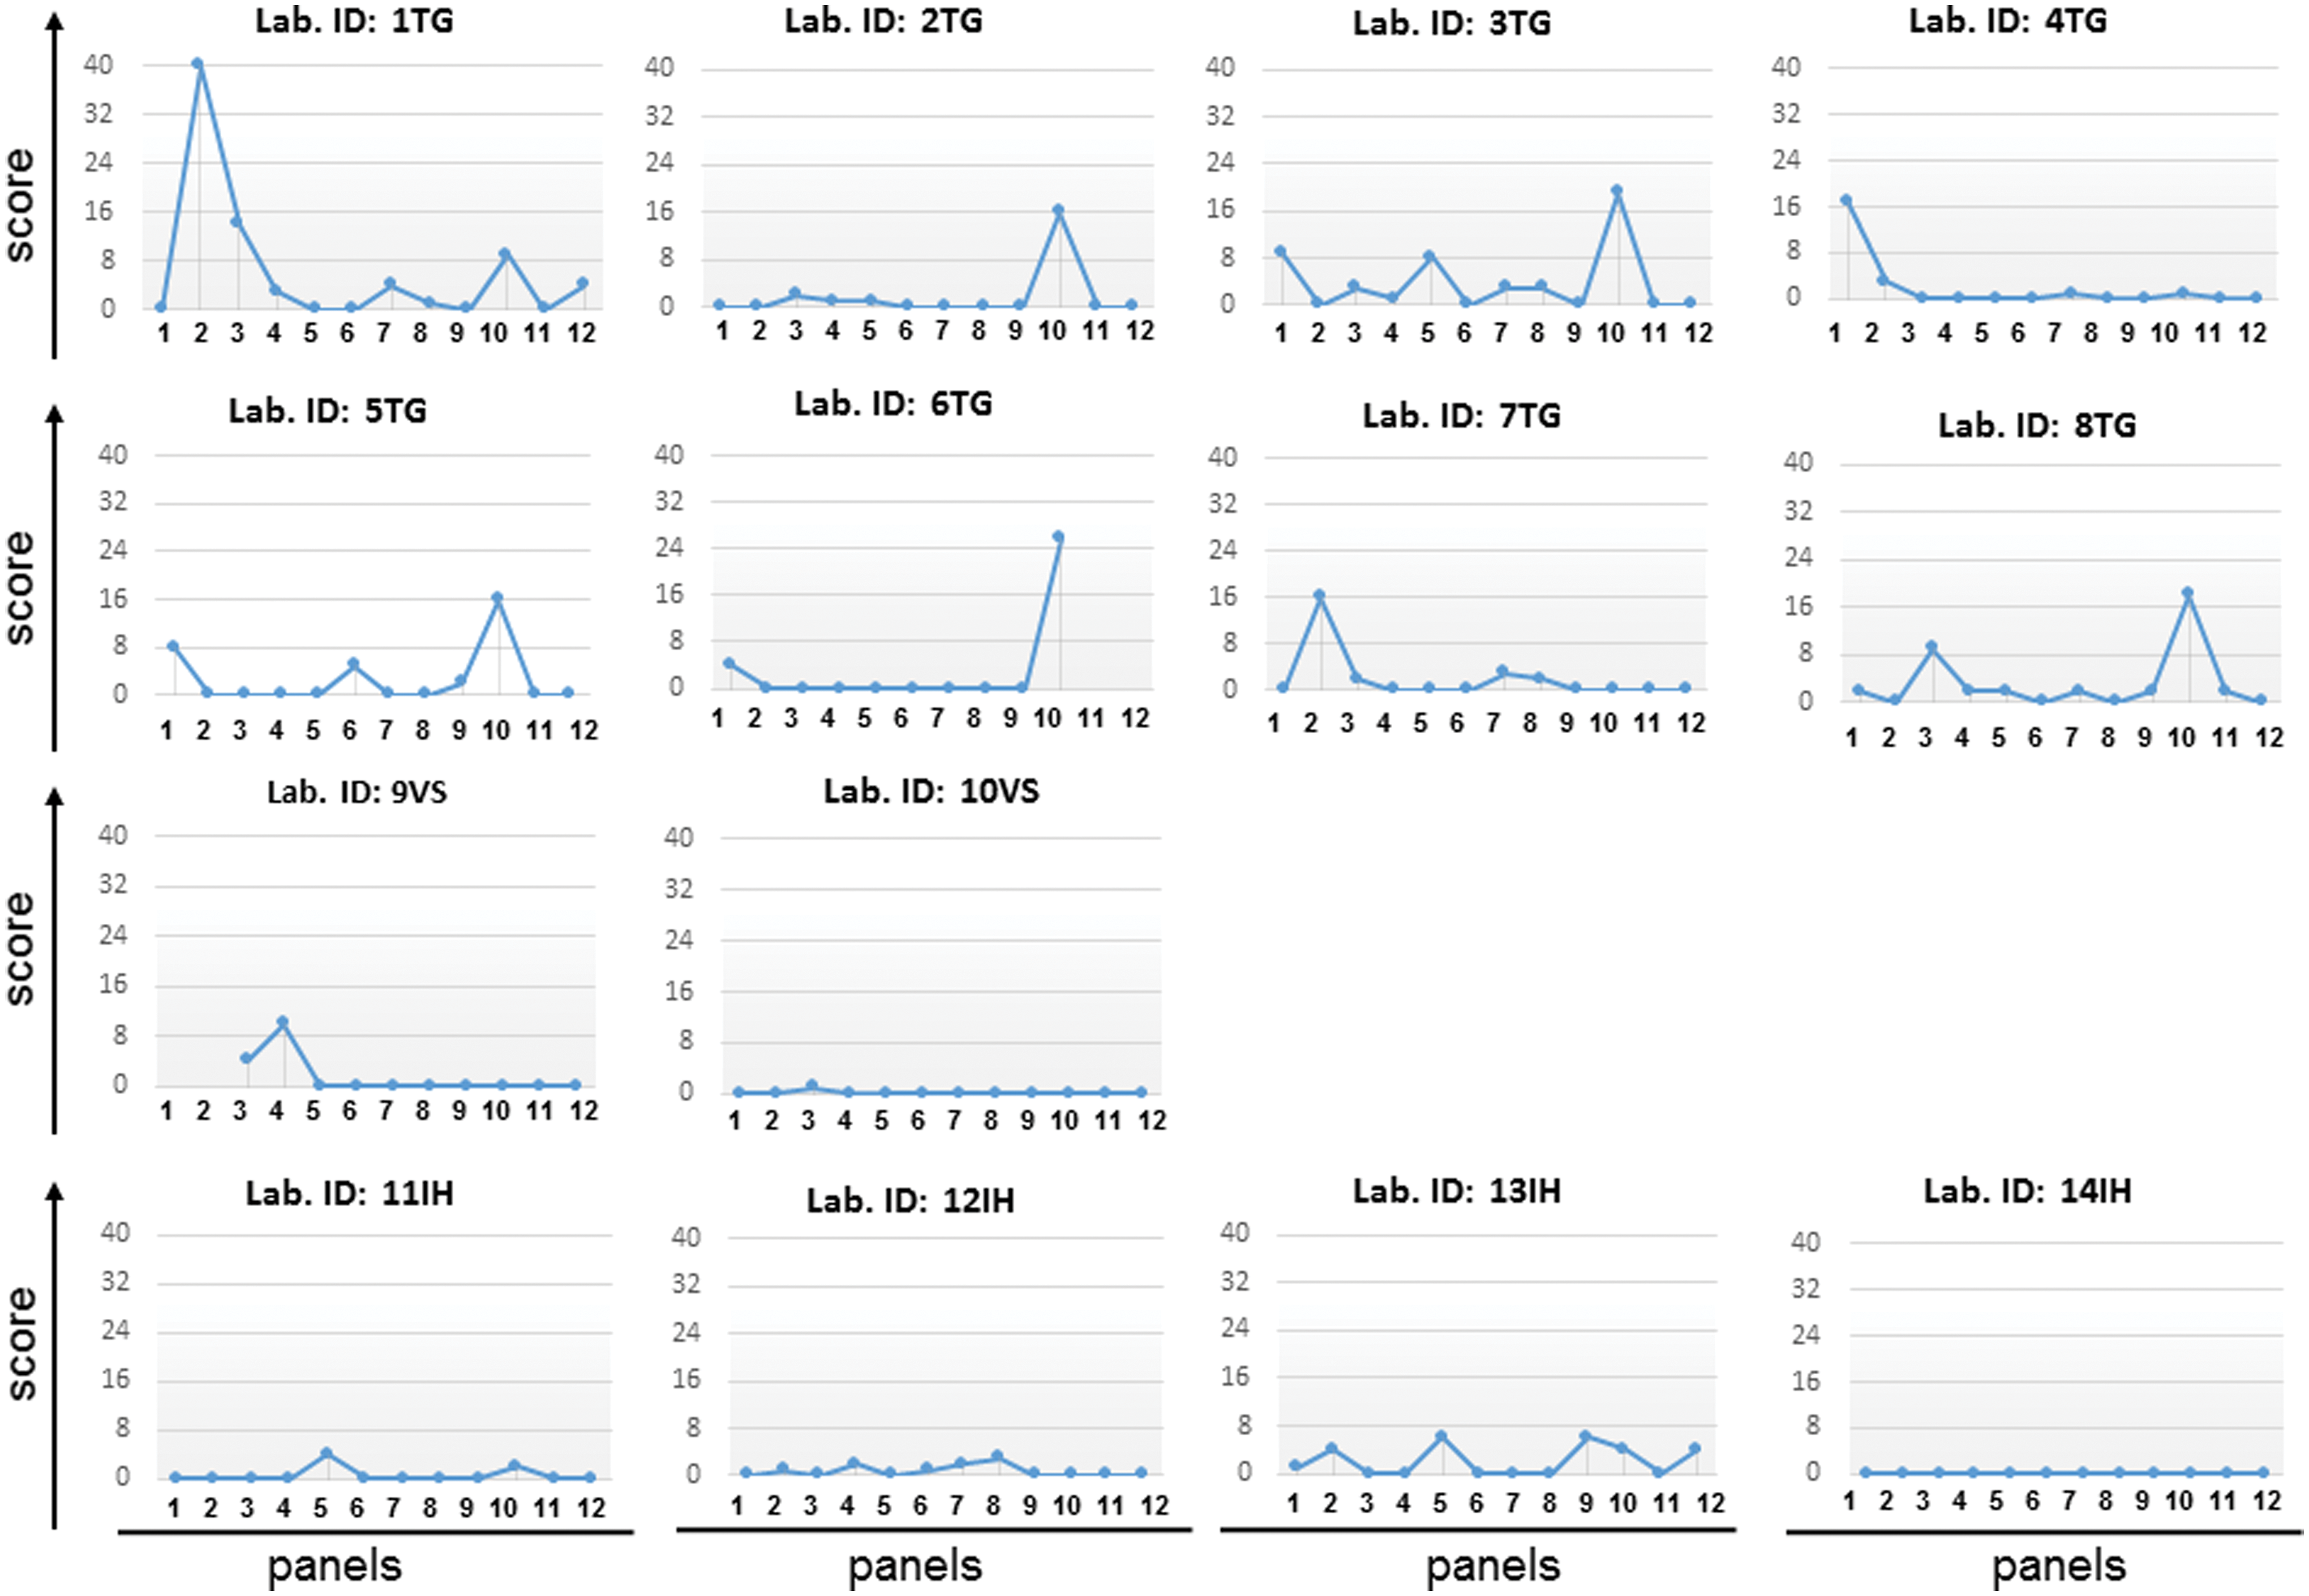
Results of scores for evaluating 14 laboratories' performance. The names of the laboratories are shown above the scores. The x-axis indicates the panel for evaluation (panels 1–14), and the y-axis indicates the total score. Color images available online at
To calculate the average penalty score between platforms, we found that TG, IH, and VS platforms' average penalty scores were 2.10 (95% CI: 0.96–3.25), 0.75 (95% CI: 0.35–1.85), and 0.77 (95% CI: 0.28–1.27), respectively. There was no significant difference in penalty scores (p = .164). Nevertheless, we excluded the 10th panel due to a nonamplification result. Comparison by t-test of scores between the past years (panels 1–6) and recent years (panels 7–12) showed that the total penalty score of the TG laboratories decreased significantly over time (t = 2.362, p = .001). A nucleotide frame-shift error occurred as one- or two-nucleotide insertions, whereas deletions were considered to indicate errors of sequence analysis and manual editing; these were assigned 4 penalty points each. Interestingly, only TG laboratories (5TG, 7TG, 1TG, and 6TG) reported nucleotide frame-shift errors in panels 1, 2, 7, and 10, respectively. However, none of these laboratories reported nucleotide frame-shift errors a second time.
Comparison of ARV susceptibility and DRM among laboratories
The participating laboratories submitted their results regarding ARV susceptibility and DRMs, which are important parameters for some interpretation software packages. We compared ARV drugs and the list of mutations depending on the kit algorithms in Figure 1a, and then compared them with only one algorithm, the Stanford algorithm, in Figure 1b. Most of the results for the same kit were similar, especially concerning the ARV interpretation of d4T-3TC-NVP, which was available in Thailand at the time of blood collection, although a few of the results differed between kits. For example, sample 2C showed different kit interpretations (Fig. 1a and b). DR mutations were related to ARV susceptibility; for example, 2TG to 8TG, found in K70R, V75M, K101H, M184V, G190A, and K219Q, showed susceptibility (blue color) to abacavir (ABC), didanosine (DDI), tenofovir (TDF), etravirine (ETR), and delavirdine (DLV) and possible resistance (yellow color) to AZT. IH assays (11IH to 14IH) and 10VS found the same DR mutations, but their ARV susceptibility profiles were different from the results of the TG laboratories.
Moreover, we identified the T69 insertion (T69i) only with the use of the IH and VS kits; no TG laboratories reported T69i in sample 2C (Fig. 1a). We submitted all of the nucleotide sequences to the Stanford database, and then compared the new results as shown in Figure 1b. The results revealed that T69i was found in all TG laboratories, except 7TG. All of those TG laboratories had the same DR mutations and ARV susceptibility. The results of 7TG still showed susceptibility to TDF and intermediate resistance to AZT due to the absence of the T69i mutation. Among the TG laboratories, the interpretation system was revised several times. Until 2011, the 6TG laboratory used version 12.0, a different version from other TG laboratories, but it later used the same version as the others.
The same platform with different versions of the guidelines yielded different interpretations
The same platforms equipped with different versions of the guidelines led to different interpretation results. Among the TG laboratories, the old version of the guidelines, version 14.0, indicated that I13V, G16E, M36I, H69K, and L89M were PR mutations, but the new version, version 16.0, only identified M36I as a mutation. In contrast, different platforms showed different ARV susceptibilities as their interpretation results. For sample 2C, the TG and IH/Stanford database identified K101H as an NRTI mutation; however, VS version 2.5 showed it as another mutation. Similarly, for sample 6B, K103R was detected as having an NRTI mutation by the Stanford database and VS, but TG did not detect it (data not shown). Finally, for sample D in the same panel, the Stanford database and VS showed D67G as an NRTI mutation, but TG did not detect it. K20R and M36I identified from TG with guideline 14.0 were counted as PR mutations, whereas the Stanford database and VS version 2.8 did not count them as mutations.
Seven and six TG laboratories could not amplify the 10B and 10E samples, respectively, which are CRF01_AE subtypes. Six of the eight TG laboratories (1TG, 2TG, 3TG, 5TG, 6TG, and 8TG) could not amplify sample 10B, and five TG laboratories (2TG, 3TG, 5TG, 6TG, and 8TG) could not amplify sample 10E. One 1TG laboratory could not amplify one of two reproducible samples, 10B and 10E, which were revealed to be the same sample of CRF01_AE, and the viral load was 47,900 copies/mL. These data are shown in Supplementary Table S1.
One 1TG laboratory could not amplify one of two reproducible samples, 3B and 4B. The same sample had a viral load of 3,500 copies/mL and the CRF01_AE subtype.
Discussion
Our results demonstrated that the Thai EQA scheme is important for building capacity in participating laboratories in Thailand. One advantage of participation is that the laboratories can monitor their performance as judged by the continuous penalty score and investigate the source of laboratory errors, providing opportunities for laboratories to be trained with specific programs annually, such as a program regarding the T69 insertion report and a bioinformatics program.
The HIV-1 DR genotyping assay differs from molecular techniques for sequencing, sequence editing, and ARV drug interpretation. Therefore, the quality of the sequences depends on the editing proficiency of the laboratory staff. It can be a challenge to maintain a high quality of technical expertise among laboratory staff in terms of reproducibility and accuracy.
One laboratory (1TG) could not amplify one of two reproducible samples due to low viral load and an issue with the viral subtype used, and could not return data on time in the second panel, which might have caused a technical error rather than a systemic error, as reflected in the fluctuation of the penalty score. One CRF01_AE sample could not be amplified by most of the TG laboratories. Therefore, our scheme demonstrates two major factors affecting laboratory performance: the kit used and the viral subtype.
The mutations (I13V, E35D, M36I, R41K, H69K, L89M) are unique amino acids in CRF01_AE and not generated under exposure to selective drug pressure. 14 Our present findings showed that the old TG software version reported polymorphisms as DRMs.
Our study showed that the same platform using different versions of the guideline resulted in different interpretations, suggesting that companies need to upgrade their software systematically as new versions are released. We also observed that variation in the interpretation of ARV susceptibility occurred when laboratories did not detect nucleotide mixtures, did not detect DRMs, used different interpretation systems, or interpreted resistance differently from the same or similar codon changes.
Compared with other EQA schemes, lower performance scores from the TREAT Asia Quality Assessment Scheme (TAQAS) 15 and VQA indicate better laboratory performance, whereas lower performance scores in the QCMD scheme indicate worse laboratory performance. The numbers of participating laboratories in the QCMD, TAQAS, and VQA/WHO schemes were 122, 23, and 55, respectively, but a total of only 14 laboratories participated in Thailand. The small number of participating laboratories impacts the level of agreement with the nucleotide consensus, the nonconfidential data of the laboratory, and the EQA cost. The government needs to modify the budget as a policy initiative to support and maintain the quality of HIV testing laboratories.
Our findings highlight the advantages of EQA participation. Performance scoring has provided useful information on the improvement of laboratory performance over the past 6 years or the time of scaling up of DR laboratories in Thailand. In addition, the comparison of DRM and ARV susceptibility gave more useful information on CRF01_AE. The assays involve several steps based on template amplification through PCR and specimens containing quasi-species of HIV. It is difficult to maintain high-quality, accurate, and reproducible performance; therefore, to maximize the reliability of genotyping data generated from several laboratories in Thailand, a rigorous quality assurance system is required for an annual EQA program with blinded specimens. Our EQA is a well-organized mechanism and accredited by ISO/IEC 17043 to ensure the quality of the EQA provider regarding technical and management requirements that help achieve this goal. The results of this study underscore the need for laboratory participation in the ongoing EQA program and the optimization of assays with CRF01_AE samples.
Footnotes
Acknowledgements
This research was supported by the National Heath Security Office and the Department of Medical Sciences, Ministry of Public Health, Thailand through an annual grant for quality assessment systems for all laboratories in Thailand. This study was also partially supported by the Japan Initiative for Global Research Network on Infectious Diseases (J-GRID) from the Ministry of Education, Culture, Sports, Science & Technology in Japan, and the Japan Agency for Medical Research and Development (AMED). We thank our enthusiastic laboratory participants who provided many useful suggestions for continuous quality improvement. We appreciate Ms. Sirirat Likanonsakul and her staff for assistance with the clinical samples and valuable advice. We thank Dr. Ekawat Pasomsub for constructing the phylogenetic tree.
Author Disclosure Statement
The authors declare that they have no competing interests of either a financial or nonfinancial nature regarding the work described in this article and its publication.
References
Supplementary Material
Please find the following supplemental material available below.
For Open Access articles published under a Creative Commons License, all supplemental material carries the same license as the article it is associated with.
For non-Open Access articles published, all supplemental material carries a non-exclusive license, and permission requests for re-use of supplemental material or any part of supplemental material shall be sent directly to the copyright owner as specified in the copyright notice associated with the article.