
Abstract
The presence of many highly unusual HIV-1 mutations at a minority variant threshold by next-generation sequence (NGS) may indicate that a high proportion of variants at or just above the threshold represent PCR errors. The validity of this hypothesis depends on the concept that highly unusual mutations detected by population-based sequencing are also highly unusual within a person's virus population. Highly unusual mutations were defined as mutations with a prevalence <0.01% in group M HIV-1 direct PCR population-based Sanger sequences in the Stanford HIV Drug Resistance Database. Single genome Sanger sequences [single genome sequences (SGSs)] were analyzed because they are not subject to PCR error. Permutation analyses compared the proportion of highly unusual mutations in SGSs with the empirical frequencies of these mutations in repeated random selections of population-based sequences. We created a database of 11,258 pol SGSs in 963 plasma samples from 345 persons with active virus replication and analyzed the subset of samples containing 10 or more SGSs. Highly unusual mutations occurred more commonly in samples undergoing SGS compared with population-based sequencing in protease (3.9% vs. 0.8%; p < .001), reverse transcriptase (6.5% vs. 1.5%; p < .001), and integrase (5.0% vs. 1.8%; p < .001). Highly unusual mutations occur more commonly in SGSs than in population-based sequences. However, they comprise a small proportion of all SGS mutations supporting the concept that the presence of many highly unusual mutations just above an NGS threshold suggests that the threshold is too low.
Introduction
Next-generation sequencing (NGS) is increasingly performed for HIV-1 genotypic resistance testing. 1 However, low levels of plasma viremia and/or inefficient RNA extraction, reverse transcription, or PCR amplification may result in a low number of amplifiable cDNA templates. In such scenarios, as well as when the threshold for detecting low abundance variants is set too low, much of the observed variability in an NGS sequence may reflect PCR error rather than authentic mutations. 2 Distinguishing between these possibilities is important for interpreting the results of deep NGS.
We have previously hypothesized that an excess of highly unusual mutations—mutations rarely observed by population-based dideoxynucleoside Sanger sequencing in public sequence databases—at a particular NGS threshold suggests that the unusual mutations reflect PCR error rather than authentic variants. In this scenario, we have suggested that a higher NGS threshold should be used for detecting low abundance variants because both the unusual and usual mutations above the original threshold are likely at increased risk of being PCR artifacts. 3 –5 This hypothesis depends, in part, on the concept that mutations that are highly unusual by population-based sequencing are also highly unusual even at low levels within a person's virus population.
To determine whether the distribution of mutations at low levels in a person's virus population differs from the distribution of mutations in public sequence databases, we catalogued the distribution of amino acids observed in published single genome sequencing (SGS) studies. SGSs were studied, as the limiting dilution step down to one cDNA molecule before PCR amplification prevents SGSs from containing PCR errors. In contrast, PCR errors are often the main cause of artifactual mutations detected at low thresholds by NGS. 6,7 Therefore, most of the amino acid variants detected by SGS are likely to be authentic even if they are present at low levels, whereas the same cannot be said for low abundant variants detected by most NGS studies, particularly those that do not contain a unique tag for each cDNA molecule. 8
To perform this study, we created a publicly available database of published SGSs and determined whether the distribution of amino acid variants in SGSs differs from the distribution of such variants in published population-based sequences in the Stanford HIV Drug Resistance Database (HIVDB).
Methods
Identification of studies with SGSs
A TBLASTN search of the NCBI-GenBank virus sequence database (release date February 15, 2019) was performed using the HIV-1 subtype B consensus pol amino acid sequence. BLAST hits with an e-value <10−8 were aggregated into submission sets sharing the same GenBank TITLE and AUTHORS fields. All submission sets were then reviewed for those in which multiple clones were sequenced for the same plasma sample using dideoxynucleoside Sanger sequencing. Studies in which cloning was done by limiting dilution before PCR amplification (i.e., SGS) were distinguished from those studies in which cloning was done after PCR amplification (i.e., molecular cloning).
Studies that contained ≥100 pol SGSs were added to a database containing (i) the PubMed ID and associated reference metadata; (ii) each nucleotide sequence annotated with the GenBank accession number, gene(s), collection date, personal identifier, and specimen source, and (iii) the antiretroviral treatment (ART) experience of the person from whom viruses underwent sequencing, including whether the person was virologically suppressed. The number of nucleotide ambiguities for each sequence was determined; SGSs containing more than two ambiguities in pol were excluded as nucleotide ambiguities should occur only very rarely in SGSs.
Definition of highly unusual mutations
Highly unusual mutations were defined using a procedure described in a GitHub repository (
Sequence analyses
Only those SGSs obtained from plasma in patients without virological suppression were included as plasma viruses in virologically suppressed patients are often derived from a small number of clonally expanded latently infected cells. 9 For each sequence, the HIV-1 subtype and list of mutations defined as differences from the subtype B consensus sequence were determined. Only RT positions 1–240, the most commonly sequenced, were analyzed: HIVDB contains extensive prevalence data on the mutations in this region, but less prevalence data for the more downstream parts of the RT gene. Signature APOBEC mutations defined as those specific for APOBEC-mediated RNA editing were determined, with the presence of three or more being associated with a high probability of G-to-A hypermutation. 4 Highly unusual mutations, defined as those having a prevalence of <0.01% in HIVDB, were also identified.
Each distinct mutation observed in the SGS dataset was catalogued according to whether the mutation was observed in a single SGS compared with two or more SGSs in the complete dataset. The rationale for this distinction is as follows: although SGS should not contain PCR errors, errors may be introduced when extracted RNA is reverse transcribed to cDNA (RT error). Such errors have been estimated to occur at frequencies of between 1 in 105 and 1 in 104 nucleotides, depending on the commercial enzyme used for reverse transcription and on the RNA sequence context. 6 However, compared with mutations observed in a single SGS, those occurring in ≥2 SGSs would be much less likely to represent RT errors.
Comparison of SGS dataset mutations with population-based sequencing mutations
Permutation analyses for PR, RT, and IN were performed to determine whether the numbers of mutations and highly unusual mutations differ between SGSs compared with previously published population-based dideoxynucleoside Sanger sequences obtained from an equal number of persons. This analysis involved repeatedly sampling, 1,000 times for each gene, population-based sequences from HIVDB equal to the number of samples from which PR, RT, and IN SGSs had been obtained. Each sampling was designed to have the same distribution of subtypes and ART history as the sequences in the SGS dataset. For each population-based sequence, the total number of mutations, highly unusual mutations, and the proportion of mutations that were highly unusual was calculated.
To determine whether the total number of mutations, highly unusual mutations, and proportions of highly unusual mutations per person undergoing SGS differed from these proportions in population-based sequences, we compared the means of these values in the SGS dataset with the distribution of these values in the 1,000 samplings of population-based sequences. The uncorrected p-value was the tail probability of the mean values for the SGS dataset relative to the empirical distribution of the mean values for the population-based sequences.
Results
Description of published SGS studies
Twenty-six published studies containing data from 963 plasma samples, from 345 persons with active virus replication (i.e., not virologically suppressed) were identified. The studies contained 8,976 PR SGSs in 681 samples from 310 persons, 10,267 RT SGSs in 929 samples from 328 persons, and 5,438 IN SGSs in 422 samples from 233 persons. After excluding samples with fewer than 10 SGSs, the dataset included 7,831 PR SGSs in 404 samples from 195 persons, 8,493 RT SGSs in 429 samples from 206 persons, and 4,506 IN SGSs in 253 samples from 143 persons. Of the RT SGSs, 78.5% encompassed positions 1–240. Around 67.9% of patients had one sample and 32.1% had two or more samples. There was a mean of 20.7 (range: 10–166) and a median of 18 SGSs (interquartile range: 12–23) per sample. Around 65.7% of SGSs belonged to subtype B; 23.1% to subtype C; and 11.2% to other subtypes or circulating recombinant forms. The complete set of sequences from these studies is available at
Characterization of SGS mutations
The mean number of SGS mutations per sample was 9.1 for PR, 13.8 for the first 240 positions of RT, and 17.1 for IN (Table 1). Overall, 3.9% of PR, 6.5% of RT, and 5.0% of IN SGS mutations per sample were highly unusual (Table 1).
Mean Number of Mutations and Highly Unusual Mutations Per Sample Containing ≥10 Single Genome Sequences
RT, reverse transcriptase; PR, protease; IN, integrase; SGS, single genome sequence.
There was a strong correlation between the prevalence of each SGS mutation and its prevalence in population-based sequences in HIVDB: PR (r 2 ; Pearson correlation coefficient) = 0.92, RT (r 2 ) = 0.86, and IN (r 2 ) = 0.88 (Table 2). While similar high correlations were observed when the analysis was confined to ART-naïve persons, the correlations in PR and RT were somewhat lower when the analysis was confined to ∼10% of persons who received ART: PR (r 2 ) = 0.66 and RT (r 2 ) = 0.69 (Table 2). Similar high levels of correlation were found when the analysis was done separately for subtype B, subtype C, and subtypes other than B and C (Table 2).
Correlation of Mutation Prevalence (r 2 ) in Single Genome Sequences Versus Population-Based Sequences
The subscript contains the number of persons from whom sequences were obtained.
Table 3 shows that mutations occurring in a single SGS were significantly more likely to be highly unusual compared to those occurring in ≥2 SGSs. In addition, 44/78 (56.4%) of highly unusual PR mutations, 146/247 (59.1%) of highly unusual RT mutations, and 117/161 (72.7%) of highly unusual IN mutations occurred in just a single SGS. Supplementary Tables S1, Supplementary Tables S2, S3 list each of the highly unusual PR, RT, and IN mutations that occurred in ≥3 persons and show their overall number of occurrences. With few exceptions, these mutations resulted from transitions. They also did not appear to result from any consistent pattern of nucleotide substitutions as has been observed with APOBEC3F and 3G-mediated RNA editing.
Numbers and Percents of Distinct Highly Unusual Mutations in the Complete Single Genome Sequencing Dataset
Highly unusual mutations were defined as mutations with a prevalence <0.01% in the Stanford HIV Drug Resistance Database.
Fisher's exact test.
Comparison of SGS dataset mutations with population-based sequencing mutations
The distribution of the number of mutations, number of highly unusual mutations, and proportion of mutations that were highly unusual for the 1,000 repeated samples of PR sequences from 404 virus samples is shown in Figure 1: the distribution had a mean of 7.7 mutations, of which 0.056 (0.73%) were highly unusual. Among the SGS samples, the mean number of mutations (9.1), mean number of highly unusual mutations (0.35), and the proportion of mutations that were highly unusual (3.9%) were higher than the corresponding numbers detected in all of the 1,000 samplings of population-based PR sequences from an equal number of samples (p < .001 for all three comparisons).
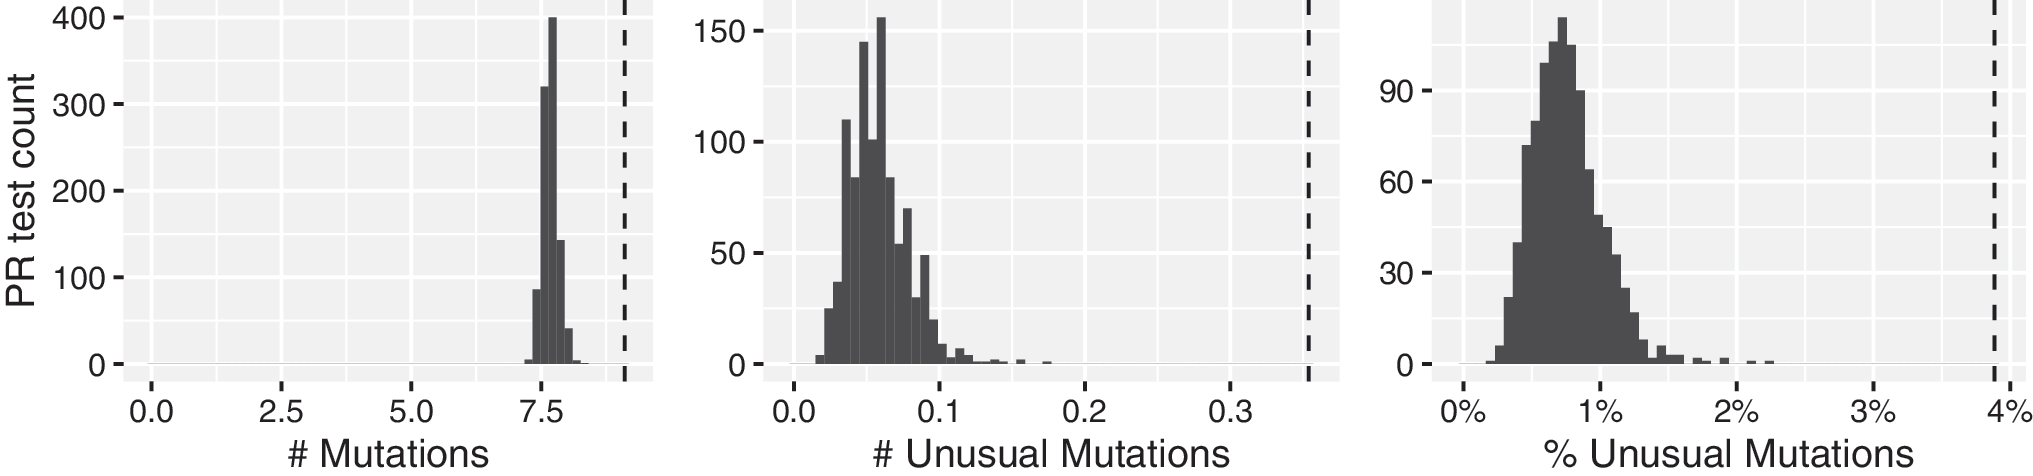
Distribution of the expected numbers of mutations, numbers of highly unusual mutations, and proportions of mutations that are highly unusual in 1,000 direct PCR population-based sequences of HIV-1 protease from 404 virus samples, from 195 persons matched for subtype and antiretroviral treatment exposure to the SGS dataset. Histograms: sampling distribution. Dahsed line: mutations present in ≥1 SGSs. SGS, single genome sequence.
The distribution of the number of mutations, number of highly unusual mutations, and proportion of mutations that were highly unusual for the 1,000 repeated samples of RT sequences from 429 virus samples is shown in Figure 2: the distribution had a mean of 10.0 mutations, of which 0.153 (1.53%) were highly unusual. Among the SGS samples, the mean number of mutations (13.8), mean number of highly unusual mutations (0.90), and the proportion of mutations that were highly unusual (6.5%) were higher than the corresponding numbers detected in all of the 1,000 samplings of population-based RT sequences from an equal number of samples (p < .001 for all three comparisons).
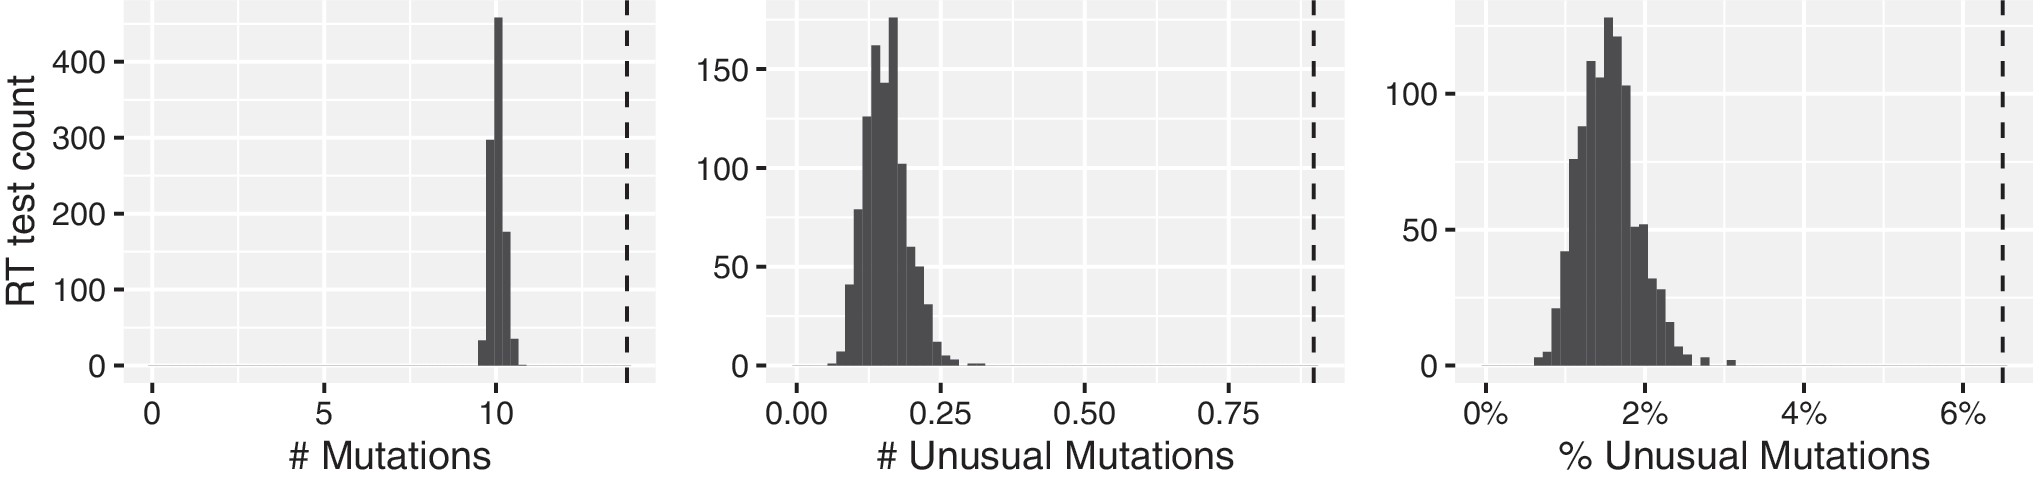
Distribution of the expected numbers of mutations, numbers of highly unusual mutations, and proportions of mutations that are highly unusual in 1,000 direct PCR sequences of HIV-1 RT from 429 virus samples, from 206 persons matched for subtype and antiretroviral treatment exposure to the SGS dataset. Histograms: sampling distribution. Dashed line: mutations present in ≥1 SGSs. RT, reverse transcriptase.
The distribution of the number of mutations, number of highly unusual mutations, and proportion of mutations that were highly unusual for the 1,000 repeated samples of IN sequences from 253 virus samples is shown in Figure 3: the distribution had a mean of 12.1 mutations, of which 0.195 (1.62%) were highly unusual. Among the SGS samples, the mean number of mutations (17.1), mean number of highly unusual mutations (0.85), and the proportion of mutations that were highly unusual (5.0%) were higher than the corresponding numbers detected in all of the 1,000 samplings of population-based IN sequences from an equal number of samples (p < .001 for all three comparisons).
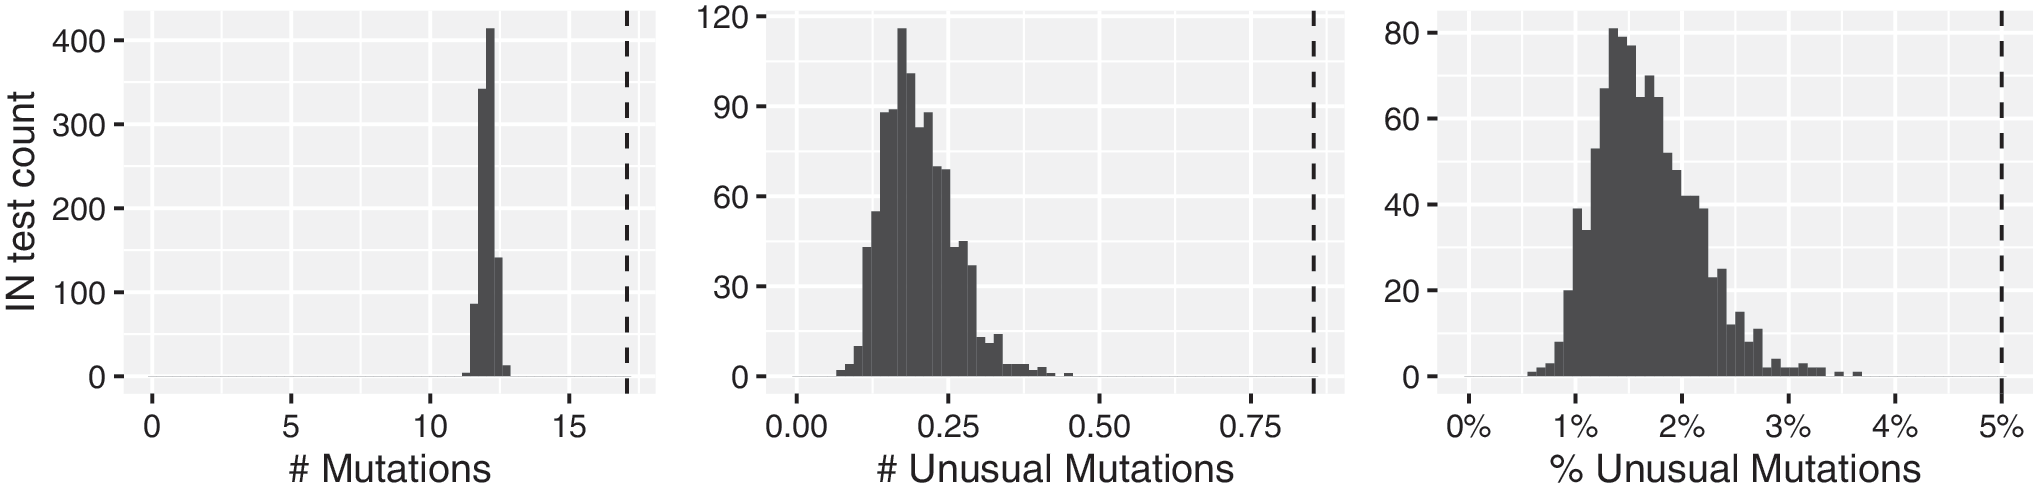
Distribution of the expected numbers of mutations, numbers of highly unusual mutations, and proportions of mutations that are highly unusual in 1,000 direct PCR sequences of HIV-1 integrase from 253 virus samples, from 143 persons matched for subtype and antiretroviral treatment exposure to the SGS dataset. Histograms: sampling distribution. Dashed line: mutations present in ≥1 SGSs.
Signature APOBEC mutations and stop codons
Among the PR SGSs, there were a total of 54 signature APOBEC mutations, of which 13 were stop codons. In addition, there were five stop codons in PR that did not occur in an APOBEC3F (GA → AA) or APOBEC3G (GG → AG) context. Among the RT SGSs, there were a total of 156 signature APOBEC mutations, of which 35 were stop codons. In addition, there were 21 stop codons in RT that did not occur in an APOBEC3F or 3G context. Among the IN SGSs, there were a total of 95 signature APOBEC mutations, of which 3 were stop codons. In addition, there were seven stop codons in IN, which did not occur in an APOBEC3F or 3G context. Overall, 1 (0.01%), 10 (0.11%), and 7 (0.08%) of PR, RT, and IN SGSs had three or more signature APOBEC mutations.
Discussion
This study showed that highly unusual mutations in HIV-1 PR, RT, and IN occur in higher numbers and in higher proportions in SGSs compared with population-based sequences. Depending on the gene, ∼4% to 6.5% of mutations in SGSs were highly unusual, a proportion three to five times higher than that observed by population-based sequencing. This likely reflects the fact that single genome sequencing detects low-abundance variants with reduced fitness that are less likely to reach levels at which they would be detected by population-based sequencing, which usually requires that a variant be present in ≥20% of the virus population in a plasma sample.
However, despite the greater propensity for SGSs to contain highly unusual mutations, only a small proportion of mutations were highly unusual and there was a strong correlation between the prevalence of mutations within SGSs and within population-based sequences. Our findings therefore support the concept that the presence of many highly unusual mutations at a low NGS threshold is more consistent with PCR artifact rather than the likelihood that highly unusual mutations are numerous at low levels in plasma virus populations.
Although SGSs are not subject to PCR error, they are subject to errors when extracted RNA is reverse transcribed to cDNA. The estimated RT error rate has been reported to be between 1 in 104 and 1 in 105 nucleotides, but in contrast to PCR errors, RT errors are not compounded during multiple cycles of amplification. 6 Therefore, it is possible that some proportion of the highly unusual mutations detected by SGS represents RT errors. This possibility, however, would not substantially alter the results of our analysis and would only strengthen our conclusion that highly unusual mutations remain uncommon even among SGSs.
Empirical thresholds for reporting mutations detected by NGS are usually between 0.5% and 5%. The use of lower thresholds in this range has usually been based on NGS workflow error rates estimated by amplifying and sequencing plasmid clones. When plasmid clones are sequenced, observed differences from the plasmid sequence represent artifacts most commonly resulting from PCR amplification and less commonly from the RT step or the sequencing platform. 6,10,11
The use of higher thresholds in this range has usually been based on at least two observations. First, clinical samples often have lower cDNA copy numbers than plasmid DNA preparations and thus undergo more amplification during PCR (i.e., the higher DNA copy number in plasmids results in early saturation and fewer cycles in which nucleic acid amplification occurs). Second, PCR enzymes vary markedly in their error rates, 6,11,12 and, in clinical settings, the specific PCR enzymes used and/or their error rates may not be known to those performing sequence analysis.
Two factors suggest that examining the proportion of highly unusual mutations at different thresholds could be useful for identifying thresholds that carry a high risk of detecting mutations produced by PCR error rather than by virus replication. First, PCR errors are more likely to produce highly unusual mutations because in contrast to authentic biological variants, they do not need to be consistent with successful virus replication. Second, as the threshold for calling minority variants is lowered, there is an increased likelihood that a mutation at or just above the threshold reflects a PCR error versus an authentic biological variant. Therefore, a marked change in the proportion of highly unusual mutations as the minority variant threshold is lowered suggests a shift from a process in which nearly all mutations result from virus replication to one in which an unacceptably high proportion of mutations result from PCR error.
Studies of PR, RT, and IN SGSs have provided insight into HIV-1 quasispecies in many clinical contexts such as following initial infection, 13,14 during suppressive antiretroviral therapy, 15 and following discontinuation of suppressive antiretroviral therapy. 16 However, the SGSs from these diverse studies have not been catalogued or analyzed in a systematic manner. This study describes the creation of an online database containing the majority of published studies containing HIV-1 pol SGSs in GenBank and the first meta-analysis of such sequences. This meta-analysis sought to determine whether mutations that are highly unusual in population-based sequences are also unusual at the lower frequencies, which can be detected by single genome sequencing. Our results demonstrate the usefulness of HIV-1 pol SGSs for answering questions about mutation prevalence in HIV-1 quasispecies and have relevance for choosing minority variant thresholds for NGS genotypic resistance testing.
Footnotes
Supplementary Material
Supplementary Table S1
Supplementary Table S2
Supplementary Table S3
Author Disclosure Statement
No competing financial interests exist.
References
Supplementary Material
Please find the following supplemental material available below.
For Open Access articles published under a Creative Commons License, all supplemental material carries the same license as the article it is associated with.
For non-Open Access articles published, all supplemental material carries a non-exclusive license, and permission requests for re-use of supplemental material or any part of supplemental material shall be sent directly to the copyright owner as specified in the copyright notice associated with the article.