
Abstract
Significant progress has been made in the diagnostics and treatment of AIDS since the discovery of the human immunodeficiency virus type 1 (HIV-1) in 1983. The remarkable effectiveness of combined antiretroviral therapy (cART) is evidenced by mortality reduction, control of peripheral blood viral load, and in a nearly normal quality of HIV patients' lives. Remaining obstacles in treatment and cure are drug toxicities and side effects, viral resistance, persistence of HIV-1 reservoirs on termination of cART treatment, the cost of lifelong antiretroviral therapy, and the stigma associated with taking antiretroviral drugs. As determined by plasma viral RNA and peripheral blood mononuclear cells (PBMC) proviral DNA, we show improved suppression of productive HIV infection in human CD34+ hematopoietic stem cell-engrafted NOD (nonobese diabetic)-SCID (severe combined immunodeficiency)-il2rg−/− (NSG) mice by combined treatment with cART and CCR5 targeting drugs, compared with cART alone, as well as an increased preservation of human CD4+ T cells (defined as CD45+ CD3+ CD4+ cells) and CD4+/CD8+ cell ratios in infected mice. The data also suggest a possible reduction in viral reservoirs. Our data confirm that this animal model is suitable for detection of productive HIV infection, replication, and establishment of viral reservoirs. The data also provide proof of principle for the utility of combining CCR5 targeting drugs, maraviroc and rapamycin, with traditional cART to improve control of viremia and reduce viral reservoirs. This study thus serves as a model for future HIV-1 studies that could lead to the clinical development of new generations of antiretroviral drugs.
Introduction
The main obstacle in the treatment and eradication of human immunodeficiency virus type 1 (HIV-1) replication rests in finding sites of both persistent and latent 1 –4 viral infection that occurs despite relatively potent combined antiretroviral therapy (cART). 5 –8 More specifically, virus replication in tissues continues in cART-treated patients with undetectable viremia in their bloodstream 9 and likely represents ongoing low-level viral replication or by release of virus from latently infected cells.
There are numerous ongoing efforts to explore the most effective ways to intensify standard cART 10 –14 so as to more greatly impact ongoing viral propagation. We anticipate that the molecular evolution of the virus that is detected due to viral propagation during cART (even in the absence of viremia) could be reduced by a combination of cART with entry inhibitors, due to the establishment of fewer or smaller reservoirs and a concomitant reduction in residual viral replication. 12,13,15 This idea is based on indications that treatment intensification with entry inhibitors has been associated with a reduction in infected cells containing 2-LTR+ unintegrated circular DNA, a marker for new infections. 7
Persistent infection sites include long-lived CD4+ T cell subpopulations (hereafter, CD4+ T cells denote human CD4+ T cells) along with myeloid lineage cells. 16,17 Persistent latent infection occurs when integrated HIV-1 remains transcriptionally inactive in host cells, enabling the provirus to evade cART drugs and immune responses. 9,18 –21 Latently infected cells survive in the central nervous system, lymph nodes, spleen, and gut, where the inability of drugs to reach some of the sites of infected cells is an obstacle for an HIV cure. 5,6,22,23 High RNA copy numbers in the peripheral blood of HIV-1 patients are sometimes seen with low CD4+ T cell counts, suggesting that low-level viral reactivation in monocytes/macrophages may contribute to viremia. Thus, identifying the sites of both latent and active virus is a critical step toward an HIV-1 cure, as is a better understanding of HIV-1 target cells and their role in immune responses. Those aspects of human retroviral infection cannot be fully investigated when using only in vitro systems. 24 There is need for an alternative reliable in vivo approach that could be met by humanized mouse models.
An appropriate valid mouse model would be extremely useful, considering the limited availability of human tissue at various stages of the disease and treated with differing regimens. Nonhuman primate models have the dual disadvantages of expense and of Simian immunodeficiency virus (SIV) infection being an inexact model for HIV-1 infection. 7 HIV-1-infected, newborn humanized NOD (nonobese diabetic)-SCID (severe combined immunodeficiency)-il2rg−/− (NSG) mice 25 –28 mimic the critical features of human infection, and the model appears suitable to explore new antiretroviral and adjunctive therapies. 11,24 The present study was designed and conducted to explore whether NSG-CD34+ mice reconstituted with CD34+ human stem cells (HSC; NSG-CD34+ mice) 25 –27 infected with HIV-1 are useful for studying whether the addition of CCR5 targeting drugs to standard cART offers advantages over standard cART alone.
We have previously shown that humanized NSG adult mice undergo durable productive infection and manifest several aspects of T cell pathogenesis, indicating the potential utility of this model for our antiviral studies. 29 –31 The NSG-CD34+ mouse model is a more assessable model for HIV-1 infection studies than is the BLT mouse model, due to the necessity for transplantation of human liver or thymic tissues with autologous CD34+ HSC 32 and the requirement for time-consuming human cell reconstitution. This particular mouse model has been extensively used by Arainga et al. 25 ; Arainga et al. 33 ; Halper-Stomberg et al. 32 ; Berges et al. 31 ; and Satheesan et al. 30 for HIV inhibition studies. It should be noted, however, that potential limitations of mouse models include limited human cell recovery rates and life survival of the human grafts. 33
CCR5, an important receptor for HIV-1 attachment, is an attractive target for antiretroviral therapies because it is relatively dispensable for human health. The natural genetic absence of surface-expressed CCR5 in Δ32 homozygote individuals has little apparent impact on their immune status and general health, 34 suggesting that blocking it will not adversely affect host immune responses, and it thus offers an alternate target for antiretroviral therapies. 35 An observation that supports the potential effectiveness of such an approach is the “Berlin patient” study, 36 in which the patient was intentionally given a bone marrow transplant in which the cells were homozygous for CCR5 Δ32 and therefore resistant to R5 HIV-1. This and other studies 37 –39 suggest that CCR5 targeting drugs will be of therapeutic value, possibly including reducing the establishment of new solid tissue reservoirs. Moreover, combined therapy may allow antiretroviral dose reductions, which would lower toxicities. 40,41
Materials and Methods
NSG newborn mouse engraftment with human cord blood CD34+ cells
Each of 25 newborn NSG pups was transplanted with 100,000 human CD34+ hematopoietic stem cells obtained from fetal cord blood as previously described 26 –28 (donor 28753, Cat. No. 2C-101; Lonza). Pups 3–4 days old were irradiated with 100 cGy and injected via the intrahepatic route with CD34+ cells within 2 h after irradiation. CD34+ cells were thawed, resuspended in 2% fetal bovine serum (FBS) containing RPMI media, washed, counted, and accessed for viability before injections. Animals were housed under pathogen-free conditions at the IHV Animal Facility, School of Medicine, University of Maryland (SOM UM, Baltimore, MD). All experimental protocols were in accordance with the NIH guide for the care and use of laboratory animals and approved (Protocol No. 1215007) by the SOM UM IACUC. Sixteen to 18 weeks after CD34+ HSC transplantation, mice were selected based on the expansion of human CD45+ cells with T > B cells, CD3+ cell numbers higher than CD19+ cell numbers, as determined by flow cytometry.
The 25 mice were divided into two groups, 23 to be infected intraperitoneally (20,000 TCID50% of HIV-1 Bal 200 μL total volume per mouse) at around 18 weeks of age, and 2 to remain uninfected as controls. HIV-1 Bal is an R5 replication competent virus that contains most of the Bal env gene in an HIV-1 IIIB backbone, titer 1 × 10⁶/mL. 42 Viral stocks were provided by the μQuant Core Lab, IHV SOM UM. The NIH regulation 43 mandating inclusion of both genders in experimental groups was respected; each experimental group had sex ratios of 1:1.
Flow cytometry of blood cells
Thirty microliters of mouse blood was mixed with 27 μL containing the following conjugated antibodies: 1 μL CD45− BV421, 3.5 μL CD3− APC, 1.5 μL CD4− FITC, 2 μL CD8− PerCPCy5.5, 2.5 μL CD14− PECy7, 2.5 μL CD19− BV510, and 10 μL CCR5–PE (all antibodies are human specific), and 4 μL staining buffer [1% FBS in 1 × phosphate-buffered saline (PBS)]. Single color controls (the same volumes of each Ab shown above were brought to 27 μL in staining buffer, e.g., 3.5 μL CD3− APC +23.5 μL staining buffer) were separately prepared. Unstained human and mouse samples were used to set the photo multipliers (PMTs) of the flow cytometer (FACS Aria II, Becton Dickinson, IHV Flow Core). These antibodies were selected so as to detect the major subsets of human peripheral blood mononuclear cells, PBMCs. The cells were incubated at 4°C for 45 min, lysed with 500 μL of 1 × BD lysis solution (Cat. No: 349202; BD), fixed with Beckman Coulter fixative (part of the Whole Blood Lysing Reagent Kit, 6603152), washed with staining buffer (1%FBS in 1 × PBS), fixed with 1% paraformaldehyde/1 × PBS, and washed again before flow cytometry using an FACS Aria II.
Analysis of the acquired data was performed using Flow Jo version 10.08 software (Flow Jo LLC). Human CD45+ mononuclear cells were defined by excluding granulocytes and red blood cells by low or no expression of CD45 and their locations on forward/side scatter plots. Human CD4+ T cells were defined by CD45+CD3+CD4+. CD4/CD8 cell ratios were defined by the ratio of CD45+CD3+CD4+ to CD45+CD3+CD8+ cells.
Quantification of plasma HIV-1 RNA viral loads
Peripheral blood samples were collected directly into EDTA-coated tubes. Plasma was isolated from samples by low-speed centrifugation. The samples were collected every 2 weeks during the course of the experiment. RNA was extracted from 40 μL of plasma samples using the QIAamp Viral Mini Kit (Cat. No. 52904; Qiagen). Complementary DNA (cDNA) was synthesized using Super Script III First-Strand Synthesis Super Mix (18080400; Invitrogen) with the maximum amount of RNA (6 μL) along with 1 μL of K39 primer (2 μM concentration) and 1 μL of annealing buffer used immediately for polymerase chain reaction (PCR) amplification in a Simp Amp thermocycler (μQuant Core Lab, IHV SOM UM). cDNA samples were combined with PowerUp SYBR Green Master Mix (Cat. No. A25742—
HIV-1 DNA quantification
We used seminested real-time PCR to measure total HIV-1 DNA from the extracted cellular DNA using the protocol of Palmer et al., 44 with some adjustments. Following separation from plasma, PBMCs were isolated 45 by Ficoll-Hypaque (density 1.007 ± 0.001 g/mL), repeatedly washed with 1 × PBS, lysed with 1 × lysis buffer (Becton Dickinson, North Carolina), washed with 1 × PBS twice, and frozen at −80°C until DNA isolation. DNA was isolated from PBMCs using a QIAGEN DNeasy Blood & Tissue Kit (Cat. No. 69504). Standards for total HIV-1 DNA were from ACH-2 cells containing one integrated HIV-1 DNA copy per cell (Cat. No. 349; NIH Reagents and Repository Program) and U1 cells containing two integrated HIV-1 DNA copies per cell (Cat. No. 165; NIH Reagents and Repository Program). ACH-2 and U1 DNA contained 100,000 and 200,000 copies of integrated HIV-1, respectively, per 1 μg of DNA. Our starting standard concentration was 25 ng/μL of ACH-2 DNA or 12.5 ng/μL of U1 DNA to achieve 12,500 HIV-1 copies per 5 μL. These were serially diluted 1:10 for a total of five standard points. The DNA from the standard PBMC samples was extracted using a QIAGEN DNeasy Blood & Tissue Kit (Cat. No. 69504) and eluted twice in 50 μL AE buffer using the same column. Each elution was combined into one sample before the final concentration reading for both the ACH-2 and U1 cell lines. The primers used to measure total HIV-1 were the HIV-6F forward primer (sequence—5′-CAT GTT TTC AGC ATT ATC AGA AGG A-3′; Integrated DNA Technologies) and HIV-84R reverse primer (sequence—5′-TGC TTG ATG TCC CCC CAC T-3′; Integrated Technologies), which amplify part of the HIV-1 gag gene. The primers used to quantify human cells in the mouse samples were the h-CCR5-F2 forward primer (sequence—5′-GGA GCC CTG CCA AAA AAT C-3′; Integrated Technologies) and h-CCR5-R2 reverse primer (sequence—5′-TGA GTA GAG CGG AGG CAG GA-3′; Integrated Technologies), which amplify CCR5. 39 A master mix of 360 μL PowerUp SYBR Green Master Mix (Cat. No. A25742; Thermo Fisher Scientific), 18 μL of 25 μM HIV-6F primer, 18 μL of 25 μM HIV-84R primer, and 36 μL of PCR-grade water were used. A master mix of 360 μL PowerUp SYBR Green Master Mix (Cat. No. A25742; Thermo Fisher Scientific), 22.5 μL of 20 μM h-CCR5-F2 primer, 22.5 μL of 20 μM h-CCR5-R2 primer, and 27 μL of PCR-grade water were used. For all wells, 30 μL of the master mix and 20 μL of the sample DNA were combined in a total volume of 50 μL using a MicroAmp™ Fast Optical 96-Well Reaction Plate (Cat. No. 4346906; Thermo Fisher Scientific). The same master mixes were created for the standard samples; however, 180 and 171 μL of PCR-grade water (RNase and DNase absent) was instead used for the HIV-gag and h-CCR5 master mixes, respectively.
In addition, the standard samples instead had 40 μL of master mix and 10 μL of sample DNA added to each well. PCR was performed using a Step One Plus™ Real-Time PCR System (Cat. No. 4376600; Thermo Fisher Scientific) and incubated at 50°C for 2 min and 95°C for 15 min, followed by 40 cycles at 94°C for 15 s, 55°C for 30 s, and 72°C for 30 s. The quantitative polymerase chain reaction (qPCR) was followed by a melt curve step at 95°C for 15 s, 60°C for 1 min, 95°C for 15 s (ramp rate 0.3C) to show primer specificity. The presence of a single melt temperature indicated no nonspecific amplification. The amplification provides a standard curve, but does not discriminate between integrated and nonintegrated HIV-1 DNA copies.
Treatment with antiretroviral drugs (cART) and CCR5 targeting drugs
Doses for standard cART were chosen based on their published therapeutic efficacy in chronic HIV-1 infection in hu/mice. 46 –48 Food pellets (Mod TestDiet) containing cART [a mixture of Truvada—tenofovir and emtricitabine (0.26%), and Isentress (raltegravir, RAL) (1.0666%)] were administered to mice daily for 6 weeks. Cylinder-shaped pills were manufactured as single doses of RAL (10.660 mg) and Truvada (2.600 mg) per kg of food. Pellets also contained antibiotic (amoxicillin, 0.12%) and were irradiated before use. One gram of food pellets were administered per day to each mouse. The same company produced pellets containing maraviroc (MVC, (0.2547%; Selzentry) or rapamycin (0.3075 mg/kg, daily dose). The amount of MVC pellets given to each mouse was 0.242 g/day, and of rapamycin pellets 1 g/day. Mice were maintained with the addition of CCR5 targeting drugs for an additional 14 weeks. Mice were monitored for drug intake and given regular food pellets after finishing the medicated pellets. Fresh water was always available in animal housing.
Statistical analyses
All experiments were designed to allow for robust statistical analysis and data were analyzed with the unpaired Student's t test and Mann–Whitney test, two tailed. All statistical analyses of p values were performed with GraphPad Prism V4.0 (GraphPad software). Values with p < .05 were considered significant.
Results
Validation of the model
Figure 1 is a schematic of the experimental flow, which includes irradiation (100 cGy) of 25 newborn NSG mice (Fig. 1B), human CD34+ cell engraftment into mouse liver (Fig. 1C, n = 25), infection with 20,000 TCID50% HIV Bal, 36 which we had previously established 32 as an adequate dose for productive infection (Fig. 1D, n = 23), flow cytometric assessments (Fig. 1E, n = 25) of engraftment after 18 weeks of incubation (to ensure a T cell/B cell ratio >1), and quantification of serum viral RNA (Fig. 1F, typical data for HIV-1-infected and HIV-1-uninfected mice). This model has been extensively tested and validated in previous HIV infection and antiretroviral therapy studies. 25,33 Infection in this model persists for longer than 1 year. 31 Figure 1E shows representative percentages (normalized to CD45+ T cells) of the major subsets of human peripheral blood mononuclear cells 18 weeks after engraftment. These include T cells as follows: CD45+ T cells shown in purple, CD3+ T cells in dark blue (64%), CD4+ T cells in blue (38%), CCR5+ T cells in green (10%), and CD8+ T cells in yellow (23%). The CD14+ non-T cell subsets are in orange (7%) and CD19+ B cells in red color (19%) (Fig. 1E). The data are presented as the average of three replicates for each sample with standard deviations. The absolute average number of engrafted human CD45+ cells (excluding granulocytes) was ∼1,500/mL and that of human CD3+ cells was ∼1,000/mL at day 0 postinfection, indicating good engraftment levels.
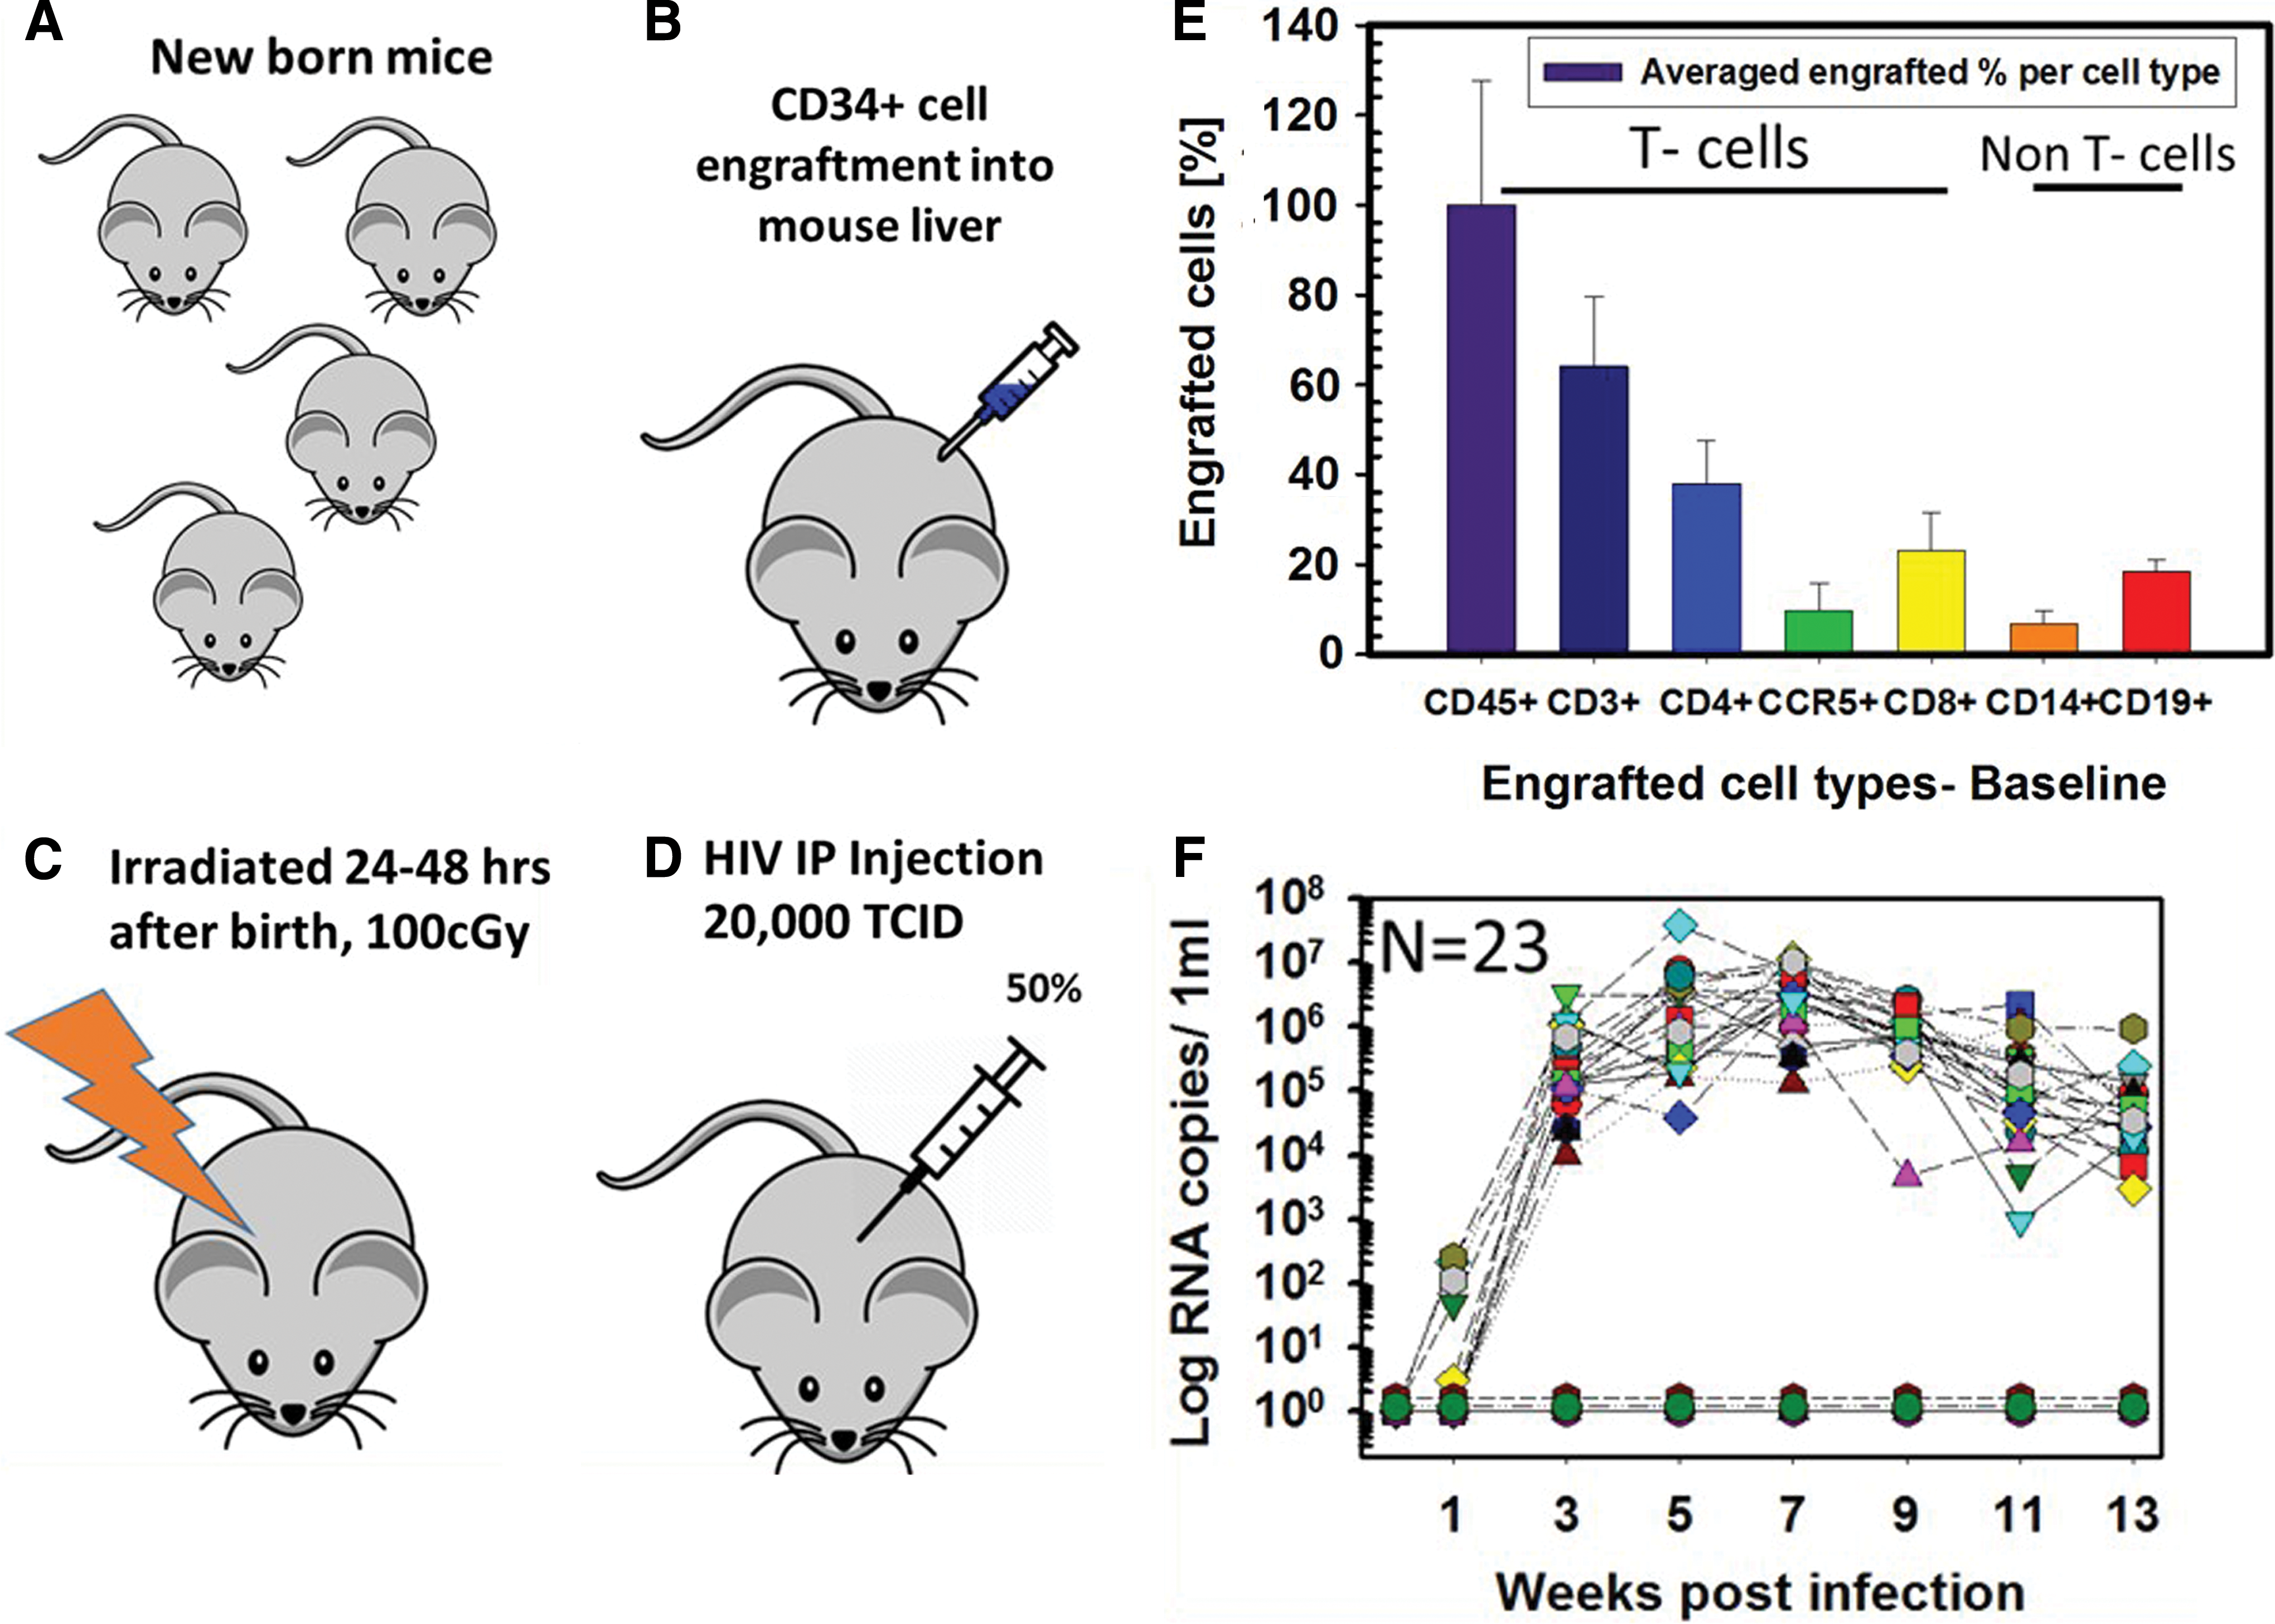
Experimental flow before starting antiretroviral treatments.
Figure 1F shows viral RNA copy numbers in plasma samples collected every 2 weeks. Viral load measurements from the 23 individual infected mice confirmed stable infection beginning 3 weeks postinfection, reaching a maximum of 5 × 10⁴ to 5 × 10⁶ copies/mL at week 3 postinfection, a load that was generally maintained through week 13. Uninfected mice (n = 2), reconstituted with the same donor HSC, included for comparisons of human cell numbers, were negative for viral RNA. Mice lost during the experiment were euthanized based on weight/fur loss records (collected twice a week), according to the IACUC protocol (IACUC No. 1215007).
Treatment with cART versus cART plus CCR5 targeting drugs
The schedule for the antiviral treatments is given in Figure 2. As described above, newborn NSG mice were engrafted with 1.0 × 10⁵ human CD34+ hematopoietic stem cells each and evaluated 18 weeks later for engraftment success, with the criteria that CD3+ cell numbers should be > CD19+ cell numbers. Selected mice were infected intraperitoneally with 20,000 TCID50% HIV Bal 42 at week 0 (Fig. 2). At the indicated times during infection, mice were bled and evaluated for viral RNA and DNA, as well as human cell numbers. At week 13, triple cART was initiated and administered daily, in the form of food pellets, until week 21. To ensure that the mice ate all the medicated food, we closely monitored food uptake and after the medicated food was consumed at the end of the day, we administered regular food pellets. At week 21, selected mice were divided into two groups, one continuing to be treated with cART only, and the other group treated with rapamycin plus MVC in addition to cART. All groups continued to be evaluated for viral RNA and DNA, as well as human cell numbers until the experimental endpoint at week 42. Thus, the eventual experimental groups included noninfected mice, infected untreated mice, and infected cART-treated mice either treated additionally with the combined CCR5 targeting drugs or not.
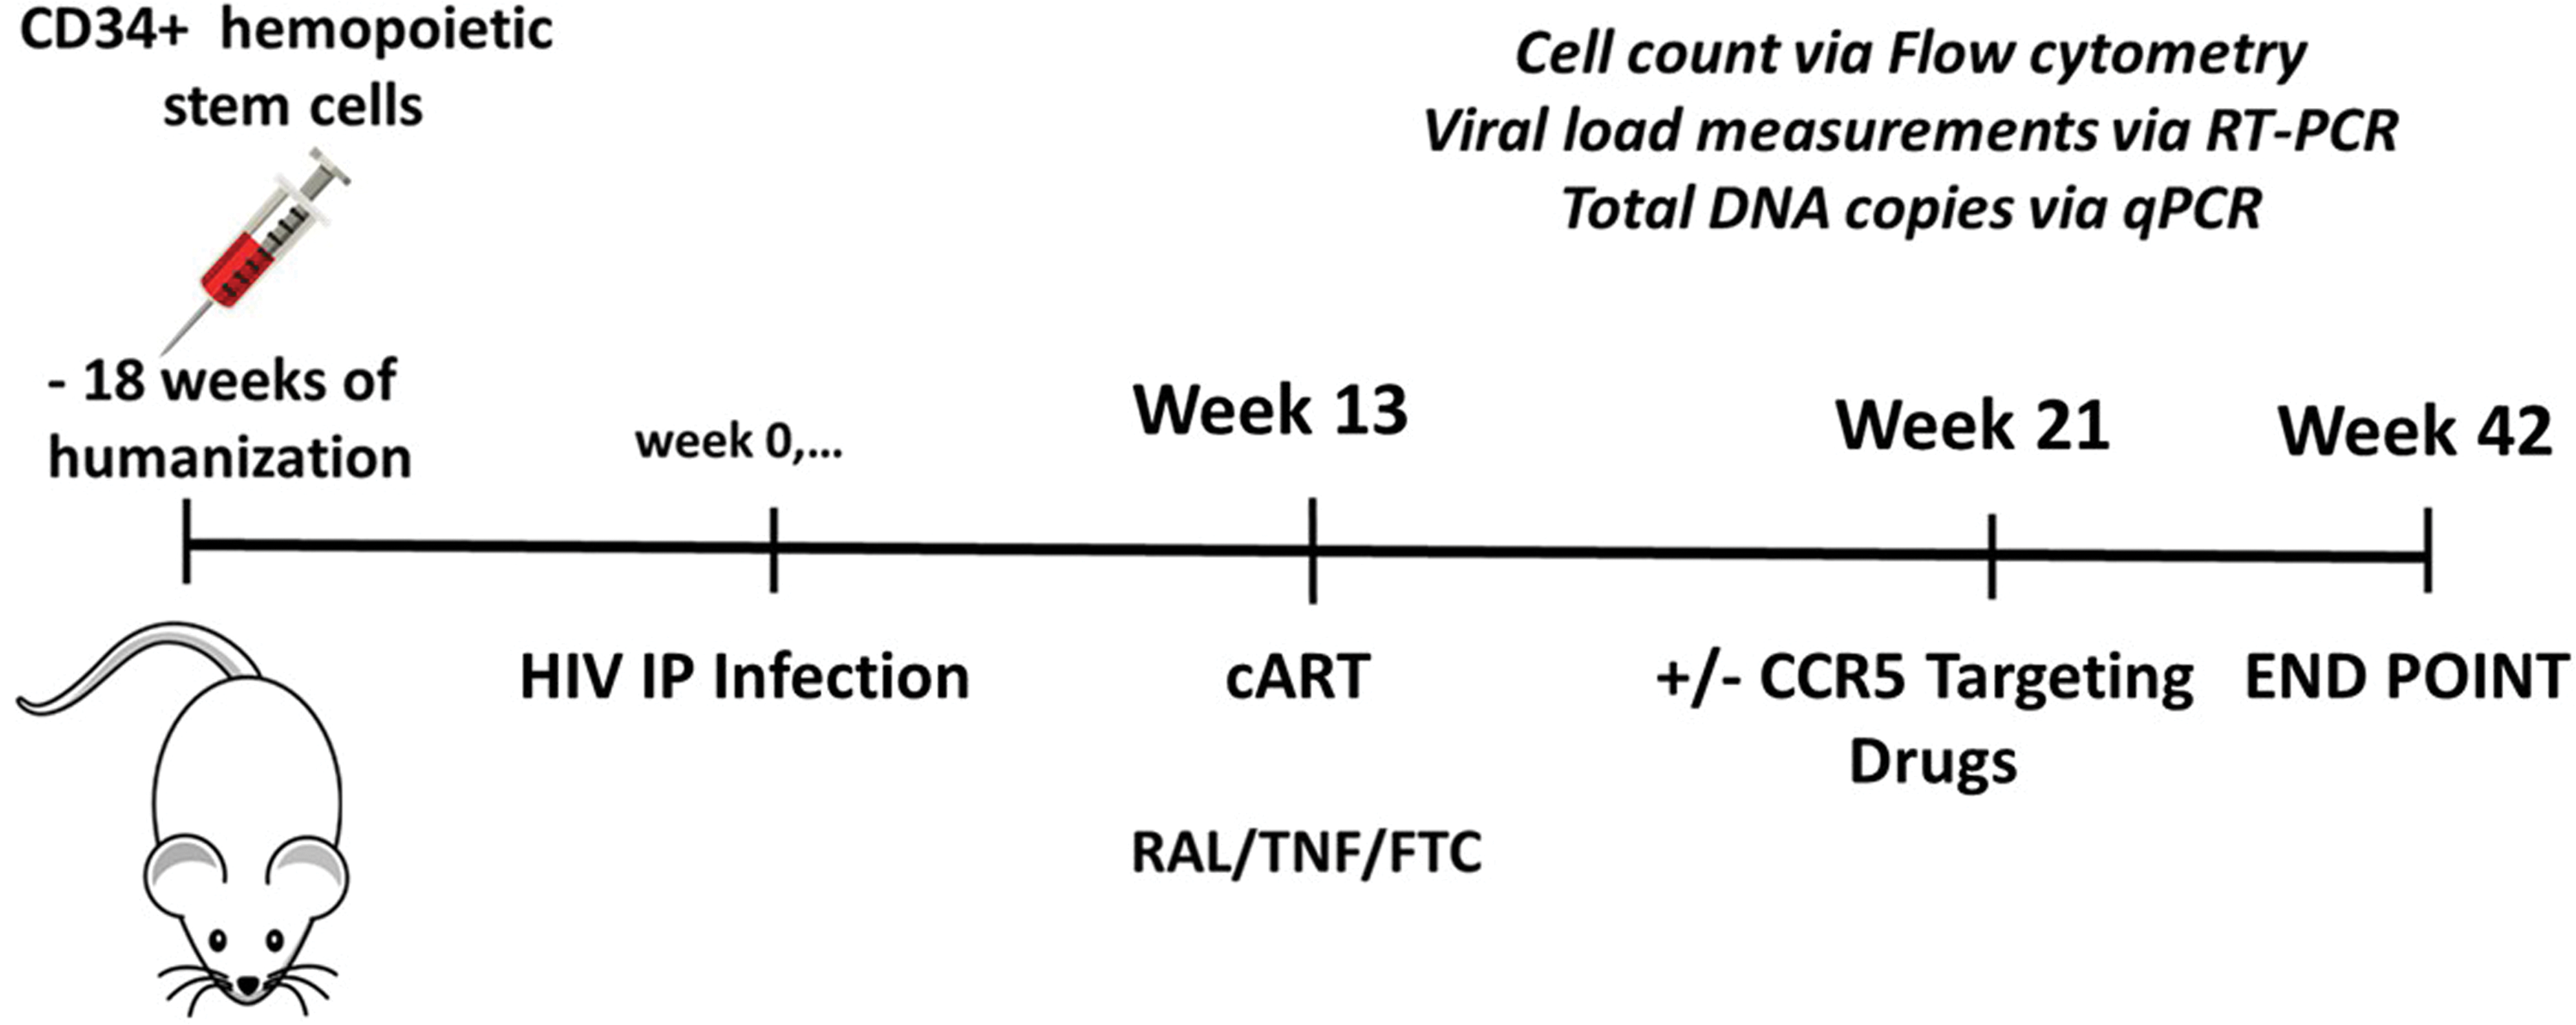
Experimental time line. Shown are times of CD34+ cell engraftment, HIV-1 infection, initiation of cART treatment, addition of CCR5 targeting drugs, and experimental endpoint. cART, combined antiretroviral therapy. Color images are available online.
Measuring engrafted CD45+ and CD4+ T cells
We first quantified human CD4+ and CD45+ T cells in blood. These data are shown for CD45+ cells in Figure 3A and for CD4+ T cells in Figure 3B. CD4+ and CD45+ T cell counts decreased following HIV-1 infection over time, as expected. In contrast, the uninfected control group maintained relatively high human T cell levels. T cell survival in all three groups of infected mice was lower than that in the uninfected group shown in cyan (about 10 × ), indicative of the potential usefulness of this model for following T cell depletion. As is evident in Figure 3, T cell survival was poorest in infected mice that were not treated (red line). For the two treated groups, addition of the CCR5 targeting drugs (green line) gave a small but clear and consistent T cell survival advantage over treatment with standard cART alone (dark blue line).

Log values of CD45+ cell
CD4+/CD8+ T cell ratios
We next analyzed CD4+/CD8+ T cell ratios during the course of the experiment, as shown in Figure 4. Figure 4A shows CD4+/CD8+ ratios up to week 13, when cART treatment was initiated. The CD4+/CD8+ ratio in the uninfected group was maintained, but the infected group generally underwent a reduction in these ratios, as expected. The same trend was also evident at weeks 3, 5, and 7, before week 13 (data not shown). The inset at first, Figure 4A, shows CD4+/CD8+ ratios at the initiation of infection. Figure 4B shows the data from week 21, after cART had been administered for 7 weeks, but immediately before treatment with the CCR5 targeting drugs. Unsurprisingly, the cART-treated mice maintained higher CD4+/CD8+ T cell ratios than did the untreated mice (the ratios of the cART-treated group and untreated group were 2.0 and 0.2, respectively, an order of magnitude different), further suggesting the appropriateness of this mouse model for future antiviral studies. Ratios from the uninfected control group remained stable, as expected. Similar trends were evident at weeks 15, 17, and 19 (data not shown). Figure 4C (week 34) shows cell ratios at week 34, 12 weeks after CCR5 targeting drugs had been added to a subset of the cART-treated mice. As can be seen, addition of CCR5 targeting drugs was clearly more effective (ratio ∼3) in maintaining CD4+/CD8+ T cell ratios than treatment with cART alone (ratio ∼0.8). Similar CD4+/CD8+ ratio trends were observed in weeks previous to week 34, but following administration of the CCR5 targeting drugs (data not shown). Cell ratios of the uninfected control mice remained stable (∼3 ratios).
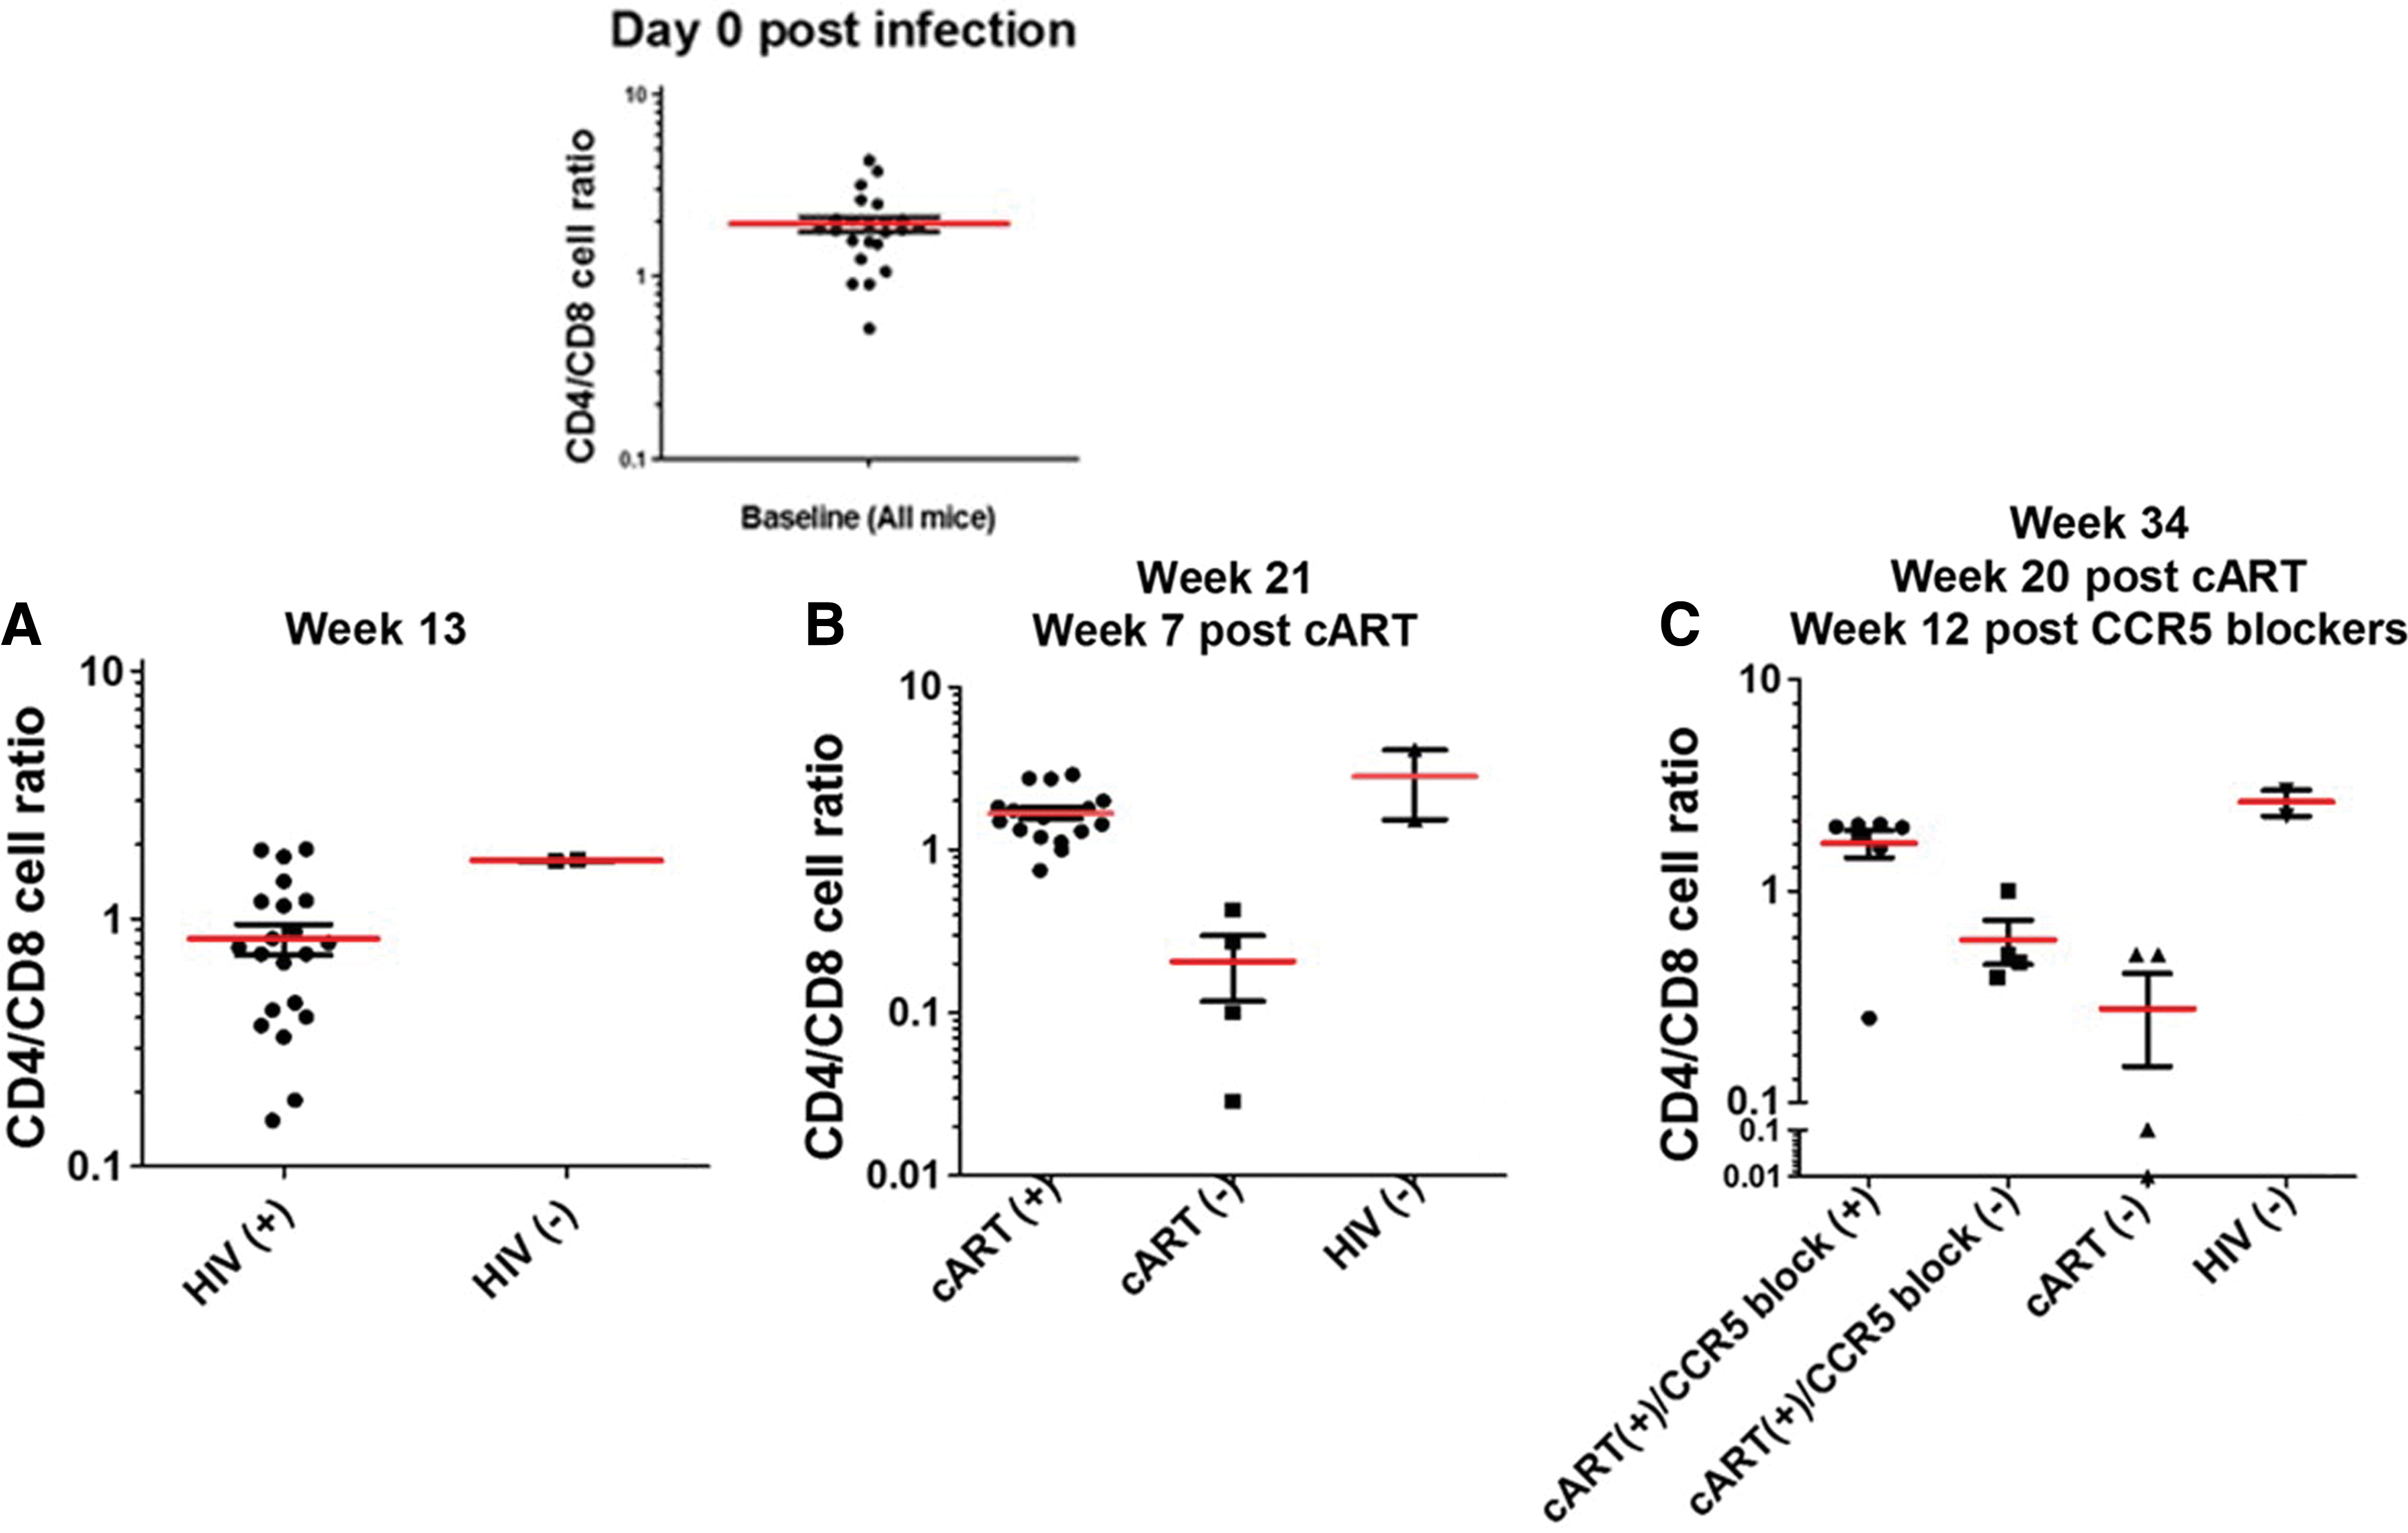
CD4/CD8 T cell ratios.
Plasma viral RNA copies during treatments
We quantified plasma viral loads by quantitative real time polymerase chain reaction to determine whether there is a greater antiviral effect when CCR5 targeting drugs are added to standard cART. Viral RNA levels increased after infection, but were significantly reduced during cART treatment, and further reduced when CCR5 targeting drugs were included.
Log values of viral RNA copies/mL in plasma from the three experimental groups and their mean values are shown in Figure 5. For a more complete data set from the different groups of mice, please see Supplementary Figure S1. All 23 infected mice (gray symbols) developed plasma viremia by week 3, as seen in Figure 5, with viral RNA loads ranging from 5 × 10⁴ to 5 × 10⁶ RNA copies/mL. The red line shows the mean RNA copy values for all infected mice (n = 23) up to week 13. After week 13, the red line represents fewer mice, as the 23 originally infected mice were divided into cART-treated and untreated groups (n = 19 treated with cART for 8 weeks and n = 4 untreated). Two noninfected mice served as the control group (gray symbols at the bottom of the graph). As expected, they had no detectable viral RNA. The red line shows the mean viral RNA copies/mL in the remaining untreated mice (n = 4, RNA copies = 2, 000), while the blue line shows the mean RNA copies/mL in mice treated with cART from week 13 to 21 (n = 19, RNA copies = 30). At week 21, the cART-treated group was further subdivided into groups of 7 mice that remained on cART treatment alone and 12 mice that were treated with a combination of cART plus CCR5 targeting drugs (rapamycin and MVC). Treatment continued until week 42, when the RNA copy numbers fell below the detection limit of 10 copies. The red and blue lines indicate the mean plasma viral RNA loads for the remaining mice in the untreated and cART-treated groups. The green line shows the mean viral RNA copy numbers for mice treated with both cART and CCR5 targeting drugs from week 21 to 42. As is evident from the graph, a combination of cART and CCR5 targeting drugs therapy resulted in a clear reduction of 10 × in plasma viral RNA levels when compared with treatment with cART alone, suggesting a big potential of including CCR5 targeting drugs in reduction of viremia.
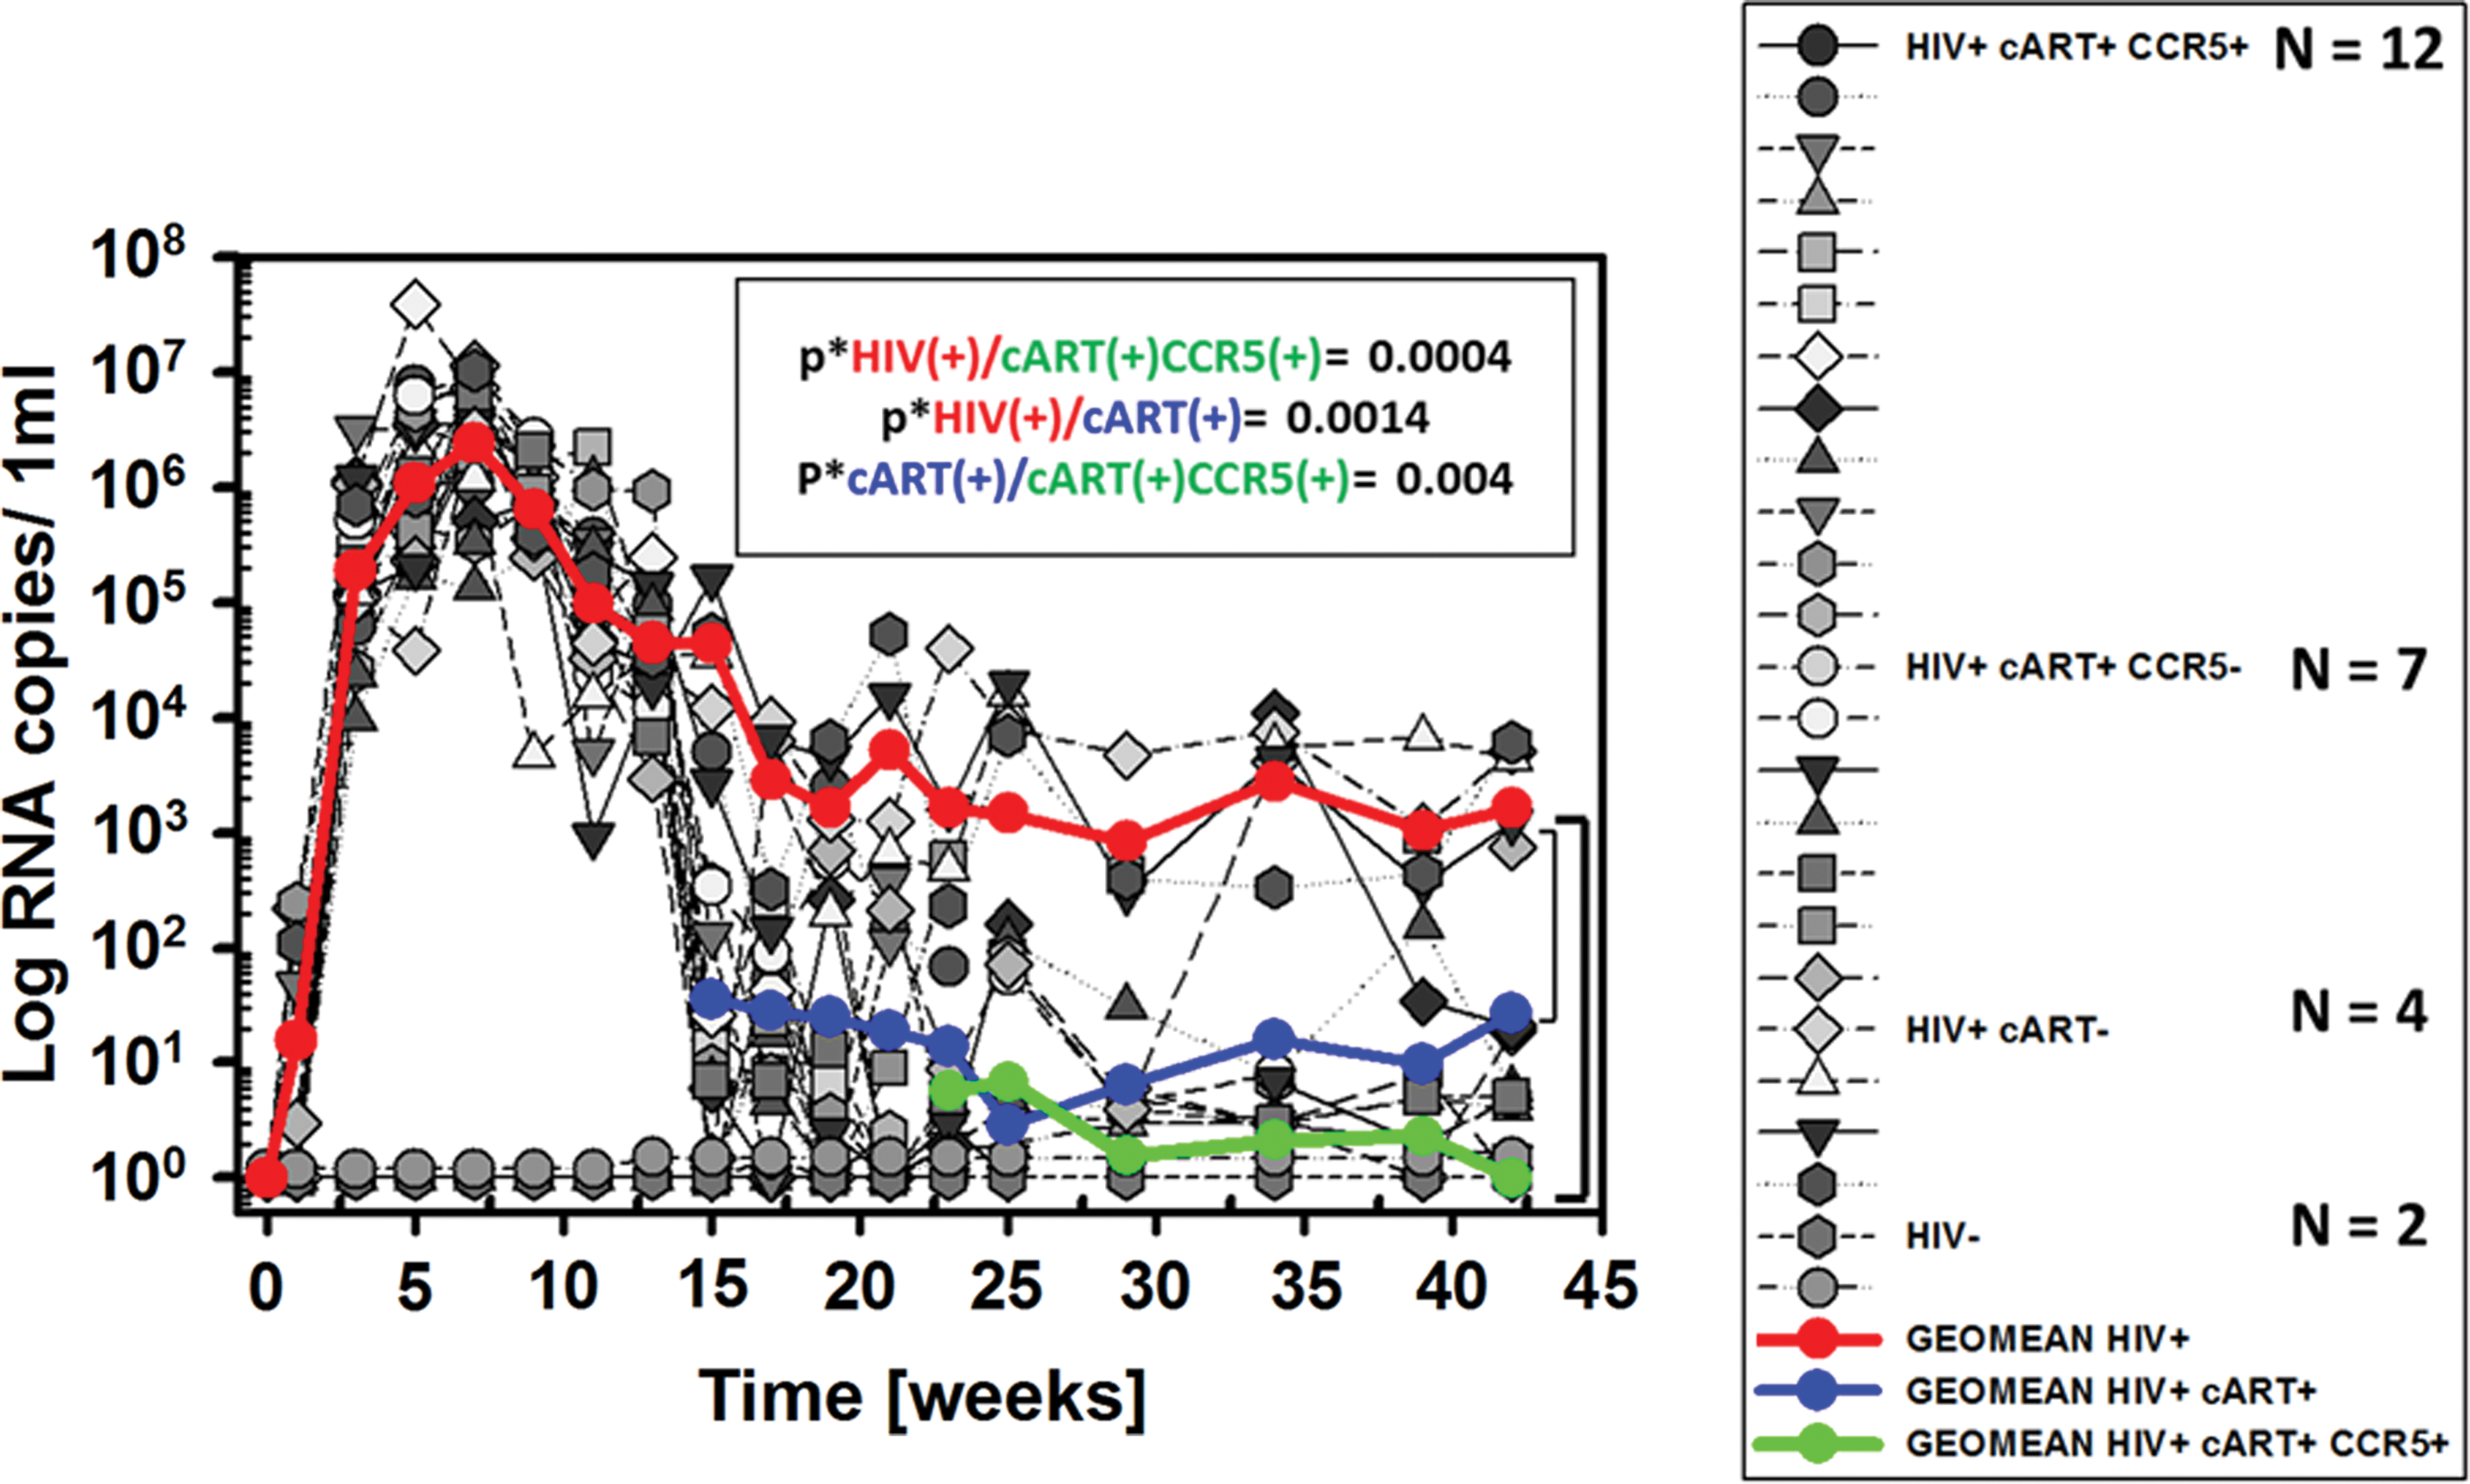
Plasma viral RNA copies. Shown are the log values for plasma viral RNA during HIV infection that was untreated (the red line shows the mean values, n = 4), treated with cART alone (the blue line shows the mean values, n = 7), or treated with cART plus CCR5 targeting drugs (the green line shows the mean values, n = 12). The p* values are indicated on the graph and were .0004 for no treatment versus combination treatment with cART with CCR5 targeting drugs, .0014 for no treatment versus treatment with cART only, and .004 for treatment with cART alone versus cART plus CCR5 targeting drugs. Color images are available online.
Please see Supplementary Figure S2 for a more detailed presentation of the data for human CD4+ T cell counts and viral RNA quantitation during the course of the entire experiment. The p* value for the differences between untreated mice and those treated with both cART and CCR5 targeting drugs was .0004; and for the untreated mice versus those treated with cART alone, it was .0014. Interestingly, the p* value for the differences between mice treated with cART alone versus the combined treatment was .004, suggesting a clear benefit in the addition of CCR5 targeting drugs.
Viral DNA in PBMCs
Using seminested qPCR, we also quantified viral DNA copies from PBMCs to further determine whether addition of CCR5 targeting drugs offered possible advantages over the use of cART alone. DNA copy numbers were normalized per 1,000 lymphocytes. We used the human CCR5 gene as a cellular gene control in these experiments. The first two graphs in Figure 6, Figure 6A, show viral DNA copies at weeks 1 (figure inset), 3, and 13. Viral DNA was undetectable in infected mice at week 1, but became detectable by week 3 at an average of around 35 DNA copies per 1,000 lymphocytes, and increased by week 13 to an average of ∼100 DNA copies per 1,000 lymphocytes, as shown by the red horizontal line in the grouped sets of data. Viral DNA was negative for the two uninfected mice. At week 17 postinfection (Fig. 6B), 3 weeks after cART treatment was initiated, viral DNA copies decreased to 25 per 1,000 lymphocytes in treated mice, while increasing in untreated mice to 300 DNA copies per 1,000 lymphocytes. A similar trend was observed at week 15, 1 week post-cART, and at week 19, 5 weeks post-cART (data not shown). Week 21 had a lower p* value between the untreated group and the cART-treated groups than did the week 17 data, suggesting an increasing efficacy of cART with time. Figure 6C shows results from two of the time points taken after the addition of CCR5 targeting drugs to a subset of the cART-only-treated mice. At week 23 postinfection, week 9 post-cART, and week 1 post-CCR5 targeting drug addition (left graph in Fig. 6C), both the treated groups lacked detectable proviral DNA, and this persisted through the duration of the experiment. By week 29 postinfection (right graph in Fig. 6C), all experimental groups lacked detectable proviral DNA copies, except one mouse in the infected untreated group. Given that plasma viral RNA remained detectable through the entire set of time points, it is evident that virus is persisting somewhere other than peripheral blood, although it cannot be excluded that virions have an extended half-life in plasma. This suggests, however, that viral RNA may be a better proxy for viral survival in this system than viral DNA, 49 and that a thorough analysis for residual virus will require detection in other tissues, such as lymph nodes, bone marrow, spleen, gut, and brain. This will be the focus of our future studies. High RNA copy numbers in the peripheral blood of HIV-1 patients, sometimes seen with low CD4+ T cell counts, suggest that the reactivation in latently infected tissue monocytes/macrophages contributes to viremia.
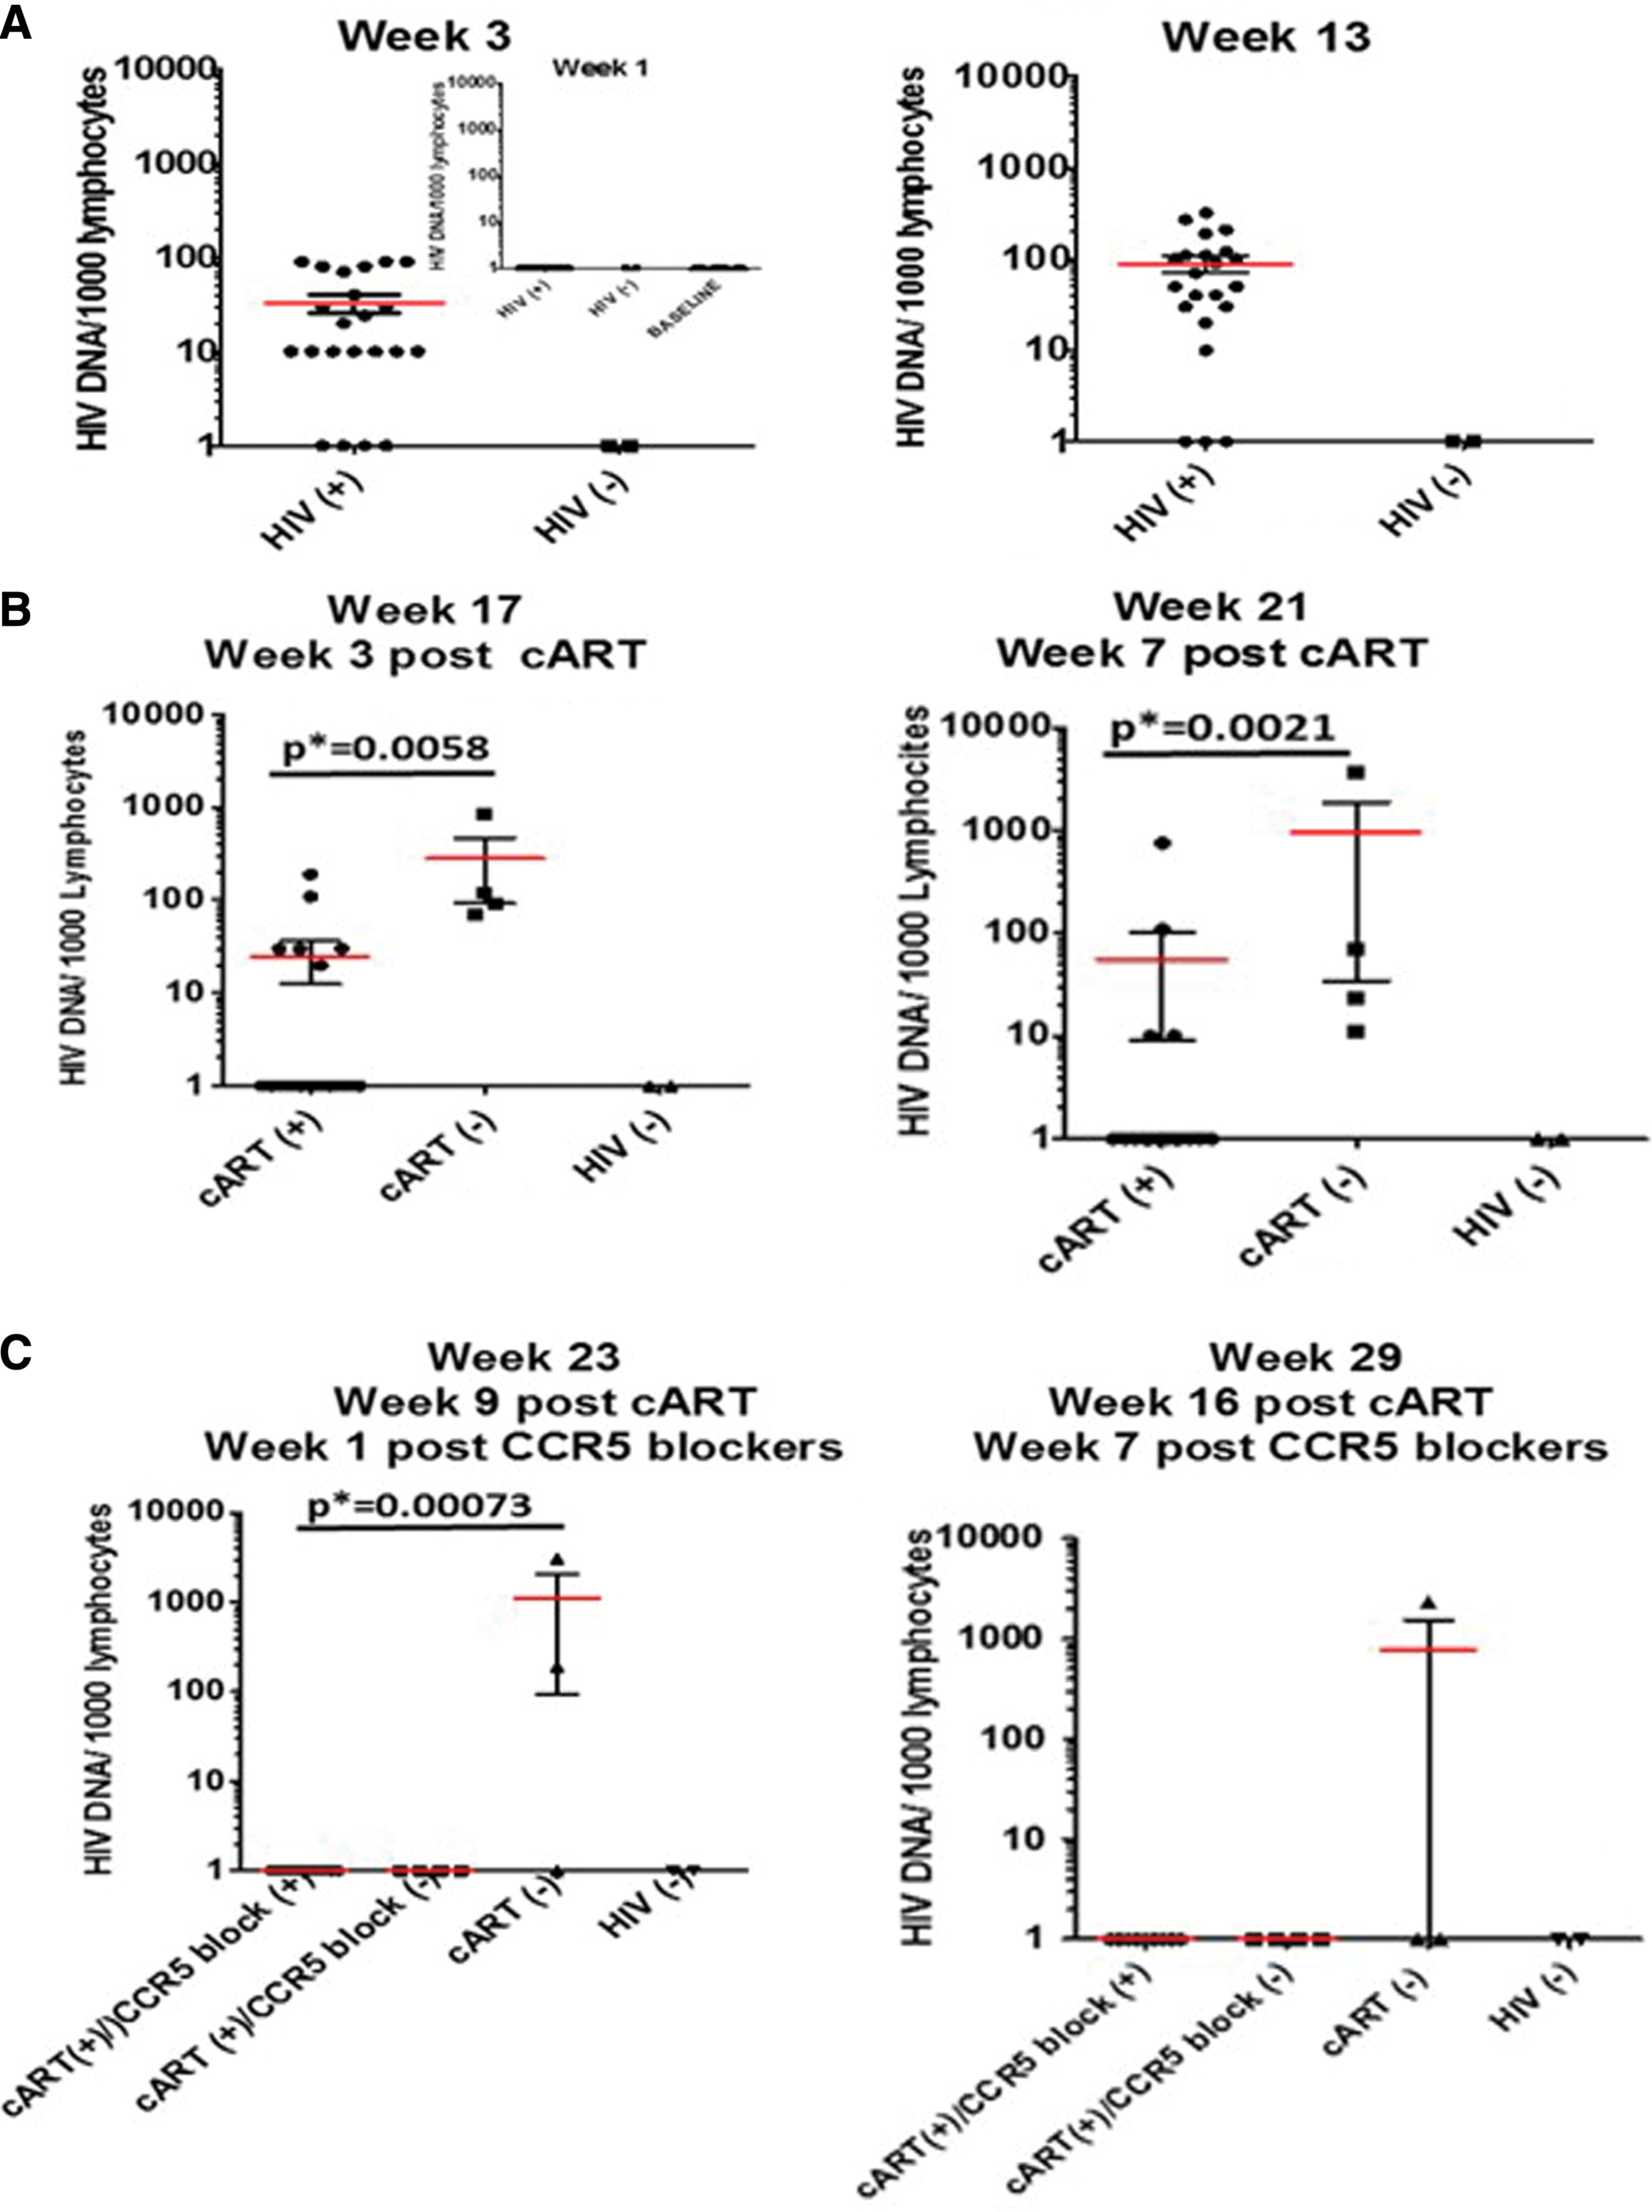
Viral DNA in peripheral blood mononuclear cells. Total DNA was extracted from mouse blood samples at the indicated time points:
Discussion
In principle, there are several approaches to achieve sustained virus remission, including passive immunization, early initiation of cART, therapeutic vaccination, and immune modulation with clearance of HIV-infected cells. 50 Current cART provides sustained and durable viral suppression. 51 However, to date, no drug combinations have been able to eradicate viral reservoirs. Persistent infection contributes to the establishment of HIV reservoirs in various tissues, such as the central nervous system, lymph nodes, gut, and bone marrow. Three major factors favoring the existence of HIV reservoirs are viral mutations leading to drug resistance, longevity of latently infected cells, and ineffective drug penetrance into some organs (particularly the central nervous system 52 ). Detection of cryptic sites of HIV-1 infection is clearly a crucial step toward eradication, but studies in humans and nonhuman primate models are limited by sample availability at particular stages of infection and by cost. It would be advantageous to have a convenient small animal model for these types of studies, although we realize that such a model will likely present limitations due to limited human cell recovery and the number of cells available for statistical analysis. Sample size is somewhat limited, due to mouse body size (22–24 g), but this issue can be addressed by advanced imaging and quantitative PCR techniques. It also may not precisely mimic the situation in infected humans.
With this in mind, we sought to use a humanized mouse model to determine whether a combination of cART and CCR5 targeting drugs might offer any advantages over cART alone in preserving human T cell subsets, reducing viral loads, and depleting or preventing the establishment of viral reservoirs. The CD34+ HSC-NSG-CD34+ mouse model was convenient for our study as it supports more efficient, long-term, stable, and systemic engraftment with human cells. 25,30,33 A wide variety of human cells, such as CD4+ T, NK, dendritic cells, and macrophages, can be established in different organs of the engrafted NSG mice, which allows studies of key cell types and tissues infected with HIV-1. 25,33 We infected human CD34+ hematopoietic stem cell-engrafted NSG mice with HIV-1-Bal, an R5 isolate that establishes a robust and persistent infection in these mice, and followed not only the course of viral loads but also the survival of implanted human cell types, particularly CD4+ T cells. The role of CD4+ T monocytes during the different stages of HIV infection is well established. They are most efficient targets for HIV production and also contribute to long-term HIV persistence. 25 Significant efforts have been invested toward eradicating HIV reservoirs presented as latently infected CD4+ T cell subsets. 33
In the present study, as judged by CD4+ T cell survival in infected mice, cART treatment was protective, confirming previous reports using this same mouse model. 7,30,31,33 When CCR5 targeting drugs were added to cART treatment, there was a clearly increased protective effect on CD4+ T cells. Similar results were obtained for CD45+ cells. The ratio of CD4+/CD8+ T cells was likewise better preserved by the addition of CCR5 targeting drugs (MVC and rapamycin) to standard cART, confirming previous hypotheses of Puertas et al. 10 and Chailon et al. 13 that MVC inclusion could intensify the antiretroviral effects of cART.
As one might anticipate, the antiviral effect was also stronger when CCR5 targeting drugs were added to cART. Although cART was effective in reducing plasma viral RNA and PBMC proviral DNA, addition of CCR5 targeting drugs clearly further lowered plasma viral RNA loads to baseline levels by the end of the experiment, suggesting an advantage of including CCR5 targeting drugs to cART for a greater reduction in viremia levels, as was suggested by studies using MVC alone. 10,13 Our present study included rapamycin with MVC to further intensify the CCR5-dependent antiretroviral activity, having different mechanisms of action when targeting the CCR5 coreceptor.
In all cases in the present study, PBMC proviral DNA became undetectable, yet in untreated and cART-treated mice, plasma viral RNA persisted, indicating the possible existence of nonperipheral blood replication sites of infected cells in solid tissues. We realize, however, that some virus particles could simply have very long survival rates in plasma. It should be noted that viral RNA was nearly undetectable in mice treated with the cART/CCR5 targeting drug combination, which strongly suggests a reduction in viral reservoirs. 33 It will be important to verify this idea by identification and analyses of mouse tissue reservoirs; this is a focus of our ongoing studies. To this end, we will analyze mouse bone marrow, gut, brain, and lymph nodes for human T cells expressing virus, using super resolution Airy scan-based confocal microscopy 53 to visualize HIV p24 and CD45, and quantitative anchor PCR to identify HIV-1 replication and integrated proviral DNA.
Our data are supportive of two important ideas. One is that adding CCR5 targeting drugs to standard cART will offer advantages over cART alone in reducing viral loads and total HIV DNA and in protecting T cell populations, as previously shown using different ART treatments. 54,55 Obviously, this approach is limited to patients infected with R5 HIV-1 only, but can serve as a proof of principle for broader studies. In these patients, other than rapamycin and MVC, CCR5 targeting drugs such as the small-molecule inhibitor cenicriviroc and the anti-CCR5 Ab-PRO-140 could be equally effective. 56 The second idea is that the model we describe is likely to be appropriate for testing whether these or other combinations of antiretroviral drugs could be effective in reducing and perhaps effectively depleting existing viral reservoirs in humans. These data also suggest that plasma viral RNA levels after cessation of therapy could be a useful proxy for decreases in existing viral reservoirs. This study shows that the hu-NSG model is a valuable in vivo tool that could be used in preclinical testing to evaluate antiretroviral therapy, suppression of HIV replication, and HIV latency. Finally, the validation of this model for studying HIV infection and latency opens the possibility for further viral kinetic-based experiments in vivo and the use of future nanoformulated therapies.
Conclusion
Human CD34+ hematopoietic stem cell-engrafted HIV-infected NSG mice were used as a model for productive persistent HIV infection and evaluation of antiviral treatment efficacy, as measured by plasma viral RNA, PBMC proviral DNA, CD4+/CD8+ T cell ratios, and maintenance of human CD4+ and CD45+ T cells. Our data from all four parameters indicated a more favorable outcome when CCR5 targeting drugs were included with standard cART, suggesting the value of therapeutic use of entry inhibitors in addition to standard cART in humans. Analyzing the merit of this combination therapy on solid tissues appears warranted and will be the subject of further and expanded in vivo studies. Ongoing work on mouse tissue reservoirs includes qPCR-based detection of integrated DNA copies in potential mouse reservoir tissues and the correlation with sites where virus may actively replicate. These studies will help to design additional experimental approaches to viral eradication and reduction of original viral spread, hopefully leading to the development of similar clinical approaches in humans.
Footnotes
Acknowledgments
We thank Sarah Mitchel, MSc, MBA, for helping with adapting qPCR assays for total DNA copy measurements. We thank Dr. Fabio Romerio (IHV SOM UM) for the chronically infected H9+ cell line, and Matthew Weichseldorfer, MSc, for his valuable comments on the ![]() section of the article. OSL thanks Dr. Davide Zella for the discussions regarding the plasma viral RNA copy measurements and figure arrangements. We especially thank Harry G. Davis, MSc, and Sumiko Williams, MSc (Animal Facility, IHV), for excellent assistance with the in vivo experiments. The following reagents were obtained through the NIH AIDS Reagent Program, Division of AIDS, NIAID, NIH (Germantown, MD): maraviroc (Cat. No. 11580) and two cell lines, ACH-2 (Cat. No. 349) and U937 cells (Cat. No. 165). This work was supported by research funds from the Institute of Human Virology, University of Maryland, Baltimore, MD.
section of the article. OSL thanks Dr. Davide Zella for the discussions regarding the plasma viral RNA copy measurements and figure arrangements. We especially thank Harry G. Davis, MSc, and Sumiko Williams, MSc (Animal Facility, IHV), for excellent assistance with the in vivo experiments. The following reagents were obtained through the NIH AIDS Reagent Program, Division of AIDS, NIAID, NIH (Germantown, MD): maraviroc (Cat. No. 11580) and two cell lines, ACH-2 (Cat. No. 349) and U937 cells (Cat. No. 165). This work was supported by research funds from the Institute of Human Virology, University of Maryland, Baltimore, MD.
Author Disclosure Statement
No competing financial interests exist.
Supplementary Material
Supplementary Figure S1
Supplementary Figure S2
References
Supplementary Material
Please find the following supplemental material available below.
For Open Access articles published under a Creative Commons License, all supplemental material carries the same license as the article it is associated with.
For non-Open Access articles published, all supplemental material carries a non-exclusive license, and permission requests for re-use of supplemental material or any part of supplemental material shall be sent directly to the copyright owner as specified in the copyright notice associated with the article.