
Abstract
Biomarkers for detecting early HIV infection and estimating HIV incidence should minimize false-recent rates (FRRs) while maximizing mean duration of recent infection (MDRI). We compared HIV subtypes B, E and D (BED) capture enzyme immunoassay (BED), Sedia limiting antigen (LAg) avidity enzyme immunoassay, and Bio-Rad avidity incidence (BRAI) assays using samples from Zimbabwean postpartum women infected with clade C HIV. We calculated MDRIs using 590 samples from 351 seroconverting postpartum women, and FRRs using samples from 2,825 women known to be HIV positive for >12 months. Antibody kinetics were more predictable with LAg and had higher precision compared with BED or BRAI. BRAI also exhibited more variability, and avidity reversal in some cases. For BED, LAg, and BRAI, used alone or with viral load, MDRI values in days were: BED–188 and 170 at normalized optical density (ODn) 0.8; LAg–104 and 100 at ODn cutoff 1.5; BRAI–135 and 134 at avidity index cutoff 30%. Corresponding FRRs were: BRAI 1.1% and 1.0% and LAg 0.57% and 0.35%: these were 3.8–10.9 times lower than BED values of 4.8% and 3.8%. BRAI and LAg have significantly lower FRRs and MDRIs than in published studies, and much lower than BED and could be used to estimate incidence in perinatal women and to measure population-level HIV incidence in HIV control operations in Africa.
Introduction
Background
Physiological measures (biomarkers) whose level varies with time after HIV infection can be used to identify recent HIV infections, defined as those returning a measure less than some preset cutoff value (C). Among HIV-positive samples from a cross-sectional survey, the number identified as recent infections, by this definition, could be used to estimate HIV incidence, an important measure of the state of an HIV epidemic. An early example of such a biomarker was the HIV subtypes B, E and D (BED) Capture Enzyme Immunoassay (BED-CEIA or simply BED assay), which measures the increasing proportion of anti-HIV-1 IgG in total IgG following seroconversion. 1
Two parameters are key in defining a laboratory assay's utility in the estimation of HIV incidence, either as a single assay or in recent infection testing algorithms (RITA): (1) The mean duration of recent infection (MDRI), defined as the average time spent as recent while infected for time < T. (2) False-recent rate (FRR) defined as the probability of testing as a recent infection (i.e., returning a measure < C) when the case is actually known to have been infected for longer than some predefined time T. 2
Non-zero FRR values result in overestimation of HIV incidence, if the estimate is not adjusted appropriately. The precision of incidence estimates declines with increasing FRR at a given MDRI. An ideal value for C would minimize the FRR, while maximizing the MDRI, to increase the number of cases defined as recent. Unfortunately, while the FRR decreases with decreasing C, so does the MDRI. For small C, therefore, the FRR is small but the sample size required to find an adequate number of recent infections is large, because the shorter the MDRI, the fewer the cases classified as recent infections. Conversely, if C is large, the MDRI increases and the required sample size decreases, but the FRR also increases and this is problematic if the FRR varies substantially between populations.
Variability in the FRR values estimated for BED, militated against its use in Africa for estimating HIV incidence. For example, whereas the FRR estimated from Zimbabwe data was about 5%, 3 it was 15% in East Africa. 4 We need biomarkers with consistently lower FRR values, without too large a reduction in MDRI. The Sedia™ HIV-1 Limiting Antigen Avidity Enzyme Immunoassay (LAg-Avidity EIA) and Bio-Rad avidity incidence (BRAI) assay appear to meet these requirements. 5
Avidity refers to the accumulated strength of multiple affinities between the viral protein (antigens) and HIV-specific antibodies. The LAG assay uses plates coated with multisubtype gp41 recombinant protein (rIDR-M). 6 Following addition of a chaotropic agent, optical density (OD) readings are optimized by dividing the specimen OD by the Calibrator OD for each sample. The BRAI assay was developed by modifying the FDA-approved Bio-Rad Genetic System HIV-1/HIV-2 Plus O protocol, by Centers for Disease Control and Prevention, Atlanta, GA. 7 The immunoassay is an IgG/IgM enzyme immunoassay that uses subtype B-Based recombinant proteins and synthetic peptides to detect antibodies to HIV-1/HIV-2. Following dilution and incubation at a lower temperature (4°C) in duplicate, samples are then tested in the presence and absence of 0.1 M diethylamine in separate wells. The difference in reactivity of the two wells allows an avidity index (AI) to be calculated for each sample and used to determine whether HIV is likely to have been acquired recently.
The performance of LAg and BRAI have not been extensively evaluated against HIV-1 subtype C from Southern Africa. Accordingly, we evaluated the kinetics, and established the MDRI and FRR, of the two candidate avidity assays when applied to the same samples from the Zimbabwe Vitamin A for Mothers and Babies (ZVITAMBO) Trial used to characterize and evaluate the BED assay. 2,8,9
FRR values can be further reduced through the use of combinations of biomarkers aimed ultimately at producing a RITA with zero FRR. 10,11 Viral load (VL) is often included in the testing algorithm, allowing one to exclude individuals with low VLs, who may have insufficient antigen to drive “normal” antibody kinetics. 12 Natural controllers, and an increasing number of patients on successful antiretroviral treatment, with controlled viremia have low antigenic stimulus correlated with low antibody levels. Accordingly, we investigated the use of VL estimates in combination with each of the two candidate biomarkers.
Methods
The ZVITAMBO trial
The ZVITAMBO Trial (henceforth the Trial) was a randomized placebo-controlled trial whose primary objective was to test the effects of maternal and/or neonatal vitamin A in reducing HIV transmission, comorbidities, and child mortality. 13 –15 In the Trial (1997–2000), 14,110 women and their babies were recruited within 96 h of childbirth. These mother–baby pairs, referred to as the “baseline” cohort, were followed up at 6 weeks, and at 3, 6, 9, and 12 months postpartum. Subsets were then followed at 15, 18, 21, and 24 months postpartum. Women were tested for HIV by two enzyme-linked immunosorbent assays (ELISA) run in parallel (HIV 1.0.2 ICE; Murex Diagnostics, Eden Vale, South Africa, and GeneScreen HIV 1/2; Sanofi Diagnostics Pasteur, Johannesburg, South Africa). Discordant ELISA test results were resolved by western blot, (HIV Blot 2.2; Genelabs Diagnostics SA, Geneva, Switzerland).
Concordant HIV-positive samples were then tested, during the present study, using BED-Capture Enzyme Immunoassay (Sedia HIV-1 BED Incidence EIA), Sedia HIV-1 LAg-Avidity EIA (LAg) and Centers for Disease Control and Prevention (CDC) developed avidity-based modified Genetic Systems HIV-1/HIV-2 plus O EIA, from Bio-Rad Laboratories, Redmond, Washington (BRAI). 16,17 Further details of the Trial are given in Supplementary Figure S1.
HIV-positive plasma samples were assayed for VL by quantitative HIV RNA testing (Roche Amplicor HIV-1 Monitor test, version 1.5; Roche Diagnostic Systems). The system used had a lower range of detection of ∼400 viral copies/mL. 18
Quality control
For the current study we accepted all of the original HIV diagnoses from the Trial. Possible errors in this regard are discussed in the Supplementary Data. The original BED validation was carried out in 2003, on samples collected between late 1997 and 2002. The current study was started in 2013 by assessing specimen integrity and viability of specimens stored for >10 years. We used BED to test 241 randomly selected samples. Regression of new normalized OD (ODn) results for BED against original values produced highly correlated ODs (R 2 for the regression = 0.87; Supplementary Fig. S2) indicating that there was no reason to suspect sample degradation. Given that this study marked the first time that the LAg and BRAI systems were being applied to the Trial samples, there were no prior data against which to compare the results for these biomarkers.
The OD readings or chemiluminescence below a preset cutoff value are optimized by dividing the specimen OD by the Calibrator OD to get a ODn. For LAg, we accepted as long term all specimens returning ODn >2.0 and no further tests were conducted; samples with ODn ≤2.0 were retested using the LAg in duplicate and the mean of the two repeats taken as the final result. Specimens returning an initial ODn <0.4 were retested with two serological rapid HIV tests: Alere HIV 1/2 Determine™ (Alere Technologies GmbH, Germany), and INSTI™ HIV-1 (BioLytical Laboratories) to confirm HIV infection, before repeating the test with the LAg assay.
AI, is the ratio of the OD of a denaturing well compared with the OD of the control well expressed as a percentage, in a two-well avidity assay, or as OD readings that are ODn by comparing readings to a reference calibrator in a one-well assay. For BRAI, samples with AI values above 50% were classified as prevalent (long term) infection and no further tests were conducted. Samples with AI 20%–50% were retested in duplicate using the BRAI assay and the mean of the duplicate was used as the result. Specimens whose wash buffer OD was below the run cutoff value were considered “invalid,” and an AI was not calculated. Samples with invalid results were tested in duplicate.
Statistical analysis
Dealing with cases where BRAI returned an invalid result
An invalid result from BRAI, for a sample that is nominally HIV positive, indicates that the sample has no antibodies or that the antibody titer is below the run positive/negative cutoff. There are two possibilities: either the sample is actually uninfected with HIV or, if it is infected, then it has a very low antibody titer. In the former case, the sample should be reclassified as HIV negative and this applies equally to the BRAI and LAg tests. If, however, the sample is actually HIV positive, then the outcome is different for the two biomarker systems. For BRAI, it is not possible to calculate an AI and such samples have to be excluded from all BRAI analyses. For LAg, however, if the sample is regarded as HIV positive, then a very low LAg ODn is recorded.
Extensive analysis of a number of such problematic cases (Supplementary Appendix SA1 and Supplementary Tables S1, S2, S3, S4) suggests that these should be regarded as HIV positive and they have been so treated in the analyses that follow. The problem should perhaps be put in perspective by noting that only 18/4,495 (0.4%) of cases at baseline returned an invalid result for BRAI.
Identifying recent infections
When any of the three serological biomarkers under test was used by itself as a biomarker, an HIV-positive case was defined as a recent infection if it returned an ODn value (in the case of BED or LAg) or AI (for BRAI) that was lower than some preset cutoff C. We follow Laeyendecker et al. in investigating a wide range of cutoff values with a view to suggesting cutoffs that lead to an optimal balance between optimal FRR and MDRI values. 19
When one of the serological biomarkers was used in conjunction with VL, a case was identified as a recent infection if, and only if, the serological result was < C and the VL was ≥1,000 copies/mL.
Estimating MDRI
Among the 14,110 women recruited, within 96 h of delivering a baby, 4,495 were HIV positive, 9,562 negative, and 53 indeterminate, giving an overall prevalence of 32%. Among the women who were initially HIV negative, 351 seroconverted during follow-up and, of these, 186 women provided at least two HIV-positive samples. We collected 590 samples that could potentially be used to determine the MDRI for each assay. For predefined time T and cutoff C, we estimate the mean time (MDRI) that a case spends in the recently infected state (i.e., with biomarker level < C) while alive and infected for at most time T: formally MDRI may be termed a restricted mean survival time with MDRI = E [min (Y,T)], where Y is the time to crossing C. Without loss of generality, we take T as one unit of time. Initially we took T = 1 year, the value used in a comprehensive benchmarking of approaches to MDRI estimation. 20 The value also arose naturally in the Trial since all cases were followed up for at least 12 months and, at that point, every effort was made to contact every participant known still to be within Zimbabwe. To investigate the effect of the choice of T on MDRI estimates, we used a value of T = 2 years, as suggested elsewhere. 17 The latter period also arises naturally since 24 months was the maximum follow-up period in the Trial. As with earlier studies we also investigate the dependence of MDRI values on the required minimum number [number of samples (ns) = 2, 3, or 4] of HIV-positive samples provided by a seroconverting mother for her to be included in an analysis, and the maximum allowable time (τ 0 = 60, 90, or 120 days) between the last HIV-negative and first positive tests. 2,9
We estimate MDRI using: (1) nonlinear mixed modeling (NLMM) 9,21 ; (2) survival analysis (SA) 22 ; and (3) Binomial regression (BR). 23
For NLMM, increases in OD with time (t) since HIV seroconversion are modeled as:
for subject i at time point j and where c i>0, ai >b i and eij are independent and identically distributed normal errors. In this model, the function approaches an asymptote for large values of t and goes to zero as t approaches minus infinity. The method was suitable for estimating MDRIs for BED and LAg, where the patterns of increase in ODn with time since seroconversion were sufficiently regular. The overall MDRI was calculated using individual pooled MDRI as described previously. 9
The function in Equation (1) cannot provide a good fit for BRAI data, because the AI values have an upper limit of 100%. Nor can the method be used to estimate the MDRI for a combination of serological biomarker and VL, because the ODn or AI value was then not the only determinant of recency.
Estimating MDRI using BR relies on fitting a function for the probability of testing recent as a function of time since seroconversion PR(t). Various parametric forms of PR(t) are possible: we fit a cubic polynomial, so that:
with
Estimating FRR
In the Trial all participants were recruited shortly after giving birth, and were then followed up for at least a year. The FRR, for a given recency test operated with given preset cutoffs and T = 1 year, was defined as the proportion of women testing as recently infected at 12 months postpartum, among all women who tested HIV positive both at recruitment and at 12 months postpartum. Confidence intervals were calculated on the assumption that the FRR is a binomially distributed random variable. To determine FRRs we used the following subsamples of the cases testing HIV positive at baseline and again at 12 months postpartum: LAg, 2,825; BRAI, 2,824. The original BED FRR estimate was carried out on a smaller subset of 2,737 samples, these being the samples that could be located when the BED analyses were carried out. 3 MDRI and FRR estimates were made using a serological biomarker either alone, or in conjunction with VL information: cases with VL <1,000 were classified as long-term infections, regardless of their serological biomarker levels.
Statistical comparisons
We used chi-squared to test for significant differences between FRR estimates. When comparing MDRI estimates arising from different biomarker systems it was sufficient to use the nonoverlapping 95% confidence intervals to identify statistically significant differences.
Ethics consent
The original Trial protocol was approved by the Medical Research Council of Zimbabwe (MRC-Z), the Medicines Control Authority of Zimbabwe, the Johns Hopkins Bloomberg School of Public Health Committee on Human Research (CHR), and the Montreal General Hospital Ethics Committee (MGHEC). BED analysis of archived specimens was approved by MRC-Z, CHR, MGHEC, and the CDC Program Ethics Review Board. The current evaluation of laboratory incidence assays received approval from MRC-Z, Research Council of Zimbabwe, and CDC, Atlanta to test stored samples.
Results
VLs and CD4 counts for HIV-positive cases
Table 1 provides a summary of the distribution of VL among HIV-positive cases. For women testing HIV positive at recruitment, VL was measured at baseline and again among those who returned for the 12-month postpartum visit. These two distributions differed significantly (chi-squared test statistic 49.7, 5 degrees of freedom, p < .005). During the year there was, as expected, a shift toward higher VLs. For example, while 50.9% of the women had HIV loads >4 log10 copies/mL at baseline, the figure at 12 months postpartum had risen to 57.7%. VL was also measured for women testing HIV positive at the 12-month postpartum visit, but who had tested HIV negative at baseline. The distribution for this group also differed significantly from that for the women who had already tested HIV positive at baseline (chi-squared test statistic 28.6, 5 degrees of freedom, p < .005).
Distribution of HIV Loads (log10 Copies/mL) Among Women Testing HIV Positive in the ZVITAMBO Trial
For women testing HIV positive at baseline recruitment VL was measured at that time and at 12 months postpartum. VL was also measured at 12 months postpartum for women who tested HIV positive at that time, but who were HIV negative at baseline.
VL, viral load; ZVITAMBO, Zimbabwe Vitamin A for Mothers and Babies.
Procedural difficulties meant that CD4 counts were only made for 87% (3,909/4,495) of the women who were HIV positive at baseline and were not available for any women seen thereafter. Table 2 shows that 15.8% of the sample tested had a CD4 count <200 cells × 106/L.
Distribution of CD4 Counts (Cells × 106/L) in Women Testing HIV Positive at Baseline Recruitment in the ZVITAMBO Trial
Patterns of increases in biomarker ODn and AI values with time since seroconversion
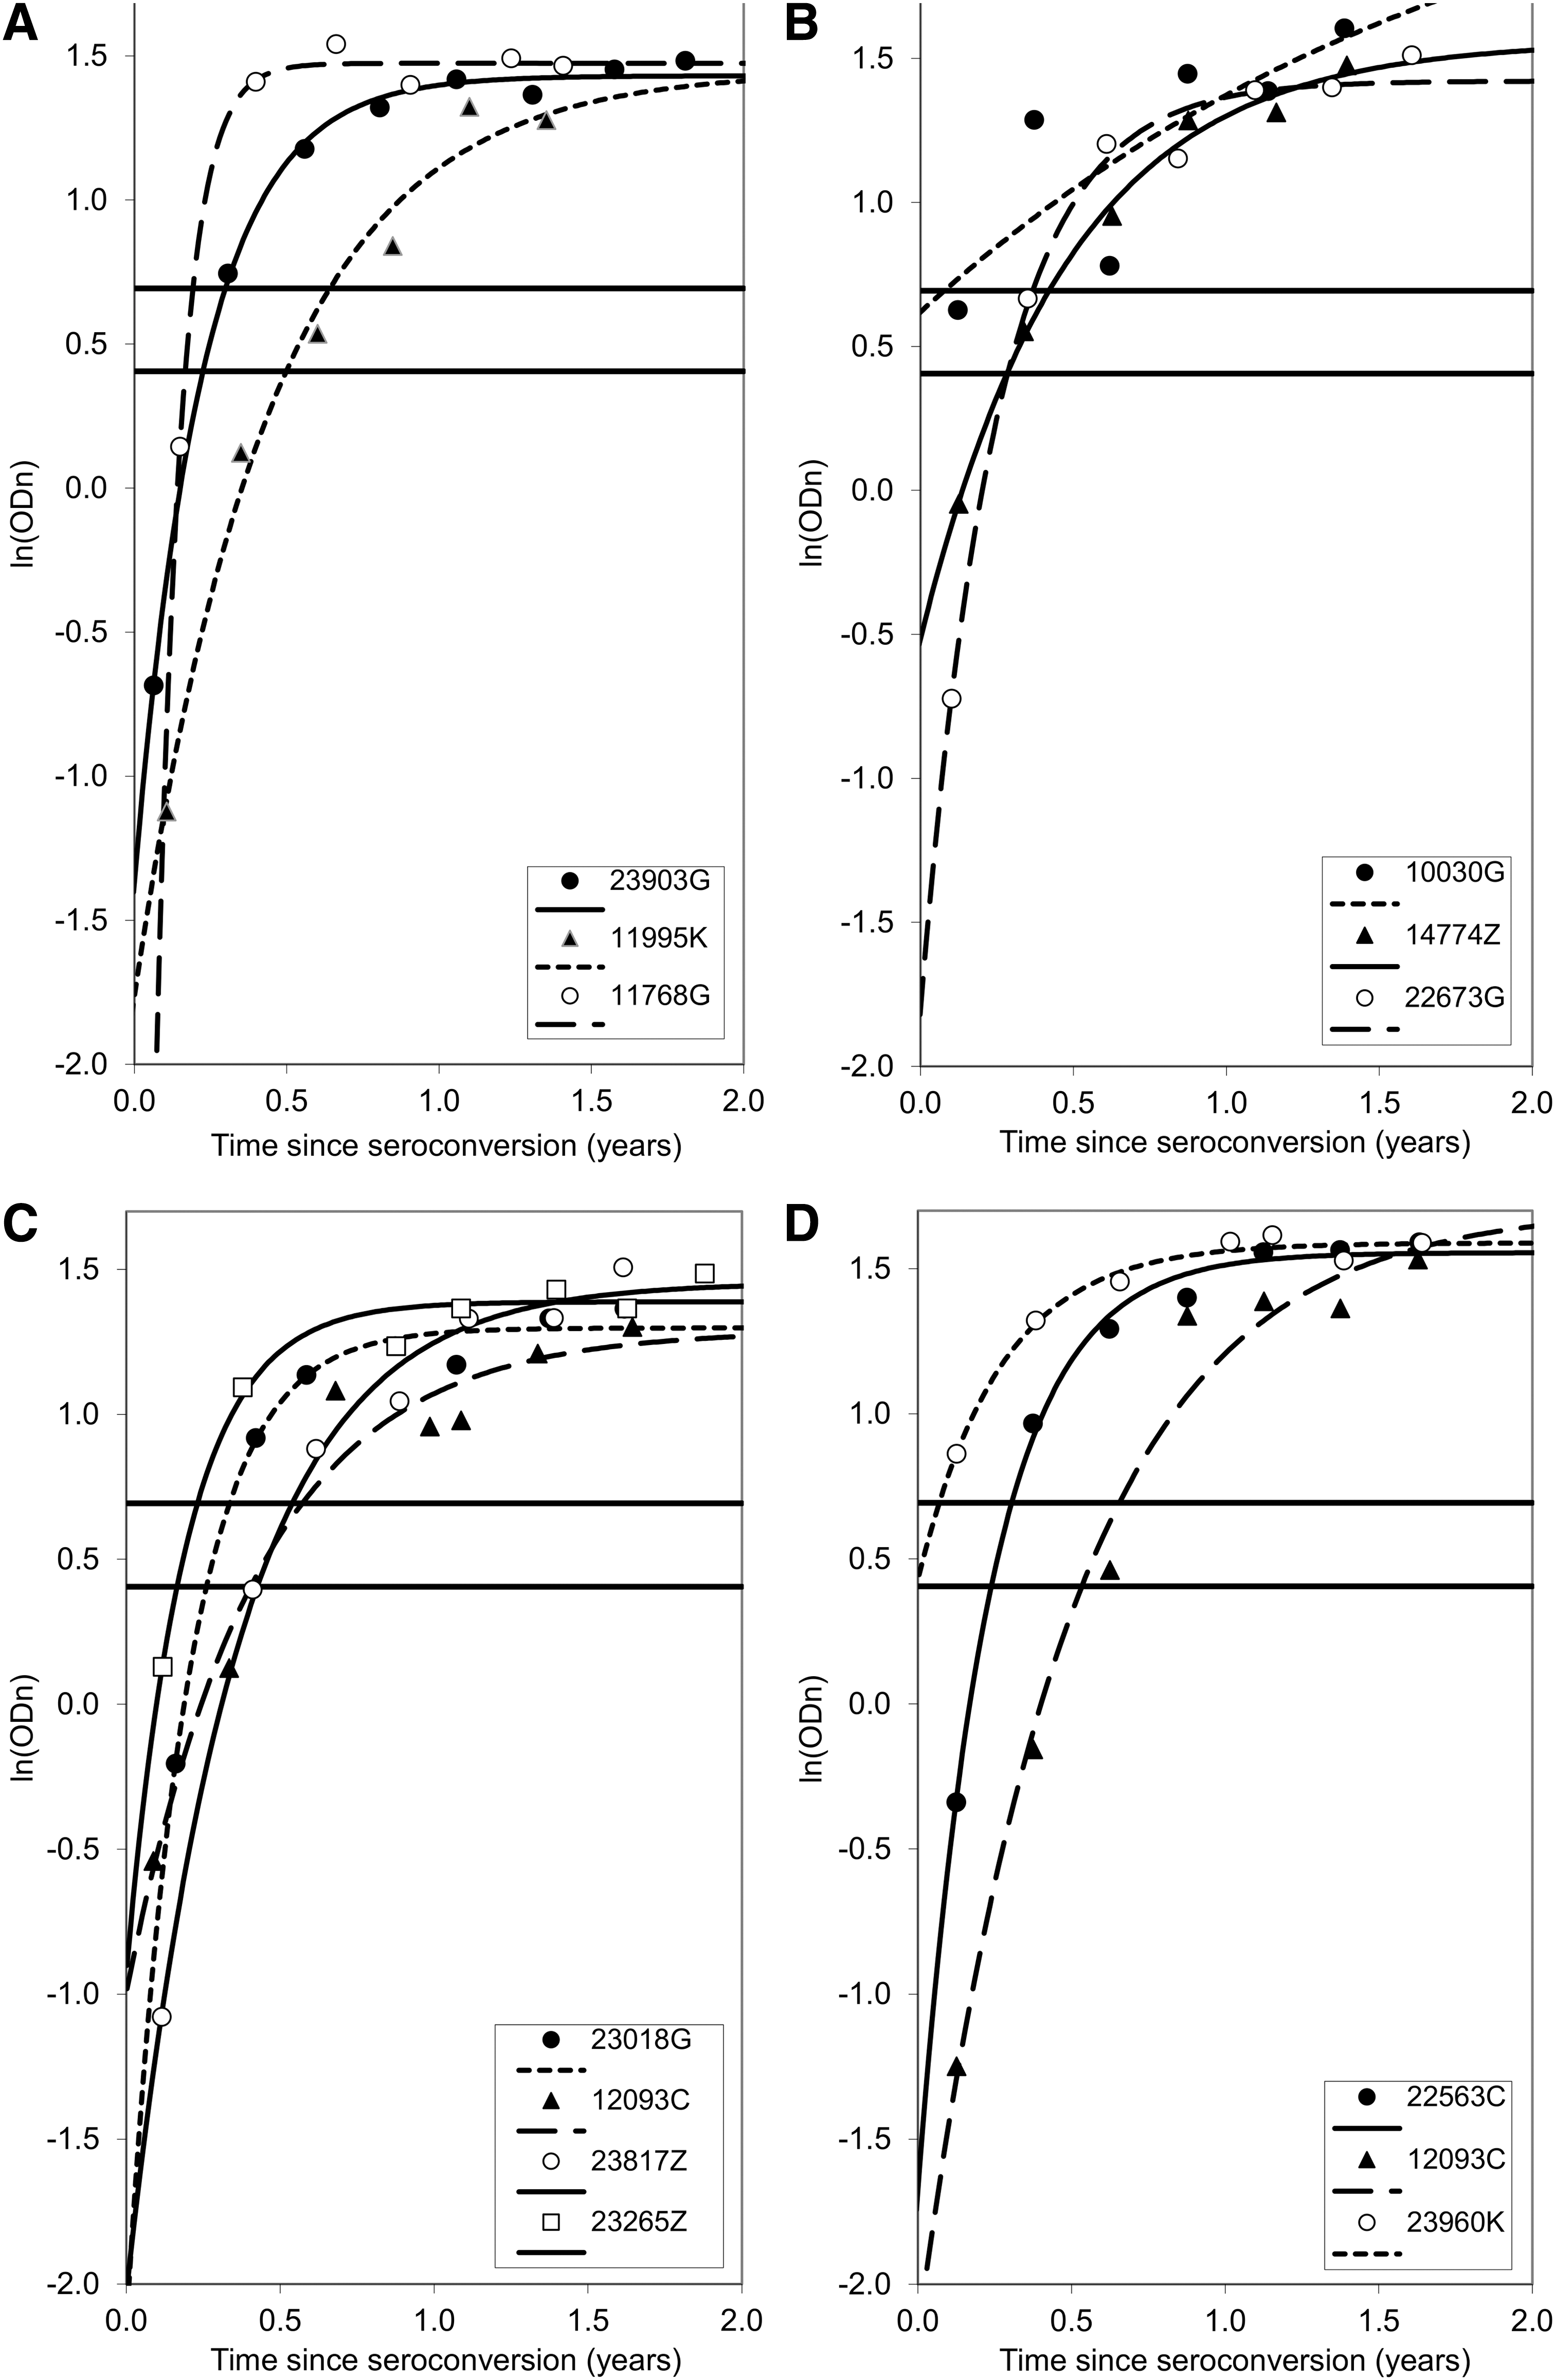
Figure 1 shows plots of changes in ODn and AI, with estimated time since HIV seroconversion, for 70 seroconverting mothers, where the time between the last negative and first positive result was ≤120 days and where we had at least three independent HIV-positive samples after seroconversion. Rates of change in ODn or AI with time since seroconversion varied between individual women: variation appeared greatest for BED assay and smallest for LAg, where the ODn was greater than the standard cutoff of 1.5 for every sample seen more than a year after seroconversion (in this subsample). For all biomarkers, the variability was markedly less than observed in other studies (cf Fig. 1 in Kassanjee et al.). 5

Plots of ODn and AI readings by estimated days since seroconversion for
For BED we found previously that, among 13 women, where we had at least six HIV-positive samples postseroconversion, ODn increase was well described by Equation (1) 9 : the same is true for LAg (Fig. 2), allowing the use of the NLMM for estimating LAg MDRI, as has been done previously for BED.
Plots of LAg ODn against estimated time since seroconversion. We fit the nonlinear function given by Equation (1) to the log transformed LAg ODn data for 13 women
When BRAI data for the same 13 women are plotted in the same way (Fig. 3) there is no close adherence to any parametric model. The greater variability seen in the BRAI results is particularly evident for the cases pictured in Figure 3B, where there are some major reverses in the rate of increase of BRAI AI. These considerations, and the fact that BRAI AI levels are bound between 0% and 100%, meant there was no prospect of using NLMM to estimate MDRI: this was estimated instead using either SA or BR.

Plots of BRAI AI values against estimated time since seroconversion. Data for 13 women
Estimates of the MDRI
Plots of MDRI against ODn or AI cutoff levels (C) (Fig. 4) demonstrate: (1) similar estimates for the various estimates with complete overlap of the 95% confidence/credibility intervals; (2) for BED and LAg, the much shorter confidence intervals found when MDRI was estimated using NLMM, compared with other methods; (3) the quasilinear increase in MDRI with C, most rapid for BED (Fig. 4A) and almost negligible for BRAI (Fig. 4C); and (4) at values of C suggested in the literature, MDRI values were longest for BED and shortest for LAg (see also Table 3), with no overlap between the 95% confidence intervals for the BED estimates and those for LAg and BRAI.
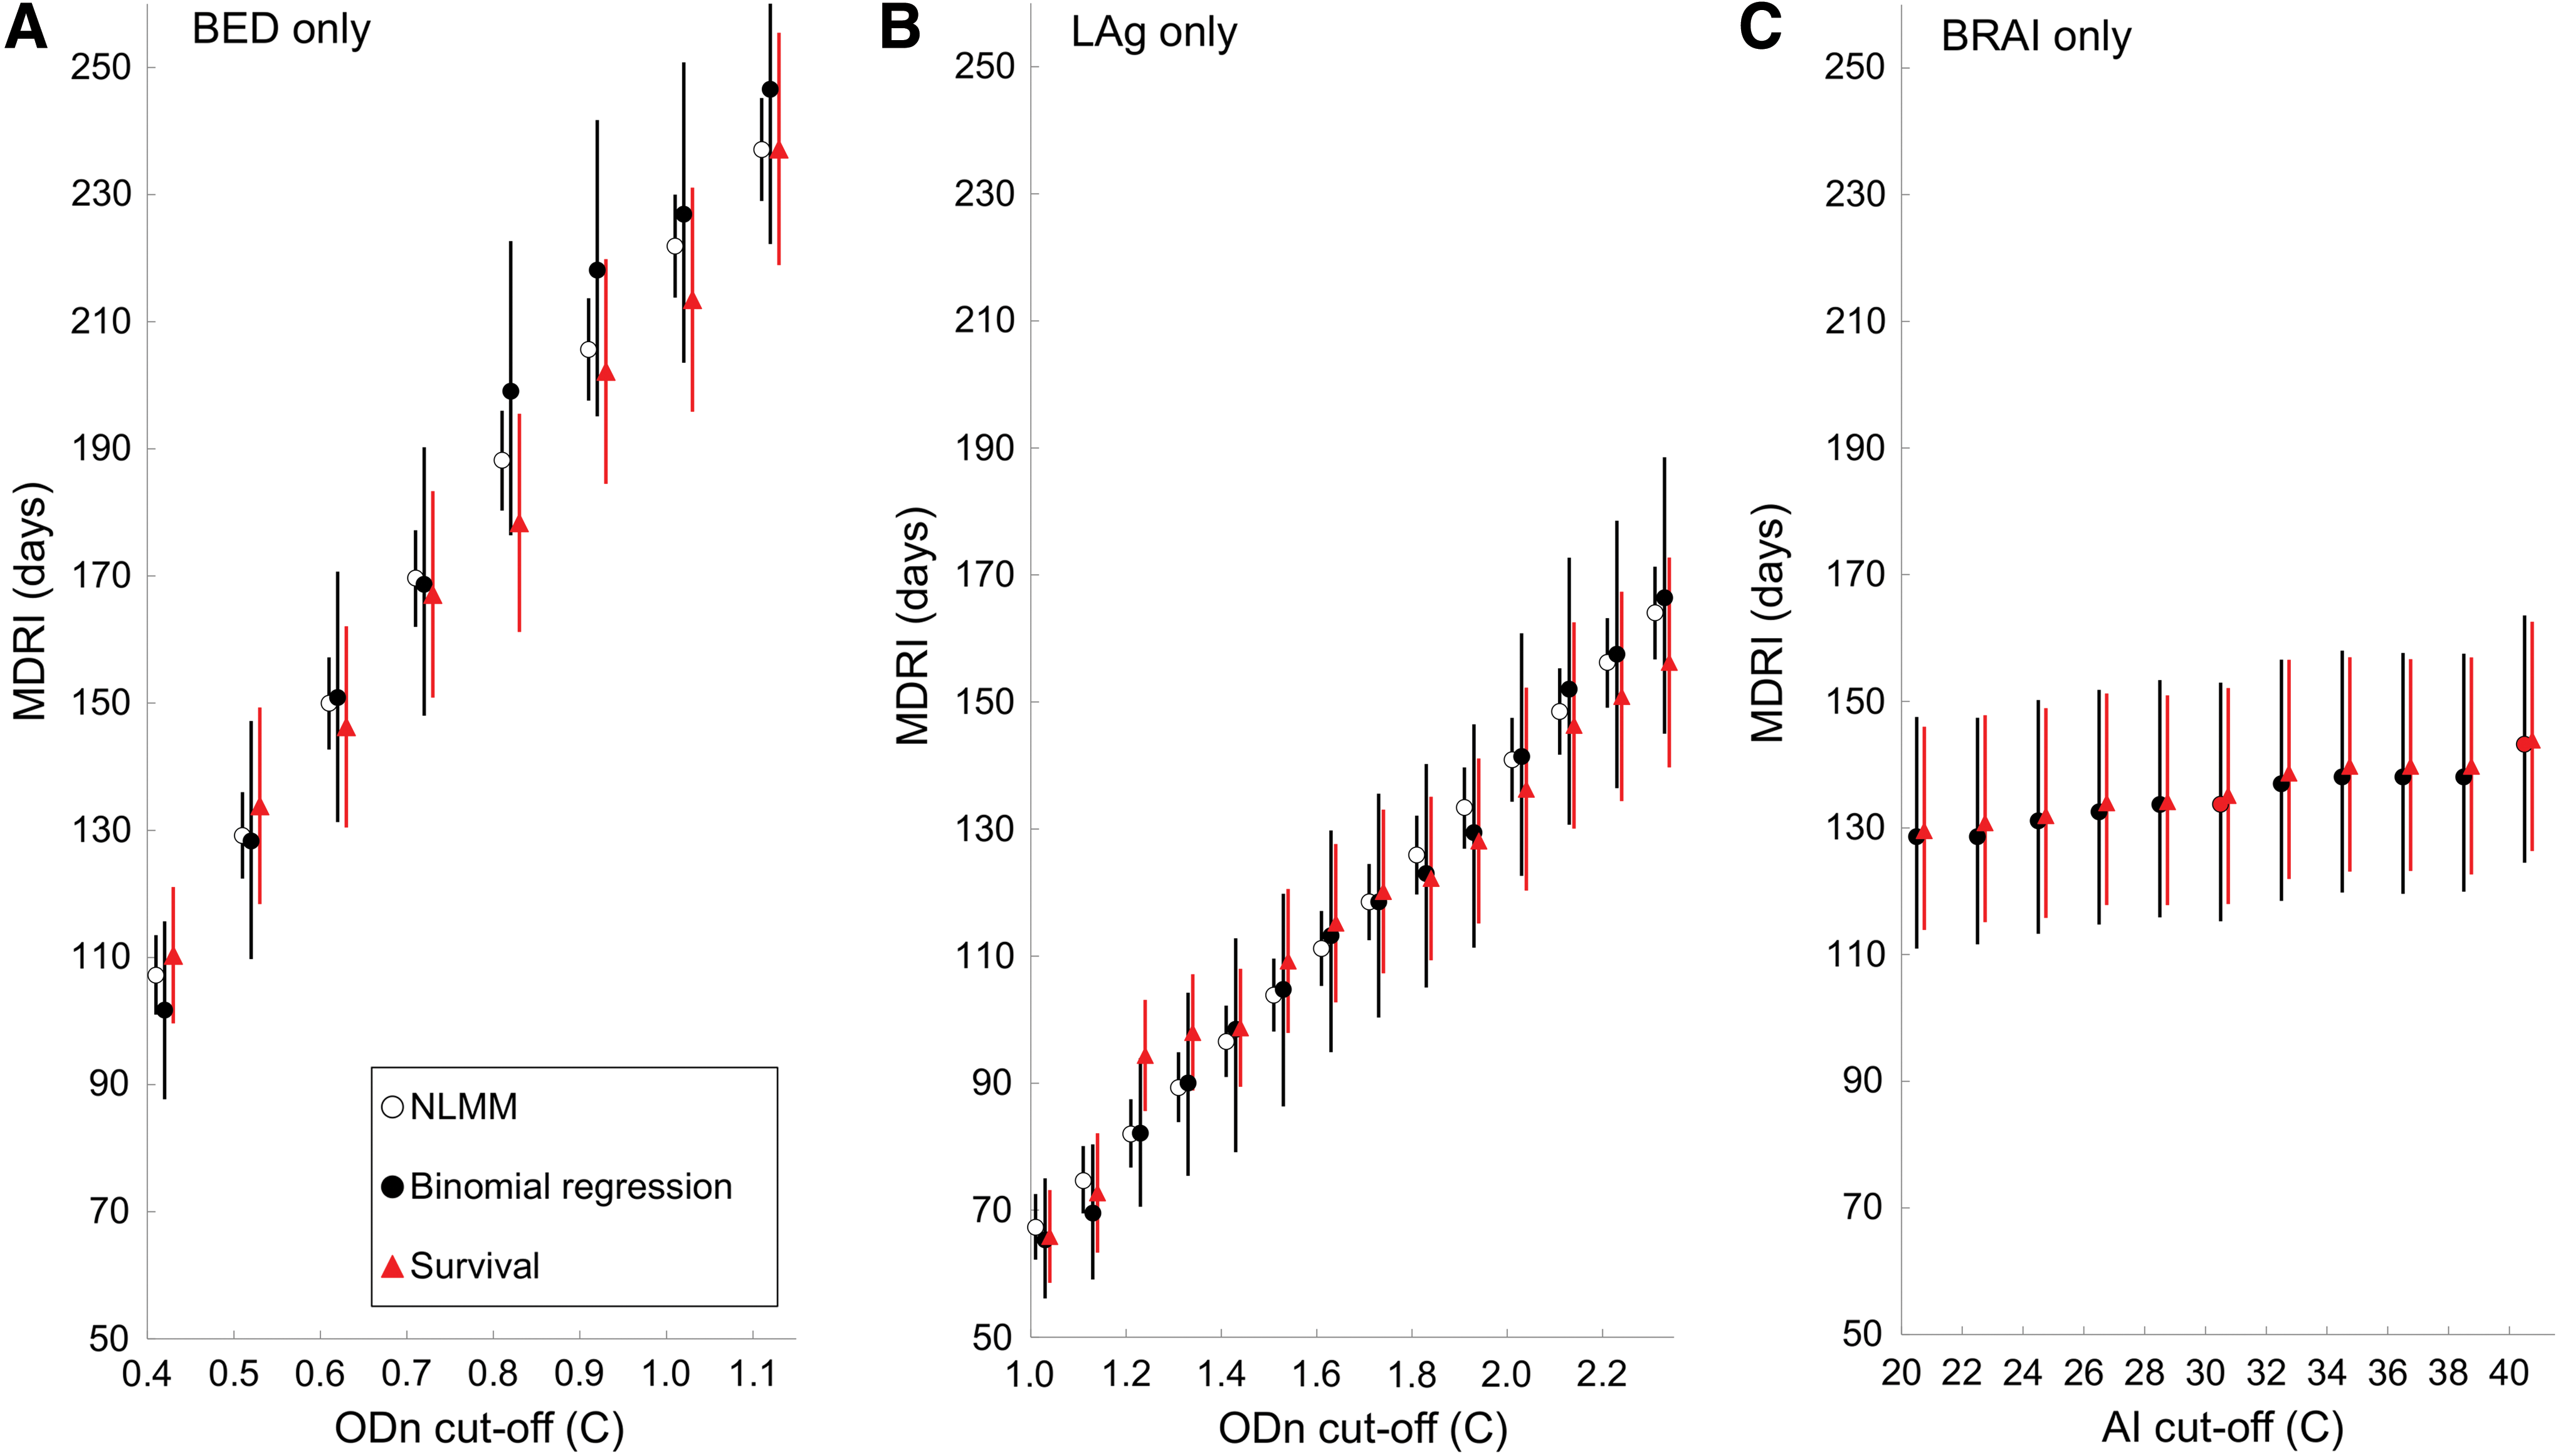
MDRI for
MDRI Estimates for BED, LAg, and BRAI Assays Measured at Different Cutoffs and Using Three Statistical Methods—SA, BR, and NLMM
The 95% confidence intervals and RSEs are shown in parentheses after each MDRI estimate. For all MDRI analyses it was required that each case had a minimum of two HIV-positive samples postseroconversion and that the time between last negative and first positive HIV tests was at most 120 days. Published MDRI estimates for HIV-1 subtype C samples, due to Kassanjee et al. and Duong et al., are presented for comparison with estimates derived from the present data.
BED, HIV subtype B, E and D; BR, binomial regression; BRAI, Bio-Rad avidity incidence; C, cutoff value; LAg, limiting antigen; MDRI, mean duration of recent infection; NLMM, nonlinear mixed modeling; RSEs, relative standard errors; SA, survival analysis.
Effect on MDRI of varying T, ns, τ0
We investigated the effects of varying the conditions under which a panel of seroconverting samples was used in an analysis: (1) ns, the minimum allowable number of cases in the panel; (2) τ 0 the maximum allowable time between the last recorded HIV test and the first recorded HIV-positive test; (3) the time T over which the MDRI is estimated.
The results in Figure 4 were obtained for analyses, where we stipulated values of T = 1 year, ns = 2, and τ 0 = 120 days. Using T = 2 years, instead of 1 year, allowing ns to vary between 1 and 4, and allowing τ 0 to vary between 60 and 120 days had small effects on the point estimates of the MDRI (Supplementary Figs. S3–S5). We found the smallest RSEs when we set ns = 2 and τ 0 = 120 days, and accordingly standardized on these settings for all further estimation procedures.
Effect on MDRI estimates of using VL and serology to identify recent cases
When cases with VL <1,000 copies/mL were classified as long-term infections, regardless of serological biomarker levels, MDRI estimates were always shorter, as expected. The differences were most pronounced for BED estimates and were smallest for LAg (Fig. 5). MDRI estimates for the three serological biomarker systems, at cutoffs suggested in the literature, confirm that RSEs were always lowest for the NLMM method, when it could be used, and were always lower for SA than for BR estimates (Table 3). For all three biomarkers, our MDRI estimates were markedly lower than published estimates for HIV-1 subtype C, with no overlap of the 95% confidence intervals (Table 3). When VL was used in conjunction with LAg, the MDRI was shorter than a published estimate for clade C virus. 19
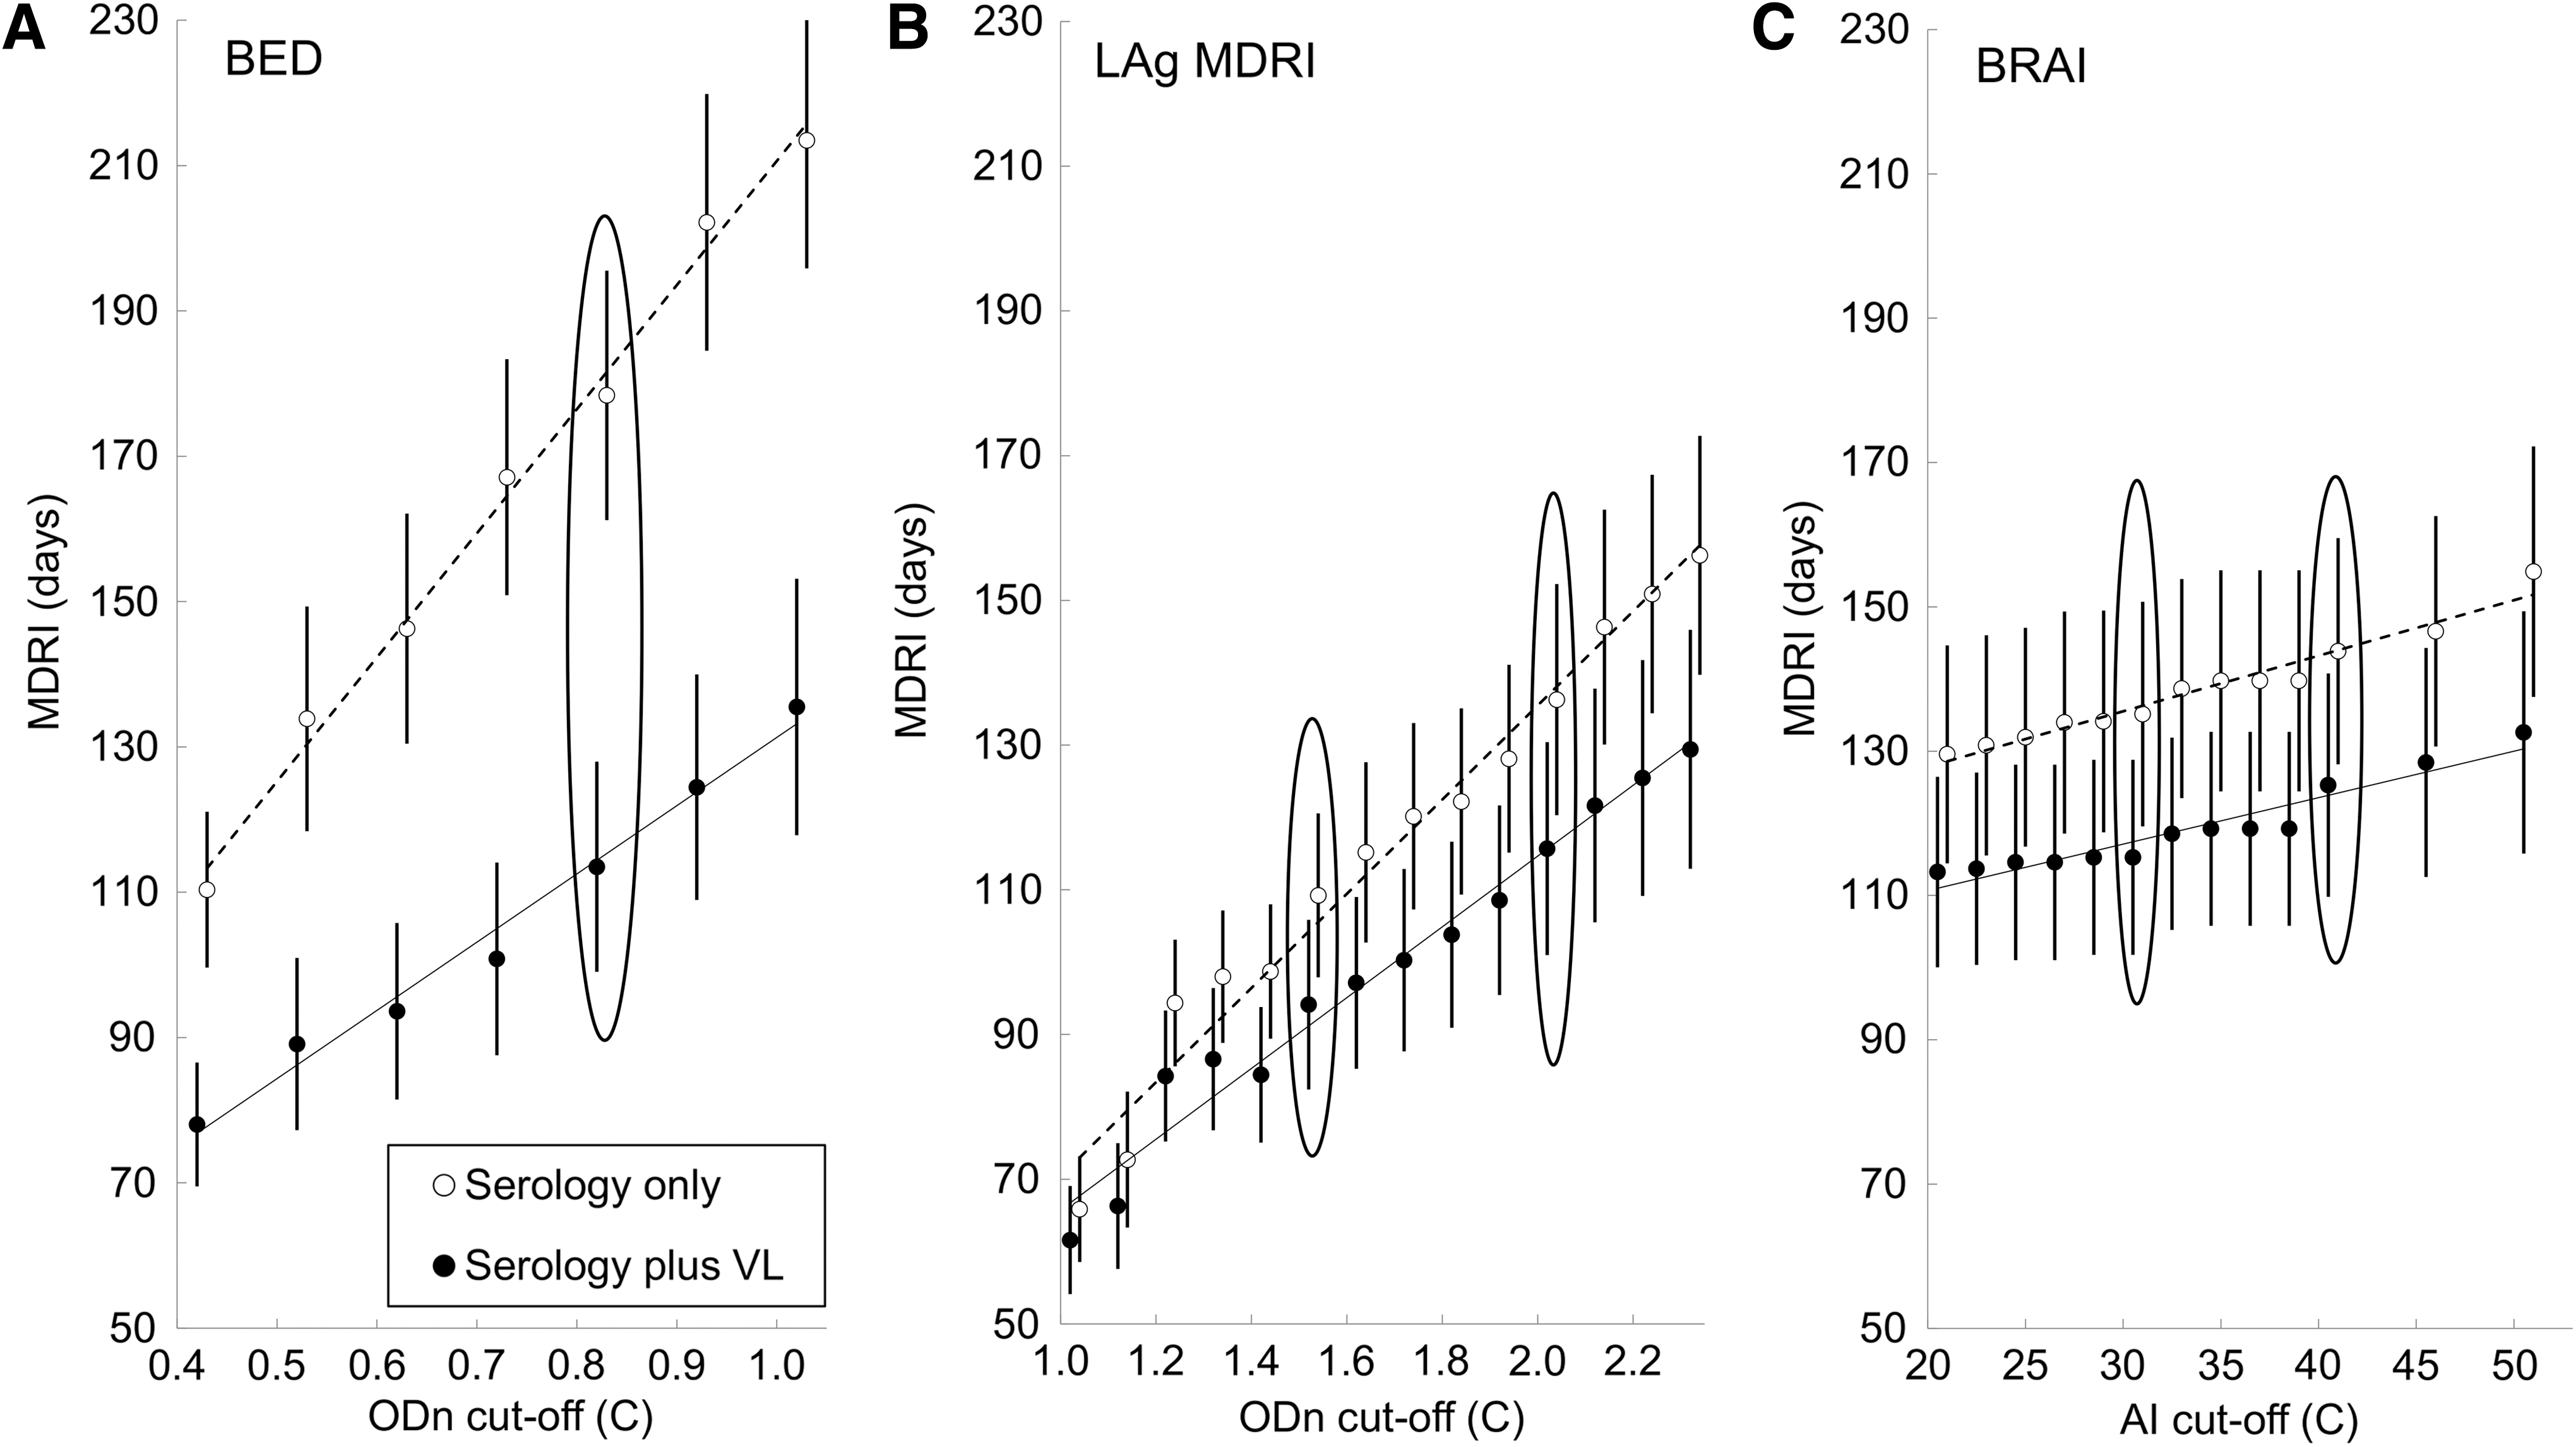
SA estimates of MDRI for
False-recent rates
At recommended cutoffs of ODn = 0.8 (BED), ODn = 1.5 (LAg), and AI = 30% (BRAI), FRRs for the serological biomarkers used alone were 8.5 and 4.5 times as high for BED as for LAg and BRAI, respectively (p < .05, chi-squared). When VL was also used, these ratios were 10.7 and 3.7, respectively (p < .05, chi-squared) (Table 4). When VL was used in conjunction with each serological biomarker, FRRs were always reduced–but the reduction was only significant at the 0.05 level of probability for BED (chi-squared).
False-Recent Rates for BED, LAg, and BRAI Assays at Different Standard Cutoffs. We Compared Our Estimates to Published Estimates by Kassanjee et al. Derived from Treatment-Naive Subtype C-Infected Subjects
Literature: 5 Kassanjee et al.
FRR, false-recent rate.
The higher FRRs for BRAI and (particularly) BED compared with LAg were, however, also associated with higher MDRIs. For a more meaningful comparison, we plotted FRR against MDRI for each biomarker. We calculated MDRIs for cutoff values (C) between ODn 1.3 and 2.3 for LAg and between 15% and 60% AI for BRAI. The upper limits are already much greater than the suggested cutoffs of 1.5 and 30%, respectively. For BED, the cutoff range was 0.4 to 0.8: at the upper limit, the MDRI and FRR values were already higher than for LAg and BRAI across the chosen values of C.
At comparable MDRIs between 110 and 170 days, there was no significant difference between LAg and BRAI FRRs when the serological biomarkers were used alone: BED FRRs were, however, significantly greater over this range of MDRIs (Fig. 6A) with no overlap of the 95% confidence intervals. The pattern was the same when the serological biomarkers were used in conjunction with VL: the ranges of MDRIs and FRRs were simply reduced, as was the range of MDRIs over which LAg and BRAI had lower FRRs than BED (Fig. 6B).

FRR plotted against MDRI estimates for LAg, BED, and BRAI. Arrows indicate MDRIs and FRRs associated with recommended cutoffs for each biomarker.
Our FRR estimates were also lower than published estimates for antiretroviral therapy (ART)-naive subtype C-infected subjects, although the much smaller sample sizes for the published estimates means that the 95% confidence intervals encompassed the point estimates from the present study (Table 4).
Discussion
Significance of the work
The primary use of the kinds of assays we evaluated in this study is to classify, for the purpose of cross-sectional incidence estimation, an HIV infection as recent or long term, given a preset ODn or AI cutoff. Both LAg and BRAI assays exhibited marked improvements over the BED assay, which had been evaluated previously using the same Trial samples. At the recommended cutoffs both LAg and BRAI yielded substantially lower FRRs, but also lower MDRIs than BED. As can be seen in Figure 6, however, at cutoffs that yielded similar MDRIs, LAg, and BRAI nevertheless exhibited lower FRRs, indicating improved overall performance for incidence estimation. The use of VL in conjunction with the serological biomarkers further reduces FRR, but MDRIs are then also shorter.
The samples analyzed in this study are unique in the HIV world, having been provided entirely by postpartum women. Moreover, since ART was not freely available to the public at the time of the Trial, we have assumed that none of the participants was on ART. We have already reported that the samples are characterized by lower reactivity levels than are seen in the general population, leading to lower MDRI estimates. 20 We show in this study that this is also true for the FRR estimates.
This is an important finding, raising the possibility that MDRI and FRR values may vary between subpopulations consisting of individuals with different physiological as well as other characteristics (geographic, ethnic, gender, etc). It may be incorrect to assume, for example, that the values of these parameters estimated for the general population will be appropriate for pregnant women. This is problematic, given the central importance of HIV testing carried out on women attending antenatal clinics.
Whichever biomarker method is used for the testing of samples collected from populations it will thus be necessary to use MDRI and FRR values that are appropriate for the population under study. In practice, however, this poses a problem since it is now neither ethical nor desirable to follow-up HIV-negative cases after the time they first test positive for HIV, at which time they should initiate ART. Estimates of MDRI and FRR would, therefore, have to rely on historic studies, or modeling and interpolating the time of infection in large cohorts that include patients with previous negative results, tested at the time of initiating therapy.
Low values for MDRI and FRR
All of the biomarker systems tested in the study returned unusually low MDRI, and FRR, estimates. These may be due, in part, to the fact that the Trial study population consisted exclusively of postpartum women and that the lower values may reflect increased humoral responses in these women. Whether or not this is the correct explanation, the diminished MDRI levels do not appear to relate to differences in the methods we have used to estimate MDRIs. We found only minor differences between MDRI values estimated using several different techniques, including the BR technique used in recent analyses of a wide range of biomarker data. The only major difference between the estimates lay in their variances: when the NLMM method could be used, for the LAg and BED assays used alone (i.e., not with VL), it provided more precise estimates than the survival and BR analyses.
How best to estimate MDRI
When the BED or LAg systems were used alone, the MDRI estimates resulting from the use of NLMM, SA, or BR were all similar. This is consistent with the results of a comprehensive benchmarking study, where MDRI was investigated using 23 different methods, using a simulated data set where the true MDRI was known. 20 The authors found that 19 of the methods, including the three used in this study, produced estimates that were closely similar and did not differ significantly from the true MDRI. All of the methods used in this study thus appear to provide acceptable estimates of the MDRI and differ only in their variances, with the NLMM being superior in this regard. This method could not be used when the serological biomarkers were used in tandem with VL but, again, there was little to choose between the MDRI estimates obtained using either SA or BR.
Relative merits of LAg and BRAI
The much-reduced FRR associated with BRAI and LAg avidity assays mark a major improvement in performance relative to assays such as the BED. The major difference between the performances of the two new assays, as measured only on the basis of our study, lay in the greater variation in the pattern of increase of BRAI AI with time since seroconversion, compared with analogous increases in LAg ODn. Thus, BRAI AI peaked soon after HIV infection but then sometimes dropped to much lower levels, on a small number of occasions to AI values less than cutoffs suggested in the literature. The primary effect of these reversals is an increase in the variance of MDRI estimates compared with LAg, implying better precision for the LAg estimates. We note that our assessment of the relative merits of the LAg and BRAI methods is deliberately limited here to the results arising from this study. Such issues as cost and cost-effectiveness are outside the scope of this evaluation.
Consequences and limitations of the study
The BED system is now an outdated system and the results for this biomarker have been included to highlight the improved performance of the more modern biomarkers. The comparisons are also valuable, however, in highlighting that the much lower FRR values seen for LAg and BRAI are also associated with markedly lower MDRI values.
Financial and practical considerations prevented us from including comparisons with other tests for recent infection. The only other biomarker available from the study was the CD4 counts but, for operational reasons beyond our control, these were available only for samples taken at baseline–and even there the counts were missing for 13% of the samples.
In addition to consisting exclusively of postpartum women, the ZVTAMBO study cohort was also unusual in that none of the participants was known to be receiving ART, which was not publicly available in Zimbabwe at the time of the Trial. These two factors limit the generalizability of our results to other cross-sectional surveys. We are therefore unable, on the basis of our results, to provide a definitive plan for using biomarker methods to estimate HIV incidence. In particular, we caution against using our estimates for FRR and MDRI in studies where participants are not postpartum women.
Finally, we note again that the samples used in this study were collected in a Trial carried out in 1997–2000. Although we conducted viability tests in which we compared the BED OD readings on specimens tested in 2013–2014 against readings obtained in the 2006 BED evaluation and found that the correlation was good, we cannot exclude the possibility that some of the HIV serology classifications were affected by the long-term storage.
Public health implications of this study
The improved performance of the LAg and BRAI assays, compared with BED, also suggest the possibility of developing better, more reliable, assays for the measurement of population-level HIV incidence in the context of universal test and treat strategy on HIV acquisition at population level in Africa. Particular interventions that may be mentioned, where testing for recent infections and incidence estimation are important, are Botswana's progress toward achieving the 2020 UNAIDS 90-90-90 ART and virological suppression goals 24 and the HPTN 071 (PopART) testing and treatment intervention to improve HIV control in Zambia. 25
In the past, biomarkers such as BED were only suggested for use in estimating proportions of recent infections in samples of HIV-positive cases. The very regular increase in LAg ODn with time since seroconversion, and the order of magnitude reduction in the FRR, suggest the possibility that this biomarker could be used to provide assessments of time since seroconversion for individual HIV-positive cases.
Footnotes
Acknowledgments
This project has been supported in part by funding from the President's Emergency Plan for AIDS Relief (PEPFAR) through the U.S. Centers for Disease Control and Prevention under terms of grant 5U2GGH00315-04 to the Department of Community Medicine, University of Zimbabwe, and a subgrant to ZVITAMBO Project. The original ZVITAMBO study was conducted under the auspices of the Ministry of Health and Child Care, Zimbabwe.
Disclaimer
The findings and conclusions in this report are those of the author(s) and do not necessarily represent the official position of the funding agencies.
Author Disclosure Statement
No competing financial interests exist.
Bharat Parekh is an inventor of LAg-Avidity EIA and receives royalties as part of U.S. Government licensing agreement with commercial partners. Recombinant protein (rIDRm) and know how to develop the LAg-Avidity EIA and related incidence assays have been licensed to multiple commercial partners as per open licensing policy of the U.S. Government. These commercial partners currently include 1) Sedia BioSciences, Portland, OR, 2) Maxim Biotech, Rockville, MD, and 3) Beijing KingHawk Pharmaceuticals Inc., Beijing, China. This does not alter the authors' adherence to AHRH Editorial policies and criteria or adherence of ARHR policies on sharing data and materials.
Supplementary Material
Supplementary Data
Supplementary Appendix SA1
Supplementary Figure S1
Supplementary Figure S2
Supplementary Figure S3
Supplementary Figure S4
Supplementary Figure S5
Supplementary Table S1
Supplementary Table S2
Supplementary Table S3
Supplementary Table S4
References
Supplementary Material
Please find the following supplemental material available below.
For Open Access articles published under a Creative Commons License, all supplemental material carries the same license as the article it is associated with.
For non-Open Access articles published, all supplemental material carries a non-exclusive license, and permission requests for re-use of supplemental material or any part of supplemental material shall be sent directly to the copyright owner as specified in the copyright notice associated with the article.