
Abstract
Immune checkpoint molecules (ICMs) regulate T cell responses. In chronic viral infections and cancer, where antigens can persistently stimulate the immune system, ICMs can serve as a barrier to effective immune responses. The role of ICMs in the setting of systemic low-grade inflammation as in aging and antiretroviral therapy (ART)-suppressed HIV infection is not known. In this study, we made use of stored samples from the FLORAH cohort of HIV-infected ART-suppressed adults (age range 19–77 years.) and age-matched HIV-uninfected controls. We measured the expression levels of ICMs: PD-1, LAG-3, TIGIT, TIM-3, and 2B4 on resting CD4 and CD8 T cells and maturation subsets. To determine how expression of these molecules can affect T cell function, we stimulated peripheral blood mononuclear cell with HIV Gag or p09/H1N1 antigen and performed intracellular cytokine staining by multiparameter flow cytometry. ICMs were expressed at higher levels in CD8 compared with CD4. PD-1 was the only molecule that remained significantly higher in HIV-infected individuals compared with controls. LAG-3 expression increased with age in CD4 and CD8 T cells. 2B4 expression on CD8 T cells was negatively associated with IL-2 production but showed no effect on CD4 T cell function. TIM-3 expression was negatively associated with IL-21 production in CD4 and CD8 T cells and also negatively correlated with flu vaccine responses in HIV-negative individuals. Taken altogether, this study demonstrates the marked variation in ICM expression in T cells among adults and sheds light on the biology of these molecules and their effects on antigen-specific T cell functions. Overall, our results point to TIM-3 as a potential biomarker for immune function in HIV+ individuals on ART.
Introduction
HIV
Immune senescence refers to age-associated changes in the adaptive immune system that are observed in both uninfected elderly and HIV-infected individuals. Immune senescence is characterized by decreased thymic output, accumulation of terminally differentiated cell subsets, and loss of naive T cells, decreased T cells expressing the costimulatory molecule CD28, and reduced proliferative capacity. 9,10 Immune senescence in HIV infection is thought to be driven by constant antigen exposure and recurrent T cell activation leading to the expression of immune checkpoint molecules (ICMs, also called inhibitory receptors), which play critical roles in inhibiting T cell responses after activation. 11,12
ICMs are membrane-bound proteins from diverse protein families, including Programmed cell Death-1 (PD-1), lymphocyte activation gene-3 (LAG-3), Natural Killer Receptor 2B4 (2B4), T cell immunoglobulin and mucin-domain containing-3 (TIM-3), T cell immunoreceptor with Ig and ITIM domains (TIGIT), and others. The term “exhaustion” refers primarily to CD8+ T cells that have accumulated individual or multiple ICMs on the surface and have become inactive, characterized by low IL-2 secretion and loss of poly-functionality, as well as poor proliferative capacity and defective chemokine production in response to antigenic stimuli. 13,14 Although exhaustion and immune senescence have clear overlap especially during HIV infection, the relationship between ICM expression and biological age in the absence of a specific disease has not yet been established.
Molecular inhibitors of ICM, especially PD-1, have shown promise for remission of a variety of tumors in the cancer field. 15 The efficacy of combining multiple ICM inhibitors demonstrates the nonredundant signaling pathways utilized by ICM. 16 Studies have shown that CD4 T cells also express ICM, 17 although at lower levels compared with CD8 T cells, and can be exhausted in certain cancer settings. 18 In the context of HIV infection, ICM expression in CD4 T cells has been linked to HIV reservoir measurements 19 and time to viral rebound after ART interruption. 20 Given the ubiquitous presence of data related to ICM expression in T cells, which are essential for recognition of any antigen be it viral, allo- or autoantigen, or tumor derived; the distribution and expression patterns of ICM are critical to understanding adaptive cellular immune responses.
We, therefore, conducted the following study to measure the relationship between ICM expression and immune functionality in T cell populations from healthy and HIV-infected young and aging adults. These results are important for understanding ICM biology as well as the utility of using ICM as biomarkers of immune function in people with reconstituted immune systems.
Methods
Study participants
The study described in this article is a substudy of a larger study on influenza antibody responses in Aging and HIV infection (FLORAH). 21 Participants were recruited from University of Miami, Jackson Memorial, and VA Hospitals in Miami, FL, from two populations: (1) HIV-infected ART-treated individuals who demonstrated virus suppression (HIV RNA <40 copies/mL) for at least 1 year before enrollment and (2) HIV-uninfected healthy controls (HC). Study participants were recruited during the 2013–2014, 2014–2015, and 2015–2016 influenza seasons with each participant being unique for one of the three vaccine seasons. Participants were deidentified and provided written informed consent according to protocols approved by IRB of the University of Miami in accordance with the Declaration of Helsinki. All participants were administered a single intramuscular dose of seasonal influenza trivalent inactivated vaccine and provided peripheral blood samples at prevaccination (T0) and postvaccination time points: day 7 (T1), day 21–28 (T2), and week 24 (T3). Peripheral blood mononuclear cells (PBMCs) and plasma were stored in liquid nitrogen and −80°C freezers, respectively, until further experiments were performed. Serum antibody titers to each vaccine strain were determined at every time point by hemagglutination inhibition (HAI) assay as described. 22 Participants in this study were excluded if they exhibited very high prevaccination H1N1 antibody titers >1:320.
Phenotypic analysis by flow cytometry
Cryopreserved PBMC were thawed and rested overnight in complete RPMI medium supplemented with 10% FBS, Pen/Strep, and
Intracellular cytokine staining
Samples were run in parallel for phenotypic analysis (mentioned earlier) and intracellular cytokine staining. In total 1–1.5 million PBMC suspensions were cultured at a final volume of 200 μL of complete RPMI medium in the presence of Staphylococcus aureus Enterotoxin B (SEB; List Biological Labs, CA) at 1 μg/mL or H1N1/09 vaccine antigen (Novartis) at 5 μg/mL plus purified anti-CD28 mAb (clone CD28.2, BD Biosciences) or Gag peptides (for HIV+ participants only) in 96-well round-bottom tissue culture plates at 37°C and 5% CO2 for 12 h. The secretion inhibitor BrefeldinA (10 μg/mL) was added to all cultures for the last 7 h of incubation. After the culture period cells were washed and surface stained with the following multiparameter flow cytometry panel: CD3 BUV395 (clone SK7), CD4 PerCPCy5.5 (clone L200), CD8 AF700 (clone RPA-T8) from BD Biosciences; CD45RO ECD (clone UCHL1) from Beckman Coulter; and CD27 PECy5 (clone 0323) from eBioscience. The cells were then fixed and permeabilized using CytoFix/CytoPerm (BD Biosciences) according to manufacturer's instructions and stained using antibodies against: IL-2 BV711 (clone 5344.111), IFN-γ PECy7 (clone B27) from BD Biosciences; IL-21 PE (clone eBio3A3), IL-17A AF488 (clone eBio64DEC17), from eBiosciences; and TNFα APCCy7 (clone Mab11) from Biolegend. Cells were suspended in 1% paraformaldehyde and acquired on a BD LSR Fortessa (BD Biosciences) instrument and analyzed by FlowJo V10 (TreeStar, Inc.).
HIV DNA
Total HIV DNA was analyzed in PBMC as described previously. 23 Total DNA was purified from cells using QIAamp DNA Blood Mini Kits (Qiagen) according to the manufacturer's protocol. Primers and fluorogenic probes were designed to quantitate total HIV-1 clade B genomes and human CCR5. All targets were measured by Droplet Digital™ PCR (ddPCR™) using a QX100 instrument (Bio-Rad). The single-copy human CCR5 gene was quantified to measure the number of cell equivalents in DNA samples for standardization. The data are expressed as HIV copies per million PBMC.
Measurement of influenza pH1N1/09 antibody titers
Antibody titers against pH1N1/09 influenza strain (gift from Seqirus, PA) were evaluated using HAI assay, which was performed as previously described. 22 HAI titers are expressed as the reciprocal of the highest serum dilution at which hemagglutination was prevented.
LPS measurement
LPS levels were measured in plasma samples by the use of the Limulus amebocyte lysate chromogenic endpoint assay (Lonza Group Ltd, Allendale, NJ) according to the manufacturer's recommendations. Samples were diluted 1:5 in endotoxin-free water and heat inactivated at 80°C for 10 min before the assay. LPS concentration in the samples was calculated in relation to an Escherichia coli endotoxin standard and expressed in picograms per milliliter.
Soluble TNF measurement
Plasma levels of TNF were measured using a customized MILLIPLEX™ Human Cytokine magnetic bead panel (EMD Millipore, Billerica, MA) following manufacturer's instructions. In brief, plasma samples were thawed, vortexed, and centrifuged at 14,000 rpm for 3 min immediately before testing. Undiluted plasma was incubated overnight with beads specific TNF at 4°C with shaking. Streptavidin-PE was then added to the wells and allowed to incubate for 30 min at room temperature. The beads were then washed and diluted with 150 μL Sheath Fluid before acquisition on a MAGPIX instrument (Luminex Corporation, Austin, TX). The mean fluorescent intensity data were analyzed with MILLIPLEX™ Analyst Software V.3.5 (EMD Millipore). TNF concentration was determined based on standard curves and expressed in picograms per milliliter.
Statistical methods
All statistical tests were performed using GraphPad Prism 8 for Windows (Version 8.1.1). Student's t-test was used in comparisons between HC and HIV+ groups for individual ICM. For comparing ICM expression across T cell maturation subsets, we used two-way ANOVA with multiple comparisons. All data sets were assessed for normal (Gaussian) distribution and then Spearman correlation analyses were performed for determining correlative relationships between ICM expression and functional data sets.
Results
Differential effects of age and HIV status on ICM expression
We enrolled ART-treated HIV-infected adult volunteers and HCs (Table 1) to participate in an influenza vaccination study as described.
21
Multiparameter flow cytometry was performed on PBMC from prevaccination samples to evaluate expression levels of five ICMs, including 2B4, PD1, LAG3, TIGIT, and TIM3; and maturation markers based on CD45RO and CCR7 expression on CD4 and CD8 T cells. First, we compared baseline (prevaccination) ICM expression in HIV-infected individuals (HIV+) and HCs on total CD4 and CD8 T cells (Fig. 1
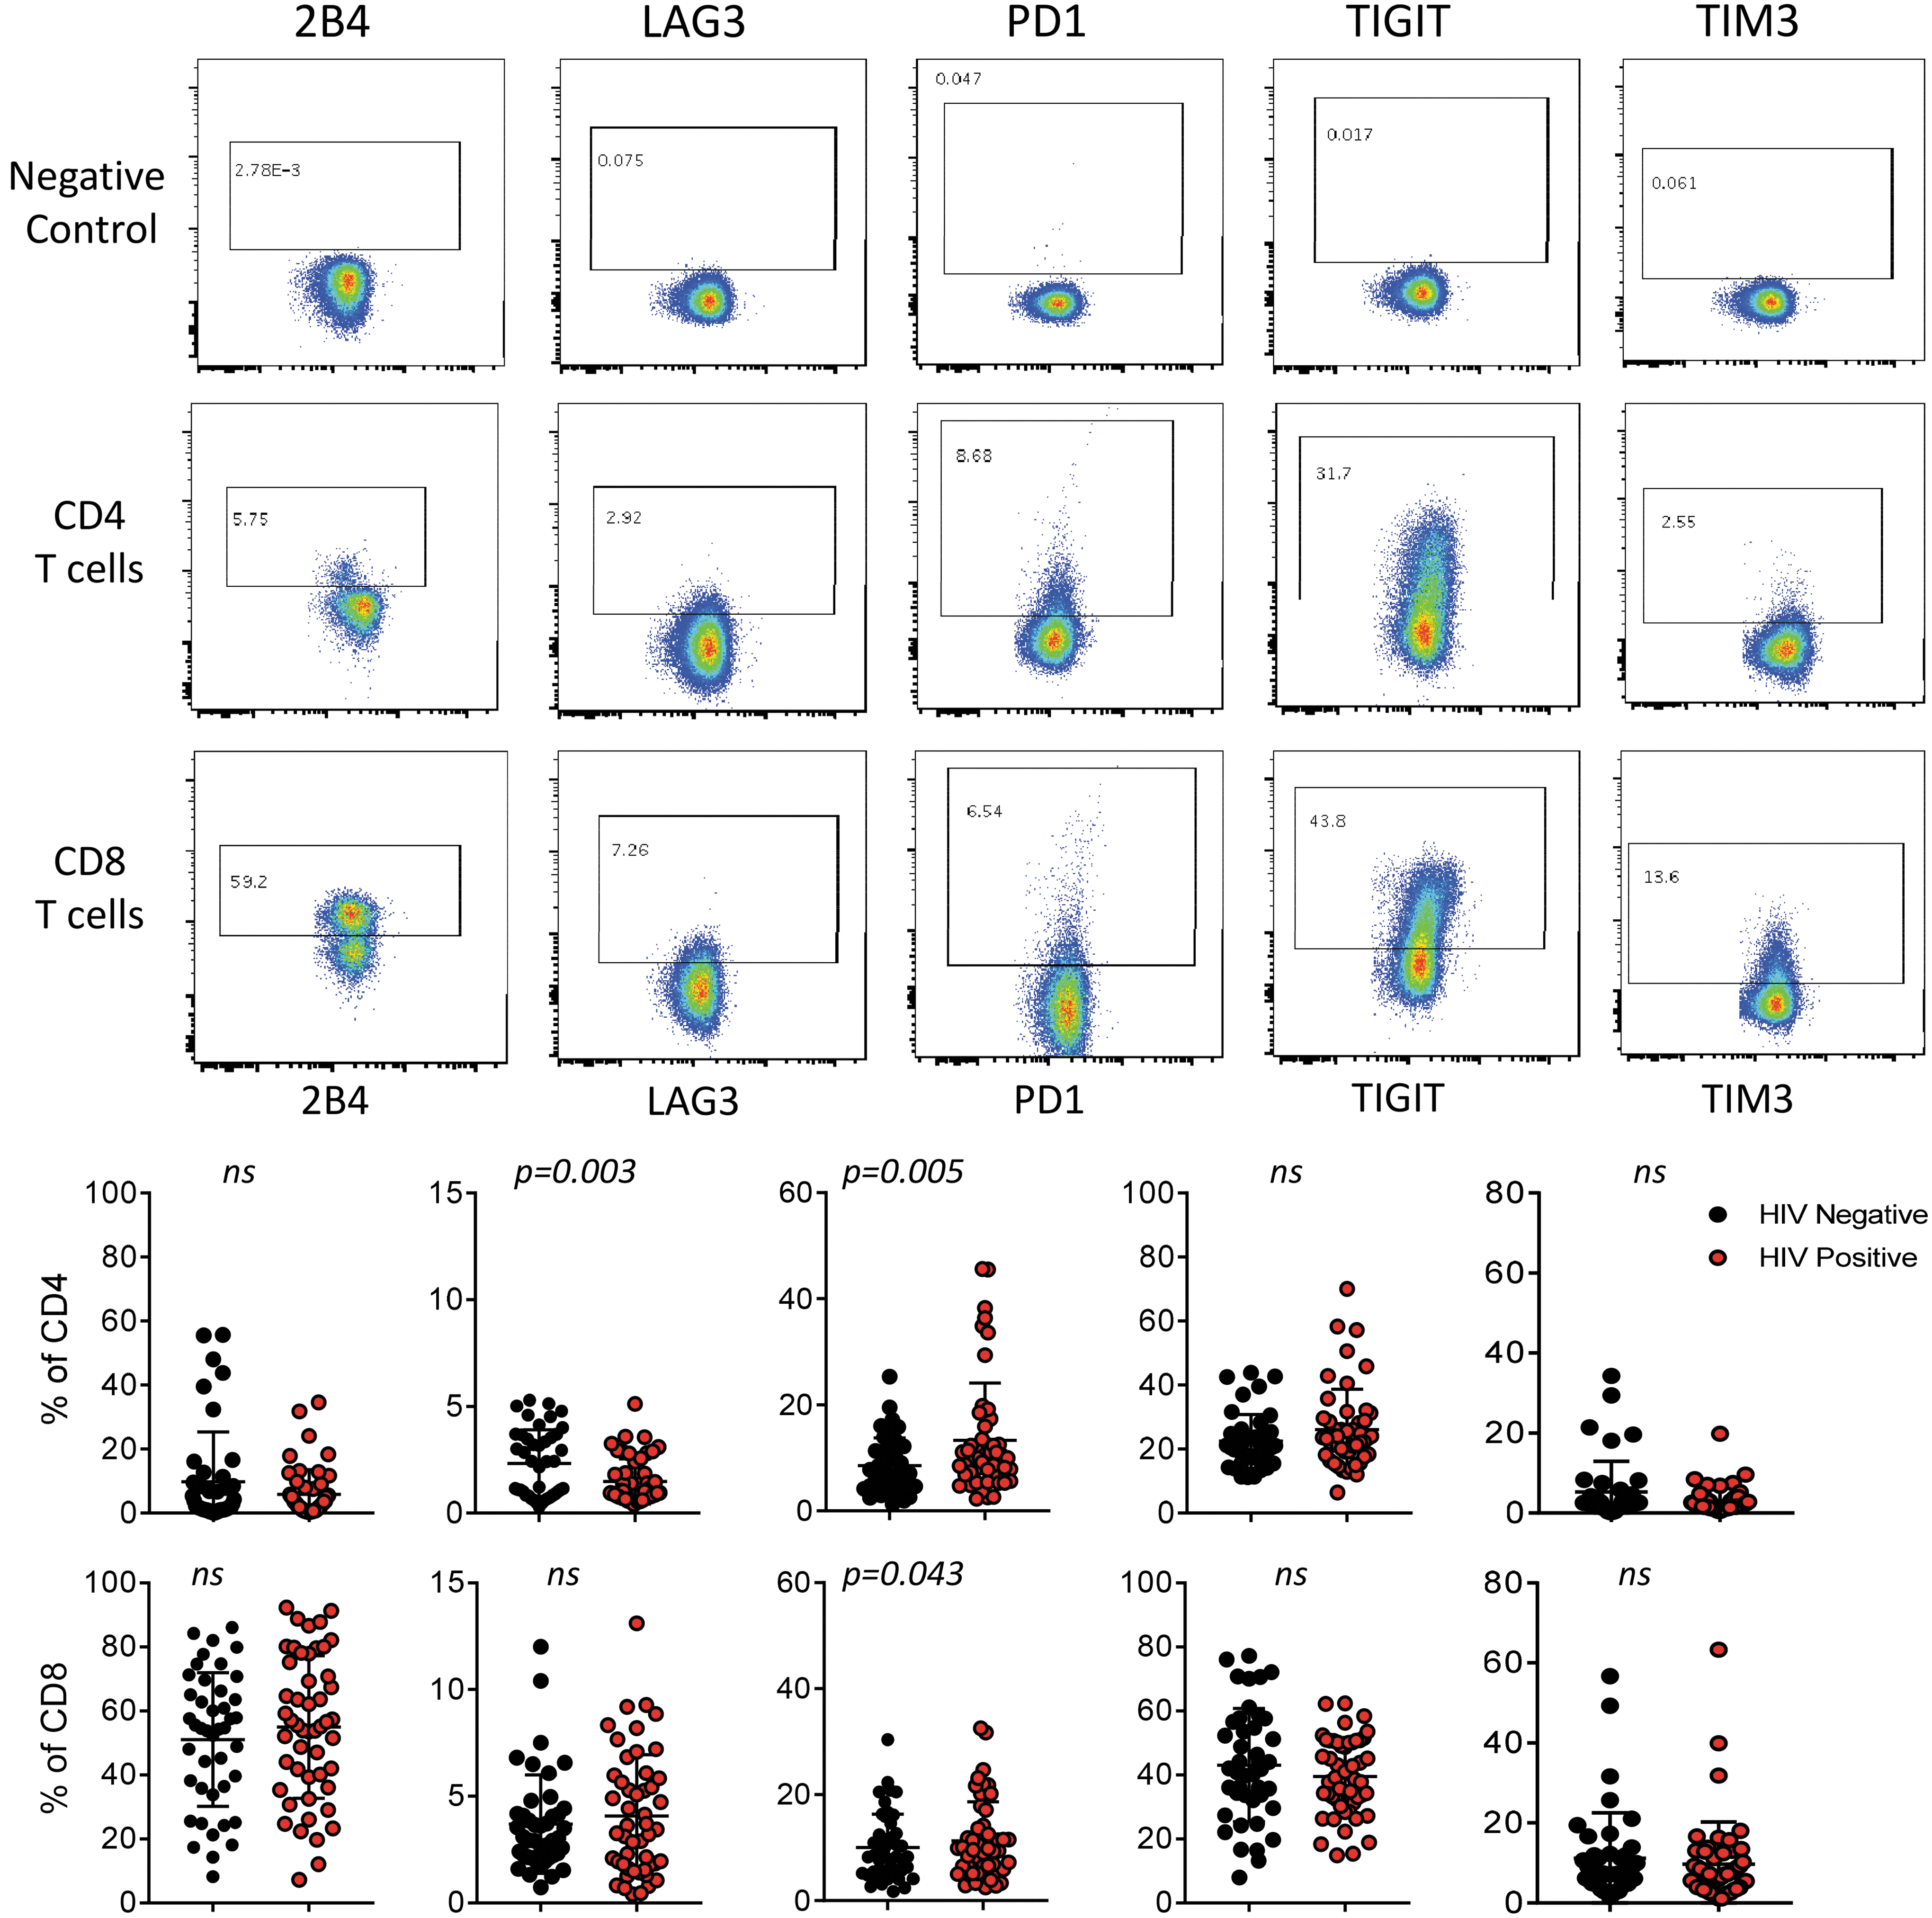
ICM expression on total CD4 and CD8 T cells. Representative flow plots showing expression of each marker on CD4 and CD8 T cells with no antibody controls (top). Negative control indicates a sample that was stained only with CD3, CD4, CD8, and live/dead antibodies to define gating for positive expression of ICM. Summary data for all study participants showing cell frequencies for each marker separated between HIV-infected participants (red) and HIV-uninfected HCs (black) (bottom). Each dot represents one individual. Student's t-test was performed to determine significant differences between the groups, p-values shown on graphs or indicated not significant (ns). ICM, immune checkpoint molecule.
Participant Population: Cross-Sectional Study
p = .08, unpaired t-test comparing HIV negative and HIV positive.
N/A, not applicable.
Next, we tested the hypothesis that ICM expression increases with biological age by performing correlation analysis between individual ICM and the age of our study participants (Table 2). LAG3 showed a positive correlation with age in CD4 (r = 0.53, p = .0001) and CD8 T cells (r = 0.39, p = .0072) from HC, and this relationship was maintained in CD4 from HIV+ (r = 0.47, p = .004) but not with CD8. In CD4 T cells from HC, TIGIT and TIM3 expression were negatively correlated with age (r = −0.42, p = .003; r = −0.39, p = .0069, respectively). PD-1 expression on CD4 showed a weak positive correlation with age in the HIV group only (r = 0.27, p = .04), whereas PD-1 on CD8 showed a positive correlation with age in the HC group only (r = 0.33, p = .02). Lastly, TIM3 in CD8 from HIV+ was negatively associated with age. Taken altogether, these results do not support the hypothesis that ICM expression overall increases on T cells with age.
Immune Checkpoint Molecule Expression in T Cells: Effect of Age
Differential distribution of ICMs in T cell subsets
To better characterize IC expression on T cells, we measured frequencies of maturation subsets and the patterns of expression for each ICM on the different subsets as defined by CD45RO and CCR7: Tnaive (CD45RO−CCR7+), Central Memory (TCM, CD45RO+CCR7+), Effector Memory (TEM, CD45RO+CCR7−), and Effector (Teff, CD45RO−CCR7−) (Fig. 2A). Overall maturation subset distributions were determined and CD4 from HC and HIV+ were both enriched for naive and CM subsets (Fig. 2B). In CD8, Tnaive and Teff subsets had the highest frequencies. In a comparison of subset distribution between HC and HIV+, only CD4 TCM frequency was affected by HIV status as has been previously shown 24 (Fig. 2B). In CD4 and CD8 the average Tnaive frequencies decreased with age, whereas TCM and Teff increased in CD4 and CD8 T cells, respectively (Fig. 2C).

T cell subset distribution and relationship in HCs and HIV+.
Next, we evaluated subset expression by the individual IC molecules, first in HC (Fig. 3 and Supplementary Fig. S1). For each ICM, subset distribution was determined for the pool of positive cells in an individual. Each of the ICM evaluated showed different patterns of expression between CD4 and CD8 T cells. Within each cell type, however, some ICMs showed similar patterns of distribution, such as 2B4 and PD1 in CD4 and CD8 T cells. In CD4, LAG3, TIGIT, and TIM3 had the majority of expression in the TCM subset (63%, 56%, and 49%, respectively). In CD8, 2B4, PD1, and TIGIT showed the majority of expression in the Teff, whereas LAG3 expression was enriched in Tnaive, TCM, and Teff. TIM3 expression was highly enriched in Tnaive in both CD4 and CD8 T cells.

Comparison of ICM expression by T cell subset in HCs. Pie charts showing the overall distribution using the mean expression of each ICM within the T cell maturation subsets in CD4 T cells (top row) and CD8 T cells (bottom row) for HC participants.
The distribution patterns for each ICM remained the same in HIV-infected participants as HC in CD8 T cells; however, in CD4 T cells LAG3, TIGIT, and TIM3 exhibited increased expression in Tnaive cells compared with HC (LAG3: 34% vs. 25%, p = .0035; TIGIT: 28% vs. 20%, p = .0053; TIM3: 51% vs. 39%, p = .018) (Supplementary Fig. S1).
For comparison, we measured CD28 and CD57 expression on T cells to determine frequencies of immune senescent (CD28−CD57+) cells in the study participants (Fig. 4A). In CD4 T cells, frequencies of CD28−CD57+ cells were higher in HIV+ than HC (median 5.1% vs. 1.4%, p = .04) (Fig. 4B). CD8 T cells had higher frequencies of immune senescent cells compared with CD4 T cells, but there were no differences between the two groups. Subset distribution analysis confirmed that immune senescent cells tend to accumulate in terminally differentiated cell populations with ∼80% of cells in the TEff subset of CD8 T cells (Fig. 4C). Distribution in CD4 T cells was opposite of what was seen typically for ICM expression, with >90% of CD28−CD57+ cells residing in the TEff and TEM subsets. No significant differences were observed between HC and HIV+ in subset distribution or relationship with age.
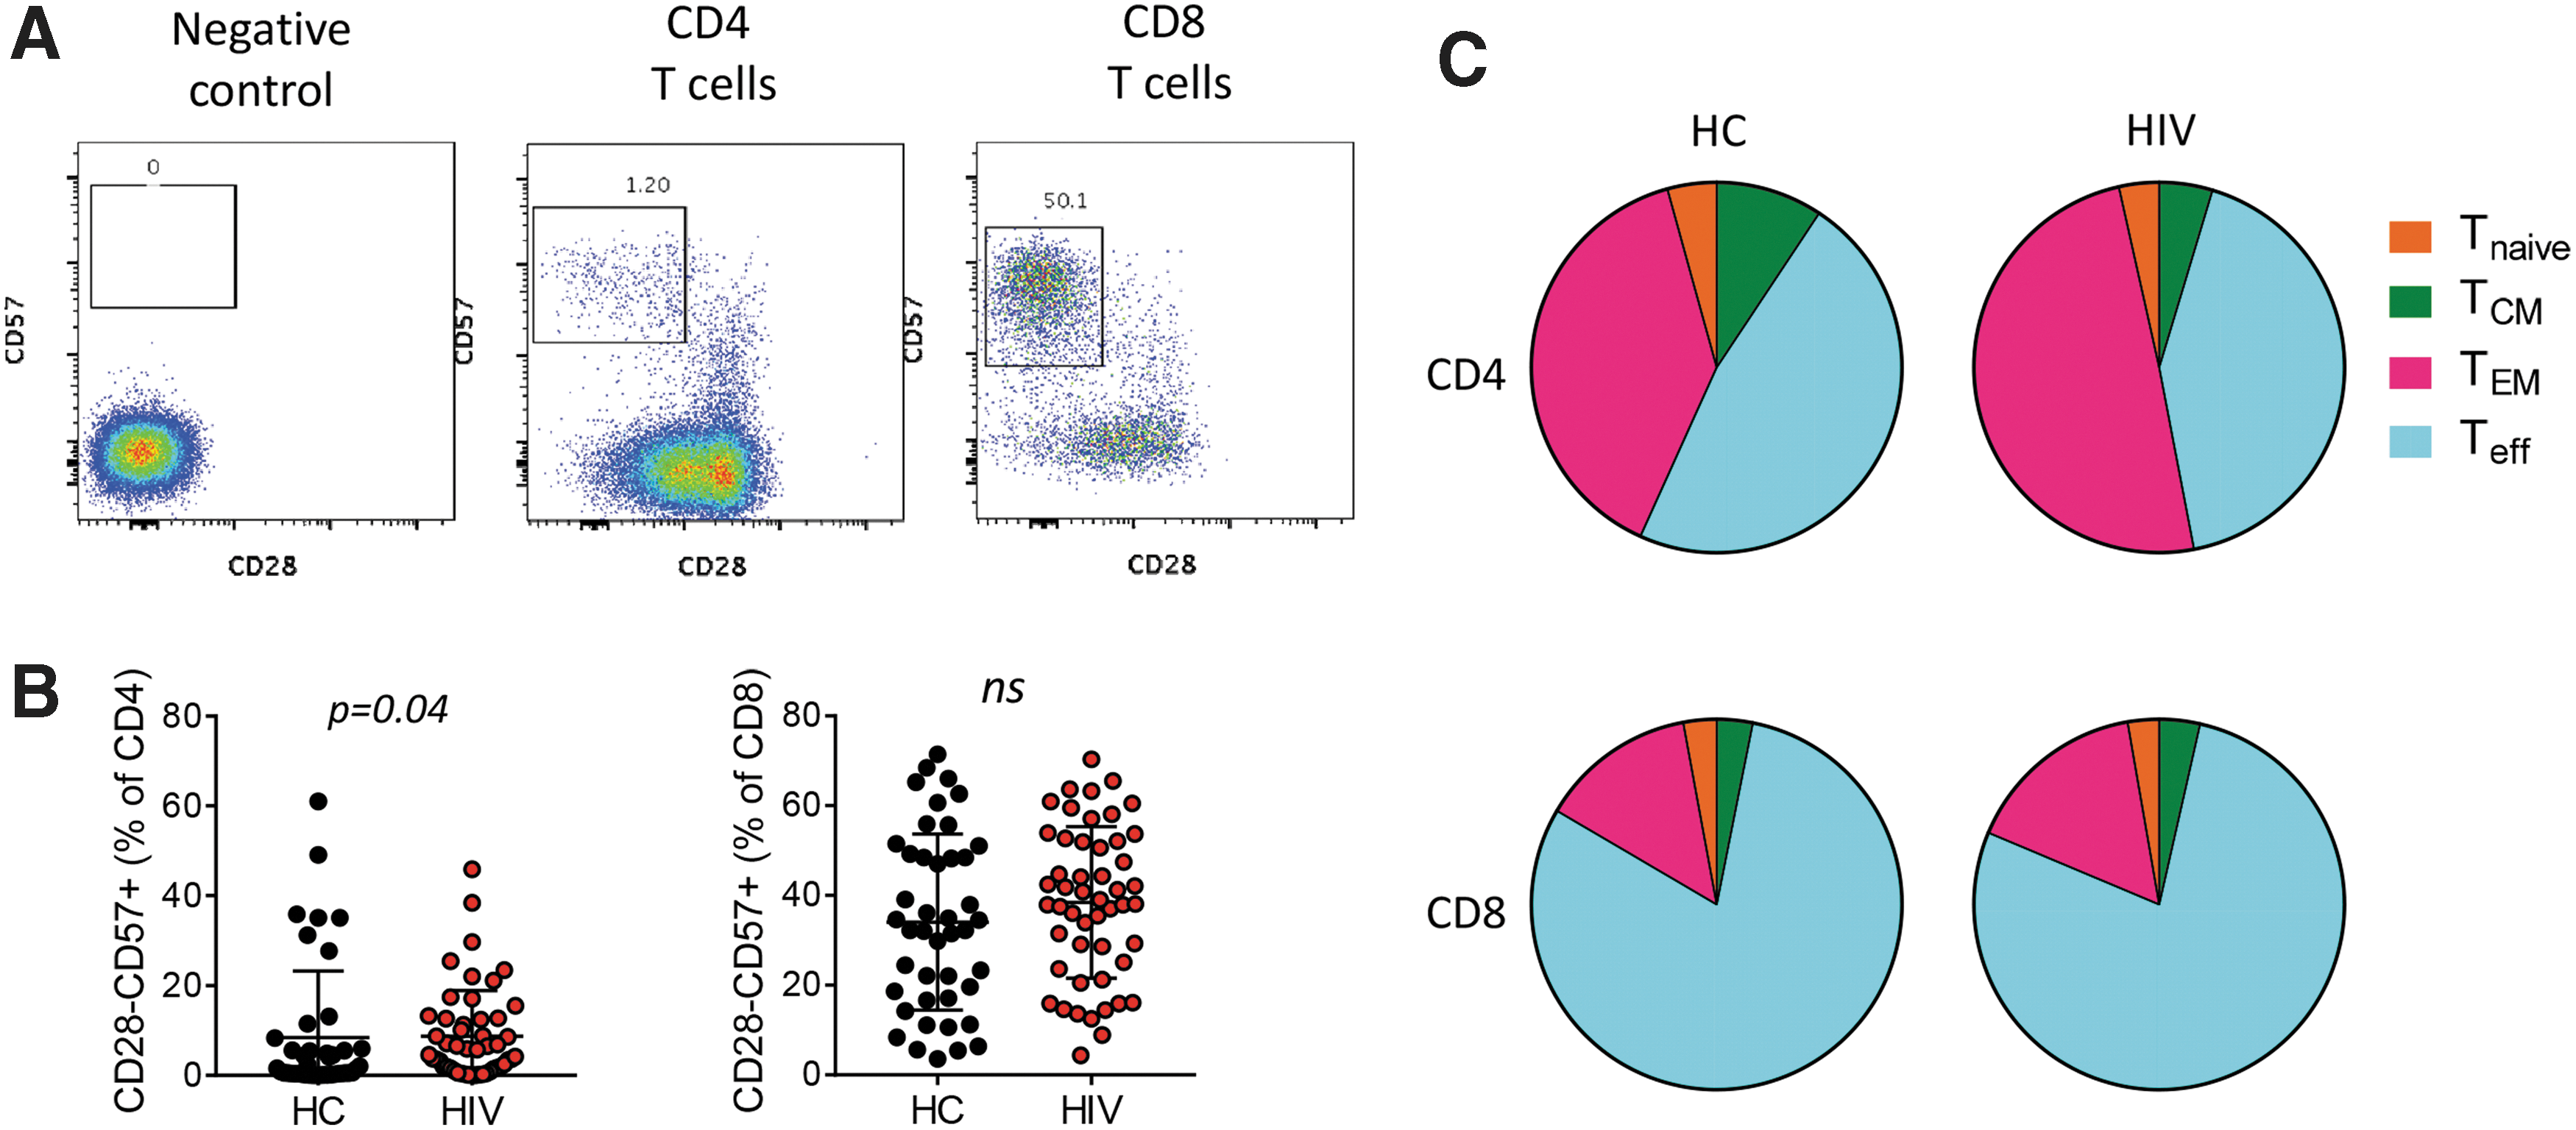
Markers of immune senescence.
Impact of baseline expression of ICMs on antigen-induced T cell function
Persistent expression of ICM is associated with T cell exhaustion during chronic viral infection; therefore, we hypothesized that higher expression of ICM would negatively impact antigen-induced cytokine production after stimulation. Influenza pH1N1/09 and SEB were used to assess T cell function in all participants, and Gag peptides for HIV-infected individuals only. Cytokines important for T cell function were measured in total CD4 and CD8 T cells, including IL-2, IL-17, IL-21, IFN-γ, and TNF (Supplementary Fig. S2). IL-2 and IFN-γ are classic Th1 cytokines that allow T cells to mount an immune response against intracellular viruses and bacteria. IL-17 and TNF are proinflammatory cytokines, and IL-21 plays a role in T follicular helper cell responses coordinating B cell differentiation and antibody production. Correlation analysis of frequencies of cytokine-producing cells was performed against baseline ICM expression and immune senescent cell frequencies. In CD8 T cells the frequency of CD28−CD57+ cells had a negative association with IL-2 production in both HC and HIV+ participants (Fig. 5A) consistent with the replicative senescent phenotype. 25 In HIV+ only, these cells also showed negative correlation with IFN-γ, IL-21, and TNF expressing cells indicating a deficiency in the production of all cytokines. 2B4 expression in CD8 T cells showed the same pattern of correlation as CD28−CD57+ cells. TIM3 expression on CD8 T cells from both HC and HIV+ showed a negative correlation with IL-21 and TNF production and no effect on IL-2 or IFN-γ.

Correlation analysis of ICM expression and antigen-induced cytokine production. Heatmaps showing the spearman correlation coefficient (r) for each comparison in the matrix grouped by cytokine: IL-2, IFNγ, IL-21, or TNF. Antigens used for stimulation of PBMC from HC participants in top two rows and HIV participants in bottom three rows.
In contrast to CD8 T cells, the immune senescent phenotype in CD4 T cells was not consistently associated with production of any cytokine, nor was 2B4 expression (Fig. 5B). Similar to CD8 T cells, TIM3 expression on CD4 T cells showed a negative correlation with IL-21 production but only in HIV+ participants. In contrast, TIM3+ CD4 T cell frequencies in HC showed a negative correlation with IFN-γ. No relationships were observed between immune senescent cell frequencies or ICM expression and IL-17 (not shown). PD1, TIGIT, and LAG3 also showed some association with cytokine production in this analysis, but it was always limited to either HC or HIV+ and usually not present for all stimulation conditions. LAG3 showed no association with cytokine production in CD8, whereas CD4 LAG3 expression was positively correlated with IL-21 production in HIV+ participants only.
Next, we determined whether ICM expression on T cells could be a biomarker for response to an in vivo immune stimulus, seasonal influenza vaccine. In HC, prevaccination TIM3 expression on CD4 T cells demonstrated a negative correlation with serum Ab titer responses to pH1N1/09 (r = −0.52, p = .0003) (Fig. 6A). In HIV+ participants, prevaccination 2B4 expression on CD8 T cells had a negative correlation with serum Ab responses (r = −0.41, p = .003) (Fig. 6B).
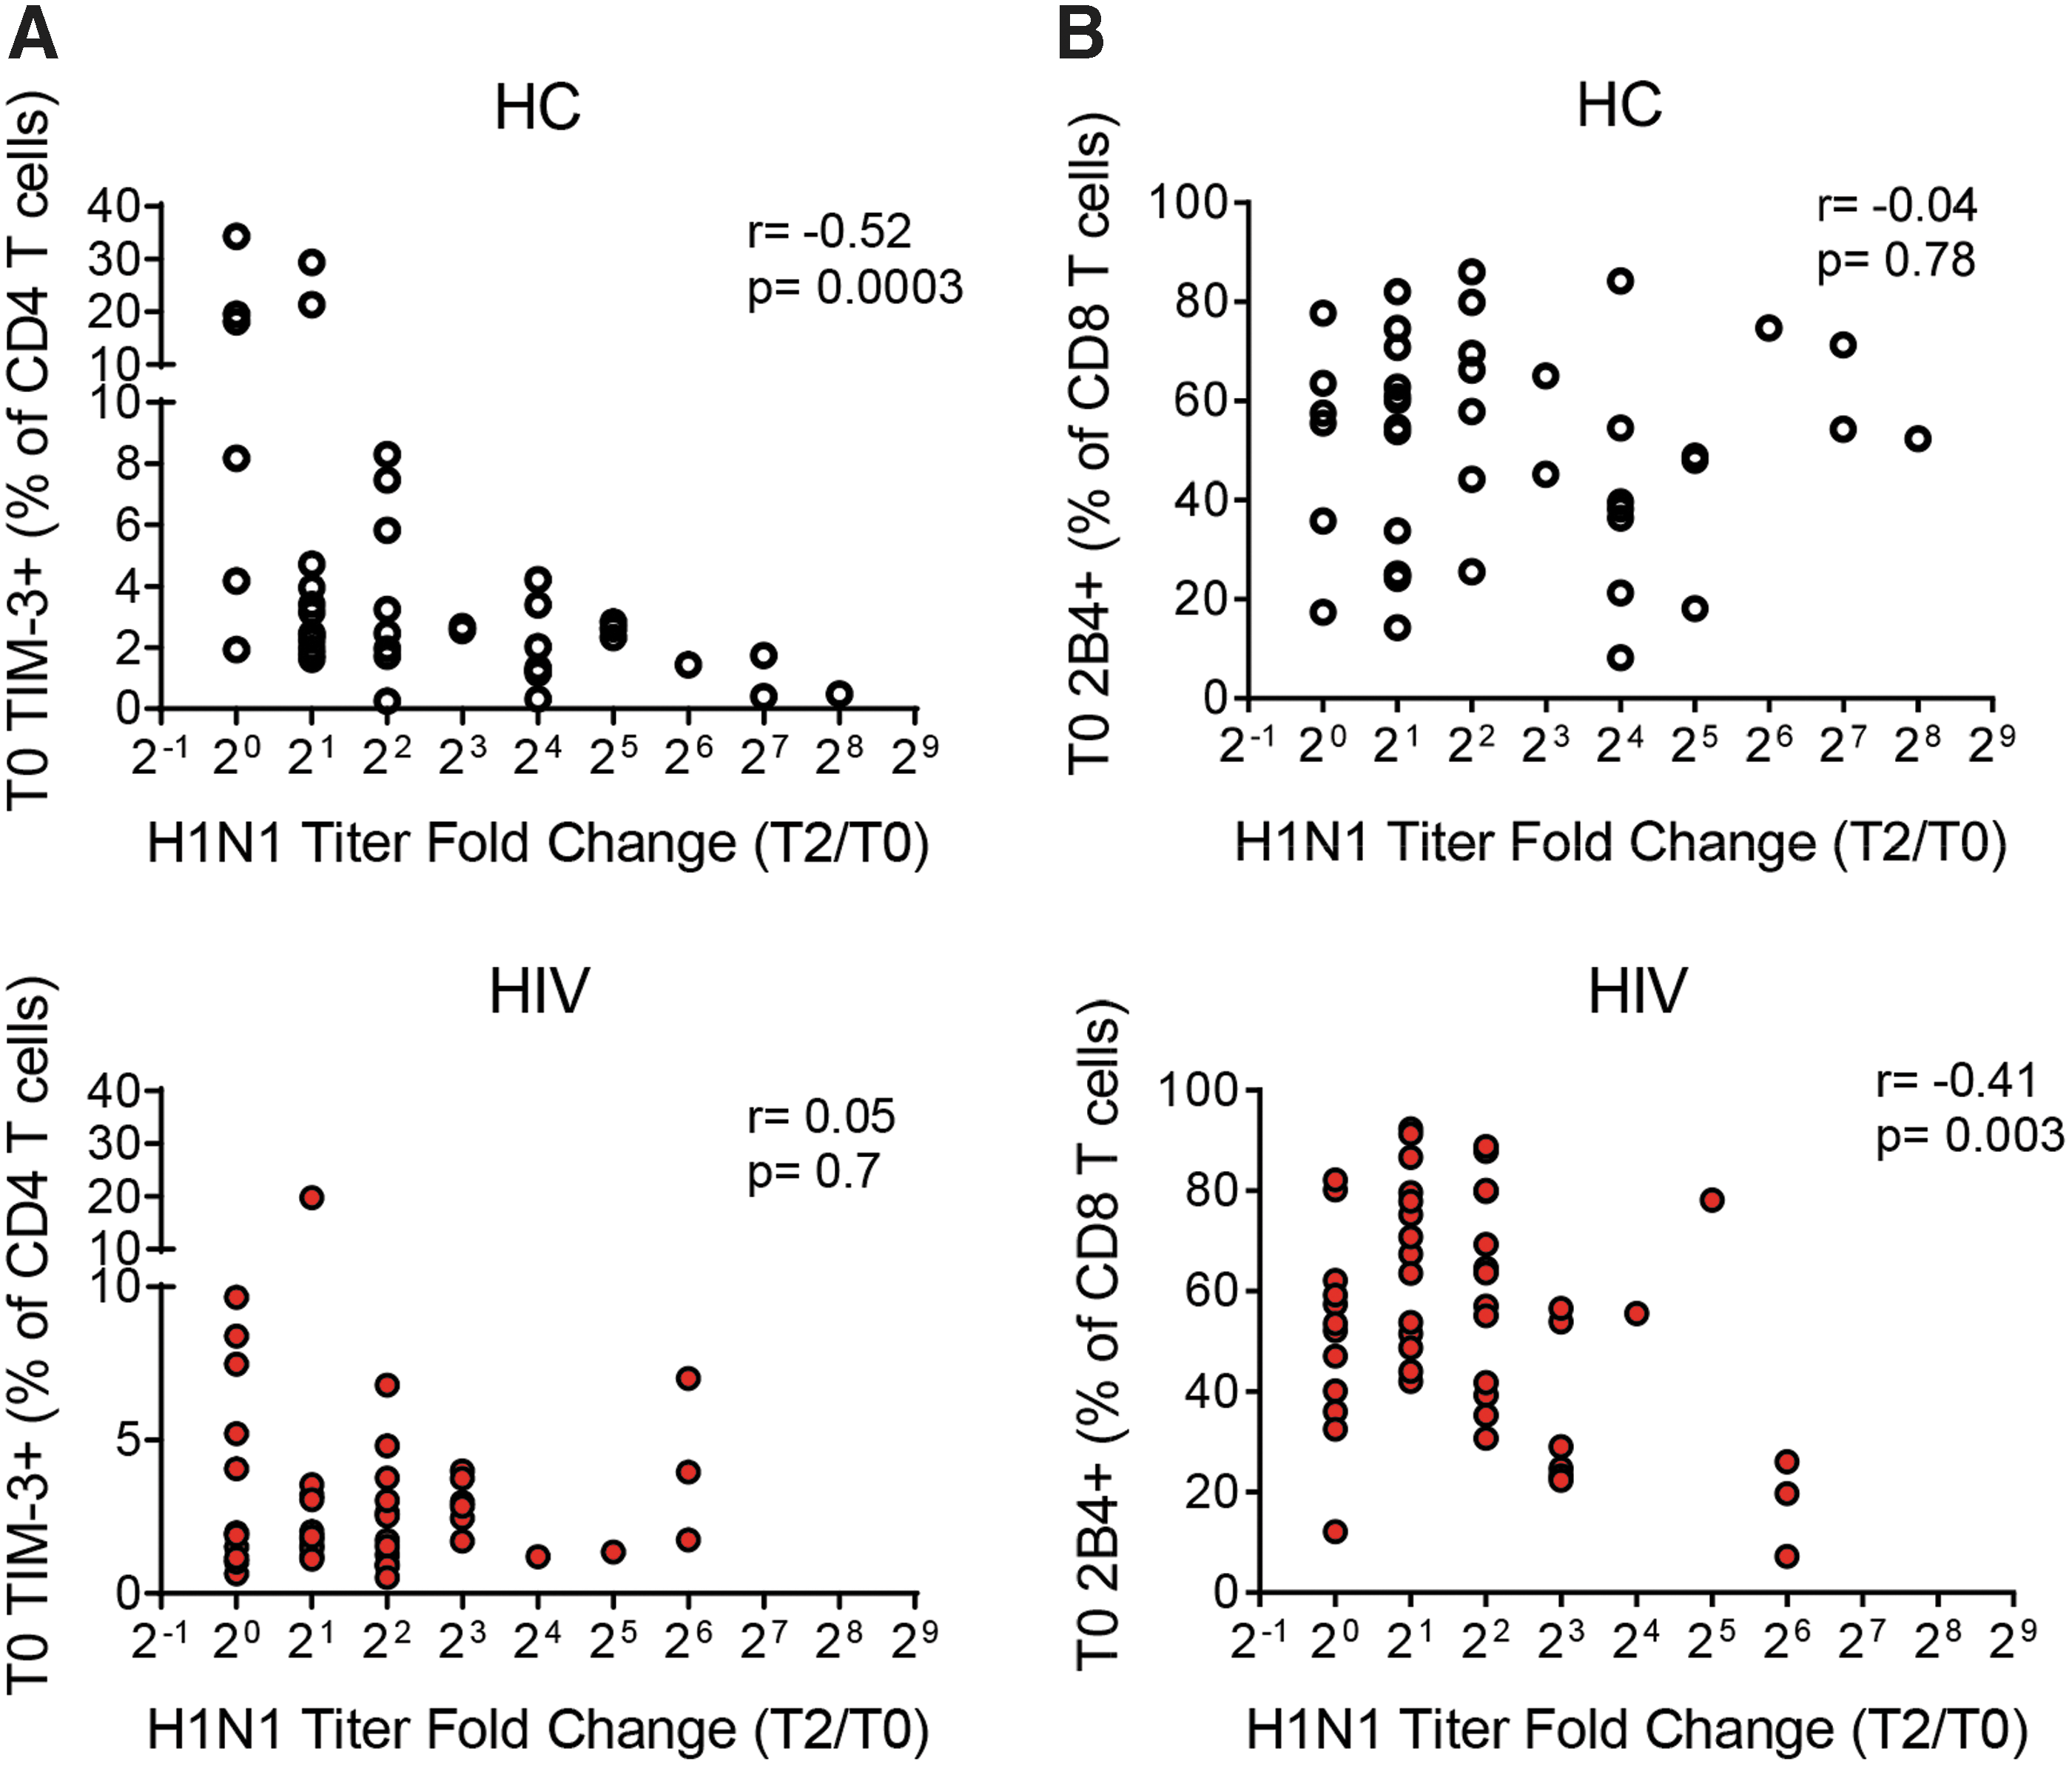
Correlation analysis of ICM expression and in vivo flu vaccine response. X–Y plots showing the correlation of ICM expression versus H1N1 titer fold change T2/T0 as a measure of response to the influenza vaccine.
Relationship between ICM expression and the HIV viral reservoir
Total HIV DNA measurements reflect HIV burden even in patients on antiretroviral therapy. Owing to the presence of defective (i.e., mutated and replication incompetent) viral genomes this measurement overestimates the size of the HIV reservoir; however, many groups have shown a positive association between HIV DNA measurements and other assessments of the persistent HIV reservoir (reviewed in 26 ). To assess the relationship between ICM expression and HIV reservoir, we performed correlations between cell frequencies and total HIV DNA measurements.
In CD4 T cells, we observed positive correlations between TIGIT+ TEM and TIM3+ Tnaive cells and HIV DNA and a negative correlation between LAG3+ TCM

Correlation analysis of ICM expression and total HIV DNA. X–Y plots showing the correlation of ICM expression versus total HIV DNA levels in PBMC.
To confirm the association of TIM3 with HIV reservoirs, we also measured plasma levels of TNF and LPS as soluble markers of inflammation and microbial translocation, respectively, which are higher in HIV+ individuals and correlate with disease progression. 27 TIM3 expression on CD4 and CD8 T cells exhibited significant positive correlations with both soluble markers in the HIV+ group (Table 3). In HC, the correlation between TIM3 and LPS was maintained, but the TNF association lost significance. Overall, these data point to TIM3 as a critical immune regulator and biomarker for immune dysfunction, in both HIV-negative and HIV-infected ART-suppressed individuals.
TIM-3 Expression Correlates with Soluble LPS and TNF Levels in Plasma
Discussion
ICMs are important regulators of the immune system. In response to acute infection or antigen recognition ICMs are upregulated and expressed on the cell surface as a mechanism to shut down T cell activation thereby preventing undesired consequences of chronic activation. Their expression on T cells has been implicated in dysfunctional immune responses against cancer and other chronic diseases, such as HIV infection. Long-term suppression of HIV with antiretroviral treatment leads to normalization of expression of ICM on T cells. 28 –32 The results provided from this study establish a resource for understanding the distribution of expression in T cells of five well-characterized ICMs in ART-treated HIV-infected adults and HIV-uninfected (and cancer-free) controls. ICM can perform redundant functions in the cell such that coexpression of multiple ICMs is related to the severity of T cell exhaustion. 33 In this study, we were more interested in performing monovariate analysis of ICM expression to determine impact of the various ICMs on T cell function, especially since the frequency of cells coexpressing multiple ICMs can be very small within CD4 and CD8 T cell subsets and the significance of these very rare cell types is not clear. Previous resource studies have compared different HIV-infected populations, namely untreated progressors and controllers 34 or have focused on ICM expression in the CD8 T cell compartment only. 30 The aim of this study was to understand ICM expression and its impact on T cell function to provide a foundation for using ICMs as biomarkers for immune function in people with reconstituted immune systems and in the context of aging. The two participant groups in the study were similar regarding normal variation of each ICM in T cell subsets as well as in the overall distribution. Some ICMs showed enormous donor:donor variation in terms of frequency of cells expressing a particular ICM (especially 2B4 and TIGIT on CD8 T cells). One source of variation for surface ICM expression was age; however, no ICM was consistently affected by age in CD4 and CD8 T cells, and in both HIV+ and negative individuals, suggesting that other factors drive expression of ICMs on the surface of T cells. Indeed, for ICM that showed an association with age in HC (TIGIT and TIM3 in CD4, and PD1 and LAG3 in CD8), the relationship was lost in HIV+ participants. Unexpectedly, some ICMs were reduced with age rather than increased, such as TIGIT and TIM3 further disproving our original hypothesis that ICM expression would tend to accumulate with increased age due to cumulative exposure to pathogens.
Our second hypothesis was that the level of ICM expression would be strongly related to functional capacity of the T cells. The strongest relationship that we observed was between frequencies of CD57+CD28− CD8 T cells (immune senescent) cells, 25,35 2B4+ CD8 T cells, and CD8+ IL-2 production after antigen stimulation. This relationship was present in HC and HIV+ participants and could be observed in all stimulation conditions (Fig. 5A). Interestingly, the relationship was completely absent in CD4 T cells highlighting the different patterns of surface marker expression in these two cell types. In HIV+ participants, the frequencies of CD57+CD28− cells and 2B4+ CD8 T cells showed significant negative associations with the other cytokines measured as well (IL-21, IFNγ, and TNF) and this was not observed in HC participants. This is the first report of a link between 2B4 expression and immune senescence in CD8 T cells and suggests that 2B4 expression on CD8 T cells from HIV-infected individuals may be a surrogate marker of immune senescence. This conclusion is further supported by the result showing that frequencies of CD8+2B4+ cells had a negative correlation with serological response to influenza vaccination in HIV-infected participants and no association in HC participants. 2B4 has been shown to exhibit dual functionality between costimulatory and coinhibitory activities in CD8 T cells and NK cells 36,37 and our results suggest that additional cofactors exist to exacerbate 2B4 coinhibitory functions in HIV-infected people, despite viral suppression by ART. Furthermore, immune senescence CD8 T cells have been shown to exert negative regulatory effects on immune function in vivo, 35 which may explain the correlation between a CD8 T cell-expressed marker and the influenza serological titer response, which is thought to be mediated through CD4 T cell help to B cells.
Another interesting finding from this study was the relationship between expression of TIM-3 and IL-21 production by both CD8 and CD4 T cells. IL-21 is thought to be mainly produced by CD4 T cells within lymph nodes and plays a critical role in germinal center reactions, inducing B cells to undergo differentiation and affinity maturation, 38 thus the role and contribution of IL-21 production by CD8 T cells is not clear. In all participants, TIM-3 expression on CD8 T cells was negatively associated with IL-21 and TNF production in response to H1N1 stimulation, and Gag stimulation in HIV+ participants only. In CD4 T cells, the effect of TIM-3 on IL-21 production was only observed in HIV+ participants. We have previously shown that IL-21 production for peripheral Tfh cells (CXCR5+ CD4+ TCM) can be used as a postvaccination correlate for the flu vaccine responses 22,39 and in a highly sensitive RT-PCR assay we also showed that IL-21 gene induction in response to in vitro stimulation with flu antigen can be a predictive biomarker for response to flu vaccination. 40 Of all the parameters in this study, only CD4+TIM-3+ T cell frequencies were negatively associated with the serological response to flu vaccination in the HC group suggesting that TIM-3 may be an indicator of downstream IL-21 producing potential. TIM-3 expression on CD4 and CD8 has been implicated in regulating Th1 responses through inhibition of IFN-γ production. 41,42 Along these lines, we observed a relationship between TIM-3 expression and IFN-γ production in the CD4 T cell analysis although in a limited capacity with SEB stimulation condition and in the HC group only. However, in human naive CD4 T cells stimulated in vitro under Th1 conditions, TIM-3 was strongly upregulated on primarily IFN-γ producing cells. 43 Thus, it is not yet clear what the role of TIM-3 expression is on resting cells isolated from peripheral blood.
We did not expect to find evidence of ICM expression in naive cells due to the nature of the proposed immunoregulatory effects of ICM being inducible after T cell activation as a mechanism of controlling the response. However, our assessment of TIM-3 and LAG-3 distribution on T cells subsets challenged this notion with the majority of expression within naive and central memory subsets, thought to be resting or quiescent compared with effector and effector memory subsets. Importantly the pattern of distribution was not altered in the presence of HIV infection, so it could not be explained as aberrant expression in the face of chronic viral infection. Frequencies of TIM-3+ cells showed positive correlations with HIV DNA measurements when expressed in total CD8 or naive CD4. Although total HIV DNA measurements are imperfect with respect to understanding the replication-competent or “intact” HIV reservoir 44 they do correlate with a number of immunopathophysiological parameters that make it a viable measurement to consider. 45 Total HIV DNA has been shown to directly relate to pre-ART plasma HIV RNA levels, and this parameter correlates with time of ART initiation with lower HIV DNA being associated with earlier ART initiation. 46 HIV DNA measurements, therefore, are related to the maximum burden of HIV that a participant has experienced whether it be due to pathogenic fitness of the viral variant or length of time exposed to uncontrolled viral replication. In this respect, TIM-3 expression may represent a unique marker of immune dysfunction related to prolonged exposure to viral antigens in HIV-infected participants. Other studies have established a link between ICM expression and integrated HIV DNA levels, with PD-1, TIGIT, and LAG3 expressed on CD4 T cells showing a strong relationship with HIV reservoirs. 19 We did not find a significant relationship with PD-1 expression and HIV DNA levels in our participants, but this could be due to the use of total HIV DNA as a measurement rather than integrated HIV DNA.
Taken altogether, our study shows that the use of ICMs as biomarkers for immune function in the context of aging in HIV-negative individuals as well as those living with chronic virally suppressed HIV infection is not straightforward, and much research is still needed to understand the roles of ICMs in T cell biology in the absence of cancer and viral infection (untreated).
Footnotes
Acknowledgments
We thank all the study participants for their time and cooperation and the following clinicians for patient recruitment: Margaret Fischl, Gordon Dickinson, Allan Rodriguez, and Maria Alcaide. We also thank Margaret Roach, Maria Pallin, Celeste Sanchez, Sidney Lane, and Shelly Saini for technical assistance in this study; and Louis Gonzalez, Katherine Klose, Valeria Boter, and the Clinical Research Center at University of Miami Hospital for assistance in recruiting and managing study participants.
Author Disclosure Statement
The authors have declared that no conflict of interest exists.
Funding Information
This study was supported by a National Institutes of Allergy and Infectious Diseases grant awarded to S.P (RO1AI108472) and made possible through support for the Miami Center for AIDS Research (CFAR) at the University of Miami Miller School of Medicine funded by a grant (P30AI073961) from the National Institutes of Health (NIH), which is supported by the following NIH Co-Funding and Participating Institutes and Centers: NIAID, NCI, NICHD, NHLBI, NIDA, NIMH, NIA, NIDDK, NIGMS, FIC, and OAR. The content is solely the responsibility of the authors and does not necessarily represent the official views of the National Institutes of Health.
Supplementary Material
Supplementary Figure S1
Supplementary Figure S2
References
Supplementary Material
Please find the following supplemental material available below.
For Open Access articles published under a Creative Commons License, all supplemental material carries the same license as the article it is associated with.
For non-Open Access articles published, all supplemental material carries a non-exclusive license, and permission requests for re-use of supplemental material or any part of supplemental material shall be sent directly to the copyright owner as specified in the copyright notice associated with the article.