
Abstract
The Rakai Community Cohort Study in south central Uganda has surveyed people aged 15–49 since 1994. Antiretroviral therapy (ART) was introduced in 2004. HIV p24 and gp41 subtype distribution and viral diversity were studied from blood samples collected at three surveys in 1994–1995, 2002–2003, and 2008–2009, which were compared with a new survey round from 2011 to 2012. These included 1364 HIV+ individuals. For both p24 and gp41 domains, the genetic diversity within subtypes A and D was significantly increasing in the pre-ART era and decreased between the last two survey rounds in the ART era (p < .01). This study suggests that despite ongoing mixing of viral subtypes, an association with the introduction of ART to a reduction of intra-subtype viral genomic diversity may be occurring, which can be explored in ongoing studies.
Sequence Note
The Rakai Community Cohort Study (RCCS) is a prospective open, population-based cohort of people 15–49 years, based in southwest Uganda. 1 The Rakai District, which has a population of more than 500,000, is mostly rural with dispersed trading centers. Six of eleven communities clusters have been continuously followed since 1994. Study participants provide written informed consent at all visits and provide blood samples for HIV testing. The study was reviewed and approved by the Ugandan Virus Research Institute, Scientific Research and Ethics Committee, Protocol GC/127/18/12/137; the Ugandan National Council of Science and Technology Uganda National Council of Science and Technology: HS 540; and the Western Institutional Review Board, Protocol 20031318.
Antiretroviral therapy (ART) became available in 2004 funded by the “President's Emergency Plan for AIDS Relief” (PEPFAR). Initially, treatment priority was given to those with CD4 counts <250 cells/uL. This cutoff was increased to <350 cells/uL in February of 2011, and <500 cells/uL in February of 2014. The ART coverage has steadily increased each year, and since December of 2016 ART was offered to all HIV-infected individuals. 1
One focus of the RCCS has been studies on the impact of HIV-1 subtype on transmission and pathogenesis. In transmission studies, it was found that initially uninfected individuals in HIV-discordant couples whose partners were infected with subtype A were twice as likely to acquire HIV than those whose partners were infected with subtype D. 2 Also, subtype D was more pathogenic than subtype A, 3,4 and this pathogenic effect was independent of set-point viral load. 5 In combination, these studies suggested that changes in subtype distribution in the Rakai would occur over time with the frequency of subtype A increasing and subtype D decreasing. Over three survey rounds (1994–19956; 2002–2003 7 ; 2008–2009 8 ), we have reported that HIV-1 subtype D was initially the most prevalent subtype, 6 with its prevalence decreasing over time and a corresponding increase in subtype A infections and recombinant strains. 9
In the three survey rounds of study participants who have already been examined, the same protocol was used to generate sequence data from p24 (HXB2: 1243–1697) and gp41 (HXB2: 7857–8246). 10 In the new study round (2011–2012), we used a universal amplification approach combined with next-generation sequencing to amplify near full-length genomes. 11 To compare sequences among all time points, the gene fragments from p24 and gp41 were extracted from the new data by using the HIVbase protein identification tool (n = 226) 12 and aligned by using Geneious ver. 9.1.6. New sequence data were deposited in Genbank (MT058880-MT060287). These data were compared with data generated for the same surveyed community clusters from the previous survey rounds (1994–1995, n = 4056; 2002–2003, n = 2957; 2008–2009, n = 5668).
Four community clusters (#1, #2, #5, and #9) are located along the Masaka road, a main highway to Tanzania, and two community clusters (#8 and #9) are in more rural locations (Fig. 1). A total of 1,473 sequences from 1,364 subjects were evaluated (Supplementary Table S1). Sequences from p24 and gp41 were independently subtyped by using COMET. 13 Sequences with undefined subtypes were further assessed with the BioAfrica HIV Subtyping tool 14 and, if necessary, by manually assessing a maximum likelihood phylogenetic tree generated with PhyML. The percentage of subtypes A, C, D and those with discordant subtypes in p24 and gp41 (i.e., recombinants) in each region were calculated and are shown in each of the four survey rounds for each of the six communities as pie charts (Fig. 1). By far, the most common subtypes were D, A, C, and recombinants of A and D.
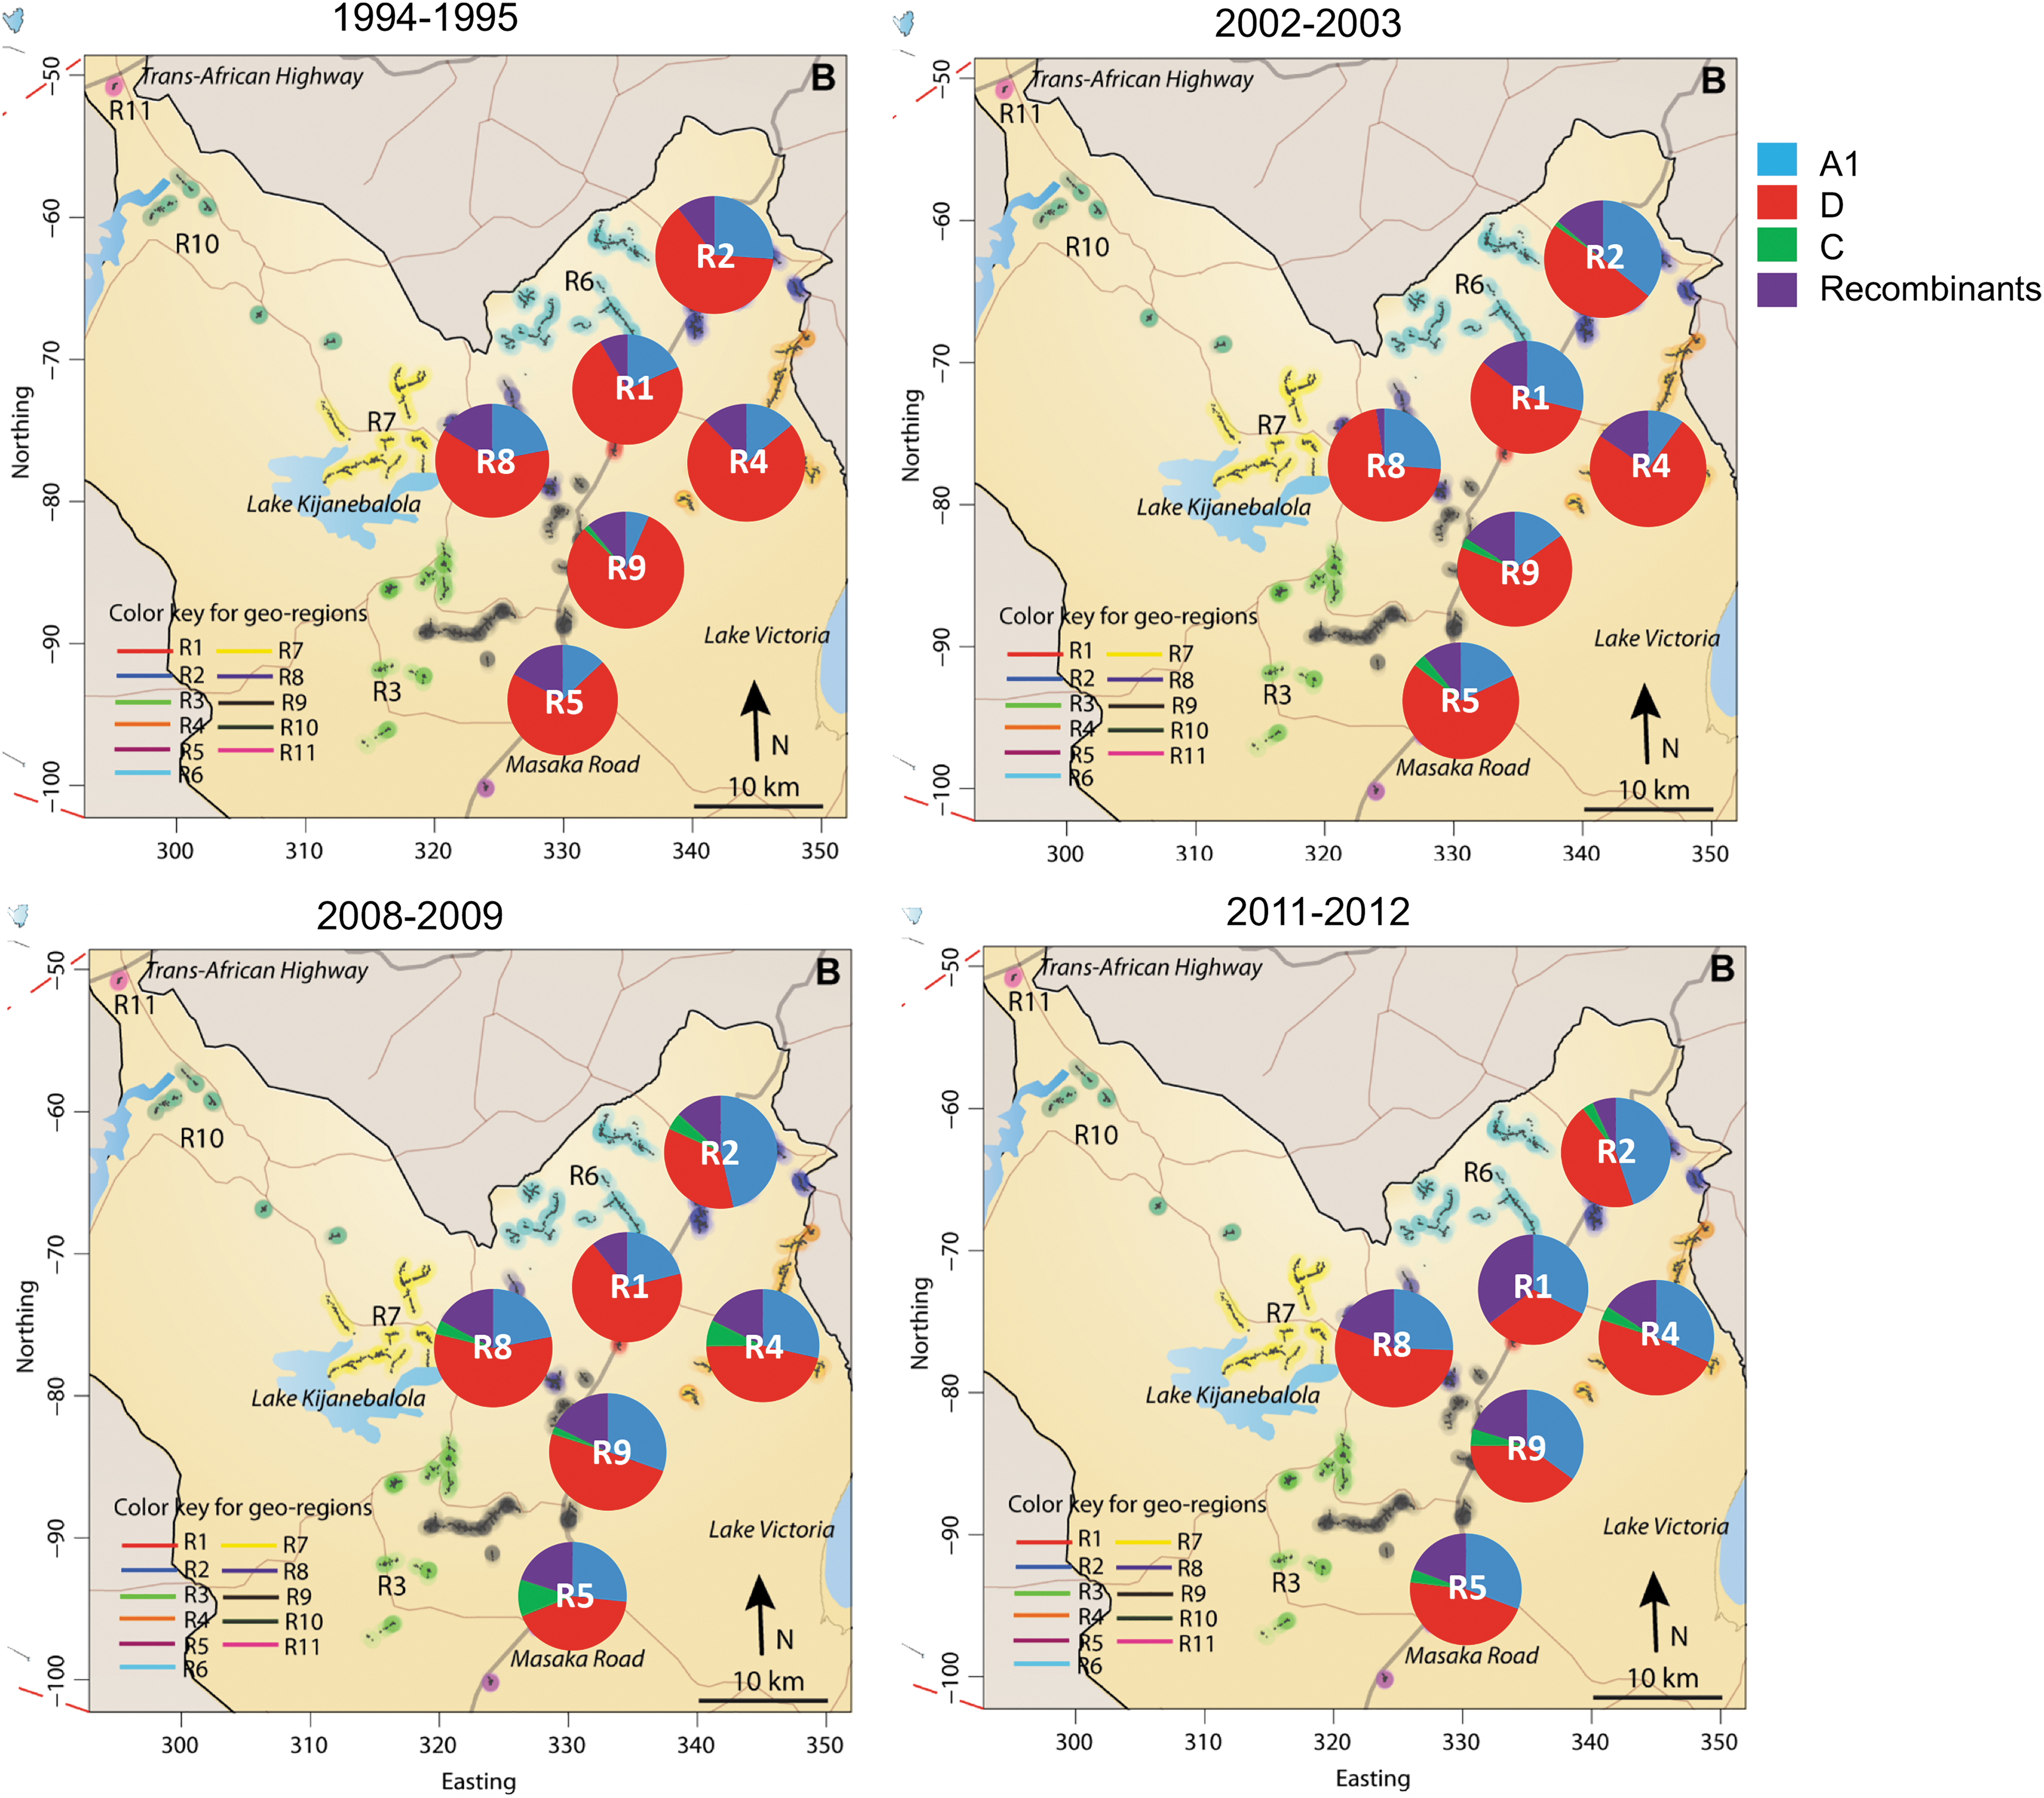
Percent subtypes in regions over time in the Rakai District, Uganda. The 11 geographic regions originally determined in 1994 are indicated by different colors. Of the four major RCCS sequencing time points, HIV-1 p24 and gp41 sequences generated from regions 1, 2, 4, 5, 8, and 9 (circled) largely overlapped and are the focus of this study. The major Masaka road connects regions 1, 2, 5, and 9, whereas regions 4 and 8 are connected via smaller secondary roads. Collection time periods are shown above each map. Percent of subtypes by region is shown as pie charts superimposed on the map and is colored according to the figure legend. RCCS, Rakai Community Cohort Study. Color images are available online.
In the earliest survey round, the majority of sequences from all six communities were subtype D (63%–80%), followed by subtype A (7%–24%). In the 2002–2003 survey, subtype D was still the majority in all communities (51%–75%), with subtype A increasing in most regions (10%–34%). However, by 2008–2009, subtype D (35%–55%) was the majority subtype in only two of the six communities (#1 and #8) with a further rise in subtype A (25%–37%). In 2011–2012, subtype D was no longer dominant in any community (34%–45%) and subtype A remained at about the same levels as the previous survey (28%–37%). Taken all together, over an 18-year time frame, the proportion of subtype D infection decreased from an average of 71% to 40%, whereas subtype A increased from an average of 21% to 31% in the six communities.
The number of recombinants were more variable over time, with no increases between survey 1994–1995 and 2002–2003 (12% in each survey) but an overall increase from 1994–1995 to 2011–2012 (12%–19%). Subtype C remains a minor infecting subtype, demonstrating a small increase from the earliest time point to the last (0.3%–2.4%).
We calculated the rates of subtype change over time for each community (R 2 , slope, p-values) in Tableau Software (ver. 10.1.11) (Table 1). Statistically significant decreases in subtype D were observed in communities #2 and #9. There was also a significant increase in subtype A observed in all communities on the Masaka Road connecting Uganda to Tanzania (Communities #1, #2, #5 and #9), suggesting a role for mobility with subtype distribution in Rakai District. Infections with recombinant viruses were significantly increased in communities #4 and #9. Again, subtype C infections showed no statistically significant trend over the survey rounds. Another explanation for reduced presence of subtype D infections is faster disease progression and CD4 decline, leading to earlier initiation of ART treatment compared with subtype A.
Rates of Change of Regional Subtypes and Associated Statistics
Significant changes in subtypes are in bold.
We also assessed specific structural mosaic forms in the population (Supplementary Table S2) (e.g., subtype D-p24/subtype A-gp41 vs. subtype A-p24/subtype D-gp41). At the first survey round, these structures were nearly equally represented in the population of recombinant sequences (subtype D-p24/subtype A-gp41 = 47%; subtype A-p24/subtype D-gp41 = 45%). The DA subtype infections remained at about the same frequency (41%–57%) over time; however, the AD subtype infections have consistently declined. Recombinants containing subtype C were typically different combinations of C and D, rarely C and A, and increased between 1994–1995 and 2002–2003 (8%–21% of the recombinant viral population), but they then remained relatively stable through 2008–2009 and 20011–2012 (17%–16% of the recombinant population).
Next, we examined the intra-subtype diversity within the four sequencing time periods in p24 and gp41 (Fig. 2). Pairwise genetic distance (number of nucleotide substitutions/site) of sequences were calculated for each genomic region at each time period by using the TN93 distance model. The Mann–Whitney statistical test using MacWizard (ver. 1.9.22), adjusted for 24 comparisons, was used to assess for differences in viral diversity over time. Between 1994–1995 and 2002–2003, the p24 domain demonstrated a significant increase in subtype A and D diversity of 1.1% and 1.3% respectively (p < .0001). This trend increased again between the 2002–2003 and 2008–2009 with a 1.4% and 1.1% increase in diversity; however, by 2011–2012, the diversity significantly decreased in subtype A (−0.3%, p < .0001) and a slight increase in diversity occurred in subtype D (0.2%, p < .001).

Genetic distances within p24 and gp41 subtype A and D populations at each time period.
For the gp41 region for both subtype A and subtype D, there was a significant increase in diversity between the first and second time periods (1.4% and 2.0%, respectively, p < .0001). Between the second and third time points, an increase in diversity was reduced by half (0.6%, 1.0%, respectively, p < .0001). Between the third and fourth time points, subtype A diversity was again significantly reduced (−1.2%, p < .0001) and subtype D diversity showed the most dramatic and significant change (−2.4%, p < .0001).
ART is known to select for resistance-based genetic mutations in the major HIV genes that it targets (e.g., protease and integrase); however, to our knowledge, this is the first report of ART potentially impacting the diversity of other HIV genes at a population level. Additional sampling will be instrumental in determining whether this effect is actual, or whether it may be related to the updated sequencing approaches used to generate the 2011–2012 data, or some other temporal changes in the population (e.g., male circumcision, education, increased migration, etc.). We propose two major hypotheses for an ART-associated reduction in viral population diversity. First, that ART reduced the number of overall infectious transmitters, thereby reducing the viral pool. Second, ART reduced the number of long-term infected individuals with a detectable viral load, which could reduce the number of transmissions from individuals with increased within-host viral diversity associated with long-term infection. 15 If this is true, then an ART-induced population level decrease in viral diversity could potentially facilitate vaccine development, that is, currently complicated by the highly mutable nature of the HIV genome.
Footnotes
Acknowledgments
The authors want to thank the participants and staff of the Rakai Community Cohort Study and the Rakai Health Sciences Program for their participation and contribution to this analysis. They also want to thank the members of the PANGEA-HIV steering committee for assistance.
Author Disclosure Statement
SLL, RR, SC, CWR work for BioInfoExperts LLC. All other authors declare no conflicts of interest.
Funding Information
Financial support was provided by the Division of Intramural Research, National Institute of Allergy and Infectious Diseases (NIAID). In addition, this study was supported by the following grants: R01AI110324, U01AI100031, R01AI110324, R01AI102939, NIAID; K23MH086338, R01MH107275, National Institute of Mental Health; R01HD070769, R01HD050180, National Institute of Child Health and Development; 22006.02, OPP1084362, the Bill & Melinda Gates Foundation; P30AI094189, Johns Hopkins University Center for AIDS Research; and Advanced Grant PBDR-339251, European Research Council.
Supplementary Material
Supplementary Table S1
Supplementary Table S2
References
Supplementary Material
Please find the following supplemental material available below.
For Open Access articles published under a Creative Commons License, all supplemental material carries the same license as the article it is associated with.
For non-Open Access articles published, all supplemental material carries a non-exclusive license, and permission requests for re-use of supplemental material or any part of supplemental material shall be sent directly to the copyright owner as specified in the copyright notice associated with the article.