
Abstract
Tenofovir diphosphate (TFV-DP) concentrations measured with dried blood spots (DBS) can be used to classify adherence to emtricitabine/tenofovir disoproxil fumarate (F/TDF) for HIV pre-exposure prophylaxis (PrEP). A TFV-DP of 700 fmol/punch was previously associated with high PrEP efficacy, and was estimated to represent ≥4 doses/week on average. However, interindividual variability in TFV-DP concentrations may lead to adherence misclassification and decrease the precision of adherence–efficacy relationships. The purpose of this analysis was to evaluate sources of TFV-DP variability to improve the precision of TFV-DP for adherence assessments by incorporating individual characteristics. Data and samples from a 36-week study of TFV-DP in DBS, collected biweekly, among 48 HIV-negative volunteers (25 Females/26 Caucasian/10 African American/14 Hispanic) receiving F/TDF at 33%, 67%, and 100% of daily dosing under directly observed therapy were used for analysis. The simplest pharmacokinetic model to describe TFV-DP accumulation with acceptable performance was a one-compartment constant input model. Covariates, including laboratory values and demographics were ranked in importance of their association with post hoc pharmacokinetic (PK) parameters using random forest analyses. Weight and platelet count were included in the final model and simulations were conducted to generate benchmarks for <2, 2–3, 4–5, and 6–7 doses/week. Based on these simulations, the previously established protective TFV-DP concentration of ≥700 fmol/punch was observed in those taking 2–3 (in individuals ≤110 kg) and ≥4 (in individuals >110 kg) doses/week, amounting to a much lower rate of misspecification (17% vs. 30%) with this individualized model versus previous interpretations. Incorporating body weight and platelet count improved the precision of TFV-DP concentrations for adherence assessments. Previous benchmarks were conservative, indicating that the pharmacological forgiveness of F/TDF may be higher than currently recognized and supports continued investigation of intermittent PrEP dosing regimens.
Clinical Trial Registration number, NCT02022657.
Introduction
Adherence to a prescribed medication regimen is an important consideration in both clinical trial conduct and real-world treatment plans. Inadequate adherence by clinical trial participants, such as medication discontinuation after randomization or variable ingestion throughout the study, can compromise the results of the trial and lead to inaccurate conclusions and wasted costs. 1 It has also been estimated that 33%–69% of all medication-related hospital admissions are due to poor treatment adherence, costing at least $100 billion each year. 2,3 Collecting adherence information from participants through the use of self-report or more objective measures of drug ingestion is now a routine part of both clinical trials and clinical care. 4 In the HIV treatment field, higher adherence to antiretroviral therapy has been shown to be associated with increased rates of viral suppression in people living with HIV, as assessed by pharmacy refill records and objective assessments of drug concentrations. 5,6 In the HIV pre-exposure prophylaxis (PrEP) field, adherence and adherence assessments have had particularly high impact. 7
The use of daily oral emtricitabine plus tenofovir disoproxil fumarate (F/TDF, Truvada®) has demonstrated a significant reduction in the risk of HIV acquisition, leading to the drug's approval for HIV PrEP in 2012. 8,9 Nevertheless, two trials evaluating the efficacy of F/TDF for PrEP in women did not show similar risk reductions, leading to the trials' discontinuation. 10,11 Subsequent analyses revealed low adherence rates among these women, as assessed by the low proportion of individuals with detectable plasma tenofovir concentrations in the active arm. 12 In addition, in the preexposure prophylaxis initiative (iPrEx) trial in men who have sex with men (MSM), 9 the rate of HIV risk reduction rose from 44% to 92% in individuals with detectable plasma or cellular concentrations of F/TDF. Dosing compliance to F/TDF is therefore a critical determinant of the efficacy of PrEP, and objective and precise analysis methods that incorporate individual characteristics to quantify adherence more precisely are needed.
Tenofovir-diphosphate (TFV-DP), the intracellular anabolite of tenofovir, exhibits a half-life of ∼17 days in red blood cells. 13 This long half-life and the resulting 25-fold accumulation from first dose to steady state allow for an objective estimate of cumulative adherence over the preceding 1–2 months. The DOT-DBS study evaluated the pharmacokinetics and dose proportionality of TFV-DP after directly observed dosing of F/TDF, and established adherence gradients (<2, 2–3, 4–6, 7 doses/week on average) based on TFV-DP concentrations. 14 When applied to a clinical cohort, TFV-DP concentrations greater than 700 fmol/punch, corresponding to four or more doses/week, were associated with 100% (86%–100%) HIV risk reduction. 15 Thus, these adherence measures were important for interpreting trial outcomes and estimating adherence–efficacy for PrEP in MSM. In the future, these adherence measures may be useful in the clinic setting, particularly if testing can be done at the point of care, where nonadherence could be addressed in real-time at the bedside. 16
Current adherence thresholds were based on 25th percentile cutoffs. However, a 30% coefficient of variation (CV) was observed for TFV-DP concentrations, which can lead to misclassification of adherence interpretations, decrease the precision of individual assessments, and adherence–efficacy relationships, and over- or underestimate the true adherence thresholds of each dosing classification. As clinical implementation evolves, precise adherence estimates will become more important. To address these gaps, this analysis aimed to improve the precision of current TFV-DP dried blood spot (DBS) adherence thresholds through the development of tailored TFV-DP concentration benchmarks corresponding to categorical adherence interpretations (doses/week). Emphasis was placed on clinical utility and as such, covariate screening was only conducted on routinely collected variables.
Methods
Study design
This study was a subanalysis of a previously published prospective, pharmacokinetic, crossover study of F/TDF (NCT02022657). 14 The purpose of the present analysis was to develop a pharmacokinetic model of TFV-DP disposition and subsequently identify significant covariates influencing TFV-DP concentrations for more precise adherence interpretations. Inclusion criteria restricted the study population to individuals between 18 and 50 years, without HIV and able to comply with study-specific procedures, including directly observed dosing. Exclusion criteria included an HIV+ or HBV+ test, estimated glomerular filtration rate (eGFR) <60 mL/min (modification of diet in renal disease equation [MDRD]), and medical diagnoses that alter red blood cell kinetics. IRB approval was obtained, and all participants provided informed consent before enrolling into the study.
F/TDF dosing in this study followed either an intermittent or holiday dosing pattern. Each dosing pattern was 33%, 67%, or 100% of daily dosing. Specifically, 33% intermittent dosing entailed 1 day on drug, 2 days off drug; and 67% dosing entailed 2 days on drug, 1 day off drug, repeated for 12 weeks. Thirty-three percent holiday dosing entailed daily dosing for 1 week followed by 2 weeks off drug, repeated for 12 weeks, and 67% holiday dosing entailed daily dosing for 2 weeks followed by 1 week off drug, repeated for 12 weeks. Each participant was randomized to two of five dosing regimens of 200/300 mg of F/TDF for 12 weeks each, separated by a 12-week washout (off drug) period (Fig. 1).
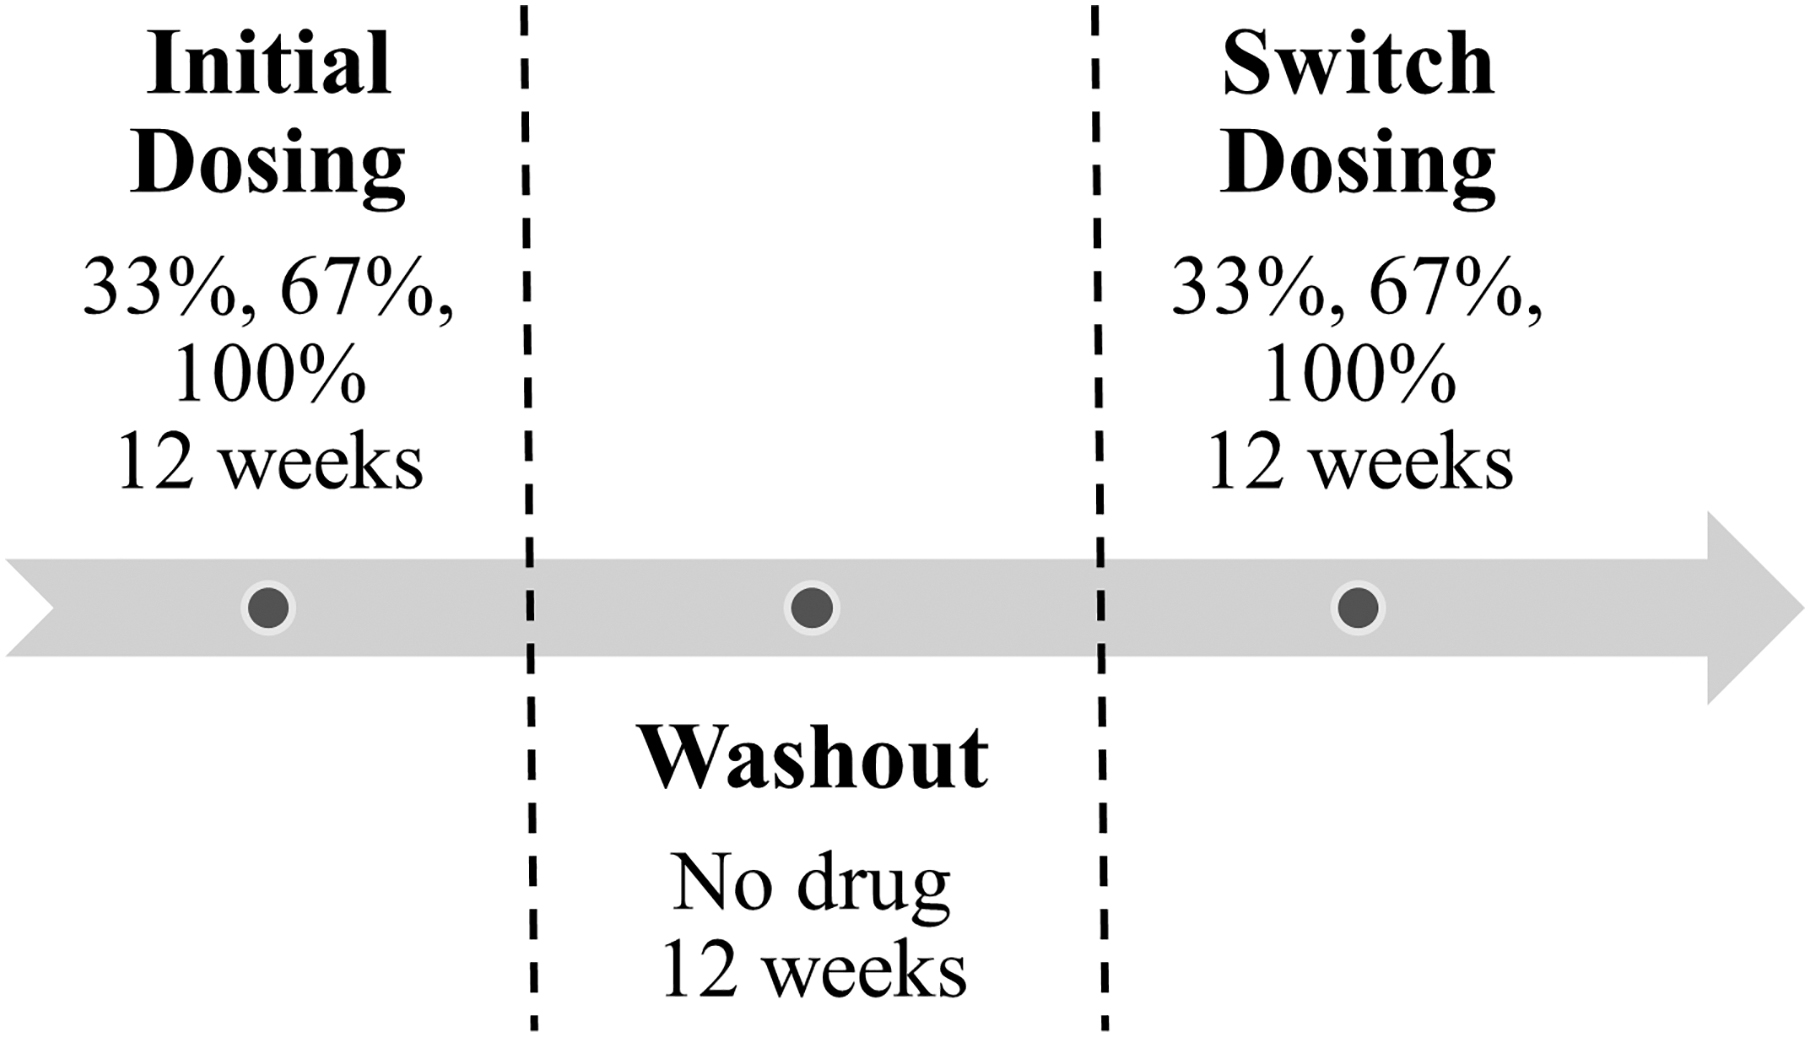
DOT-DBS study dosing schema.
Pharmacokinetic sampling
Blood was collected for plasma and DBS analysis at baseline and approximately every 2 weeks afterward while on study drug, and every 3 weeks during the washout period. Samples were collected by convenience without regard to the time or day since the last dose. Because of convenience sampling, there were few samples between 2 and 12 h postdose. To better characterize the absorption and disposition phases of plasma tenofovir concentrations, data from a separate single-dose, intensive pharmacokinetic (PK) study of 200/300 mg F/TDF conducted in twenty-four individuals were included in the plasma tenofovir model. 17 Dosing was on an empty stomach, and blood sampling occurred at 0.25, 0.5, 1, 2, 4, 6, 10, 24, 48, and 72 h postdose. Baseline characteristics of these twenty-four healthy adult volunteers included 11 males, 19 Caucasian, 3 African American, and 2 Hispanic individuals. Mean ± standard deviation age was 28 ± 4 years and weight was 74 ± 14 kg. Plasma assays in this study were conducted in the same laboratory.
Analytical measurements
For DBS, 25 μL of whole blood were pipetted to a Whatman 903 card. Cards were air dried for at least 3 h or overnight and stored at −80°C once dried until analysis. TFV-DP was quantified from a 3 mm punch using validated methodology. 18 The TFV-DP in DBS assay was linear and ranged from 25 to 6,000 fmol/sample. Plasma tenofovir was assayed within a range of 10–1,500 ng/mL. 19 A separate ultralow assay with a range of 0.25–25 ng/mL was used for concentrations below 10 ng/mL, as described previously. 20
Pharmacokinetic modeling
Pharmacokinetic analysis was accomplished by nonlinear mixed effects modeling with Phoenix NLME (Version 8.2, Certara®). Two classes of models were developed and compared to describe the formation of intracellular TFV-DP: a plasma tenofovir model driving the formation of TFV-DP through first-order or saturable kinetics, and a one-compartment constant input model that mimics the accumulation of TFV-DP, given the 17-day half-life relative to short dosing intervals. The constant input model is analogous to an intravenous infusion model with a zero-order input rate and first-order elimination. Parameters estimated included clearance (i.e., the parameter responsible for determining steady-state TFV-DP concentrations) and volume of distribution. Model fits were compared as described below, and the best fitting and simplest model were selected for further analyses.
Various structural and absorption models were tested to characterize plasma tenofovir concentrations. First-order, saturable, and hybrid first-order/saturable formation (tolerance) models were assessed for modeling the link between plasma TFV with TFV-DP concentrations. These models were compared with a constant input model of TFV-DP, ignoring the contribution of plasma tenofovir. Changes in AIC/BIC (>2), improvement of residual and standard errors, predicted versus observed concentration plots, residual plots, model parsimony, and biological plausibility aided selection of the best model. Visual prediction checks were used to validate the models.
Random forests for covariate selection
Covariate selection for pharmacokinetic model parameters (clearance in the constant input model and apparent clearance and volume of distribution in the plasma tenofovir model) was primarily guided and justified by physiological plausibility and clinical relevance. Covariates screened included gender, age, weight, race, eGFR, and relevant laboratory values, such as hematocrit, platelets, mean corpuscular volume, bilirubin, red cell distribution width, and liver function enzymes (ALT/AST). Individual post hoc estimates of each parameter of the base PK model were modeled separately using a random forest algorithm, with the goal of identifying predictive covariates associated with each parameter. Selection bias has been shown to occur with traditional forward/backward stepwise selection and significance testing on small datasets (<50–100 subjects). 21 Because of this, random forest analyses can provide an alternative approach to predictive modeling and covariate selection (i.e., variable importance rankings), particularly with many screened covariates.
Model performance was assessed by the root mean squared error and mean absolute error of the crossvalidation procedure. The random forest models were also optimized for maximal predictive performance by adjusting various input factors, such as the maximum number of decision trees in the forest and the number of covariates considered in each tree. Variable importance scores, which rank the importance of the covariates by their predictive power of the outcome variable (i.e., each PK parameter), were generated to select physiologically and clinically relevant variables to be included in the final pharmacokinetic model.
A full covariate selection model approach was used, where all selected covariates from the random forest model were entered into the pharmacokinetic model simultaneously. 22 The population estimates and variances of the PK parameter and of the covariate estimates were used to simulate a random distribution of 1,000 values, using the coveffectsplot R package designed to visualize covariate effects in pharmacometric analyses. The effects on PK parameters of extreme values of each covariate (5th and 95th percentile values for continuous variables), relative to the “reference” median value, were visualized with forest plots. Ninety percent confidence intervals (CIs) were calculated and only covariates with effects that did not include one in the interval were included in the model.
Categorical adherence predictions
For each dosing frequency (1–7 doses/week), a simulation dataset was created with 1,000 random values of each covariate within the range of observed values. Each dosing frequency was modeled by varying the interdose interval. For example, 1 dose/week corresponded to 1 dose every 168 h, 2 doses/week as 1 dose every 84 h, etc.
Simulated TFV-DP concentrations at week 12 (steady state) were then grouped into <2, 2–3, 4–5, and 6–7 doses/week. A fivefold crossvalidated decision tree was implemented to classify dosing frequency regimens (<2, 2–3, 4–5, 6–7 doses/week) based on week 12 concentrations and final covariate values. The depth of the decision tree was optimized by cost complexity pruning. 23 Decision trees were selected for classification instead of random forests, which are a collection of decision trees, because of the superior interpretability of decision trees compared with the black-box output of random forests. Receiver operating characteristic curve (ROC) analyses, a test commonly used to assess the performance of a binary classifier, were conducted to compare the results of the decision tree model at each classification boundary.
Results
Forty-eight participants completed the DOT-DBS study. Baseline characteristics of the 48 participants are shown in Table 1. There were 25 females and 10 African American participants, 2 of whom were also Hispanic. Median (range) age was 29 (21–49) years and weight was 77 (51–155) kg. Median eGFR was 98 (69–156) mL/min. Key complete blood count (CBC) laboratory values included a hematocrit of 43% (35%–49%) and platelet count of 247 (153–430) × 109 per liter.
Baseline Characteristics of DOT-DBS Study Participants
Results are reported as median (range) or number (percent).
Two Hispanic individuals were black.
BMI, body mass index; eGFR, estimated glomerular filtration rate.
Population pharmacokinetics
In total, 716 quantifiable samples each of plasma tenofovir and TFV-DP concentrations were available for analysis from DOT-DBS, and 193 plasma samples from a single-dose, intensive PK study. Time postdose ranged from 3 min to ∼28 days.
Plasma tenofovir was best described by a three-compartment model with transit absorption, linked to the formation of TFV-DP through a first-order rate constant. However, in comparison, a less complex one-compartment constant input model of TFV-DP—without the influence of plasma tenofovir—demonstrated similar model fits and error estimates of TFV-DP accumulation and was therefore chosen for further analyses. Random effects were included on both clearance and volume. Parameter estimates and associated interindividual variability are reported in Supplementary Table S1. Goodness-of-fit and visual predictive check plots are shown in Supplementary Figure S1. Random forests indicated weight, platelet count, hematocrit, bilirubin, eGFR, race (Black vs. non-Black), and sex at birth as potential covariates on clearance, the parameter responsible for determining steady-state concentrations.
The effects on clearance of extreme values (5th and 95th percentiles of continuous covariates) of each covariate, relative to the median clearance value, are shown in Figure 2. The point estimates of the effects of low and high weight values were 14% lower and 19% higher, whereas the effects of low and high platelet counts were 8% lower and 15% higher, relative to the median value. The distribution of the effects of hematocrit and bilirubin included one—further supported by low precision of the parameter estimates—and were excluded from further analysis. The addition of eGFR to a model with weight and platelet count did not improve model fit or further reduce interindividual variability (<1% change) and was also removed for reasons of model parsimony. A low number of black participants and a wide distribution of the effect of race (Fig. 2) also precluded the ability to precisely identify its influence on clearance. Gender was associated with both weight (91 ± 24 vs. 71 ± 18 kg, p = .003 males vs. females) and hematocrit (45% ± 2 vs. 40% ± 3, p < .0001 males vs. females) and was considered redundant to the effects of these two variables and therefore excluded from the full covariate model. Simultaneous inclusion of weight and gender in the constant input model diminished the effect of weight by 33% and resulted in lower precision and insignificance of both estimates, consistent with the consequences of including closely related variables in the same model. 24 Gender was therefore evaluated by univariate analysis.
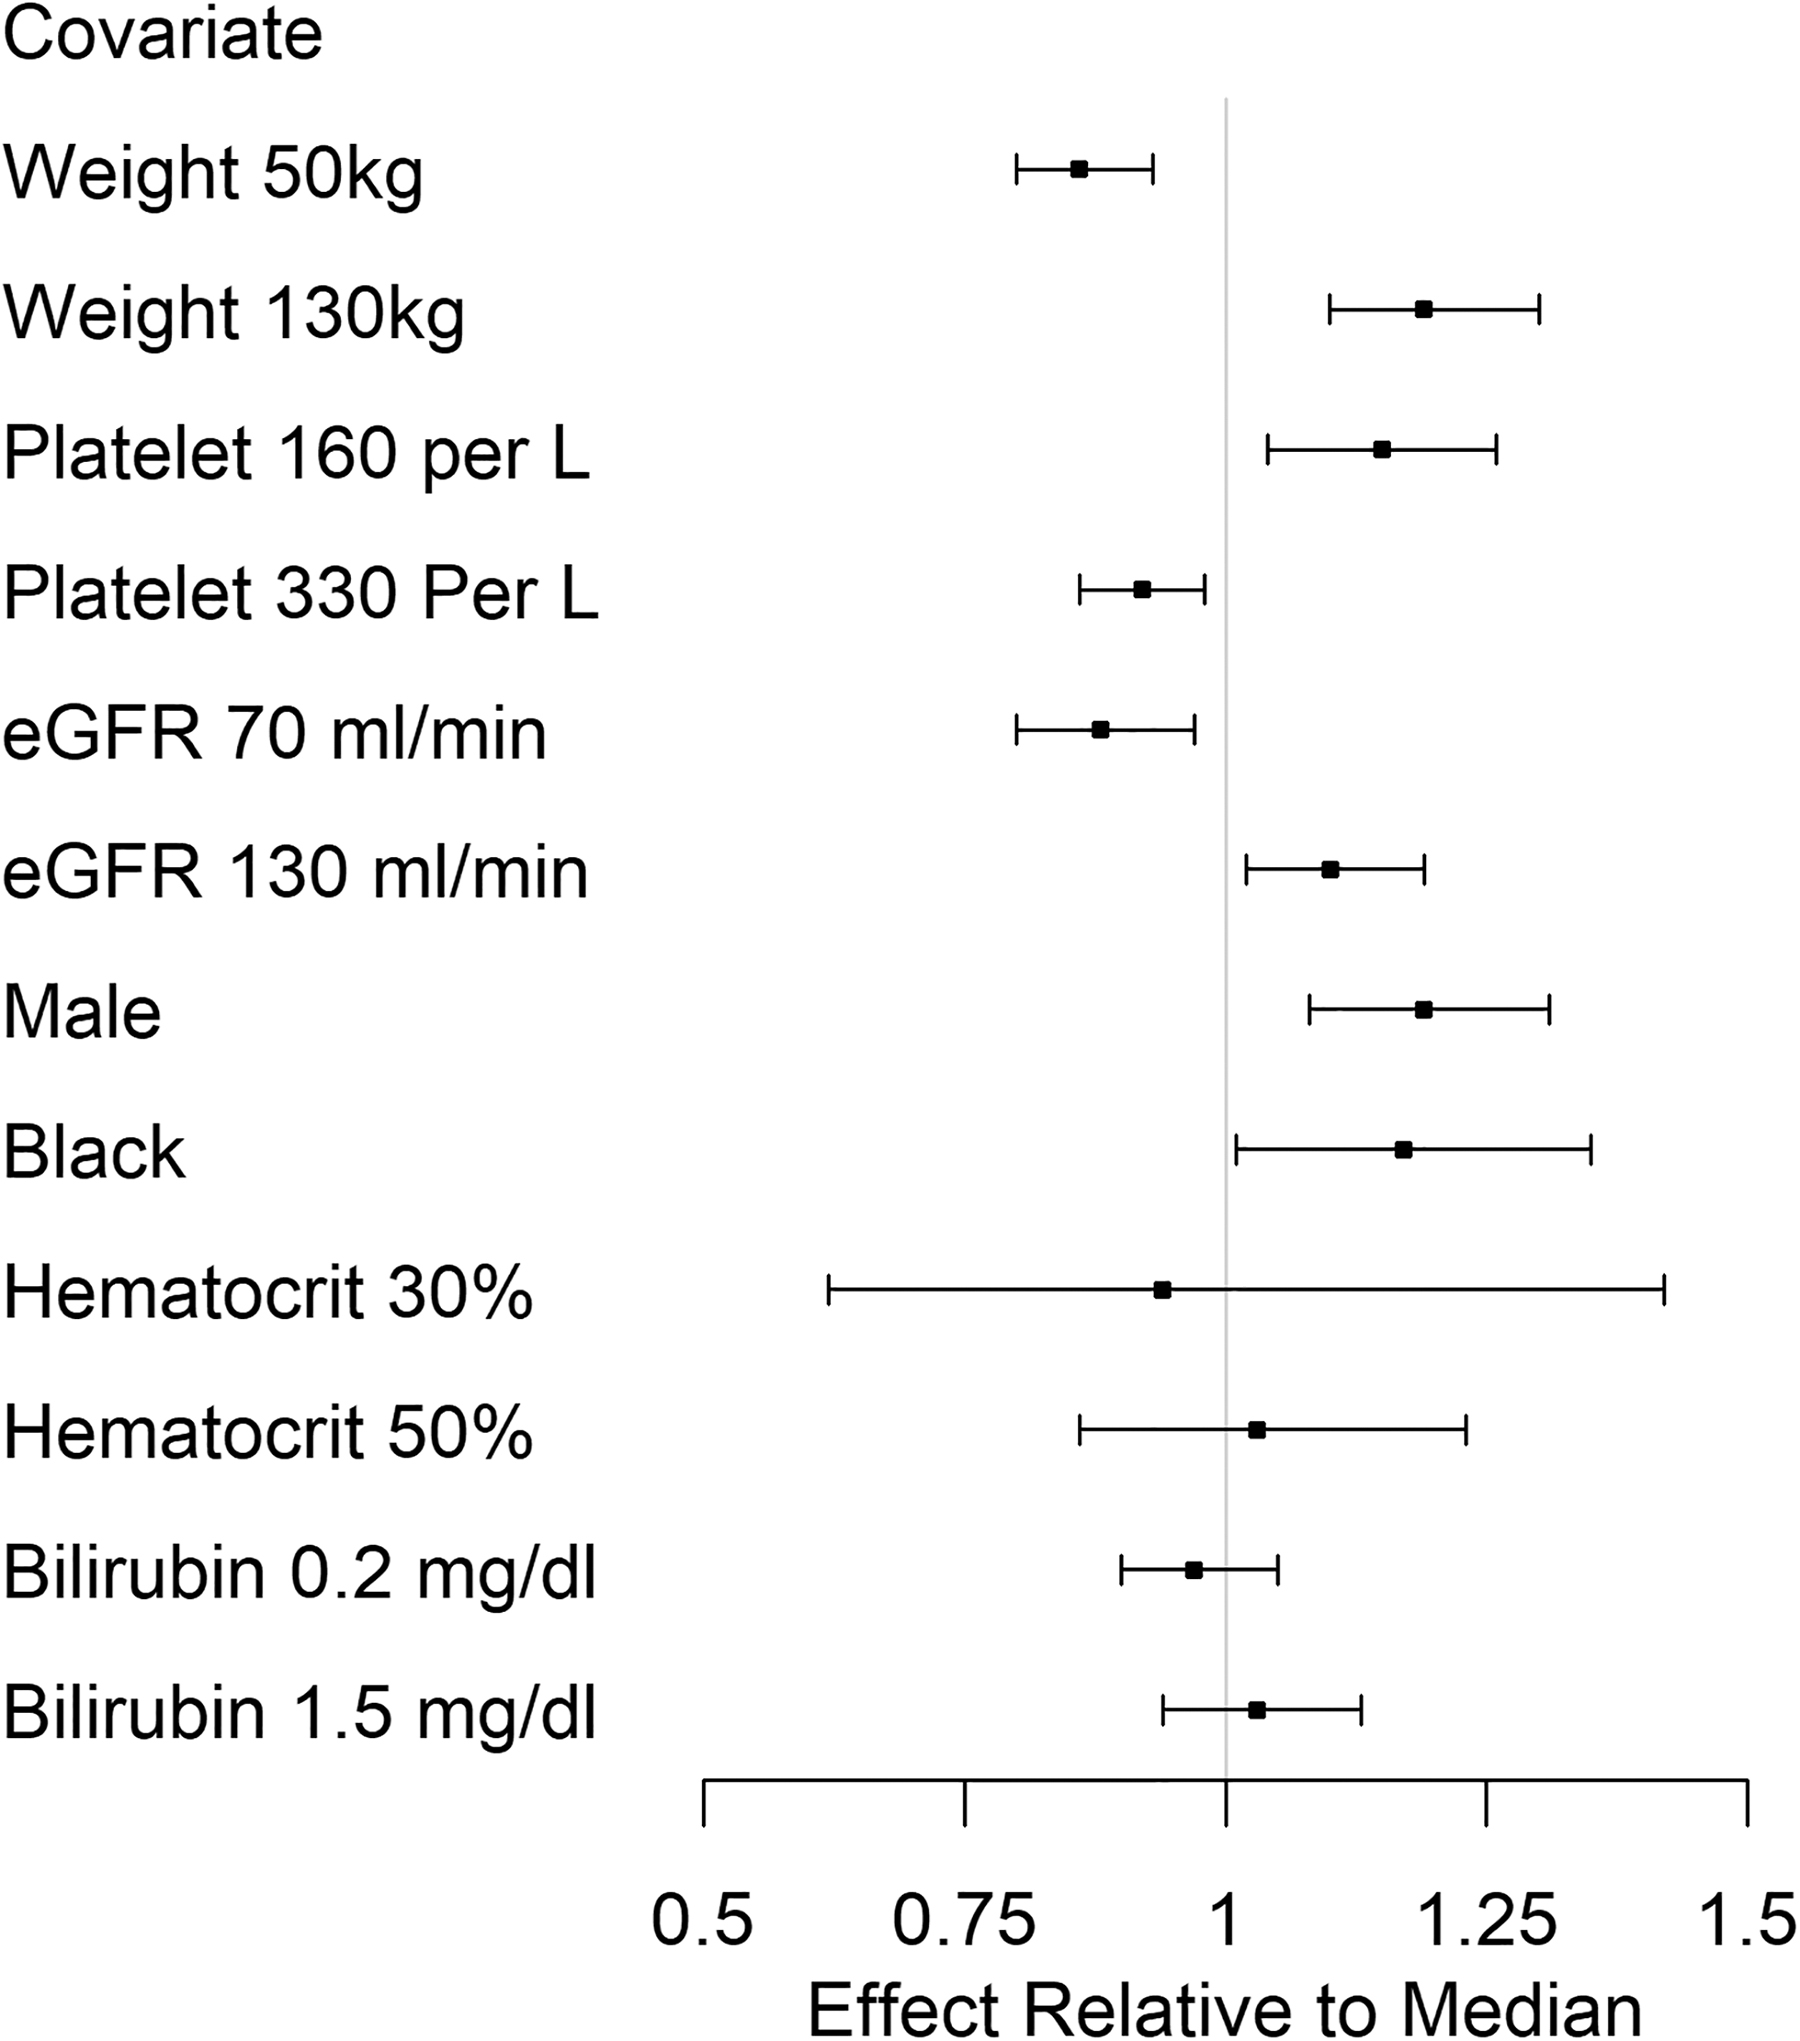
Effects of continuous (5th and 95th percentile) and categorical covariate values on constant input clearance.
Clearance increased (TFV-DP decreased) by 4% (95% CI 2%–6%) for every 10 kg increase in weight, whereas an increase of 10 × 109 platelets/liter decreased clearance (TFV-DP increased) by 2% (95% CI 1%–3%). In terms of steady-state concentrations, an individual with the median weight and platelet count (77 kg and of 247 × 109 platelets/liter) resulted in a population-average steady-state concentration (calculated by the dosing rate divided by clearance) of ∼1,700 fmol/punch (95% CI 1,600–1,800 fmol/punch), whereas a 10-unit increase in both variables resulted in a population-average steady-state concentration of ∼1,600 fmol/punch (95% CI 1,550–1,700 fmol/punch). In summary, the final model included weight and platelet count on estimated steady-state TFV-DP, which decreased interindividual variability from 18% in the base model to ∼13%. Residual variability was 17%.
Categorical adherence predictions
Using the constant input model, simulations of varying platelet and weight values were generated for dosing frequencies of 1–7 doses/week. Overall descriptive statistics of each dosing group are shown in Table 2. Separate receiver operating characteristic curve (ROC) analyses (1–2 vs. 3–7 doses/week and 1–3 vs. 4–7 doses/week) indicated a cutoff of ∼580 fmol/punch for ≥3 doses/week and 830 fmol/punch for ≥4 doses/week, with >94% positive and negative predictive value. To better understand the exact dosing frequency of 700 fmol/punch—a key protective concentration corresponding to the lower limit of ≥4 doses/week with previous interpretations 13 —simulations of 3, 3.25, 3.5, and 3.75 doses/week were conducted without the influence of covariates. Around 3.5 doses/week (modeled as 1 dose every 48 h) was the minimum dosing frequency that produced TFV-DP concentrations ≥700 fmol/punch at the 25th percentile. ROC analyses indicated a cutoff of ∼800 fmol/punch to differentiate adherence levels ≥3.5 doses/week, although positive and negative predictive values were lower (67% and 62%, respectively), probably due to a greater overlap in concentrations given the narrower interdose intervals between 3 and 3.75 doses/week.
Descriptive Statistics of Simulated Tenofovir-Diphosphate Concentrations (fmol/Punch) by Dosing Frequency
SD, standard deviation.
Dosing frequencies were then grouped into <2, 2–3, 4–5, and 6–7 doses/week and a decision tree generated an optimal categorization based on TFV-DP concentration cutoffs, weight, and platelet count. Weight demonstrated a more influential effect compared with platelet count. Results for four or more doses per week within the range of normal platelet counts are summarized in Table 3, and the full range of dosing frequencies is presented in Supplementary Table S2. Concentrations were rounded to the nearest 50 fmol/punch. The proportion of correctly classified observations for each categorization was >80%. Misclassification rates, defined as an adherence interpretation that was higher or lower than the assigned directly observed dosing regimen, were compared between previous and these tailored adherence interpretations of the raw data of the 48 participants. Using the previous interpretations outlined in Supplementary Table S2, 28/94 (30%) of the assessments would be misclassified, while 16/94 (17%) misclassifications occurred after incorporating weight and platelet counts, predominantly improving the precision of individuals who weighed <70 kg.
Adherence Benchmarks of Simulated Tenofovir-Diphosphate Concentrations (fmol/Punch) for ≥4 Doses/Week
Range of body weight and platelet count is based upon the range used in simulations.
Discussion
The purpose of this analysis was to identify individual characteristics that improve the precision of the current use of TFV-DP concentrations as an objective measure of adherence to F/TDF for HIV PrEP. This was accomplished by applying the most parsimonious constant input model to describe the accumulation of TFV-DP, followed by a comprehensive search of demographic and clinical covariates. Estimating both between- and within-subject variability through population PK modeling offered an alternative and more informative method of characterizing TFV-DP variability. We found that incorporation of platelet count and body weight into adherence evaluations improved the delineation between boundaries of current TFV-DP thresholds and decreased the misclassification rate by almost half (17% vs. 30%), thereby providing tailored assessments and enabling more precise adherence–efficacy relationships. Furthermore, we used ROC and decision tree analyses to identify TFV-DP benchmarks instead of relying on 25th percentiles. Interestingly, these analyses did not dramatically change the previous thresholds. Taken together, investigators and clinicians who use the previous interpretations may be overly conservative with adherence estimates, particularly in subjects with lower weights. This suggests that the pharmacological forgiveness of F/TDF for PrEP may be higher than previously recognized in MSM.
Previous interpretations indicated four or more doses/week as corresponding to concentrations of TFV-DP >700 fmol/punch, which was associated with 100% (86%–100%) relative risk reduction of HIV acquisition. 15 Our analyses suggest that this adherence interpretation should be dependent on body weight and platelet count. When doing so, concentrations above 700 fmol/punch corresponded to 2–3 doses/week for individuals ≤110 kg and ≥4 doses/week for those >110 kg. Higher rates of misclassification in women using previous interpretations were largely mitigated after incorporating body weight (31%–13% misclassification rate), as most of the women in the study weighed <70 kg. An average of 2–3 doses/week is consistent with intermittent/on-demand F/TDF dosing of the various IPERGAY trials, where participants experienced high efficacy (86%, 95% CI: 40%–99%) following a median of 15 and 18 doses/month (3.75 and 4.5 doses/week) 25,26 ; although it is acknowledged that dose timing relative to HIV exposures is important for efficacy.
Several pharmacokinetic models were evaluated to describe the formation of TFV-DP. The development of these models allowed for novel insights into the cellular pharmacology of F/TDF, quantification of between- and within-subject variability, and the identification of sources of variability. Although previous plasma tenofovir models report a two-compartment model, our analysis included samples up to 28 days postdose and an ultralow limit of quantification of 0.25 ng/mL. This extended sampling time provided evidence of a third compartment, which may represent the catabolism of intracellular TFV-DP back to tenofovir and its subsequent release back from within the cell into to the plasma. 27 In addition, previous models suggest saturable uptake of tenofovir in peripheral blood mononuclear cells (PBMCs), although these studies did not assess RBC uptake and were conducted in people living with HIV. Uptake in PBMCs in healthy individuals has also been modeled through first-order kinetics. 28 Future research should investigate the saturating PK of F/TDF in healthy individuals, as well as the influence of a lipophilic TDF intermediate, tenofovir monoester, on cellular uptake. 29
Interindividual and residual variability was also significantly lower than previously reported, which can partly be attributed to our directly observed dosing methods. Unrecognized partial adherence or ignoring actual dosing information can yield biased PK parameter estimates and significantly overestimate interindividual and residual variability. 30,31 While previous plasma tenofovir models report 30%–40% interindividual CV on oral clearance after inclusion of covariates, 28,32 –35 incorporating adherence information based on estimated dosing histories resulted in only 16% CV on clearance in one study, similar to the 17% CV observed in our data. 36 Parameter estimates and errors of the current models can be used for future pharmacokinetic simulations of F/TDF, such as alternative dosing regimens or modeling dose forgiveness designs.
We screened a comprehensive list of clinical and demographic covariates to investigate sources of interindividual variability, ultimately leading to selection of body weight and platelet count. Body weight was the most influential covariate (Table 3). Higher body weight correlates with higher elimination organ mass and function (i.e., kidney weight), thereby increasing plasma tenofovir clearance and decreasing intracellular TFV-DP concentrations. The association found with platelet is less intuitive. Hematocrit was expected to be associated with TFV-DP concentrations, but it was not in this study, perhaps due to the narrow range of hematocrit (HCT) in our healthy volunteers and/or unmeasured confounding. 37 TFV-DP concentrations are low in platelets, which does not provide a mechanism for our findings. 38 Additional research will be needed to elucidate the mechanism for these findings.
Another potential and novel source of interindividual variability can arise from pharmacometabolomic and pharmacogenomic associations. 39,40 Previous studies have identified polymorphisms in various genes related to the cellular pharmacology of F/TDF and their association with TFV-DP concentrations or development of renal dysfunction. 41,42 Nonetheless, the aim of the current study was to identify routinely collected individual characteristics without the need for additional data collection (i.e., metabolites or genotyping). Future communications will explore metabolomic and genomic associations and investigate their additional benefit to describing interindividual variability in the pharmacokinetics of F/TDF.
While this study had strengths, there were also limitations. Redundancy between the effects of covariates was an important consideration during model development. Covariates found to be associated with each other—such as the relationships found between gender, hematocrit, and weight—were excluded from entering the model simultaneously. Covariate selection between the associated variables was justified by biological plausibility and the intended application of the model to MSM. Although we selected weight in the final model and its inclusion decreased misclassification rates in women, it is possible that gender still influences F/TDF pharmacology. It is also possible that different models can have similar predictive accuracy. For example, eGFR was a significant covariate but was not included in the final model, because body weight was already included in the model and it was associated with eGFR. However, the inclusion of platelet count offered unique and easily collected information for explaining individual variation in steady-state TFV-DP concentrations. In addition, absence of additional directly observed F/TDF studies prevented external validation of these results. Finally, participants in this study were adults recruited from the United States and the majority were Caucasian. Unique physiological differences in various populations, such as pregnant women, diverse ethnicities, and pediatric patients limit the use of these adherence interpretations for these groups. Finally, the relationship between TFV-DP and body weight is limited to the range observed in our study. Additional studies are needed to describe the effect of low body weight (<51 kg) on TFV-DP concentrations.
Conclusion
In summary, our current analysis provided new insight into the sources of variability associated with TFV-DP concentrations in DBS, leading to individualized adherence benchmarks. These updated benchmarks, which take into account weight and platelet count, can be used for a more precise approach to assess adherence and adherence–response relationships. Future studies will apply these benchmarks in real-world PrEP trials to characterize adherence patterns within individuals, factors associated with adherence, and confirm relationships between adherence and relative risk reduction of HIV acquisition.
Footnotes
Author Contributions
M.E.I. analyzed data and wrote the article. P.L.A designed the DOT-DBS study and oversaw the analytical pharmacology work. L.B. oversaw the analytical pharmacology work. L.S. and S.M. helped design the statistical analysis plan. J.R.C.-M., K.M.B., J.Y., and J.J.K. contributed to the analysis plan. All authors contributed to the final article.
Acknowledgments
The University of Colorado is a Certara Center of Excellence school. The Center of Excellence Program supports leading institutions with Certara's state-of-the-art model-informed drug development software.
Author Disclosure Statement
P.L.A. received contract and research funding and donated study medication from Gilead Sciences (paid to his institution). J.J.K. received research funding (paid to her institution) from Gilead Sciences and donated study medication from Gilead Sciences for an NIH-sponsored study. M.E.I., J.R.C.-M., K.M.B., J.Y., L.S., and L.B. have none to declare.
Funding Information
This work was supported by the NIH [K23AI104315 (J.R.C.-M.), U01 AI106499 and R01 AI122298 (P.L.A.), and UL1 TR001082 (University of Colorado Clinical and Translational Sciences Institute)]. Gilead Sciences provided the study drug.
Supplementary Material
Supplementary Figure S1
Supplementary Table S1
Supplementary Table S2
References
Supplementary Material
Please find the following supplemental material available below.
For Open Access articles published under a Creative Commons License, all supplemental material carries the same license as the article it is associated with.
For non-Open Access articles published, all supplemental material carries a non-exclusive license, and permission requests for re-use of supplemental material or any part of supplemental material shall be sent directly to the copyright owner as specified in the copyright notice associated with the article.