
Abstract
Despite the considerable progress that has been made in identifying cellular factors and pathways that contribute to establishment and maintenance of the latent HIV reservoir, it remains the major obstacle to eradicating this virus. Most recently, noncoding genes have been implicated in regulation of HIV expression. In this study, small RNA sequencing was used to profile expression of microRNAs (miRNAs) in a primary CD4+ T cell in vitro model of HIV latency. Previously, we have shown that protein-coding genes dysregulated in this model were enriched for the p53 signaling pathway, which was confirmed experimentally. We further found a link between p53 signaling and dysregulated long noncoding RNAs. In this study, we hypothesized that miRNAs may provide an additional level of regulation of the p53 signaling pathway during HIV latency. Twenty-six miRNAs were identified to be dysregulated in our latency model. A subset of these miRNAs was validated by real-time quantitative polymerase chain reaction. Predicted messenger RNA (mRNA) targets and cellular pathways enriched for mRNA targets were identified using several analytical methods. Our analyses showed that many protein-coding genes and pathways targeted by dysregulated miRNAs have relevance to regulation of HIV expression or establishment of HIV latency. The p53 signaling pathway was found among pathways that were targeted by dysregulated miRNAs at a greater level than expected by chance. This study provides a mechanistic insight into regulation of the p53 pathway through miRNAs that may contribute to the establishment of latency.
Introduction
While considerable advances have been made in understanding the nature of the latent HIV reservoir, effective strategies for its elimination are still lacking. HIV expression is regulated at multiple levels, including availability of transcription factors, 1,2 histone and DNA modifications 3 –6 at the HIV promoter long terminal repeat (LTR), and the characteristics of the site of proviral integration. 7 More recently, noncoding genes have been recognized as novel factors that regulate gene expression, 8,9 with the evidence that long noncoding RNAs (lncRNAs) participate in regulation of HIV replication and latency. 10,11
One of the classes of noncoding genes, which is largely understudied with respect to regulation of HIV latency, is microRNAs (miRNAs). While multiple studies reported changes in miRNA expression during HIV infection, only a few have attempted to explore the mechanisms employed by miRNA to control HIV latency. 12 MiRNAs may act on protein coding genes that function as HIV regulators, or target HIV RNA directly. For example, miR-155 downregulates expression of TRIM32, which stimulates NF-κB signaling, 13 a central pathway that regulates HIV expression. 14,15 Four miRNAs were found to have higher expression in resting compared to activated primary CD4+ T cells, and have reinforced HIV latency by suppressing expression of cyclin T1. 16 Two reports demonstrated direct targeting of HIV messenger RNA (mRNA) by miRNAs, 17,18 with the majority of identified miRNAs having selectively elevated expression in resting cells, 18 suggesting possible function as repressors during latent infection.
HIV latency is difficult to study because it occurs in a very small percentage of the host cells. 19 Thus, in vitro models of latent infection represent a valuable tool that enables characterization of this phenomenon. One of such models 20 –23 has been recently used to characterize mRNA expression from protein-coding genes in latency, 24 as well as another class of noncoding genes—lncNRA. 11 The major theme of these studies was the identification of the p53 signaling pathway as a contributor to the establishment of latency. 24 We have found this pathway to be regulated by a set of lncRNAs that are dysregulated in the primary CD4+ T cell latency model. 11
In this study, we further characterize another level of control that drives latent infection. Small RNA sequencing (smRNA-Seq) is employed to analyze the miRNA differences between the model of HIV latency and mock-infected cells. 11,22 We hypothesize that miRNAs contribute to regulation of the p53 signaling pathway during HIV latency. Our results demonstrate that miRNAs, differentially expressed between latently infected and mock-infected cells, are predicted to target the same biological pathways that are enriched for differentially expressed genes (DEGs). The p53 signaling pathway and individual protein-coding genes of this pathway are consistently identified by various analyses.
Materials and Methods
The in vitro model of HIV latency
A well-characterized cultured TCM model of HIV latency 11,22 was used for these experiments. Peripheral blood mononuclear cells (PBMC) from anonymous blood donors were obtained from blood bank, the Gulf Coast Regional Center (Houston, TX); thus the study was exempt from the IRB approval. Naive cells were isolated from PBMC of HIV-seronegative donors (N = 4) and activated for 3 days using anti-CD3-/anti-CD28-coated magnetic beads in the presence of anti-interleukin (IL)-4, anti-IL-12, and tumor growth factor (TGF)-β. Cells were expanded in medium containing human IL-2 for additional 4 days. On day 7, cells were infected with NL4.3 virus at multiplicity of infection (MOI) = 0.1 by spinoculation at 2,900 rpm at 37°C for 2 h; mock-infected samples were processed in parallel. After infection, cells were further cultured in medium with IL-2 for 3 days, subjected to crowding in round-bottom plates with IL-2 for 3 days, and cultured in flasks in the presence of IL-2 and anti-retroviral therapy (ART, 0.5 μM Nelfinavir and 1.0 μM Raltegravir) for another 4 days. On day 17, positive magnetic selection was used to remove any remaining productively infected cells. At this stage, latently infected and mock-infected conditions were collected. Additional cell aliquots were subjected to T cell receptor stimulation by anti-CD3-/anti-CD28-coated magnetic beads to reactivate latent HIV. Mock-infected cells were activated in parallel. Activated cells (both infected and mock-infected) were collected 48 h following treatment.
The cell samples were split into aliquots and used to assess establishment of latent infection, reactivation, and genes dysregulated in latency. These analyses were published previously. 11,24 The same RNA samples were used for both RNA-Seq 11,24 and smRNA-Seq in this study.
RNA isolation and sequencing
Total RNA was extracted using the RNeasy Plus Mini Kit, according to manufacturer's instructions, with addition of extra ethanol to the flow through from the genomic DNA (gDNA) columns (1.5 volumes of 100% Ethanol) to recover small RNAs. On-column DNase treatment was included as part of the protocol to remove gDNA. RNA integrity (RIN) was assessed using a Bioanalyzer 2100 (Agilent Technologies, Inc.). All samples were deemed of good quality for RNA sequencing (average RIN 9.9 and standard deviation 0.1). RNA library preparation and smRNA-Seq were conducted at Expression Analysis Q2 Solutions, Inc. (Morrisville, NC). Briefly, the Illumina TruSeq Small RNA Library Prep kit was used to prepare libraries, and the BluePippin system was used for size selection. Libraries were sequenced to a read depth of 5 million reads using the Illumina HiSeq2000 to generate 50 base pair single-end reads. FASTQ files are available at the Gene Expression Omnibus (GEO), accession number GSE153094.
SmRNA-seq data analysis
The quality of the small read sequences from each sequenced library was accessed by using FastQC (v0.11.2). 25 Raw reads were trimmed to remove low-quality reads and adapter sequences. Filtered reads for the samples were mapped to the collection of human mature miRNA from miRBase v2126 using Novoalign with the following setting: novoalign -m -l 14 -h 20 -t 30. Only reads that were uniquely aligned to the mature miRNA were considered for further analysis. Mapped reads were sorted by name and converted to sam files using samtools. 27 Sam files were used for read counting using HTSeq (version 0.6.1) 28 with default settings, using annotation derived from miRBase v21. 26 The miRNA expression data were filtered to remove lowly expressed miRNAs and preserve miRNA with a minimum of 2 counts per million reads (cpm) in at least 25% of samples. Read counts of the 418 miRNAs that survived filtering were input for differential expression testing using the Bioconductor package EdgeR (version 3.4.2). 29 The data were normalized to adjust for sample library sizes using the trimmed mean of M values method in EdgeR.
Differentially expressed miRNAs (DEmiRNAs) between mock-infected and latently infected cells were identified by fitting the data to a generalized linear model (GLM) followed by GLM likelihood ratio test. The p-values were adjusted for multiple testing using the Benjamini and Hochberg approach. 30 Significance for differential expression was set at a false discovery rate (FDR)-corrected p-value <.05. To visualize DEmiRNAs, data were transformed using variance-stabilizing transformation (vst), and the heat maps were constructed using the R package gplots heatmap.2 function and scaled by row. 31,32
Functional analysis of potential miRNA targets
To investigate the biological function of DEmiRNAs between the mock-infected and latently infected conditions, functional enrichment analysis of miRNA target genes was performed. The publicly available tool, miRNet, 32 was used to obtain a complete list of experimentally validated targets of the DEmiRNAs. Then, a topology-based filter was applied to the gene-miRNA network. Specifically, only the gene nodes (note: not miRNA nodes) with greater than one degree (the default value) were considered for further functional enrichment analysis with Kyoto Encyclopedia of Genes and Genomes (KEGG) pathway database 33 by implementing a hypergeometric test.
Integrated analysis of mRNAs and miRNAs differentially expressed in latency
We then used another functional enrichment analysis tool, Ingenuity Pathway Analysis (IPA; Qiagen, Inc., Valencia, CA), which allows integration of the DEmiRNA and DEG data together by matching the predicted miRNA targets to previously published DEGs. 24 MiRNA target filter in IPA was used to first predict mRNA targets of the DEmiRNAs. Next, the DEGs that were previously identified in the same laboratory experiment 24 were overlaid to determine which of the DEmiRNAs targeted DEGs. To infer biological function of these relationships, only miRNAs that targeted mRNAs, which had a fold change in the opposite direction, were considered (i.e., if the miRNA was increased in expression, the mRNA was decreased, and vice versa). These final filtered DEmiRNAs and their gene targets were visualized using Cytoscape v3.5.134; log2-fold change between latently infected and mock-infected cells was colored and overlaid upon the network.
The Search Tool for the Retrieval of Interacting Genes/Proteins (STRING) 35,36 was then used to identify interactions between proteins encoded by mRNA targets of the DEmiRNAs and to infer their biological relevance. STRING was used with default settings (medium confidence) to identify protein-protein interactions. The network was then filtered to ensure that each node had at least one interaction within the network. The number of interactions that a protein had within the network (degrees) was taken as the measure of its importance.
A fast greedy community search 37 method was used by the R package iGraph 38 to identify communities within this protein interaction network. The number of DEmiRNAs that targeted each community was then assessed to identify communities of proteins encoded by DEGs, which were targeted by DEmiRNAs at a greater level than expected by chance. To apply a significance to the number of miRNAs targeting each community, a hypergeometric test was implemented in R using the dhyper function with the following parameters: x = number of miRNAs targeting the community, m = predicted total miRNAs targeting the community (predictions made by miRNET), n = number of DEmiRNAs predicted to target the community, and k = 26 (number of miRNAs) multiplied by the number of nodes (proteins) in the community = equivalent to the number of tests. The community was considered to be targeted by miRNAs more than expected by chance if the FDR-corrected p-value was <.05. Only communities that contained more than six members were considered.
Polymerase chain reaction
miRNAs, whose expression was upregulated in latently infected compared to mock-infected cells and downregulated or not affected in activated cells, were selected for validation of expression by real-time quantitative polymerase chain reaction (RT-qPCR): hsa-mir-4697-3p, hsa-mir-497-5p, and hsa-mir-10a-5p. In addition, hsa-mir-1275 was selected because it was downregulated in latency and not affected during activation. Hsa-mir-30e-3p, a miRNA that had the least variation in expression across all the samples, was selected as a normalizer. RNA samples, containing the mixture of long and small RNAs, were converted to complementary DNA (cDNA) using Universal cDNA Synthesis Kit II (Exiqon, Inc., now available as miRCURY LNA RT Kit from Qiagen, Inc.). Reverse transcription cycling parameters were 42°C for 60 min, 95°C for 5 min, and 4°C indefinitely. RNA expression was quantified using miRCURY LNA SYBR Green PCR kit (Qiagen, Inc.). RT-qPCR cycling parameters were 95°C for 2 min—1 cycle and 95°C for 10 s and 56°C for 1 min—45 cycles, with optical read.
Expression of the host genes, the predicted target of hsa-miR-4697-3p, colony-stimulating factor 2 (CSF2), and housekeeping control, ribosomal protein L27 (RPL27), were quantified by droplet digital PCR (ddPCR) as described previously, 39 except 16 ng RNA per reaction was used to quantify CSF2, due to its low expression levels in resting cells.
Statistical analyses
The cycle threshold (Ct) values of the RT-qPCR data were normalized to the hsa-miR-30e-3p control to obtain delta Ct values. These values were then compared using linear modeling in R (the lm function) to determine whether expression of each miRNA is affected by each condition (latently infected and activated). A p-value <.05 was considered a significant effect. For graphing purposes, miRNA fold changes were derived based on 2(− ΔΔCt) method and CSF2-fold changes were calculated directly after normalization to RPL27. Graphs were plotted using the box plot function in R.
Results
Identification of DEmiRNAs and their predicted pathway targets
When comparing the conditions of latent and mock infection, 26 miRNAs were found to be differentially expressed with an FDR-corrected p-value <.05. Figure 1 (middle) shows a heat map of the log2-fold changes of the DEmiRNAs. Plotted in Figure 1 are also the comparisons of miRNA expression in resting vs activated cells to facilitate identification of miRNAs that are modulated specifically in latency, not during cell activation (Fig. 1, left) or productive infection (Fig. 1, right). First, we conducted prediction of protein-coding gene targets of miRNAs using miRNet. This analysis searched for all possible predicted targets, ignoring any prior knowledge of modulation during HIV latency. The initial target prediction identified 4,636 mRNAs targeted by the DEmiRNAs. Pathway enrichment analysis of the predicted targets using the hypergeometric method identified several pathways relevant to HIV biology and particularly establishment and maintenance of latency (Table 1). Among these were p53 signaling, 24 Wnt signaling, 40 MAPK signaling, 41 JAK-STAT signaling, 42 mTOR signaling, 43 T cell receptor signaling, 44 and regulation of actin cytoskeleton. 45

Heat map of DEmiRNAs during latent infection in resting cells. DEmiRNAs between mock-infected and latently infected cells were identified using EdgeR by fitting the data to a GLM followed by GLM likelihood ratio test. Heat maps were constructed using the R package gplots heatmap.2 function and is scaled by row. Fold changes were calculated by subtracting values obtained for miRNA counts per million after variance-stabilizing transformation. For comparison, fold changes during activated state without HIV infection and in latently infected cells following reactivation are shown. Asterisks indicate miRNAs that were selected for validation by quantitative real-time PCR, based on differential regulation during latency and during activation (red asterisk, upregulated in latency, downregulated during activation, or upregulated in latency to a greater extent; blue asterisk, downregulated in latency, upregulated, or no change in activation). D1–D4 indicate samples from four different donors. Scale bar represents the row-scaled expression values (X axis) used to generate the heat map. Count (Y axis) in the scale bar is the number of miRNAs with indicated scale expression values. DEmiRNA, differentially expressed miRNA; GLM, generalized linear model; miRNA, microRNA; PCR, polymerase chain reaction.
Pathways Targeted by Differentially Expressed MicroRNAs Identified Using miRNet
p-value, hypergeometric test p-value; FDR p-value, FDR-corrected p-value using Benjamini-Hochberg method. Pathways relevant for regulation of HIV during latency are highlighted in bold.
FDR, false discovery rate; miRNA, microRNA.
Integrated analysis of DEmiRNAs and their DEG targets
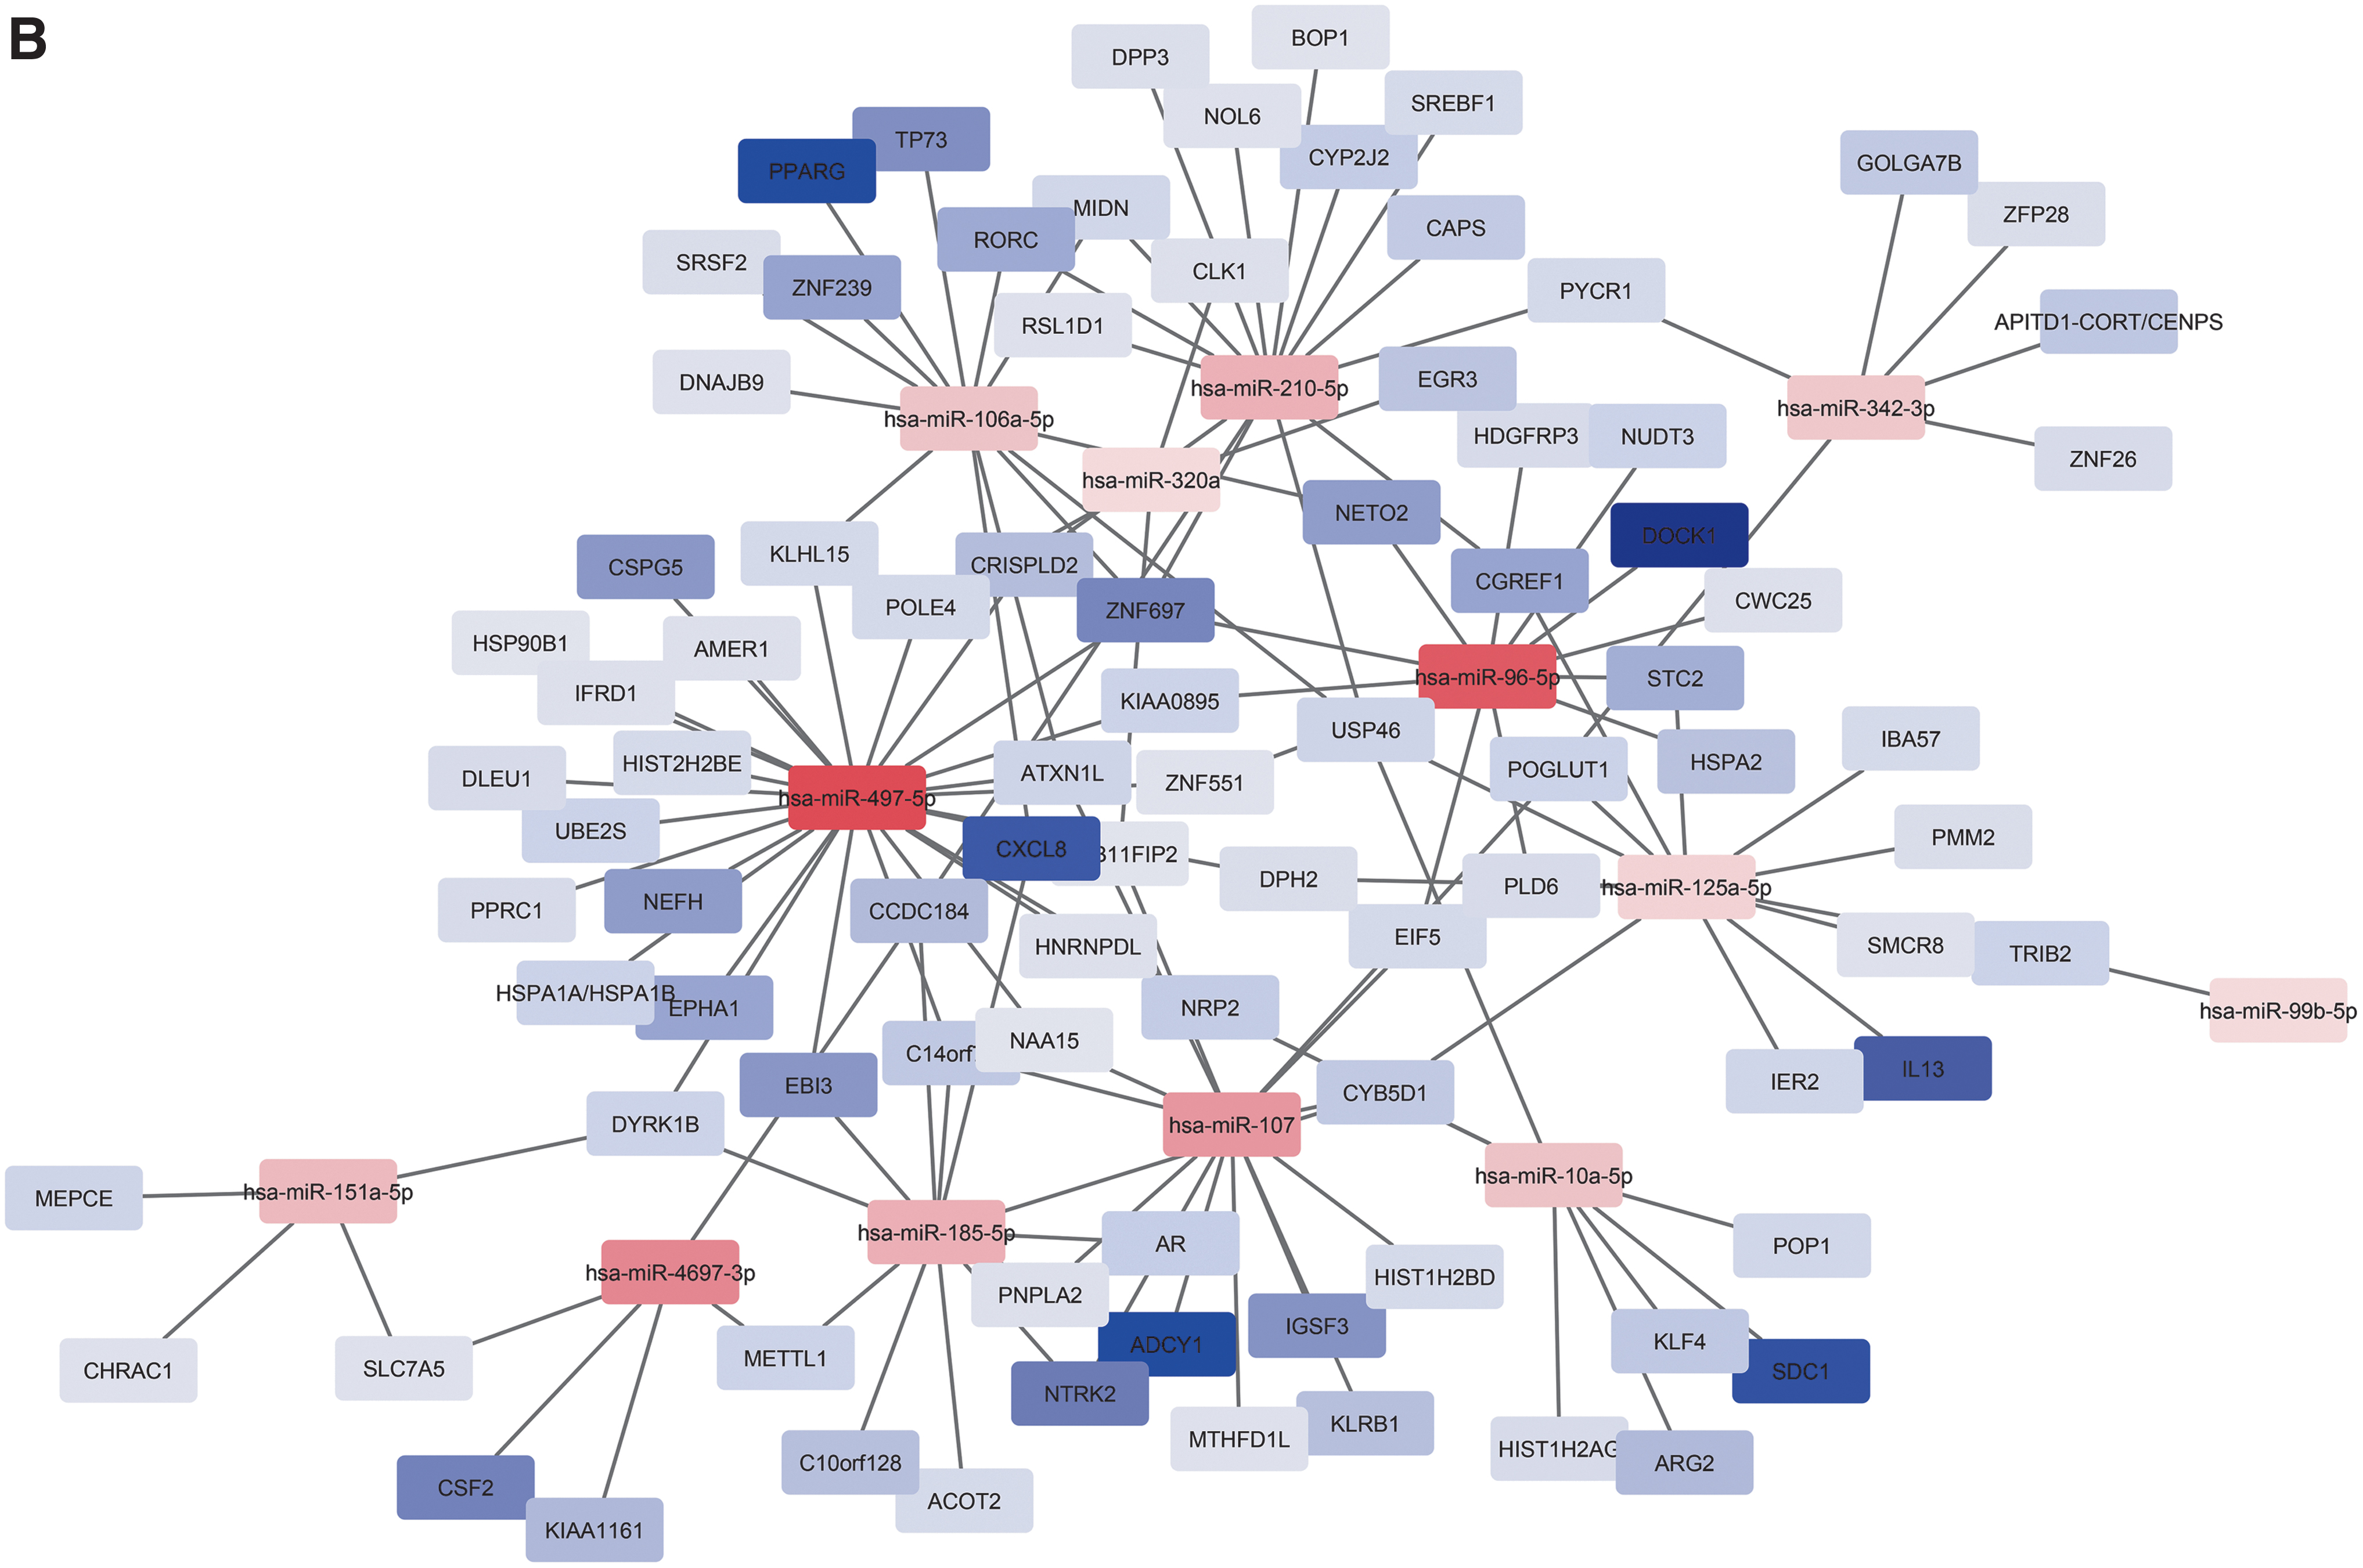
Next, we focused on identification of miRNA targets among protein-coding genes that were also dysregulated during HIV latency. Due to the streamlined ability of miRNA target prediction and expression pairing with previously identified DEGs, 24 IPA was used to predict gene targets for the 26 DEmiRNAs that were found between latently infected and mock-infected samples. Out of a total 826 DEGs previously identified between latently and mock-infected cells, 24 429 were IPA-predicted targets of the 26 DEmiRNAs. One of the mechanisms by which miRNA molecules regulate gene expression is targeting mRNA for degradation. 46 To identify possible miRNA regulators in this system, we removed any protein-coding DEG that was predicted to be targeted by DEmiRNAs, but was modulated in the same direction. As the result of this filtering, 248 DEGs (Fig. 2) were retained for further analyses.
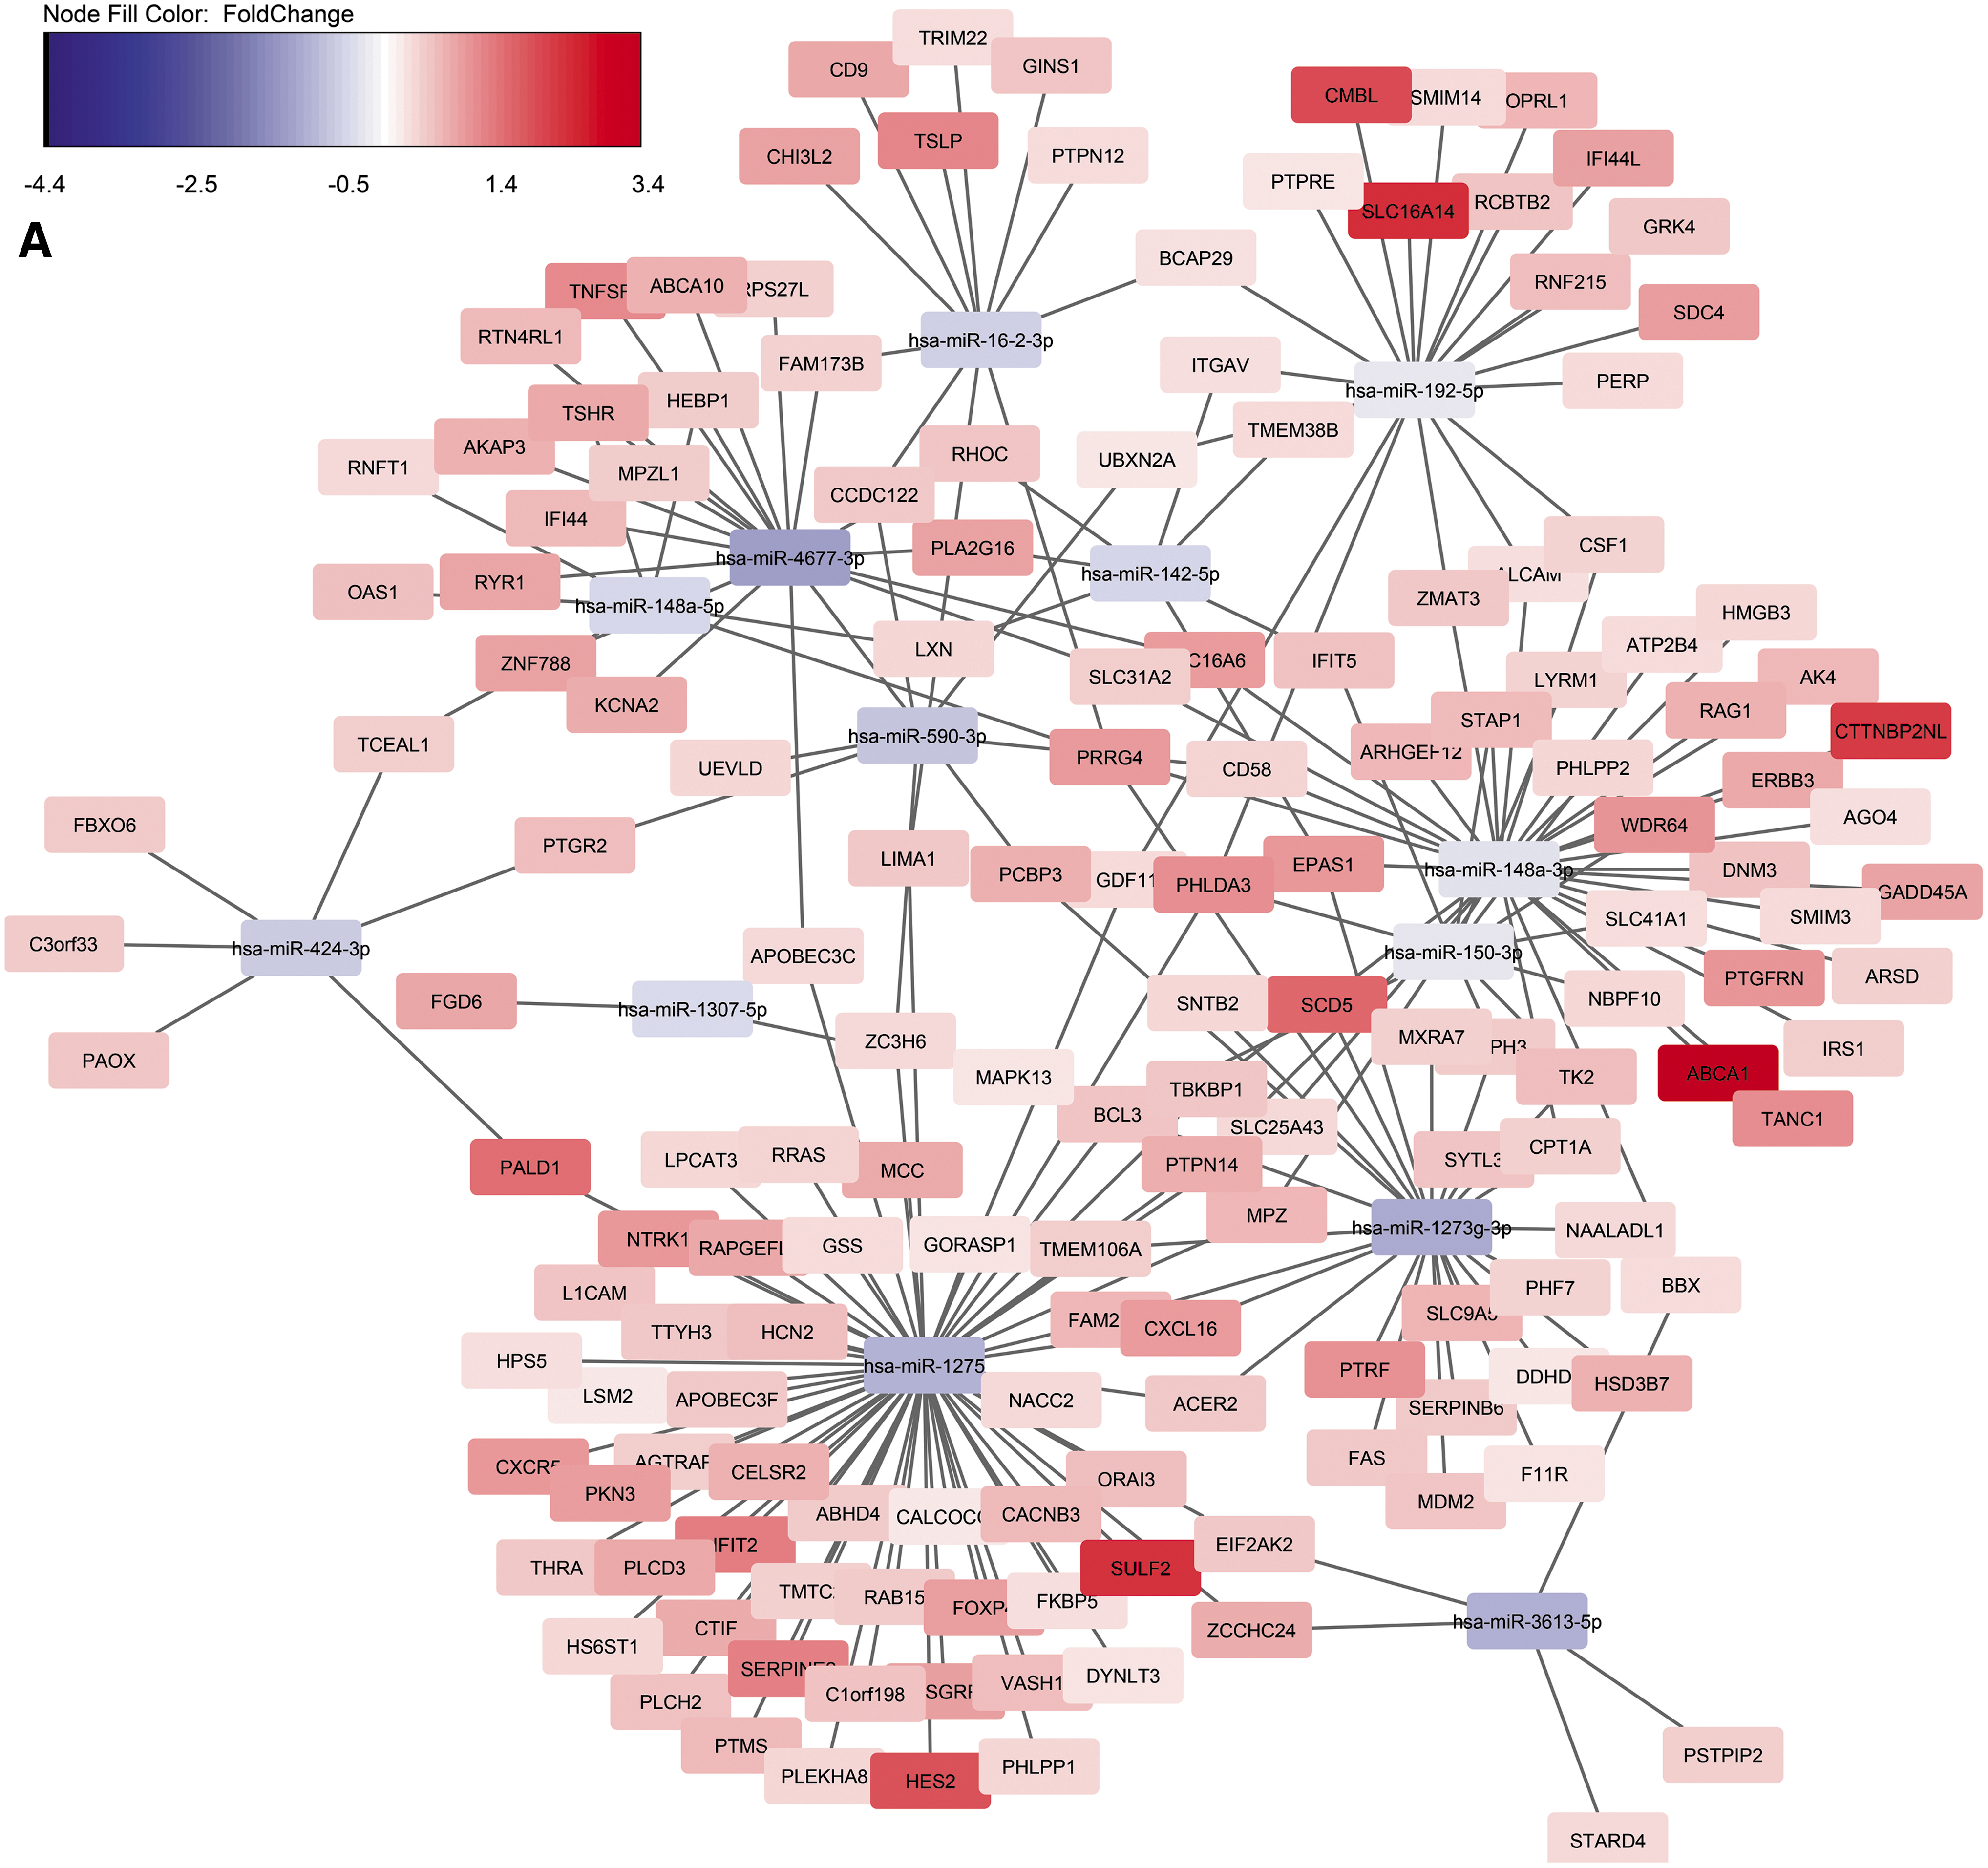
IPA analysis of DEmiRNA targets among the 826 DEGs previously found between latently infected and mock-infected cells. A total of 429 genes were predicted targets for the DEmiRNAs from this study; 248 DEGs had a fold change in the opposite direction compared to the targeting miRNA. The network was constructed using Cytoscape.
A protein interaction network was constructed using the STRING database to determine which of the 248 proteins, whose mRNAs were targeted by miRNAs, are the most biologically relevant. Proteins that have the most connections (highest degrees) in this network can be thought of as the “most influential” and biologically relevant proteins. The top 10 most connected proteins in the network were then evaluated for their relevance to HIV biology. Each of the top 10 proteins has been implicated in HIV latency mechanisms or in known pathways involved in HIV latency establishment or maintenance (Table 2).
The Top Interconnected Proteins in the Search Tool for the Retrieval of Interacting Gene/Protein Network Have Relevance to HIV Infection, Latency, and Pathways That Are Involved in Latency Control
PKC, protein kinase C; P-TEFb, positive transcription elongation factor.
To further elucidate which DEG-regulated processes are more likely to be targeted by miRNAs, we used the fast greedy community search algorithm to identify smaller subnetworks of the 248 DEGs targeted by DEmiRNA (Fig. 3). A hypergeometric test was then conducted to determine which of the subnetworks were targeted by DEmiRNAs at a higher rate than expected by chance (Table 3). Of these subnetworks, specific ones (communities 3, 4, 8, 9, 10, 11, and 12) were determined to be targeted by miRNAs (FDR-corrected p-value <.05). Finally, IPA was used to determine pathways enriched for the proteins present within these subnetworks (Fig. 3). To facilitate pathway enrichment analysis, only the communities with more than six members were selected (communities 3, 4, and 8). In community 3, the top significantly enriched pathway was the p53 signaling—which suggested an additional level of regulation of this pathway in latency by miRNAs.

Biological processes regulated by miRNAs during latency. The fast greedy community search algorithm was utilized to identify subnetworks of the protein interaction network generated from DEG mRNAs targeted with an opposite fold change to the DEG miRNAs. A hypergeometric test was used to determine whether each of these subnetworks is targeted by miRNAs at a higher rate than expected by chance. The pathway analysis using IPA was then conducted to determine which pathways are enriched by the proteins present in the subnetworks. Only networks targeted by more miRNAs than would be expected by chance and communities containing more than six nodes were explored. The pathways listed are the five most significantly enriched (lowest p-value) pathways for each community. mRNA, messenger RNA.
Communities of Proteins Encoded by Differentially Expressed Genes That Are Targeted by Differentially Expressed MicroRNAs More than Expected by Chance
The column entitled “DEmiRNAs targeting the community” is the total number of miRNA to targeted mRNA interactions. Predicted total miRNAs targeting the community is based on miRNet predictions using all tissue types. p-value, hypergeometric test p-value; FDR p-value, FDR-corrected p-value using Benjamini-Hochberg method. Communities that were targeted by miRNAs more than expected by chance are highlighted bold.
DEmiRNA, differentially expressed miRNA.
Validation of DEmiRNA by RT-qPCR
To independently validate dysregulation of miRNAs during latency, four targets were selected to be quantified by RT-qPCR. Our model of HIV latency used cell activation to establish HIV infection; therefore, it was important to validate those miRNAs that were dysregulated specifically in latency, and were not affected the same way by cell activation or productive infection with HIV. We ensured that expression of the selected miRNAs was detectable with RT-qPCR by choosing those miRNAs that had higher read counts in the smRNA-Seq experiment. The resulting list of miRNAs for validation included hsa-miR-4697-3p and hsa-miR-10a-5p (upregulated in latency and downregulated during activation); hsa-miR-497-5p (upregulated in latency to a much greater extent than during activation); and hsa-miR-1275 (downregulated in latency and not affected by activation). These miRNAs were quantified by RT-qPCR across the four conditions that were sequenced. Of these, the expression patterns were confirmed for three out of four miRNAs (hsa-miR-4697-3p, hsa-miR-10a-5p, and miR-1275) (Fig. 4). Among these, hsa-miR-4697-3p upregulation in latency was significant (p = .026) and downregulation due to activation was also significant (p = .0004) (Fig. 4). Upregulation of hsa-miR-1275 during activation was significant (p = .004 for mock infected and p = .013 for infected), although its downregulation in latency did not reach significance in the RT-qPCR experiment. Hsa-miR-10a-5p was slightly upregulated in latency and downregulated during activation (Fig. 4), although none of these signals reached significance.

Validation of miRNA expression by RT-qPCR. Top, selection of the four miRNAs based on the smRNA-Seq experiment for RT-qPCR validation. Fold changes were calculated by subtracting values obtained for miRNA counts per million after variance-stabilizing transformation. Hsa-miR-4697-3p and hsa-miR-10a-5p were upregulated in latency and downregulated during activation; hsa-miR-497-5p was upregulated in latency to a much greater extent than during activation; and hsa-miR-1275 was downregulated in latency and not affected by activation. All differences were significant compared to resting mock-infected samples. Bottom, fold changes from qPCR data derived based on 2(−ΔΔCt) method using resting mock-infected samples as reference. Positive fold changes (upregulation) are FC >1; negative fold changes (downregulation) are 0 < FC <1. Hsa-miR-4697-3p was found to be significantly upregulated, while hsa-miR-10a-5p and hsa-miR-1275 had the same patterns as smRNA-Seq data, but did not reach significance for the comparison between mock-infected and latently infected condition. Hsa-miR-497-5p was not confirmed. Asterisks indicate p < .05. Horizontal dashed lines indicate no change in expression. FC, fold change; smRNA-Seq, small RNA sequencing; RT-qPCR, real-time quantitative polymerase chain reaction.
Validation of divergent expression of hsa-miR-4697-3p and its predicted target CSF2
Hsa-miR-4697-3p was the only miRNA that was validated by qPCR. We therefore searched for its predicted targets in the DEG dataset 24 and identified CSF2, a rare transcript in resting CD4+ T cells that was downregulated in latency. To validate its divergent expression pattern with hsa-miR-4697-3p, we used ddPCR, a sensitive method able to detect rare transcripts. This experiment validated downregulation of CSF2 in latency, compared to mock-infected cells, and upregulation in activated cells, both infected and mock-infected (Fig. 5). Its expression patterns were exactly opposite compared to hsa-miR-4697-3p (Fig. 5).

Validation of divergent expression of hsa-miR-4796-3p and its predicted target CSF2. Top, fold changes relative to resting mock-infected samples generated using smRNA-Seq (this study) and RNA-Seq (White et al. 24 ) datasets. Bottom, fold changes relative to resting mock-infected samples generated from qPCR and ddPCR data. CSF2 was quantified using samples from three of four donors with sufficient RNA available for testing. Y axis is on the log2 scale. Horizontal dashed lines indicate no change in expression. CSF2, colony-stimulating factor 2; ddPCR, droplet digital PCR.
Evaluation of DEmiRNAs in different models of latency
While our study was under analysis, an smRNA-Seq study using different models of HIV latency was published. 47 We took advantage of these additional datasets to evaluate the behavior of miRNA expression in latency across different model systems. López-Huertas et al. used two models of latency, where resting cells were treated with the cytokines IL-19 or IL-7 before and during infection with NL4.3 virus. 47 As a control, they also used infection of untreated resting cells. In each case, DEmiRNAs were identified between infected and mock-infected cells for untreated and IL-treated conditions. 47 Interestingly, the majority of DEmiRNAs in their study were found in cells that were treated with IL-7 (32 DEmiRNAs), while the signal in the other 2 conditions was much less robust (10 DEmiRNAs for cells treated with IL-19 and 8 DEmiRNAs for untreated cells). Three DEmiRNAs were found in common for all conditions, while four DEmiRNAs were common for the two conditions that were treated with the cytokines IL-19 and IL-7. 47
Comparison of these data to our dataset revealed that very few DEmiRNAs were dysregulated in common (Fig. 6). One miRNA (hsa-miR-1307-5p) was found in common between our model and IL-19-treated cells; however, it was modulated in the opposite directions: upregulated in the IL-19 model and downregulated in latency and upregulated in activated cells in this study. Two miRNAs (hsa-miR-210-5p and hsa-miR-150-3p) were dysregulated in common between our model and cells that were untreated prior or during the infection, which resulted in very few HIV integration events. 47 Similarity of the miRNA signatures between our model and the resting cells in the López-Huertas et al.'s study could be indicative of resting cell state in our model after returning to quiescence, while IL-19-treated cells may exhibit low levels of activation. Both the results from this study and the study presented by López-Huertas et al. 47 are consistent with the concept that miRNA dysregulation is dependent on the model. Such observations have been consistent with respect to DEGs identified in different models of HIV latency, 24 as well as responsiveness of different models to latency-reversing agents (LRAs). 48

Comparison of DEmiRNAs between different models of HIV latency. Identified DEmiRNAs were compared between four experiments. Three experiments were published previously (López-Huertas et al. 47 ) and used resting cells without treatment, or cells treated with either IL-19 or IL-7 before and during latency establishment. The fourth experiment was the in vitro model described in this study, where naive cells were expanded by using TCR stimulus before latency establishment. The Venn diagram was constructed using the draw.quad.venn function from the package VennDiagram in R. IL, interleukin; TCR, T cell receptor.
Discussion
This study aimed to determine the contribution of gene expression regulation by miRNA to control latent HIV infection. To this end, we have conducted smRNA-Seq with an in vitro model of HIV latency and mock-infected cells; used several complementary analytical approaches to identify DEmiRNA (Figs. 1 and 4); predicted pathways that are regulated by DEmiRNAs (Table 1); and showed the relationship between DEmiRNAs and protein-coding DEGs (Figs. 2, 3, 5 and Tables 2 and 3).
Several analyses highlighted miRNA regulation of individual host gene targets and pathways implicated in HIV latency establishment and maintenance. Presence of DEGs that are dysregulated in latency in the opposite direction compared to DEmiRNA suggests the possibility that expression of some genes dysregulated in latency is directly controlled by miRNAs. Among these, we identified CSF2, the predicted target of hsa-miR-4796-3p (Figs. 2 and 5). This gene was also identified as one of the top biologically relevant proteins by the STRING analysis (Table 2). While initially CSF2 was described as a gene with relevance to HIV latency in macrophages, 49 CSF2 is responsive to protein kinase C (PKC) agonists in primary CD4+ T cells 50 and may be involved in regulation of HIV expression in latency through this pathway.
Other protein-coding genes whose expression was dysregulated in latency in the opposite direction from miRNA were MDM2 proto-oncogene (MDM2), PH domain and leucine-rich repeat protein phosphatases 1 and 2 (PHLPP1 and PHLPP2), and the members of the heat shock protein family A (Hsp70; HSPA1A; and HSPA2) (Table 2). MDM2 is a member of the p53 signaling pathway, which was previously linked to the establishment of HIV latency, 24 and is also a regulator of HIV replication in nonpermissive target cells by degradation of the accessory protein Vif. 51 PHLPP1 and PHLPP2 are involved in regulation of the Akt and PCK signaling pathways, 52,53 both of which have a role in regulation of HIV latency. 54,55 Finally, the heat shock proteins Hsp70 are important components of the complex with cyclin-dependent kinase 9 (CDK9), which plays a role in folding and stabilization of the Cdk9 protein and production of mature Cdk9/cyclin T1, the positive transcription elongation factor (P-TEFb) complex. 56
Functional analysis of the predicted miRNA targets identified pathways that have previously been implicated in HIV latency, including p53 signaling, 24 Wnt signaling, 40 MAPK signaling, 41 JAK-STAT signaling, 42 mTOR signaling, 43 T cell receptor signaling, 44 and regulation of actin cytoskeleton 45 (Table 1). Identification of greedy communities for DEGs targeted by miRNAs allowed for an additional level of assessment of these pathways to determine which ones are targeted by miRNAs more likely than expected by chance. (Fig. 3). This analysis strengthened our understanding of regulation of the p53 signaling pathway by miRNAs during latency.
While in vitro model systems are useful for studying HIV latency because they contain a higher proportion of latently infected cells compared to that observed in vivo, a common limitation of these systems is the short-term culture and a short-term latent infection. The field has developed multiple models 48 in which latency is established through various mechanisms, and results from gene expression studies depend on the model system selected. 11,24,57,58 Comparison of DEmiRNAs identified using different models of HIV latency (Fig. 6) is consistent with this observation.
Other methods that do not involve latency models have also been used. For example, Chiang et al. 16 profiled miRNA expression in activated CD4+ T cells and used a hypothesis-driven approach to identify miRNAs that regulate HIV expression through Cyclin T1. One of the miRNAs, hsa-miR-150, was shown to be downregulated in activated CD4+ T cells 16 and during T cell differentiation. 59 Moreover, hsa-miR-150 was downregulated in PBMC of ART-naive persons with HIV 60 and in the intestinal lamina propria leukocytes in the course of SIV infection. 61 Our observation that this miRNA was the most downregulated one in activated cells (Fig. 1) validates consistency of our in vitro system with prior observations in vivo. The discrepancies between DEmiRNAs identified in our study and that by Chiang et al. 16 could be explained by our focus on miRNA expression profiles indicative of HIV latency and not T cell activation.
Whether miRNAs, which are dysregulated in latency and identified in this study, can serve as host targets for latency reversal remains an important question. López-Huertas et al. recently suggested that knocking down expression of miRNAs that were upregulated in latency did not result in HIV reactivation. 47 Different model systems respond variably to the LRAs 48 ; therefore, it is possible that responsiveness to miRNA knockdowns may differ across models as well. The combined results from these studies suggest that miRNA knockdown screens across different model systems may be a valuable approach to determine usefulness of miRNAs as targets for latency reversal. Ultimately, their function will need to be verified using T cells ex vivo from people with long-term HIV infection and successful drug-induced suppression.
Conclusions
This exploratory study predicted many targets of DEmiRNAs among DEGs, when comparing the conditions of HIV latent and mock infection. In addition, we have identified smaller selected subsets of DEGs that may be targeted by miRNAs more frequently than would be expected by chance. These studies have further explored the biology of HIV latency through the identification of miRNAs, which likely contribute substantially to regulation of HIV expression during latency. The p53 signaling pathway, with a previously demonstrated role in establishment of HIV latency, 24 was found enriched for DEGs, 24 which were predicted targets of DEmiRNAs. This study therefore provides a mechanistic insight into regulation of the p53 pathway by miRNAs that may contribute to the establishment of latency. Future studies will be needed to validate the predicted DEmiRNA/DEG pairs and the role of these interactions in regulating HIV latency establishment and reactivation.
Sequence Data
Raw smRNA-Seq data and the processed file containing the matrix of counts are available at the GEO database, accession number GSE153094.
Footnotes
Authors' Contributions
C.H. Woelk, B. Macarthur, C.A.S., A.B., and N.B.-B. designed the research; A.M., B. Moesker, and A.B. performed the experiments; A.I.H., J.W., C.H. White, and N.B.-B. analyzed the data; A.I.H. and N.B.-B. wrote the article. All authors contributed to data interpretation and article editing.
Acknowledgments
We acknowledge the support from the San Diego Center for AIDS Research (CFAR), especially the Genomics and Sequencing Core, for providing access to the instruments to conduct miRNA quantification using RT-qPCR. The authors acknowledge the use of the IRIDIS High Performance Computing Facility and associated support services at the University of Southampton in the completion of this work as well as the support of the University of Southampton Bioinformatics Core Facility. The views expressed in this article are those of the authors and do not necessarily reflect the position or policy of the Department of Veterans Affairs or the U.S. government.
Author Disclosure Statement
All authors declare no competing financial interests.
Funding Information
We acknowledge the support from the San Diego CFAR (P30 AI036214). This work was supported by the National Institutes of Health research grant to C.H. Woelk, B. Macarthur, and C.A.S. (R33 AI104282), by grant from the Bill & Melinda Gates Foundation through the Grand Challenges Explorations initiative to A.B. (OPP1045955), and the James B. Pendleton Charitable Trust. N.B.-B. was supported, in part, by a Career Developmental Award-II (IK2 BX002731) from the Office of Research and Development, Veterans Health Administration.