
Abstract
The human immunodeficiency virus (HIV) is a viral infection that destroys the human immune system resulting in acquired immunodeficiency syndrome (AIDS). The Zambia HIV prevalence rate (11.3%) remains among the highest in the sub-Saharan Africa. In the treatment of HIV-naive patients, a problem that relates to the transmitted drug resistance mutation strains (TDRMs) occurs in the administration of antiretroviral (ARV) drugs. To address this problem, we propose the use of transition probabilities when prescribing a switch from the first-line to the second-line or to the third-line regimen on the ARV drugs combination. We formulate a statistical technique to determine an optimal ARV drugs combination. To compute a transition probability matrix chart on ARV drugs combinations of the first-line and second-line regimens, we apply a beta-binomial hierarchical model on HIV data. The transition probability matrices corresponding to the ARV drugs combinations TDF+ETC+NVP, TDF+FTC+EFV, AZT+3TC+NVP, AZT+3TC+EFV, D4T+3TC+NVP, and D4T+3TC+EFV provide an upper triangular matrix of probabilities. We observe a higher probability of remaining in the same regimen state than moving to another state. A transition probability chart provides information on the most effective combination to prescribe to a patient in the presence of transmitted drug resistance mutation (TDRM) test results. The transmission probabilities play a major role in aiding the physicians make an informed decision to prescribe an optimal ARV drugs combination. We suggest a TDRM test to be carried out to all newly diagnosed HIV individuals before prescribing any of the ARV drugs combination.
Introduction
The introduction of highly active antiretroviral therapy (HAART) as treatment for HIV infection has greatly improved mortality and morbidity for adults and children living with HIV around the world. 1 According to Spaulding et al., 1 tenofovir (TDF) is superior to zidovudine (AZT) in terms of immunologic response and adherence and less frequent emergence of resistance. It remains unclear how much the other drugs in the regimens contributed to these findings. Treatment failure remains a significant challenge particularly for the highly treatment-experienced patients, despite the success of antiretroviral (ARV) drugs combination in improving clinical outcomes. In addressing the problem, Boyd and Hill 2 provided guidance in selecting an active tolerable drug combination that promotes a reasonable quality of life, full adherence, and a durable treatment response.
According to Rodes et al., 3 the number of HIV-infected individuals with previous multiple treatment failures have been increasing with time. The selection of drug-resistant viruses comprise the success of ART in patients with these characteristics. Maintaining treatment HIV-infected individuals failing virologically and harboring drug-resistant viruses might ameliorate immunological deterioration until new drugs became available. 3 The prescription of efavirenz to non-nucleoside reverse transcriptase inhibitor (NNRTI)-naive patients among heavily pretreated patients is associated with a good virological response, whereas a high baseline viral load, a large number of protease inhibitor (PI) resistance mutations, and nelfinavir prescription at baseline are associated with a poor virological response. 4 Lamivudine (3TC) and emtricitabine (FTC) are guideline choices for combination of a HAART, where the former has a shorter intracellular half-life than the latter, which may be more likely to lead to the development of drug-resistant HIV variants. No evidence of an increased risk of development of M184V and K65R in patients exposed to 3TC is established. 5 According to Marcelin et al., 6 emtricitabine and lamivudine showed differing resistance profiles when administered in combination with tenofovir disproxil fumarate and either efavirenz or a ritonavir-boosted PI. However, the prevalence of the M184V/I resistance mutation was significantly lower in patients who received emtricitabine and tenofovir disoproxil fumarate than in those who received lamivudine and tenofovir disoproxil fumarate.
Although HAART has been associated with improved clinical response to treatment, issues of adherence and viral resistance are major challenges limiting its success. 7 Further studies evaluating the effects and safety of TDF+FTC+EFV as the first-line treatment for patients with HIV are needed. The need to understand the occurrence of ARV-related adverse events among patients receiving the second-line ARV drugs combination is important in preventing switches to more limited and expensive third-line regimens. 8 In ART-eligible pregnant women with HIV infection, ART is a safe and effective means of providing maternal virological suppression, decreasing infant mortality, and reducing mother-to-child transmission. 9
According to Bonura et al., 10 continuous surveillance of resistance-associated with mutations in ARV-naive HIV-1-infected individuals is necessary to promptly recognize any significant variation that may affect their clinical management. It allows for planning, optimizing the first-line regimen, and estimation of the evolution of the genetic heterogeneity of HIV-1-resistant strains. Despite considerable uncertainty in the removal probability estimates for resistant strains, patients infected with sensitive strains transmit the disease less than patients infected with resistant strains after diagnosis do. 11 According to Lu et al., 12 viral load, symptoms, CD4 counts, transmission route, and the duration of ART are associated with HIV-1 DR. Resistance to ARV drugs can complicate the management of HIV-1 infection and impair control of its spread. To limit the local spread of TDF and to optimize HIV-1 therapy, screening for it should be considered. 13 Test-and-treat programs are central to the global control of HIV but transmitted drug resistance threatens the effectiveness of these programs. 14
A second-line regimen needs to be prepared in the national program to replace a fixed-dose combination of stavudine, lamivudine, and nevirapine, used extensively as an ARV regimen in developing countries. Despite its affordability, the fixed-dose combination has high chance of virological failure. Early detection of virological failure may provide more options and better treatment outcomes. 15 Transmitted drug resistance mutations (TDRM) can compromise treatment effectiveness in patients initiating ART and the prevalence can vary in different clinical settings. Regular monitoring of TDRM should be encouraged, especially with the scale-up of ART at higher CD4 levels. 16
Although the cost of HIV drug resistance (HIVDR) testing is high, the cost of second-line ART in developing countries is 4–5 times higher than that of first-line ART. Therefore, it is important to investigate what level of TDF will make routine HIVDR testing before starting ART cost-effective. 17
The beta-binomial model has high asymptotic relative efficiency for most of parameter space and offers an attractive and viable alternative to computing the maximum likelihood estimator. 18 Bayesian estimation for probability treatment failure provides complete distributions of means of groups and their differences, standard deviations (SDs) and their differences, credible intervals for combinations means and their differences, and data normality. A Bayesian posterior probability distribution allows for the extraction of information of interest such as mean, SD, medians, credible interval, and highest density intervals. We use the distribution in obtaining summary statistics for each drug chain combination.
TDRM strains in the treatment of HIV-naive patients
The zidovudine and tenofovir cross-resistance testing is rarely available in resource-limited settings. According to Tang et al., 19 it is critical to identify the cross-resistance patterns associated with the first-line stavudine failure. Whether patients switch off from the stavudine (d4T) because of virological failure or to avoid long-term toxicities, TDF will be more advantageous than AZT for the majority of patients in regions where genotypic resistance testing is not available. Such unavailability restricts the scope of switching to the World Health Organization (WHO)-recommended standard second-line combinations without HIVDR testing in routine clinical practice. 20 In addition, first-line ART failure exhibits high-level NRTI resistance with potential lower efficacy of AZT compared with TDF.
The WHO 21 describes transmitted drug resistance mutation strains (TDRMs) as a significant ARV administration challenge that is prevalent in the sub-Saharan African region. The current literature review identifies TDRMs to be a considerable challenge on ARV administration. 22 Using sequencing analysis, investigation of the genotypic of transmitted drug resistance (TDR) in ART-naive individuals in Surabaya, Indonesia, revealed no primary mutations associated with drug resistance to integrase inhibitors were detected. 23 The introduction of two new NNRTIs in the past 5 years and the identification of novel NNRTI-associated mutations have made it necessary to reassess the extent of phenotypic NNRTI cross-resistance. 24
Materials and Methods
Components of the Bayesian methods
We used data from HIV-naive patients on the first-line and the second-line regimens in Zambia (IRB00001131). Part of covariates on individual patients collected within a period of 48 weeks were age, gender, CD4 count, prescribed regimen and the outcome, commencement date on ARV, time of failure, weight, number of patients on each combination, and number of failures. We computed probabilities of treatment failure for each combination of the ARV drugs combination using a beta-binomial hierarchical model. The perspective of Bayesian methods combined the likelihood function with the earlier distribution through Bayes theorem to produce the posterior distribution. We drew inference based on quantitative information obtained using the posterior distribution.
Construction of a three-stage beta-binomial hierarchical model
Let data yi (i = 1,2,…,ni ) be independent and identically distributed and drawn from a binomial distribution, yi ∼ BIN(ni , ϑi ). Suppose ϑi (i = 1,2,…,ni ) a parameter governing the data-generating process is exchangeable from a standard population with a Beta distribution, ϑi ∼ Beta (a,b) governed by hyperparameters, (a, b) ∼ ϕ(a, b). The ϑi and ϕ(a, b) are random parameters where a and b are assumed known. Let p be a generic symbol for a density function. Consider a likelihood function p(yi |ϑi ,ϕ), a prior distribution p(ϑi |ϕ) and a hyperprior distribution p(ϕ), which produce the joint posterior distribution p(ϑi , ϕ|yi ). We use a beta-binomial hierarchical model to estimate the probability of treatment failure of the ARV drugs combination of the first-line and the second-line regimens. Hierarchical models are those with hierarchical structure to the parameters and potentially to the covariates, if the model is a regression model. The models are useful because they allow for modeling of interactions between observed variables through the use of latent variables.
A three-stage hierarchical model follows:
Stage I: Consider the likelihood function p(yi | ϑi,ϕ) with prior distribution p(ϑi |ϕ) where the likelihood function depends on ϕ only through ϑi . Any or all of y, ϑ and ϕ may be vectors, but for convenience we suppress this in the notation. We express the joint sampling distribution as
Stage II: We aim at computing the joint posterior distribution p(ϑiϕ|y). The joint posterior distribution via the Bayes' theorem has the form
where ϕ is a hyperparameter with hyperprior distribution p(ϕ) and based on the law of total probability,
Stage III: The final stage of the beta-binomial hierarchical model provides the joint posterior distribution as
which is proportional to the product of the likelihood function, the prior distribution and the hyperprior distribution, ignoring the constant denominator in (2). The use of the hyperprior distribution provides more information, leading to opinions that are more accurate on the behavior of a parameter.
Consider the probability that a patient's switch from the first-line regimen to be ϑi . The probability of the regimen failure for combination i is the quantity of interest in the analysis. The complement of this probability is the kernel probability of a patient remaining on the first-line regimen. We obtain a joint probability model by combining the prior distribution Beta(a, b), the likelihood function p(yi |ϑi , ϕ) and the hyperprior distribution p(ϕ). Suppose N = Σni . From the full model
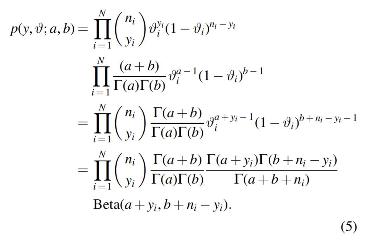
From (5), we recognize that
Equation (6) is an interplay between the data yi
and the hyperparameters a and b in forming the posterior distribution where for each
The shape of the population of HIV patient's distribution requires estimates of the parameters of a and b. Using the properties of the beta distribution, the expected value and variance are, respectively,
We considered the historical data to create a prior distribution and a plausible hyperprior distribution for the parameters of a set of observations. We aim at estimating ϑ, the probability of virological failure owing to TDRMs in HIV-naive patients who received ARV drug combinations. According to Seu et al., 25 4% of patients initiated with ART develop TDRMs with a SD of 0.1. It assumes a binomial distribution model for the number of patients who experience TDRMs given ϑ. We select a prior distribution for ϑ from the conjugate family, ϑ∼Beta (a, b) and the beta-binomial hierarchical model in the estimation. The TDRMs probabilities ϑ vary because of differences in patients and the socioeconomic status among the communities. Using (7), the values for a and b that correspond to the given values for the mean and SD provide the benefits as a = 0.11 and b = 2.73. In estimating the probability of TDRMs, a binomial distribution model was fitted with a prior of the Beta distribution and a Gamma distribution of hyperprior. WinBUGS 26 software was used to calculate the posterior distribution through the Markov Chain Monte Carlo (MCMC) simulations of the Gibbs sampling algorithm. There are two main issues to consider when using the MCMC algorithm namely the convergence and the efficiency.
Convergence: It is essential to know how quickly the distribution of ϑ(t) approaches p(ϑ|y).
Efficiency: It is necessary to know how well the distributions of p(ϑ|y) are estimated from ϑ(t).
An MCMC algorithm was run using the data on treatment failure of the first-line regimen. The WinBUGS syntax code (Appendix A1) used to implement the Bayesian model provided the full MCMC chains for each parameter. These chains form the basis for estimating the parameters of the posterior distribution and their associated statistics (means, medians, SDs, and credible intervals, etc.). To obtain valid inference from the posterior draws from the MCMC simulation, we assess convergence of the MCMC chain using diagnostic plots namely history, density, Brooks, Gelman and Rubin plots, cross-correlation matrix, and auto-correlation plots.
Results
The first-line regimen on the ARV drugs combination
We ran an MCMC chain with an adaption period of 10,000 iterations with the start sample at 10,001 to 40,000 for each of the six nodes. Table 1 presents summary statistics on data for the first-line regimen on ARV drugs combination namely the mean, SD, Monte Carlo standard error (MC error) of the posterior sample mean, point estimate 2.5% percentile, median, and the point estimate 97.5% percentile.
Summary Statistics for the First-Line Regimen on Antiretroviral Drugs Combination
MC error, Monte Carlo standard error; SD, standard deviation.
The calculated values in Table 1 show that MC error <1% −5% of posterior SD as the rule of the thumb in Bayesian data analysis have been satisfied. In general, a mean or median of the posterior samples for each parameter of interest as a point estimate 2.5% and 97.5% percentiles of the posterior samples for each parameter gives a 95% credible posterior interval. The interval is within which the parameter lies with probability 0.95. The results in Table 1 indicate that the posterior distribution of P, the rate of treatment failure owing to TDRMs is approximately normal with μ = 0.04124 and σ = 0.01779 for theta (1). These numbers are computationally accurate to about ±8.874E-5 (MC error). Consequently, we report μ = 0.041 and σ = 0.018 with median of 0.03873 and a credible interval of [0.014, 0.083], which does not contain zero.
We checked the convergence of the fitted model using plots and the deviance information criteria (DIC). Figure 1 presents the Brooks, Gelman, and Rubin 27 plots of the parameter theta (bgr) obtained using the WinBUGS software. Brooks–Gelman–Rubin scale reduction factor is one of the convergence. The start iteration ranged from 10,101 to 17,500 for each of the six theta chains.

The Brooks, Gelman, and Rubin Plots of the Parameter Theta (Bgr).
The Brooks, Gelman, and Rubin (bgr) plots generate multiple chains that start from different locations and assess convergence by comparing within- and between-chain variability. For convergence, the plot concentrate at ∼1 is denoted in red, green for between-chains variability (pooled), and plotting blue (average) for within-chains variability. The chains are stationary and similar as a check of convergence. Convergence is finalized with an increased sample size after the burn-in iterations and a sufficient number of stationary samples.
Figure 2 presents density plots of theta for the first-line regimen that are smooth kernel density estimates for each theta, an estimate of the posterior density that we are interested in. A sample of size 40,000 was applied for each density plot.

The density plots of theta for the first-line regimen.
The density plots of theta for the first-line regimen are consistent with the summary statistics.
Model checking
A Bayesian measure of model complexity and fit is the DIC which we use in model checking. Consider the deviance defined as −2 * log (likelihood) where the likelihood is p(y|ϑ) including all the normalizing constants comprising all stochastic nodes given y and theta as the immediate stochastic parents of y. The output for the DIC tool gives the posterior mean of the deviance, denoted as Dbar, a point estimate of the deviance denoted as Dhat obtained by substituting in the posterior means and
We make comparison of the first-line regimen using DIC for the beta-binomial model. The computation produced the posterior mean Dbar = 25.683, Dhat = 19.579, pD = 6.105, and DIC = 31.788. The DIC for residual analysis produced Dbar = 35.179, Dhat = 34.197, pD = 0.983, and DIC = 36.162. The DIC for model adequacy is 31.788, whereas for residual analysis it is 36.162.
The second-line regimen on the ARV drugs combination
The second-line regime compared outcomes of the second-line ART containing and not containing TDF in cohort studies from Zambia and the Republic of South Africa (RSA). 28 Patients on TDF-containing the second-line ART were less likely to develop treatment failure than patients on other regimens for TDF to be an effective component of the second-line ART in southern Africa. Despite Zambia being the first African country to introduce TDF as a component of the first-line ARV drugs on a wide scale, there is no available literature on the treatment failure of the second-line regimen. 29 Patterns of drug substitutions and regimen switches from stavudine (d4T) and zidovudine (AZT) regimens have been well described but data on TDF are more limited. 30 According to Gelman, 31 regimen switches and virological suppression were similar for patients exposed to TDF, d4T, and AZT, suggesting all regimens were equally effective.
We consider a noninformative prior in determining the prior distribution of the beta-binomial hierarchical model. A prior distribution p(ϑ) combines with the likelihood function p(y|ϑ) to define a proper joint distribution p(y,ϑ). A proper non-normalized posterior distribution as define by Bayesian inference has the form
where dϕ = h'(ϑ)dϑ and |.| denotes the determinant. According to Gelman,
31
Jeffreys' principles are that any rule for determining the prior distribution p(ϑ) should yield comparable results if applied to the transformed parameters. The prior distribution becomes a critical part of the model specifications when the sample size is small. Consider Jeffreys' noninformative prior distribution on the parameter space that is proportional to the square root of the determinant of the Fisher information matrix
where I(ϑ) is the Fisher information for ϑ. The I(ϑ) is an indicator of the amount of information brought by the observation about ϑ. Jeffreys prior distribution is invariant under parameterization as illustrated at I(ϑ), ϑ = h
−1(ϕ). Thus using (9),
Computing Jeffreys' prior distribution for ϕ directly produces the same answer as computing the Jeffreys' prior distribution for ϑ. Jeffreys' prior distribution is
Results of the second-line regimen on the ARV drugs combination
Consider using Jeffreys' noninformative prior distribution of Beta (½, ½) for the second-line regimen using WinBUGS at a = 0.5 and b = 0.5. Table 2 presents summary statistics on data for the second-line regimen on the ARV drugs combination namely the mean, SD, MC error, point estimate 2.5% percentile, median and point estimate 97.5% percentile.
Summary Statistics for the Second-Line Regimen on Antiretroviral Drugs Combination
Results in Table 2 show that the nodes ranged from 1 to 5 with corresponding start sample ranging from 100,001 to 200,000. The mean value was maximum at node 2 and decreased to 0.1364 at node 5. Results from the plots obtained using the WinBUGS indicate the posterior distribution of P (the rate of treatment failure owing to TDRMs) to be approximately normal. We report μ = 0.2275 and σ = 0.1207, with median of 0.2112 and a credible interval of [0.0441, 0.5020] which does not contain zero.
Model checking for the second-line regimen
We compare the Bayesian model of the second-line regimen on the ARV drugs combination using DIC for the beta-binomial model. The DIC value = 18.289 corresponding to Dbar = 17.335, Dhat = 16.382, and pD = 0.954 confirms the adequacy of the model. We denote Dbar = post. Mean of −2 logL and Dhat = −2LogL at post, mean of stochastic nodes.
Treatment of HIV as a unique stochastic process with Markov chain properties
Treatment of HIV pandemic using the ARV drugs combination qualifies as a stochastic process. As a time sequence representing the evolution of some system constituted by a variable whose change is subject to a random variation, the process satisfies the Markov properties. Hence, treatment of HIV using the ARV drugs combination is a Markov process. This process is homogeneous in space because the transition probability depends on the difference between those state values. This chain is not ergodic because it cannot go to every state and it is also not irreducible and periodic. However, the chain has an absorbing state.
Let P be a k × k matrix with elements {pi,j
:i,j = 1,2,…,k} of a random process (y
0, y
1,…) with finite state space, S = {s
1,s
2,…,sk
}. The process is a Markov chain with transition matrix P if for all n, i, j ∈ {1,…k} and i
0,…,in
−1 ∈ {1,…,k }, there is
It implies that the future depends on the past through the present. The final goal in the use of Markov chains is the property of having a stationary distribution as Yn approaches the stable distribution as n increases.
The transition probability matrix of patients switching regimen
We consider a transition probability matrix P with elements {pi,j
:i,j = 1,2,3} of a patient switching regimen from the first-line to the second-line regimen for each of the ARV drugs combination. A patient in state i will remain in state i with a given probability pi,i
and a patient switching regimen from state i to j with probability pi,j
, after initiation of ART. In the case of Zambia, a patient can switch the regimen from the first line to the second line and from the second line to the third line. There is no fourth regimen available when a patient fails the third-line regimen. For each ARV drugs combination, consider a corresponding transition matrix P with three states as
The Markov chain remains in state 1 with probability p1,1 when in state 1. It moves to state 2 with probability p 1,2 and to state 3 with probability p 1,3, and so on. The use of the ARV drugs combination is such that, if one combination is given from the first-line regimen and virological failure is experienced, a patient cannot be given another combination from the first-line regimen. The patient has therefore to switch to the second-line regimen.
The pi ,1 column presents the maximum a posterior (MAP) estimator obtained from the posterior distribution of each ARV drugs combination. For instance the pi ,1 denotes the MAP, the highest posterior density for the first-line regimen that offers the maximum tolerable combination. Taking pi ,2 as the MAP of the second-line drugs combination, we calculate summary statistics for the first-line and the second-line regimen to provide a probability transition matrix. We consider six ARV drugs combinations namely TDF+FTC+NVP, TDF+EFT+EFV, AZT+3TC+NVP, AZT+3TC-EFV, D4T+3TC+NVP, and D4T+3TC+EFV in computing the transition probability matrices presented in Figure 3. Figure 3 presents the transition probability matrix for each of the six ARV drugs combination for the first-line and the second-line regimen.
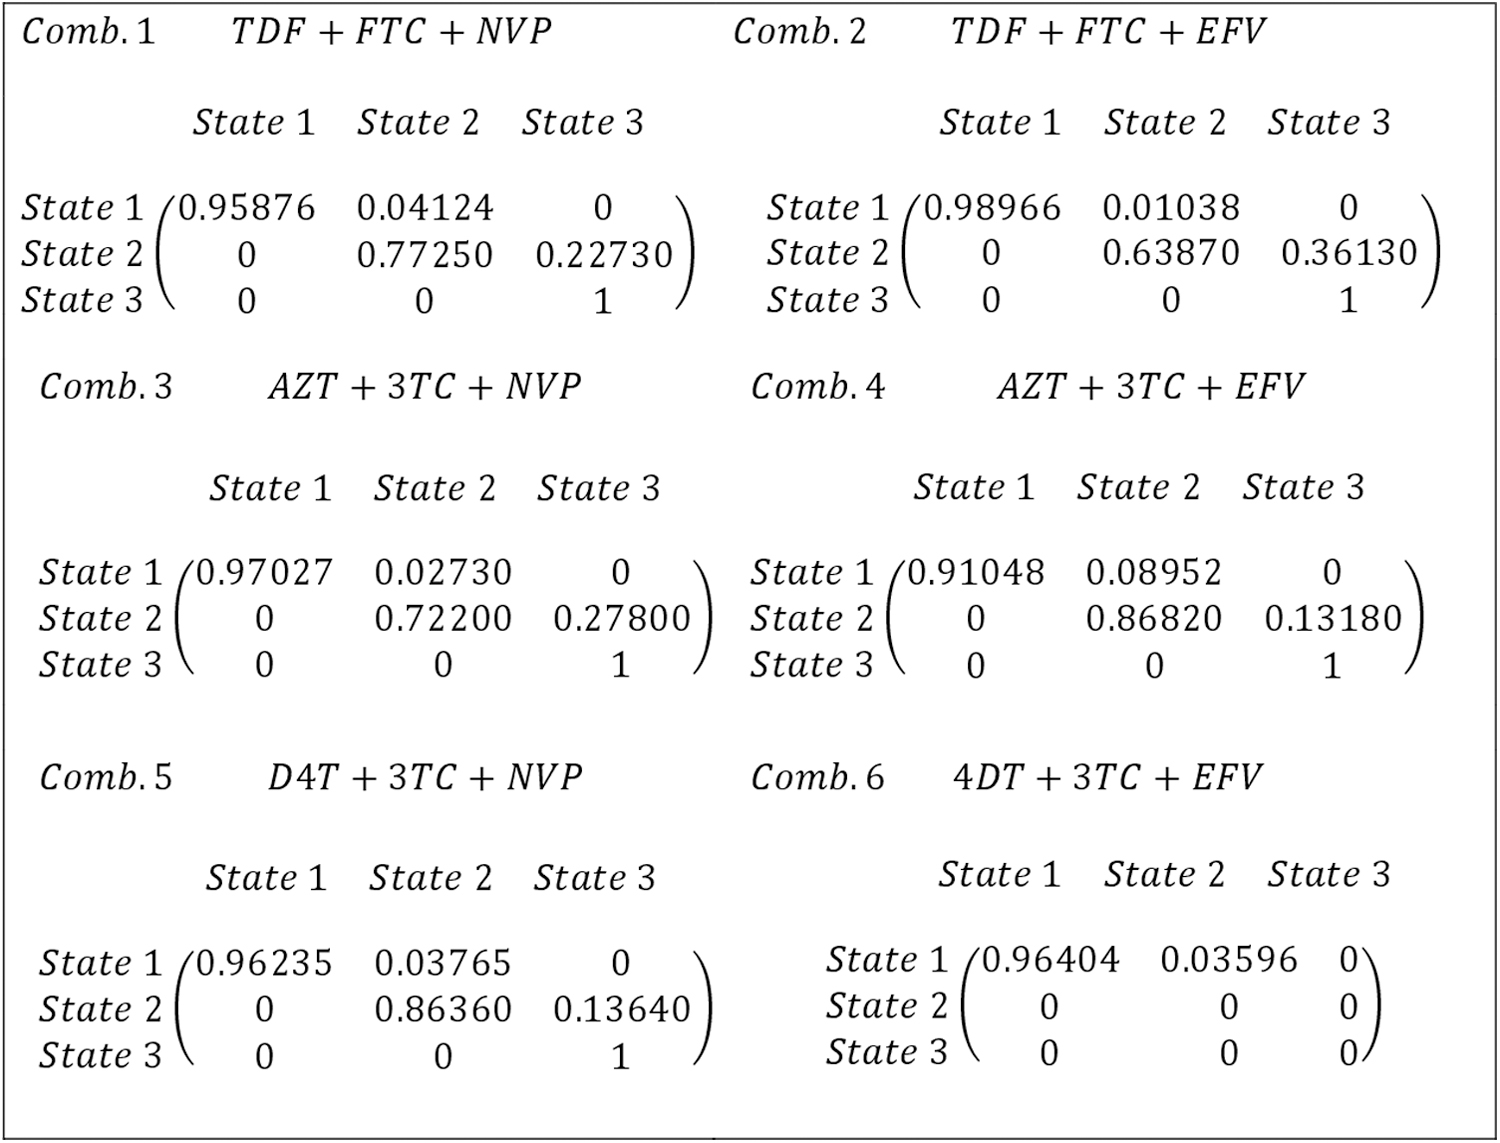
The transition probability matrices for the first-line regimen of the ARV drugs combination. ARV, antiretroviral.
Each of the transition probability matrix corresponding to the six ARV drugs combinations provides an upper triangular matrix. The probability of remaining in the same state is higher than that of moving to another state. The probability deceases as the chain state moves from state 1 to state 2, and state 2 to state 3. There is no recorded direct move from state 1 to state 3 in all the states and from either state 2 or state 3 in case of the ARV drugs combination 6. The only recorded moves were from state 1 to state 2 and from state 2 to state 3. The rest remained in the same state with high probabilities. Figure 4 presents a schematic diagram of Markov chain for the first-line and the second-line regimen for the TDF+FTC+NVP drugs combination.
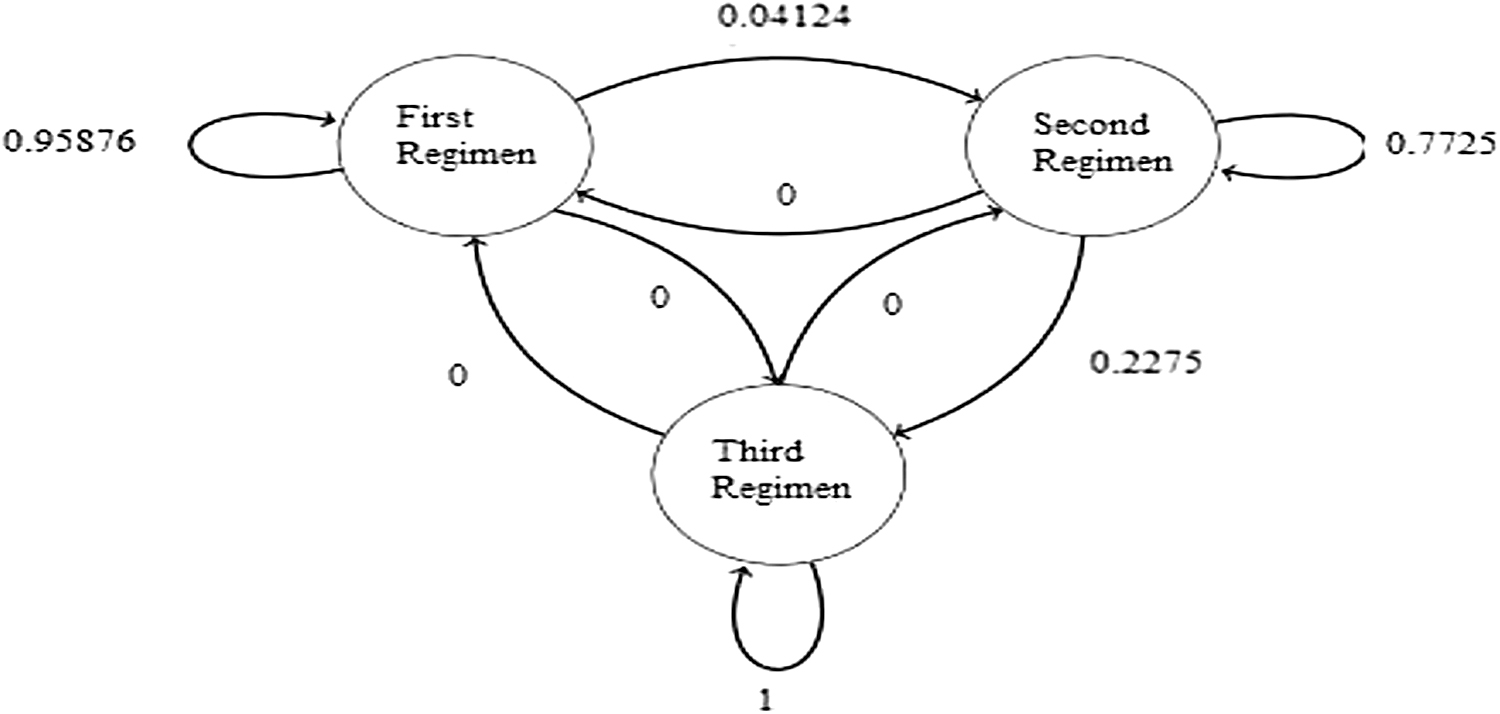
A schematic diagram of a Markov chain for the first-and second-line regimen for the TDF+FTC+NVP drug combination.
Discussion
The plots and DIC in Figure 1 indicate well-mixed MC error chains with no evidence of drift from the fitted model. This phenomenal confirms that all parameters converged to a distribution. All parameters converged according to the auto-correlation statistic or plots and cross-correlation plots (Fig. 2). The estimated values from the posterior distributions were used in computing the probability transition matrix for each of the ARV drugs combination. Results from the Brooks, Gelman, and Rubin plots and the history and density plots of the parameters theta for the second-line regimen confirm existence of evidence of convergence to the stipulated distribution. The density plots, which are smoothed kernel density estimates for parameters theta show consistency with the computed summary statistics given in Table 2. Similarly, the auto-correlation plots and the cross-correlation plots confirm the convergence of parameters.
The results in Figure 3 indicate high probability of remaining in regimen 1. The cost and insufficient advice from doctors regarding change of regimen are some of the reasons the patients remained in the same chain state, especially in state 1. For example, consider the case of Zambia taking TDF+FTC+EFV drugs combination that comes in a tablet form and is easily provided by the Ministry of Health. The formulation of TDF+FTC+EFV drugs combination where each tablet contains,
300 mg tenofovir disoproxil fumarate (Brand name, Viread). (TDF)—NRTI
200 mg emtricitabine (brand name: Emtriva). (FTC)—NRTI
600 mg efavirenz (brand name: Sustiva). (EFV)—NNRTI.
Table 3 presents the TDRMs for NNRTI and NRTI groups of classes of the ARV drugs combination used in Zambia for the treatment of HIV.
The Transmitted Drug Resistance Mutation Strains for Non-Nucleoside Reverse Transcriptase Inhibitor and Nucleoside Reverse Transcriptase Inhibitor Groups
NNRTI, non-nucleoside reverse transcriptase inhibitor; TDRMs, transmitted drug resistance mutation strains.
A patient cannot be given a combination containing TDF and EFV if the TDRMs test shows the presence of K101 E and 115Y F strains in the patient. The first-line regimen combinations used in Zambia are (1) TDF+FTC+NVP, (2) TDF+FTC+EFV, (3) AZT+3TC+NVP, (4) AZT+3TC+EFV, (5) D4T+3TC+NVP, and (6) D4T+3TC+EFV. Based on results in Table 3, combinations 1, 2, 4, and 6 cannot be prescribed to the patients who got the indicated strains. An alternative option available to these patients' remains either combinations (3) or (5). To choice between the two combinations requires use of the transition probabilities where the combination with the highest probability of success is prescribed to the patient. For example, we preferred AZT +3TC+NVP because it has success probability of 0.9703 compared with D4T+3TC+NVP with success probability of 0.9624. The transition probabilities play a major role in guiding the physicians make an informed decision in respect of prescribing an optimal drug combination. Availing transition probability matrices will lead to timely and effective interventions required in the administration of the ARV drugs combination. As indicated by Aliyu et al., 33 periodic assessment to determine HIV/AIDs quality of care lead to rapid scale-up of services, which have universal coverage in resource-limited settings.
Conclusion
TDRM continues to pose a severe challenge in the treatment of HIV in the sub-Saharan Africa. The transition probability matrices of the ARV drugs combination aids the physicians to make an informed decision on the most effective ARV drugs combination to prescribe to a patient in the presence of TDRM test results. Our findings suggest that all newly diagnosed HIV individuals should have a TDRM test before any prescription on the ARV drugs combination is made. Based on the transition probabilities, the physicians are assured of success upon prescribing an optimal ARV drugs combination to the HIV patients.
Study Limitations
Secondary data were used in model building, hence authenticity and accuracy of the data cannot be guaranteed. Therefore, changes in the results may be expected.
Footnotes
Acknowledgments
The authors thank the University of Zambia and the University of South Africa for sponsoring the work. The authors are grateful to the Zambia National Health Research Authority for providing access to the data and permission to publish the results. The authors greatly appreciate the constructive comments from the reviewers.
Authors' Contributions
This work was performed in collaboration between authors. U.H. conceptualized the study and conducted data analysis. P.N. provided guidance in the analysis, conducted literature review, and compiled the entire article. All authors read and approved the final version of the article.
Availability of Data and Material
The data can be made available on request from the corresponding author.
Ethics Approval and Concept to Participate
The permission to use data was obtained from the Zambia National Health Research Authority.
Author Disclosure Statement
No competing financial interests exist.
Funding Information
The University of Zambia contributed in employing U.N.H., whereas the University of South Africa contributed in employing P.M.N. No direct funds were obtained for this work.
Appendix A1: WinBUGs Syntax Model Codes
MODEL ARV Combination {#Hyper prior for the ARV combination of failure Rates
a∼dgamma(.01,.01)
b∼dgamma(.01,.01)
#Prior Distribution of the True failure Rates for (i in 1:k) {
#Prior distribution of ARV Combination i's True Rate
theta[i] ∼ dbeta(.11, 2.78)
#Likelihood of ARV combination i's Data
y[i] ∼ dbin(theta[i],n[i])}}
DATA list (k = 6,
n = c(121, 781, 102, 32, 186, 56),
y = c(5, 8, 3, 3, 7, 2))
INITIAL VALUES1 list(a = 0.11,b = 2.73)