
Abstract
Immune activation, which is accompanied by the production of proinflammatory cytokines, is a strong predictor of disease progression in HIV infection. Inflammation is critical in neuronal damage linked to HIV-associated neurocognitive disorders. We examined the relationship between plasma cytokine levels and deficits in neurocognitive function. Multiplex profiling by Luminex® technology was used to quantify 27 cytokines/chemokines from 139 plasma samples of people living with HIV (PLWH). The relationship of plasma cytokine markers, clinical parameters, and cognitive impairment, was assessed using Spearman correlations. Partial least squares regression and variable importance in projection scores were used for further evaluation of the association. Forty-nine (35.3%) participants exhibited neurocognitive impairment based on a global deficit score (GDS) of at least 0.5 and 90 (64.7%) were classified as nonimpaired. Twenty-three (16.5%) initiated on combination antiretroviral therapy for 4 weeks before cognitive assessment and 116 (83.5%) were not on treatment. We identified five proinflammatory cytokines that were significant predictors of GDS namely, IP-10 (β = 0.058; p = .007), RANTES (β = 0.049; p = .005), IL-2 (β = 0.047, p = .006), Eotaxin (β = 0.042, p = .003), and IL-7 (β = 0.039, p = .003). IP-10 and RANTES were the strongest predictors of GDS. Both cytokines correlated with plasma viral load and lymphocyte proviral load and were inversely correlated with CD4+ T cell counts. IP-10 and RANTES formed a separate cluster with highest proximity. Study findings describe novel associations among IP-10, RANTES, cognitive status, plasma viral load, and cell-associated viral load.
Introduction
HIV-associated neurocognitive disorders (HAND) are a significant challenge to HIV-infected people, with prevalence ranging from 50% to 70%. 1,2 The precise mechanism of HAND pathogenesis is not known, but it is thought to be a complex interaction between viral factors and the immune response and other risk factors like age, coinfection with other viruses, and educational levels. 3 –5 Studies showed that HIV infection of the central nervous system (CNS) is an offshoot of systemic infection, which provides the initial and continuous seeding of the peripheral human immunodeficiency virus in the CNS. 6 Processes that eventually lead to neurocognitive impairment are thought to emanate from activated peripheral mononuclear cell trafficking to the CNS. 7 Infected mononuclear cells release cytokines that contribute to the disruption of the blood/brain barrier (BBB), making it more permeable to proinflammatory cytokines and chemokines from the periphery. 6,8 The influx of peripheral inflammatory cytokines into the brain results in activation-induced neuroinflammation, which is a risk for HAND. 9 –11
Some soluble markers of immune activation, such as plasma tumor necrosis factor-alpha receptor II p175 (TNF-RII) and β2-microglobin have been shown to be predictive of HIV disease progression, with efficiency comparable to viral load and CD4+ T cell count. 12,13 Therefore, coupling CD4+ T cell count and viral load with estimates of immune activation could increase the predictive power of tracking HIV disease progression. Despite the success of combination antiretroviral therapy (cART), chronic immune activation, and particularly inflammation, continues to be a hallmark of HIV infection and predicts disease progression and can also lead to adverse clinical events such as HAND. 14 Research has shown that chemokines CXCL-10/IP-10, in combination with HIV-1, is neurotoxic and leads to proinflammatory cytokine production. 10,15 Higher levels of IP-10 produced by activated monocytes/macrophages, microglia, and T cells have been shown in HIV+ individuals with dementia. 15 Another chemokine CCL5/RANTES was shown to increase the replication of HIV in peripheral blood lymphocytes and high levels were also observed in inflammatory lesions of the brain and in the CSF of HIV-infected patients. 16 –18 These observations may possibly explain the role of RANTES in HAND.
There is growing interest in elucidating the role of various plasma inflammatory markers in the pathogenesis of HAND. A search from a large spectrum of candidates is necessary to accelerate the identification of novel cytokine signature markers associated with clinical outcomes of neurocognitive impairment in HIV. 19,20 This study combines high-throughput Luminex-based assays with different statistical tools to find the direction of maximum covariance between cytokines and identify those cytokines that contribute significantly to prediction of neurocognitive impairment, ranking, and grouping the cytokines according to their predictive power. We, therefore, examined relationships between plasma inflammatory biomarkers and neurocognitive function as assessed by global T-scores, which were derived from comprehensive neurocognitive testing.
Methods
A cross-sectional study was conducted in 139 HIV-positive Xhosa-speaking individuals from primary care HIV clinics in Cape Town, South Africa. Sample size determination parameters were: 80% power, prevalence (p = 15%), 95% confidence interval, 1.2 design effect, 16% attrition, and 7% margin of error. Inclusion criteria to participate in the study required the following: (1). Age ranging from 18 to 45 years with at least 5 years of formal education. This age range was selected to avoid age-related CNS abnormalities, (2). HIV serostatus, determined by enzyme-linked immunosorbent assay and then confirmed by western blot, (3). HIV-1 RNA for plasma viral load measured by the Abbott m2000sp and the Abbott m2000rt analyzers (Abbott Laboratories, Abbott Park, IL). Exclusion criteria included the following: any major psychiatric condition that could significantly affect cognitive status; confounding neurological disorders, including multiple sclerosis and other CNS conditions; head injury with loss of consciousness greater than 30 min; clinical evidence of opportunistic CNS infections and current substance abuse or alcohol abuse as defined by a structured interview. 21 Data on HIV treatment status were collected as the participants were enrolled into the study.
Neuropsychological evaluation
A battery of cognitive tests sensitive to deficits associated with HIV was administered to all participants as described by Paul et al. 21 Briefly, the tests were administered to assess learning, executive functions/visuospatial and psychomotor speed. Learning was assessed using Hopkins Verbal Learning Test-Revised (HVLT-R), and visual learning was assessed using the Brief Visual Memory Test-Revised (BVM-R), as described previously. 22 Executive functions and psychomotor speed were evaluated using the neuropsychological battery that has been previously described. Scores were averaged to generate a mean T-score and deficit for each of the cognitive domains to calculate a global T-score and global deficit score (GDS). A GDS was then used to categorize cases as either impaired or unimpaired. 23 GDS of 0.5 or more was regarded as neurocognitive impairment. GDS has been shown to be a reliable tool for the diagnosis of HAND. 24
Cell subset separation and proviral HIV DNA quantification
Whole blood samples were collected and peripheral blood mononuclear cells were separated by Ficoll gradient separation (Ficoll—Histopaque, Pharmacia, Uppsala, Sweden). CD14+ monocytes were separated by magnetic cell sorting (MACS, Miltenyi Biotec GmbH, and Bergisch Gladbach, Germany) and the peripheral blood lymphocytes (CD14−) were recovered from negative fraction of the CD14+ monocytes. The total CD3+, CD4+, and CD45+ count and percentages were determined using standardized T cell subset protocols (BDMultiset) and flow cytometry analysis (BD FACSCalibur). Quantification of total HIV-1 DNA proviral levels in cell subsets were determined according to the protocol described by Malnati et al., 25 using a quantitative real-time polymerase chain reaction that targets the conserved HIV-1 LTR-gag region.
Plasma cytokine quantification by multiplex-bead assay
The cytokine concentrations in plasma samples were determined using a 27-Plex Kit, according to the manufacturer's instructions (Bio-Rad Bio-Plex Pro Human Cytokine Assay, California). Quantified cytokines/chemokines and growth factors included IL-1β, IL-1α, IL-2, IL-4, IL-5, IL-6, IL-7, IL-8, IL-9, IL-10, IL-12p70, IL-13, IL-15, IL-17, Eotaxin, basic FGF, G-CSF, GM-CSF, IFN-γ, IP-10, MCP1, MIP-1α, MIP-1ß, PDGF-BB, RANTES, TNF-α, and VEGF. Briefly, thawed plasma samples were incubated with antibody-coupled beads. Complexes were washed, incubated with biotinylated detection antibody, and subsequently with streptavidin/phycoerythrin, before assessing cytokine concentrations. Standard curves were generated using standard cytokines, with known concentration provided in the kit. Plasma cytokine levels were determined using a multiplex array reader from Luminex™ Instrumentation System (Bio-Plex Workstation from Bio-Rad, California); plasma samples were run in duplicate and cytokine concentrations were calculated as the average of two independent measures using Bio-Plex Manager Software (California). The study was approved by the Stellenbosch University Health Research Ethics Committee 2 Ethics Reference #: S17/02/035.
Statistical analysis
STATA statistical package version 12.1 (2011; StataCorp, College Station, TX) was used for data analysis. Normally distributed demographic and cytokine level variables were described using means. Variables that were skewed were analyzed using nonparametric tests; the Kruskal–Wallis test was used to compare GDS median scores between males and females since they were skewed. Independent t-tests were used on normally distributed variables such as; Age in years, CD4+ count/μL, CD8+ count/μL, CD4+/CD8+ ratio, CD14+ count/μL, and plasma viral load (copies/mL) to compare cognitively impaired and unimpaired participant groups. Spearman correlation coefficients were used to assess the association between plasma cytokines and GDS as well as variables, such as plasma RNA viral load, CD4+ T cell count, monocyte count, and CD4/CD8 ratio. Variable importance in projection (VIP) scores were computed using the partial least squares (PLS) regression approach using STATA Excel software. PLS approach uses multiple linear regression analysis to find the direction of maximum covariance between a dataset and class membership and prioritize features that contribute significantly to class prediction. The VIP scores were used to determine cytokine importance in relation to the GDS. VIP scores above a threshold of 1 were considered important. Statistical significance was determined as a p value <.05.
Results
Demographic and clinical characteristics
A total of 139 participants, consisting of 115 (82.7%) females and 24 (17.3%) males, were assessed for HIV-associated neurocognitive impairment. The age of participants ranged from 21 to 45 years. The median (GDS) for the cohort was 0.32. The median deficit score for males (0.5) was higher than for females (0.31), but the difference was not significant (p = .0853). Using a GDS of 0.5 or higher, 49 (35.3%) participants were designated as at least mildly impaired and 90 (64.7%) were classified as nonimpaired and 23 (16.5%) initiated on cART for 4 weeks before cognitive assessment and 116 (83.5%) were not on treatment at the time of cognitive assessment and sample collection. There was no significant differences in cytokine levels between cART-naive and cART initiated in 26 of the 27 cytokines quantified. Only, IL-2 was significantly higher in the cART-naive group compared with the cART group (p = .0289). Most of the participants (80%) reported completing secondary education (from Grade 8 to Grade 12), 5.8% had primary education (Grade 1 to grade 7), and 5% had tertiary education (diploma or degree). Table 1 summarizes demographic and clinical parameters of the cohort comparing impaired and nonimpaired participants and Table 2 compares male and female participants.
Summary of Clinical/Demographic Variables
Summary of Gender-Stratified Demographic and Clinical Parameters
GDS, global deficit score.
Relationship between cytokine levels and neurocognitive impairment status
Using PLS analysis we identified five proinflammatory cytokines that were significant predictors of GDS before adjusting for viral suppression, IP-10 (β = 0.058; p = .007), RANTES (β = 0.049; p = .005), IL-2 (β = 0.047, p = .006), Eotaxin (β = 0.042, p = .003), and IL-7 (β = 0.039, p = .003). The strongest associations involved IP-10 (p = .007), RANTES (p = .005), and IL-2 (p = .006), respectively. These cytokines were significantly and positively associated with GDS
Coefficients for 27 Predictor Cytokine Variables Against Global Deficit Score
Impact of Viral Suppression on Association Between Cytokines and Global Deficit Score
Inverse covariation with GDS was prominent on IL-9 (β = −0.056), INF-g (β = −0.052), TNF-α (β = −0.039), IL-7 (β = −0.036), IL-17 (β = −0.039), and IL-13 (β = −0.036), but the associations were significant for IL-7 (p = .003) and IL-17 (p = .003) only. Table 5 shows association between cytokine levels and clinical markers of HIV infection. This shows that an increase in these cytokines was associated with decreased GDS. Figure 1 shows the relationship between the cytokines and GDS using PLS regression.
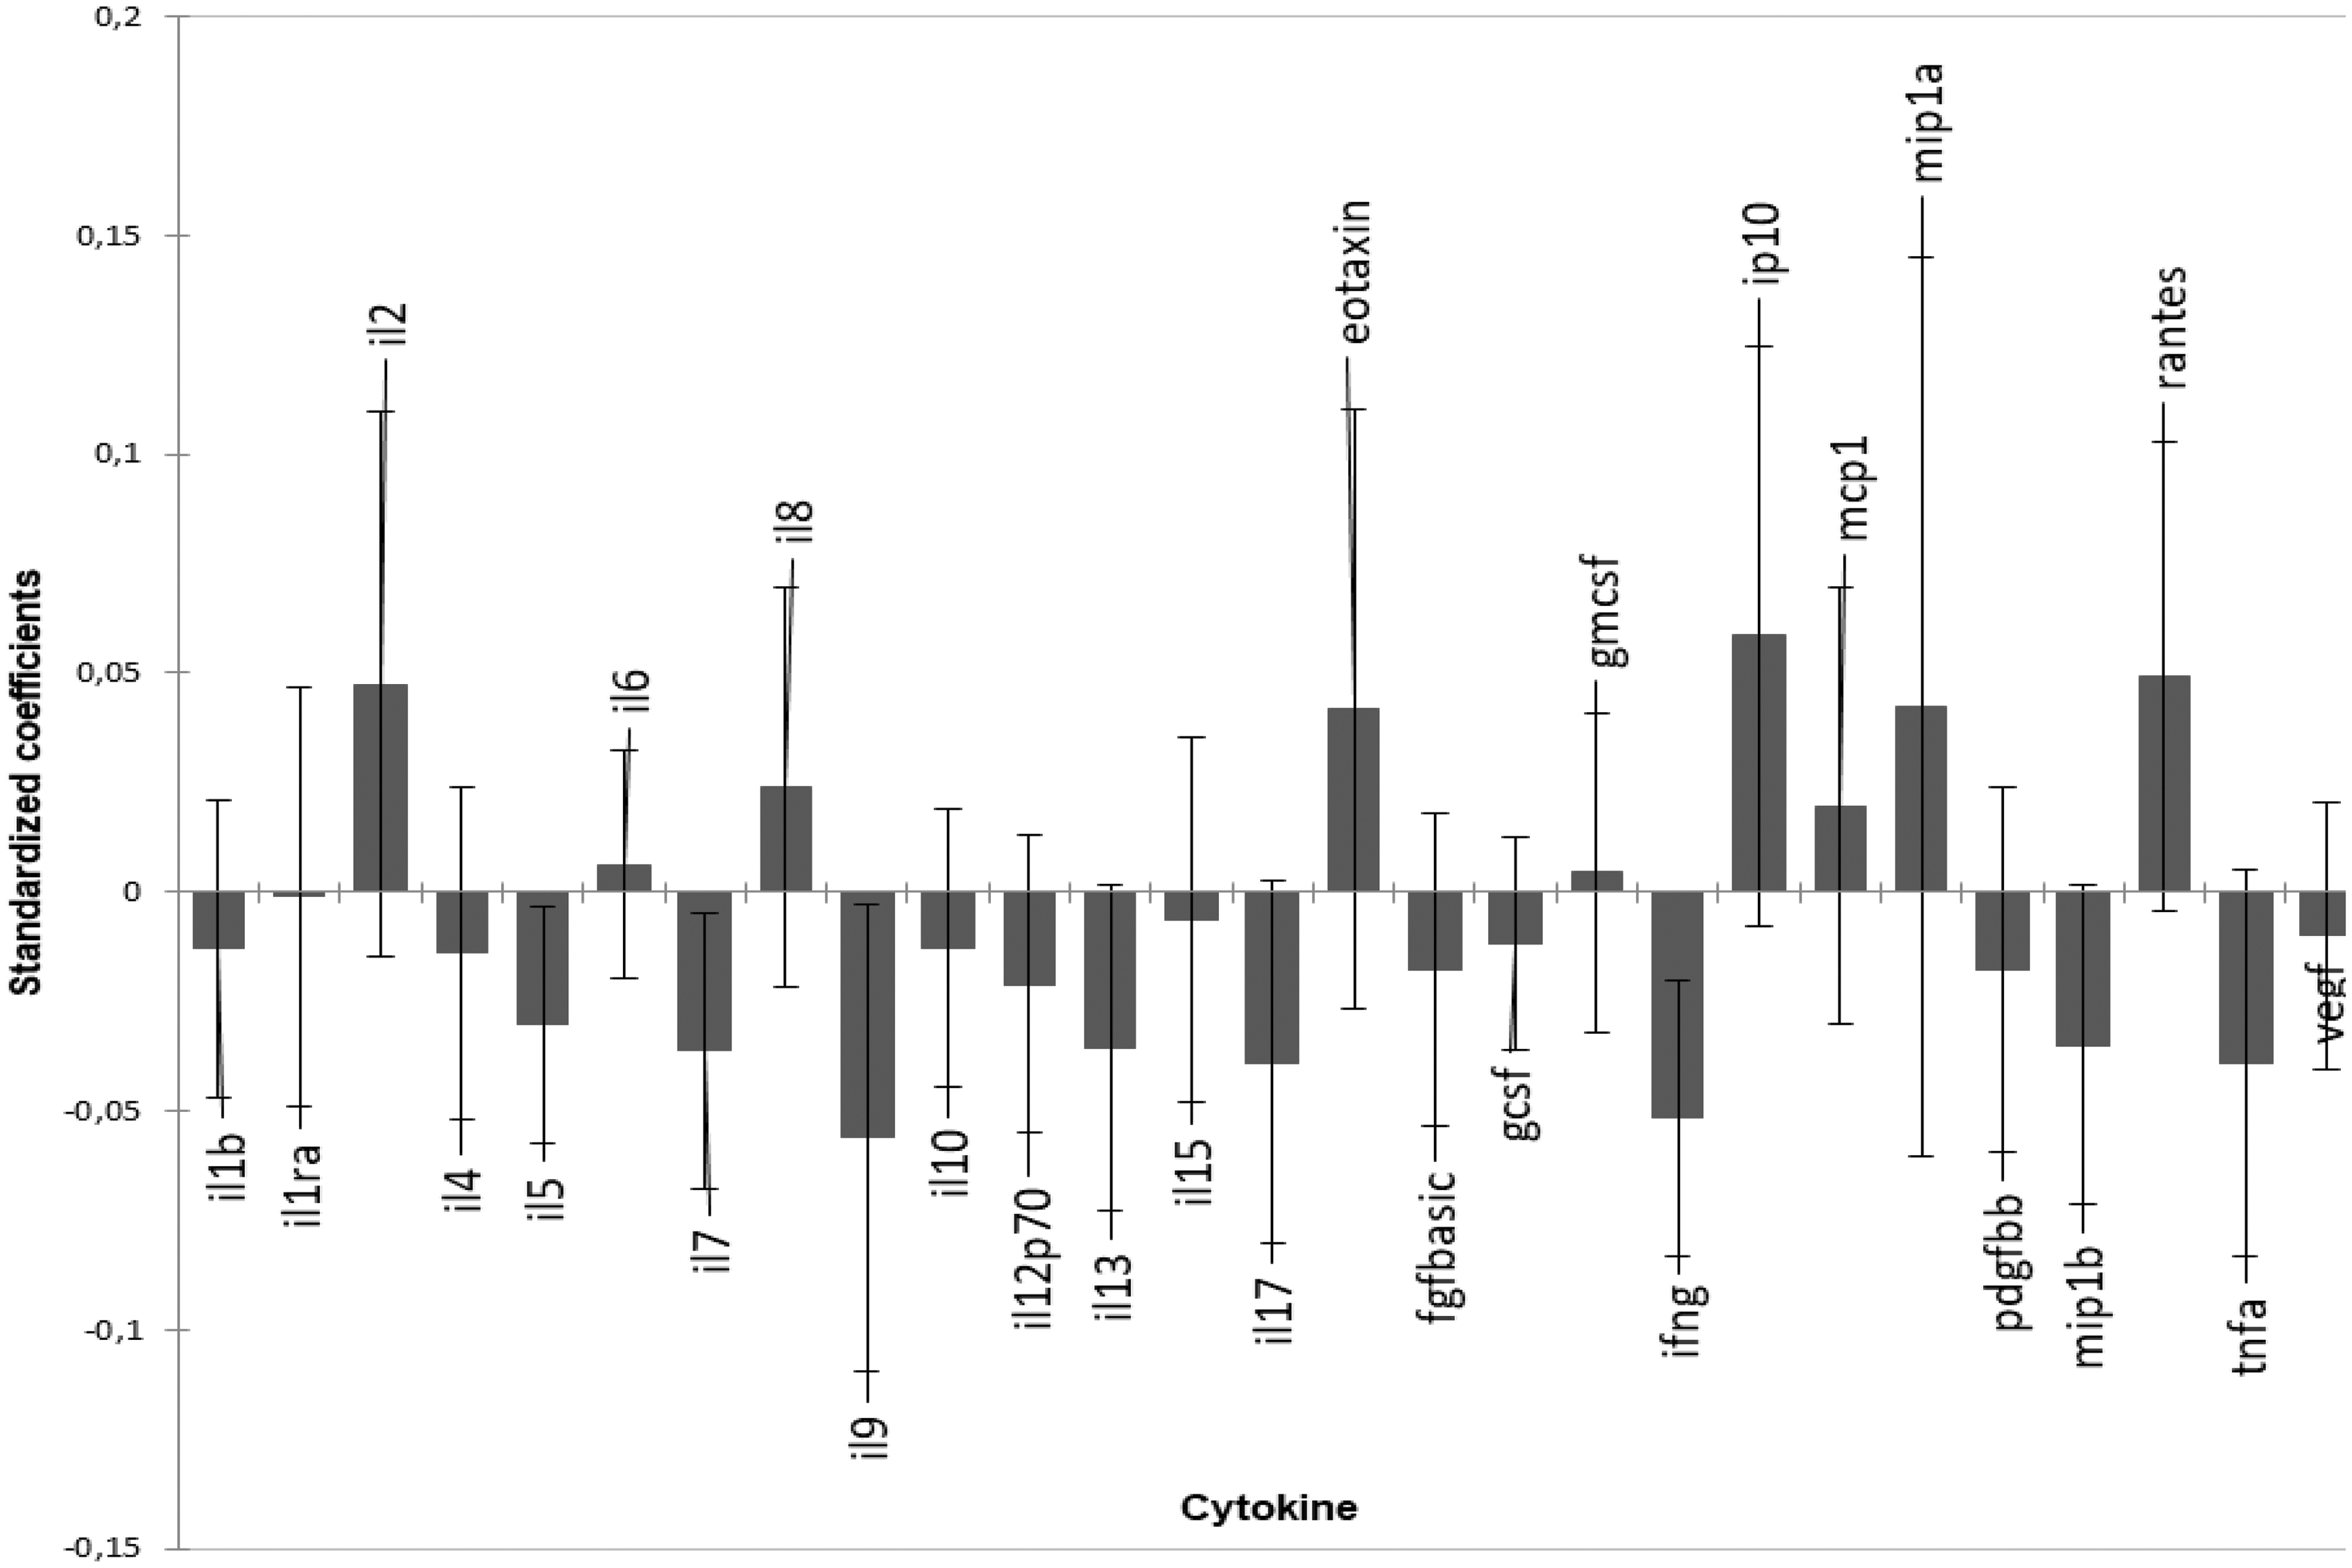
Graphical representation of the magnitude and direction of the effect of plasma cytokines on GDS using PLS-R standardized coefficients and 95% confidence intervals. IP-10, RANTES, Eotaxin, and IL-2, MCP-1, and MIP-1a were prominent cytokines associated with higher GDS. IL-9, INF-γ, and TNF-α, IL-17, IL-13, and MIP-1β are associated with lower GDS. GDS, global deficit score; PLS-R, partial least squares-regression; TNF-α, tumor necrosis factor-alpha.
Association Between Cytokine Levels and Clinical Parameters, Using Spearman Correlation
VIP plot ranking indicated the plasma cytokine biomarkers that were most important in relation to GDS. Again IP-10 had the highest VIP score (1.8) for predicting HAND diagnosis. They have VIP scores greater than 1, which were considered important for prediction of GDS regardless of the direction of association. Therefore, 12 cytokines IP-10, IL-9, INF-γ, RANTES, IL-2, MIP-1a, Eotaxin, TNF-α, IL-17, IL-7, IL-13, and MIP-1b were the most important. Figure 2 below shows the ranking of cytokines in predicting GDS according to VIP scores.

VIP Plot ranking 27 cytokines with 12 cytokines, IP-10, IL-9, INF-γ, RANTES, IL-2, MIP-1a, Eotaxin, TNF-α, IL-17, IL-7, IL-13, and MIP-1b having a VIP score above 1. IP-10 had the highest VIP score indicating that it had the highest influence on GDS. VIP, variable importance in projection.
Cluster analysis of all the 27 cytokines produced hierarchically related sets of groups of cytokines. RANTES and IP-10 came out as a cluster, with the highest Pearson proximity of greater than one. The dendrogram presented in Figure 3 has vertical lines associated with specific cytokines that are joined by horizontal lines. A cluster with RANTES and IP-10 has long vertical lines ∼1.3, this shows the strength of clustering proximity.
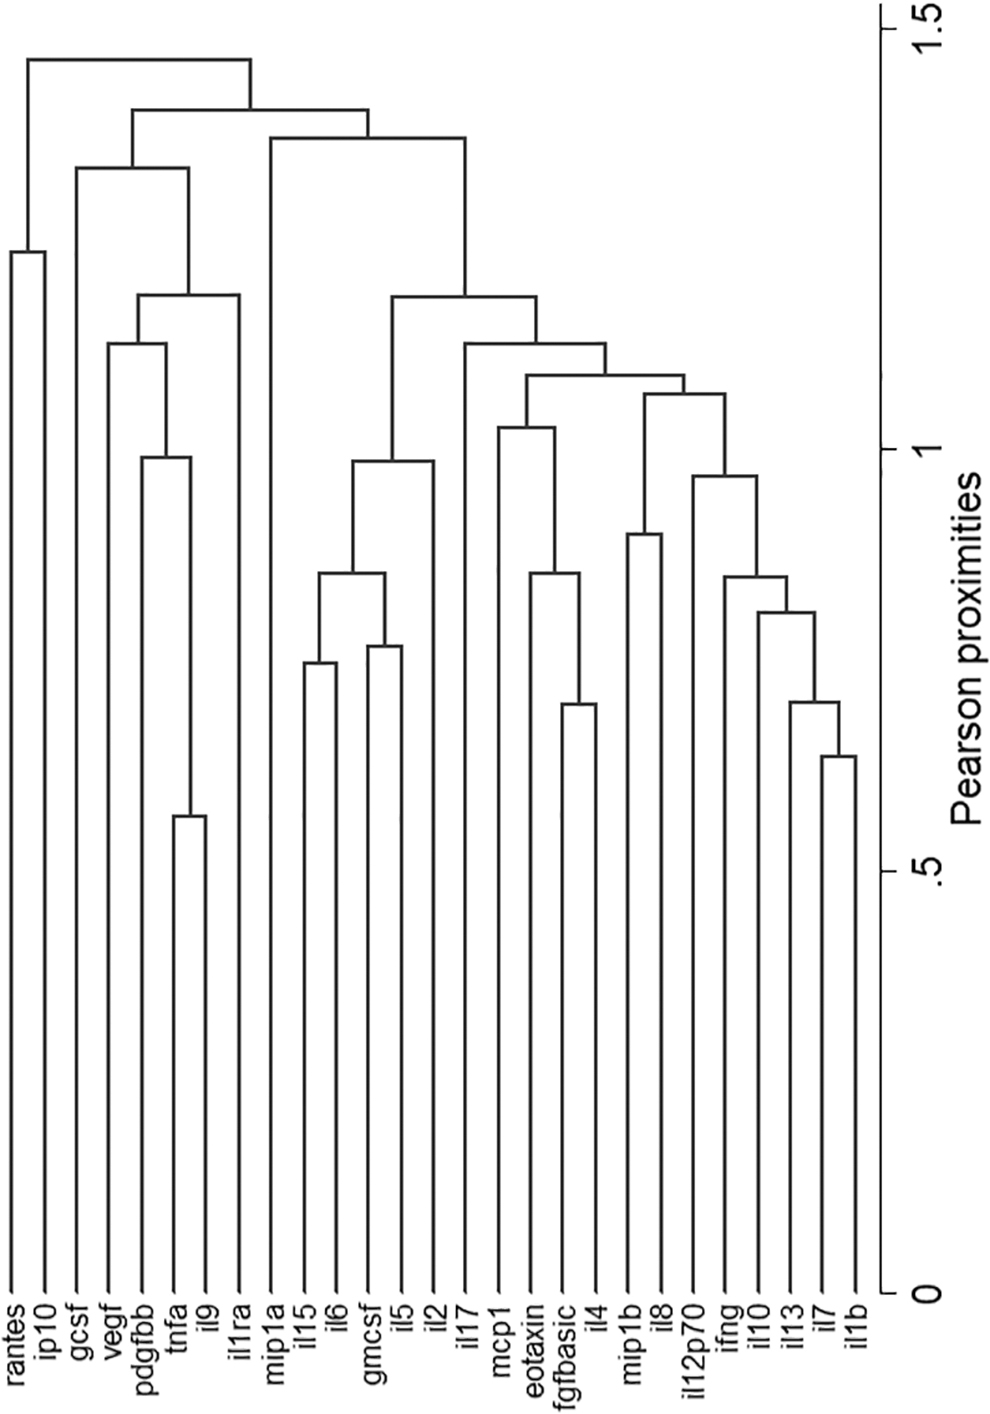
Hierarchical clustering of cytokines showing RANTES and IP-10 with highest Pearson proximities, making a cluster of their own.
Viral load measures, cognitive function, and immune activation
GDSs did not significantly correlate with standard clinical markers/measures for HIV infection, such as CD4+ T and CD8+ T cell counts, percentages, and ratio, but did interestingly correlate with CD14+ monocyte count (Spearman r = 0.180; p = .036). In addition GDS correlated with IL-2 (r = 2366; p = .0054), IL-9 (r = 0.2; p = .0191), Eotaxin (r = 0.1831; p = .0323), IFN-γ (r = −0.175; p = .010), GM-CSF (r = 0.218; p = .010), and RANTES (r = 0.231; p = .007).
Considering the two categories, proviral load was significantly higher in impaired participants (p = .0058), but there was no significant difference in plasma viral load between the two groups (p = .6205). Neither plasma viral load nor cell-associated proviral load were correlated with GDS. There was a strong relationship between the two viral load measures (Spearman r = 0.414; p < .0001). However, both measures of viral load did not have similar correlations with markers of immune activation. Plasma viral load correlated negatively and significantly with CD4+ T cell count (r = −0.329; p < .0001) and CD4%; this was not mirrored in the lymphocyte proviral load. This implies some independence between the two viral measures and their direct impact on immune status. Proviral load is associated with inactive infection and latency, whereas plasma viral load is associated with productive active infection or replicating virus.
With regard to cytokines, plasma viral load was significantly correlated with 11 cytokines. Viral load was negatively correlated with four cytokines. IL-1β, IL-9, PDGFBB, and TNF-α (p = .005, p = .0012, p = .0001, and p = .018, respectively). IL-2, IL-7, IL-8, IP-10, and MIP-1β were positively and significantly associated with plasma viral load. Of these cytokines, the most significantly and positively associated with plasma viral load were IP-10 (r = 0.308; p < .001) and RANTES (r = 0.422; p < .0001).
Lymphocyte proviral load was associated with nine cytokines in common with plasma viral load: IL-1β, IL-7, IL-8, IL-9, IP-10, PDGF-BB, MIP-1β, RANTES, and TNF-α. The other three, including IL-17, Eotaxin, and IFN-γ, were only associated with lymphocyte proviral load and not plasma viral load. Interestingly, the cytokines which showed significant correlation with plasma viral load lymphocyte proviral load and GDSs included RANTES, MIP-1β, PDGF-BB, and IL-9. The only positive association across all three parameters (GDS, plasma viral load, and lymphocyte proviral load) was RANTES with Spearman correlation coefficients of r = 0.422, 0.434, and 0.231 and p < .0001, <0.0001, and 0.007 for plasma viral load, lymphocyte proviral load, and GDS, respectively.
Although CD4+ T cell count was not significantly different between impaired and unimpaired groups, CD4+ T cell count correlated with the highest number of immune status markers and cytokines. Positive correlation was observed with CD3%, CD3 absolute count, CD8%, CD8 absolute count, CD4%, CD4:8 ratio, IL-5, IL-7, IL-9, IL-12 (p70), IL-13, IL-17, Eotaxin, MCP-1, PGDF-BB, MIP-1β, TNF-α, and VEGF. It correlated negatively with plasma viral load, IP-10, and RANTES. The monocyte cell count (CD14 enriched) positively correlated with GDS, IL-2, IL-5, IL-6. IL-15, G-CSF, and IP-10 and negatively correlated with CD3% and PDGF-BB. Unique to the monocyte count were positive correlations with IL-6, IL-15, and G-CSF–all 3 being myeloid/monocyte-associated cytokines.
Discussion
The objective of this study was to examine the relationship between plasma cytokine concentrations and neurocognitive impairment as measured by GDS. Our findings showed that the strongest associations between selected cytokines and cognitive status were IP-10, RANTES, IL-2, and Eotaxin, respectively. These cytokines are proinflammatory. Further analysis using VIP showed that IP-10 is the most sensitive marker of GDS. Altered expression of IP-10/CXL10 has been associated with a number of inflammatory diseases, including HIV. 25 It has been shown to positively correlate with plasma viral load in untreated HIV patients. 26 –28 Elevated plasma IP-10 in primary HIV infection has been shown to be a more robust predictor of progression toward AIDS. 29 –31,39 IP-10 positively correlated with both plasma viral load and lymphocyte-associated proviral load and inversely with plasma CD4+ T cell count. Higher viral loads point to increased antigenic load, which could worsen inflammatory response in the periphery. IP-10 is known to influence T cell generation and trafficking of CD4+ and CD8+ T cells into the brain and has been shown to be correlated with the progression of HAND. 32,33 Our results demonstrated a strong association between CD8+ T cells and IP-10, supporting earlier findings on the role in T cell proliferation and neurocognitive impairment in HIV infection. 34,35
RANTES, which was the second most important cytokine linked to GDS also correlated with plasma viral load and lymphocyte proviral load. This implies that viral replication and RANTES are linked and these phenomena increase the risk of neurocognitive impairment. RANTES is a proinflammatory cytokine/chemokine, which is chemotactic for lymphocytes, monocytes, and other cell types and is expressed in several inflammatory diseases of the CNS and a powerful stimulus for astrocyte production of proinflammatory cytokines. 36 RANTES at high concentrations can also enhance infection through mitogen-like activation of T cells and other cells. 37 Increased levels of RANTES have been observed in brain/CSF in neuroAIDS and evidence has shown that the cytokine promotes replication of T-tropic HIV in peripheral lymphocytes. 38 –40 RANTES, a key proinflammatory cytokine produced by virus-infected epithelial cells of the gut, has been implicated in translocation of microflora and their products from the gastrointestinal tract into the systemic circulation. 41 Persistent epithelial gut damage and elevated plasma levels of microflora and their products likely contribute to inflammation and immune activation, which has been linked to neurocognitive dysfunction in HIV infection. 42
Positive correlation between RANTES and viral load markers implicates this cytokine/chemokine with enhancement of infection. 43 It thus seems likely that RANTES facilitates infection through activation of T cells. We did not measure T cell activation but the negative association between activation cytokines, such as IP-10, TNF-α, and CD4+ T cell count is indicative of elevated general T cell activation. 44 –46 The enhanced infection indicated by positive association with plasma viral load is associated with T cell loss, shown by negative association with CD4 count.
RANTES plays an important role in sustaining CD8+ T cell responses during systemic viral infection. 47,48 It is thought that this process produces a significant depletion of CD4+ lymphocytes and defective function of T lymphocytes leading to dysregulation of cytokine production, resulting in immunodeficiency. RANTES itself had strong correlation with IP-10. IP-10 is thus key marker due to its relationship with RANTES, monocyte count (CD14+), CD4 count, plasma viral load, and lymphocyte proviral load. The fact that IP-10 and RANTES had strong associations with GDS, measures of viral load, and formed a separate cluster, indicates that we have identified a signature plasma chemokine biomarker linked to neurocognitive impairment in people living with HIV.
Although this study has identified a signature plasma cytokine marker associated with neurocognitive impairment in HIV, other factors such as peripheral activated or HIV-infected monocyte-derived crossing the BBB may have contributed. 49 Infected microglia and astrocytes may have contributed to neurocognitive impairment. Therefore, this study is limited in that the association between this maker and neurocognitive function was not investigated. Our findings are also limited to associations of inflammatory cytokine marker to clinical and neurocognitive impairment as measured by GDS. Further studies are required to support our findings with pathological data from neuroimaging techniques, which have the capacity to assess the extent of cytokine involvement in brain damage resulting in neurocognitive impairment. Our cohort was limited to predominantly woman and untreated participants. We, therefore, adjusted for gender and viral suppression on the association between cytokines and cognitive function and observed that IL-2 was still associated with neurocognitive impairment.
Conclusions
RANTES and IP-10 are important putative biomarkers of neurocognitive impairment and important indicators of viral replication and immune activation. Evidence of interdependencies between multiple proinflammatory and immune activation cytokines indicate that both cytokines are linked to the processes of viral replication and T cell activation.
Footnotes
Acknowledgment
The authors would like to thank Cladnos Mapfumo for statistical analyses.
Author Disclosure Statement
Authors declare that they have no conflict of interest.
Funding Information
This study was supported by the Poliomyelitis Research Foundation (PRF: SE. VR), the National Research Foundation (NRF: SE), the South African Medical Research Council (SAMRC) Collaborating Center for HIV-1 Laboratory Research (SE), and the new Generation of Academics Program (nGAP), South Africa (GBJ).