
Abstract
Human endogenous retroviruses (HERVs) can be vertically transmitted in a Mendelian fashion, are stably maintained in the human genome, and are estimated to constitute ∼8% of the genome. HERVs affect human physiology and pathology through their provirus-encoded protein or long terminal repeat (LTR) element effect. Characterization of the genomic distribution is an essential step to understanding the relationships between endogenous retrovirus expression and diseases. However, the poor characterization of human MMTV-like (HML)-8 prevents a detailed understanding of the regulation of the expression of this family in humans and its impact on the host genome. In light of this, the definition of an accurate and updated HERV-K HML-8 genomic map is urgently needed. In this study, we report the results of a comprehensive analysis of HERV-K HML-8 sequence presence and distribution within the human genome and hominoids, with a detailed description of the different structural and phylogenetic aspects characterizing the group. A total of 40 proviruses and 5 solo LTR elements for human were characterized, which included a detailed description of provirus structure, integration time, potentially regulated genes, transcription factor-binding sites, and primer-binding site features. Besides, 9 chimpanzee sequences, 8 gorilla sequences, and 10 orangutan sequences belonging to the HML-8 subgroup were identified. The integration time results showed that the HML-8 elements were integrated into the primate lineage around 35 and 42 million years ago (mya), during primates evolutionary speciation. Overall, the results clarified the composition of the HML-8 groups, providing an exhaustive background for subsequent functional studies.
Introduction
Germ cell infections caused by exogenous retroviruses and incorporation into host DNA occurred millions of years ago, leading to vertical transmission in a Mendelian fashion and stable maintenance of human endogenous retroviruses (HERVs) within the human genome. 1,2 HERVs are estimated to constitute ∼8% of human DNA. 1,3 Two hypotheses have been proposed to explain their persistence in the human genome during evolution: a parasitic hypothesis and a symbiotic hypothesis. In the parasitic hypothesis, HERVs are neutral and rather difficult to eliminate. 4,5 In contrast, the symbiotic hypothesis holds that they have been preserved by positive selection. 6
HERVs originate as integrated proviruses. A common set of HERVs includes the gag, pro, pol, and env genes, which are flanked by two long terminal repeats (LTRs) that act as promoters. 7 The gag gene encodes the structural protein that forms the core of the virion; pro encodes the viral protease; pol encodes reverse transcriptase and integrase, and env encodes the glycoprotein complex that controls receptor-mediated fusion and entry. 8
Even when most gag, pro, pol, and env remain, they are usually inactive due to the accumulation of substitutions, deletions, and insertions. Most HERVs exist in the form of solo LTRs produced by homologous recombination between the 5′ and 3′ LTRs. These LTR elements have been shown to influence gene regulation by providing regulatory elements such as enhancers, promoters, splicing sites, and polyadenylation sites for various host genes. 9,10
The classification of HERVs has been controversial for a long time. 11 One system based on the transfer RNA (tRNA) molecules exists, which acts as the primer for retroviral minus-strand DNA synthesis. For example, the HERV-K element is considered to use lysine-tRNA. Nonetheless, these naming methods are currently considered incomplete. Another system exists based on phylogenetic methods of the highly conserved pol sequence. 12,13 Phylogenetically, HERVs can be divided into three classes, where Class I consists of Gamma retrovirus-like, Class II consists of Beta retrovirus-like, and Class III consists of Spuma retrovirus-like elements. 14,15 As such, HERV-Ks, acquired by the human species between 3 and 6 million years ago (mya), belong to the Class II of the betaretrovirus-like supergroup. 16 The groups were initially named human MMTV-like (HML)-1 to HML-6, followed by the definition of HML-7 to HML-10. 17 –20 By 2011, two proviruses belonging to the HML-2 branch were identified as new groups HML-11. 21 Currently, HERV-Ks are divided into subfamilies HML-1 through HML-11.
HERVs affect human physiology and pathology mainly in two ways. One aspect is based on the effect of the provirus-encoded protein on the host. The most typical physiological function of HERVs is that Env is highly expressed and involved in the formation of the placenta. Syncytin-1 and 2 are the Env proteins of HERV-W and HERV-FRD, respectively, which maintain the fusion trophoblast cell layer and their connection with the cytotrophoblast layer. 22,23 Several proteins encoded by HERV-K are related to cancer, such as germ cell tumors, teratocarcinoma, ovarian cancer, prostate cancer, melanoma, rheumatoid arthritis, and amyotrophic lateral sclerosis. 24 –27 Np9 promotes the growth of myeloid and lymphoblastic leukemia cells by activating the Notch1, ERK, and AKT pathways through the upregulation of β-catenin. 28 Moreover, the expression of HERV-K Env protein in breast cancer tissue is significantly higher compared with normal breast tissue, which is related to disease progression and poor prognosis. 23
Besides, many research have proven gene regulated endogenous retroviruses (ERV) expression. TRIM28 is a nuclear protein that mediates gene silencing through heterochromatin, the TRIM28 expression on dendritic cells can silence endogenous retrovirus and prevent excessive T cell priming. 29 WEE1 kinase is a key regulator of G2/M checkpoint. WEE1 inhibition increases ERV expression by relieving SETDB1/H3K9me3 repression through downregulating FOXM1. 30
The other aspect is based on LTR elements. They can act as transcriptional regulatory elements to interfere with the expression of upstream and downstream genes. In fact, there are many examples of HERV LTRs acting as promoters or transcription factor-binding sites for genes. 31 –34 The LTR of HERV-E has been revealed to be located upstream of the pancreatic amylase gene in the reverse direction, regulating the expression of the amylase gene and providing promoter activity. 35 HERV-K LTR has tissue-specific enhancer activity and can be used as the main promoter of the galactopancreatic amylase gene in the human colon and small intestine. 36
The transcriptional activation of HERV LTRs also has harmful effects on the body. An in vitro model of human mammary epithelial cell transformation revealed 5′ LTR promoter activity in tumorigenic cells, suggesting that the cellular environment of cancer cells is a key component for inducing the activity of the LTR promoter. 37 Additionally, HERV-W LTR downregulated the expression of the GABBR1 gene in schizophrenia. 38 Two members of the HERV-I family induced AZFa gene microdeletions in azoospermia patients. 39
For the HERV-K group, it is known that characterization of the genomic distribution is an essential step to understanding the relationships between endogenous retrovirus expression and diseases. For HML-8, there is one study showing the polymorphism of the HERV-K11 gene, indicating that the polymorphisms may arise from an individual-specific basis. 40 However, there is currently no information about the characterization of HML-8, which prevents a detailed understanding of the regulation of the expression of this family in humans and its impact on the host genome. In light of this, the definition of a precise and updated HERV-K HML-8 genomic map is urgently needed.
Materials and Methods
HML-8 identification and localization in the human genome (hg38)
To confirm HML-8 provirus and solo LTR localization in the human genome, we selected the Genome Reference Consortium assembly GRCh38/hg38 (released December 2013) as the human background sequence and the assembled MER11A-HERVK11-MER11A as a query search to identify HML-8. A traditional BLAT search
41
in the UCSC Genome Browser database
42
was used. DNA BLAT works by keeping an index of the entire genome in memory. The index consists of all overlapping 11-mers stepped by 5, except for those heavily involved in repeats (
Element distribution prediction and chromosome mapping
To evaluate whether HML-8 is randomly distributed in human chromosomes, we predicted its expected distribution according to the formula e = Cl × n/Tl (where e represents the expected number of integrations in the chromosome, Cl represents the length of the chromosome, n represents the total identified number of HML-8 loci in the human genome, and Tl is the sum length of all chromosomes). 43 The comparison of the actual number of HML-8 loci with the expected elements in the chromosome was analyzed through a chi-square (χ 2 ) test.
Structural characterization
All 40 HML-8 proviral elements were characterized in detail through the Dfam reference MER11A-HERVK11-MER11A by multiple alignments performed with MEGA 7 and subsequent analysis through the BioEdit software platform. 44,45 All the deletions were annotated.
Phylogenetic analyses
To confirm the assignment of the identified HML-8 elements, maximum likelihood (ML) phylogenetic trees were constructed using MEGA 7. 46 Out of the 40 identified proviral elements, 3 proviral sequences that were longer than 80% of the HML-8 reference were used to construct a near-full-length phylogenetic tree. According to the model selection function of MEGA 7, the best-fitting model of nucleotide substitution for the full-length provirus was GTR+G+I. For the four coding regions, namely, those corresponding gag, pro, pol, and env, we screened sequences longer than 90% of the corresponding section of the HML-8 reference to construct their phylogenetic tree subregions. The best-fitting models of nucleotide substitution for gag, pro, pol, and env analysis were HKY+G+I for gag, GTR + G for pro and pol, and HKY + G for env.
Tree topologies were searched using the nearest neighbor interchange (NNI) procedure. For the hominoids, we screened sequences longer than 70% of provirus to construct a near-full-length phylogenetic tree. The best-fitting models were GTR + G for chimpanzees and gorillas, and GTR+G+I for orangutans. The confidence of each node in phylogenetic trees was determined using the bootstrap test with 500 bootstrap replicates. The final ML trees were visualized using iTOL. 47
Estimation of the integration time of HML-8
To estimate the time of integration, we assumed a substitution rate of 0.2%/nucleotides/million years for the human genome and used this rate to assess the action of divergence on each HML-8 sequence. 48 Estimation of the integration time is calculated based on the formula T = D%/0.2%, where T is the estimated time of integration (in million years) and D% is the percentage of divergent nucleotides. The divergence values were estimated by comparing the sequence of each HML-8 internal element gag, pro, pol, and env gene and its generated consensus sequence. The final age of each sequence was expressed.
Functional prediction of cis-regulatory elements and enrichment analysis
Noncoding regions typically lack biological function annotation. To examine the biological importance of HML-8 solo LTRs, their potential association with the analysis of the nearby genes was performed based on the Genomic Regions Enrichment of Annotations Tool (GREAT) against hg38. 49 The association rule was as follows: basal + extension, 5,000 bp upstream, 1,000 bp downstream, 1000,000 bp max extension, curated regulatory domains included.
After filtering regulatory genes by GREAT, we used the WEB-based Gene SeT AnaLysis Toolkit (WebGestalt) 50 to perform functional enrichment analysis, which is crucial for interpreting the list of interesting genes. WebGestalt can use three well-established and complementary methods for enrichment analysis, including overrepresentation analysis (ORA), gene set enrichment analysis (GSEA), and network topology-based analysis (NTA). The enrichment method used in the current work was ORA. The parameters for the enrichment analysis included the following: minimum number of IDs in the category, 5; the maximum number of IDs in the category, 2,000; false discovery rate (FDR) method, Benjamini–Hochberg; and significance level, top 10.
In silico examination of the conserved transcription factor-binding sites
The transcription factor-binding sites of the HML-8 LTR consensus sequence were predicted through the JASPAR database. The taxon was “vertebrates,” and the species was Homo sapiens. We selected chromatin immunoprecipitation sequencing data in JASPAR to predict transcription factors with a relative profile score threshold ≥95%. The constructed HML-8 LTR consensus sequence alignment and annotation were performed using Geneious software. 51
Primer-binding site features representation
Primer-binding site (PBS) features of three near-full-length proviruses (LTR length >80%) and the HML-8 reference sequence were all analyzed using MEGA7 and BioEdit. The degree of conservation at each position was represented by a logo built from WebLogo at
Results
HML-8 element identification, localization, and actual distribution in hg38
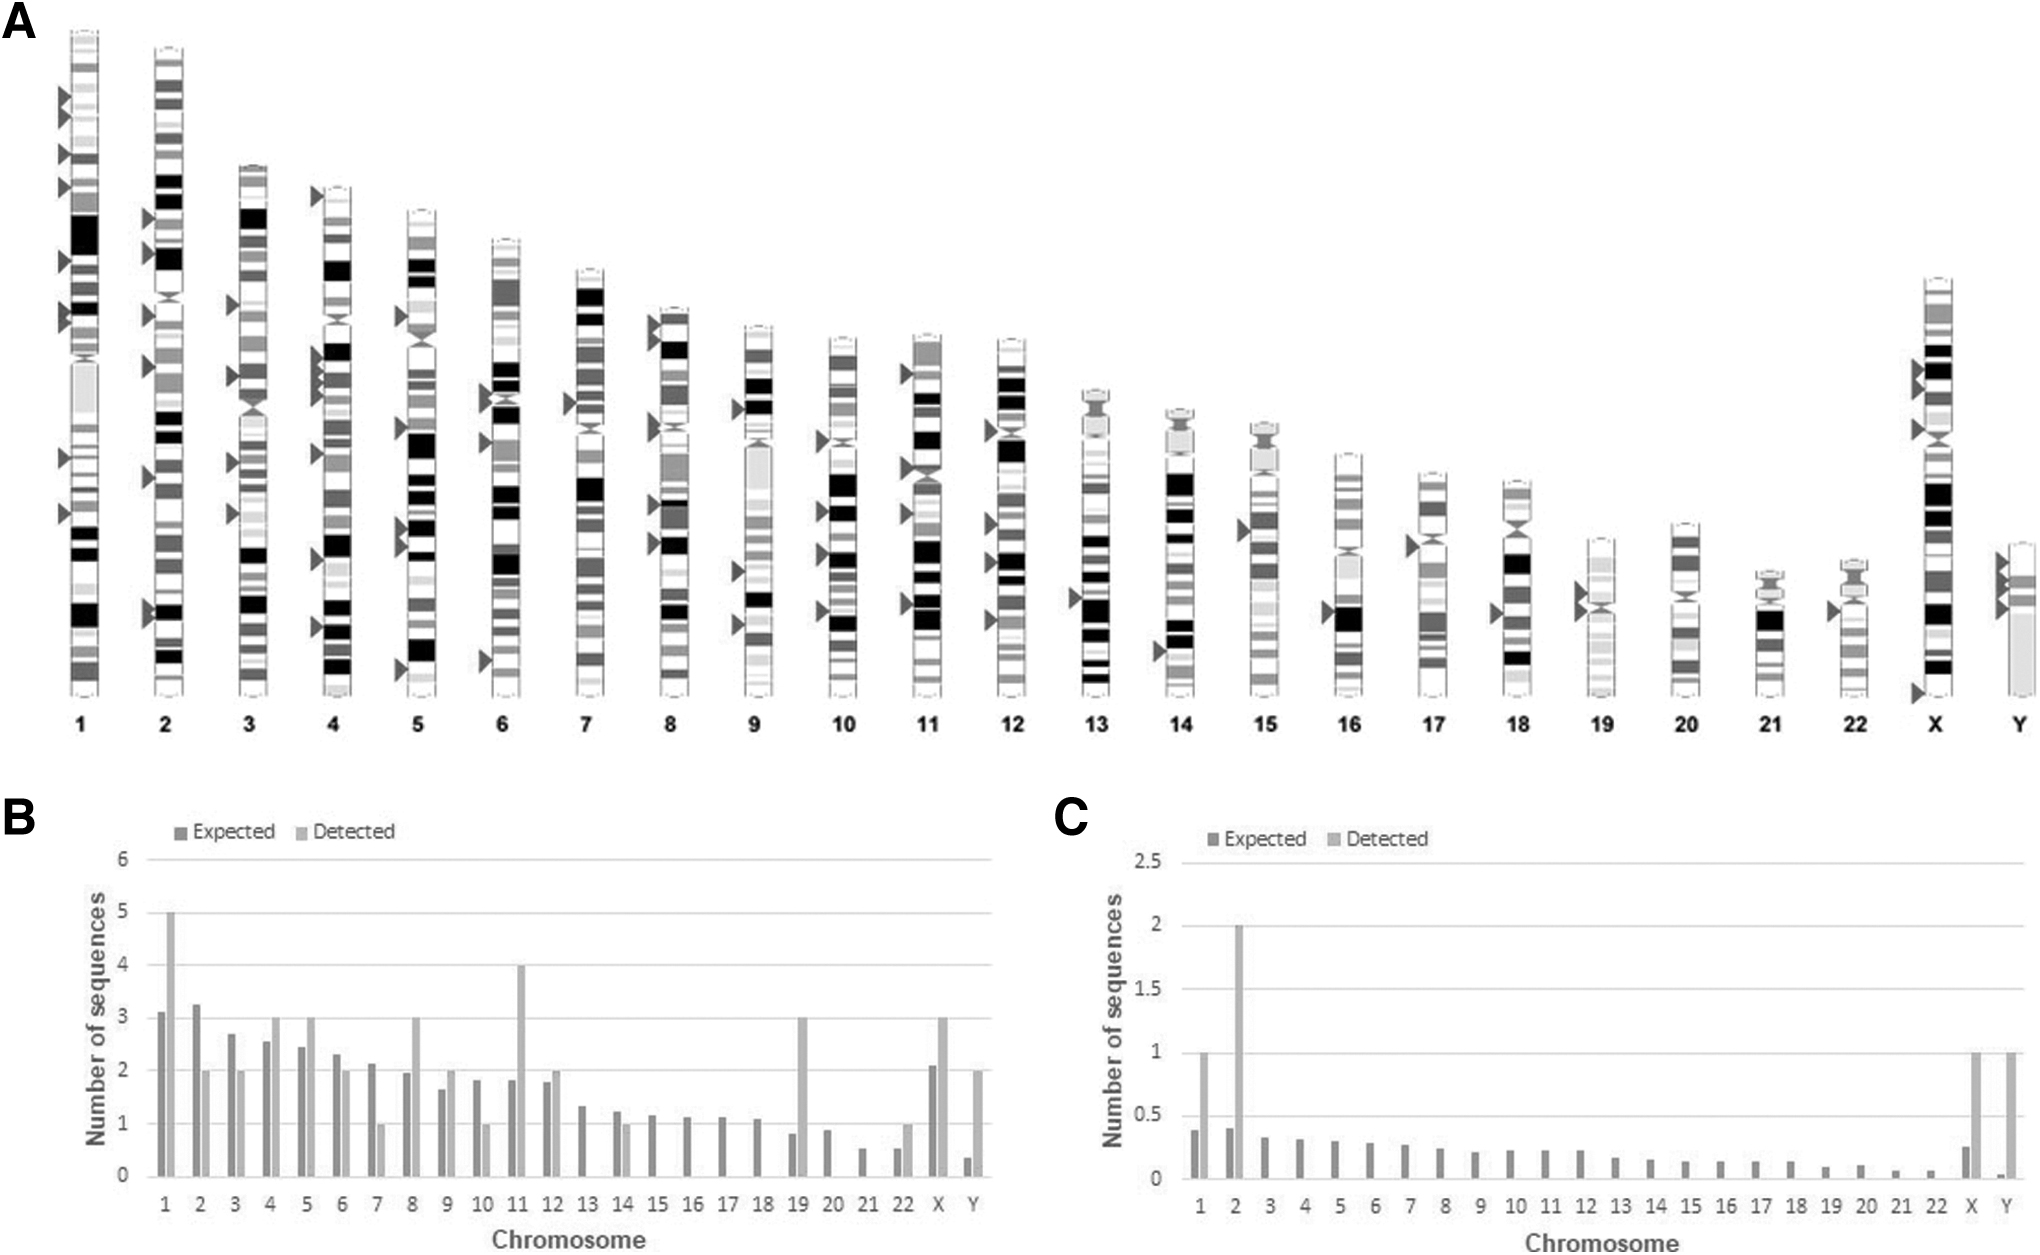
First, the whole HML-8 element distribution was displayed based on Ensembl (Fig. 1A). In total, we characterized 40 HERV-K HML-8 proviruses and 5 solo LTR elements. Each HML-8 element was screened out and named according to the genomic locus of insertion (Tables 1 and 2). The average length of these proviruses was 4,875 bp. Among them, 6 sequences were longer than 70% of the full-length HML-8 reference sequence (10,485 bp), 16 sequences were 40%–70% of the reference length, and the remaining 18 sequences were <40% of the reference length. The lengths of the five solo LTRs were ∼75% of that of the MER11A, the LTR for HML-8. The nucleotide sequence of each element is shown in Supplementary Dataset S1.
Chromosomal distribution of HML-8 loci.
HML-8 Provirus Distribution
HML-8 proviral sequences possess insertion or deletion compared with MER11A-HERVK11-MER11A.
HML, human MMTV-like; NA, not available.
HML-8 Solo Long Terminal Repeat Tracks Distribution
HML-8 solo LTR sequences possess insertion or deletion compared with MER11A.
LTR, long terminal repeat.
To assess whether the HML-8 integrations are present in the human genome in a random way, we compared the expected number of integrations with the detected number of HML-8 loci on each chromosome. The results showed that the number of HML-8 integration events observed was always inconsistent with the expected amounts (Fig. 1B, C). For the proviral elements, the number of HML-8 insertions on chromosomes 2, 3, 6, 7, 10, 13, 14, 15, 16, 17, 18, 20, and 21 was lower than expected. There were no loci detected on chromosomes 13, 15, 16, 17, 18, 20, and 21, and on chromosomes 1, 4, 5, 8, 9, 11, 12, 19, 22, X, and Y, the actual numbers identified were higher than the expected numbers (Fig. 1B).
Solo LTRs were detected only on chromosomes 1, 2, X, and Y (Fig. 1C). However, the differences were not statistically significant according to the chi-square test. Analysis revealed that HML-8 provirus and solo LTR integration displayed a nonrandom integration among human chromosomes. Furthermore, all 40 identified proviral elements and 5 solo LTRs were analyzed to determine their locations in intergenic regions, introns, and exons (Tables 1 and 2).
The results showed that 25 proviral elements are located in intergenic regions, accounting for 62.5%, 13 proviral elements were located in introns, accounting for 32.5%, and 2 proviral elements are located in both introns and exons, accounting for 5% (Table 1). With respect to solo LTRs, two were located in intergenic regions, accounting for 40%. The remaining three solo LTRs were located in introns, accounting for 60% (Table 2). A previous work by Brady et al 54 has demonstrated that the accumulation of HML-2 proviruses in introns and intergenic regions is not a result of integration preference but selection against proviruses that integrate into exons and genic regions. The results, in this study, displaying an apparent bias for insertions into intergenic regions and introns should be the same reason. The proviruses in genes and their relative transcriptional orientation are presented in Supplementary Tables S1 and S2.
Structural characterization
HML-8 sequences showed a typical proviral structure, with the gag, pro, pol, and env genes flanked by 5′ LTR and 3′ LTR sequences. According to the annotation information summarized in the Dfam database (
To describe the structure of each HML-8 provirus, we aligned 40 HML-8 sequences and annotated the position of the single retroviral component and deletions (Fig. 2). In general, there were different degrees of absence of LTRs at both ends of all the proviruses. We obtained three relatively complete sequences of proviruses (11q22.1, 19p12, 10p11.1), accounting for 80%–90% of the complete reference sequence length. However, their LTR structures are still incomplete. More specifically, the integrity of six separate regions is summarized in Table 3.

HML-8 proviruses structural characterization. Each HML-8 provirus nucleotide sequence has been compared with the Dfam consensus reference. LTR, gag, pro, pol, and env regions were annotated. Black lines represented deleted parts.
The Integrity of Six Separate Regions Relative to the Corresponding Reference Sections
Chromosome: start-end (strand). Positions are referred to the human genome sequence, assembly GRCh38/hg38.
Phylogenetic analyses
To confirm the classification of the newly identified sequence and characterization of the phylogenetic relationships within the HML-8 group, we analyzed three proviral sequences that were longer than 80% of the HML-8 reference to generate ML phylogenetic trees; the analyzed sequences included the reference sequences of all Dfam HERV-K group members (HML-1 to -10) and some representative exogenous betaretroviruses. The results showed that all three proviruses clustered with the Dfam HML-8 group reference sequence, supported by 100% of bootstrap (Fig. 3A).
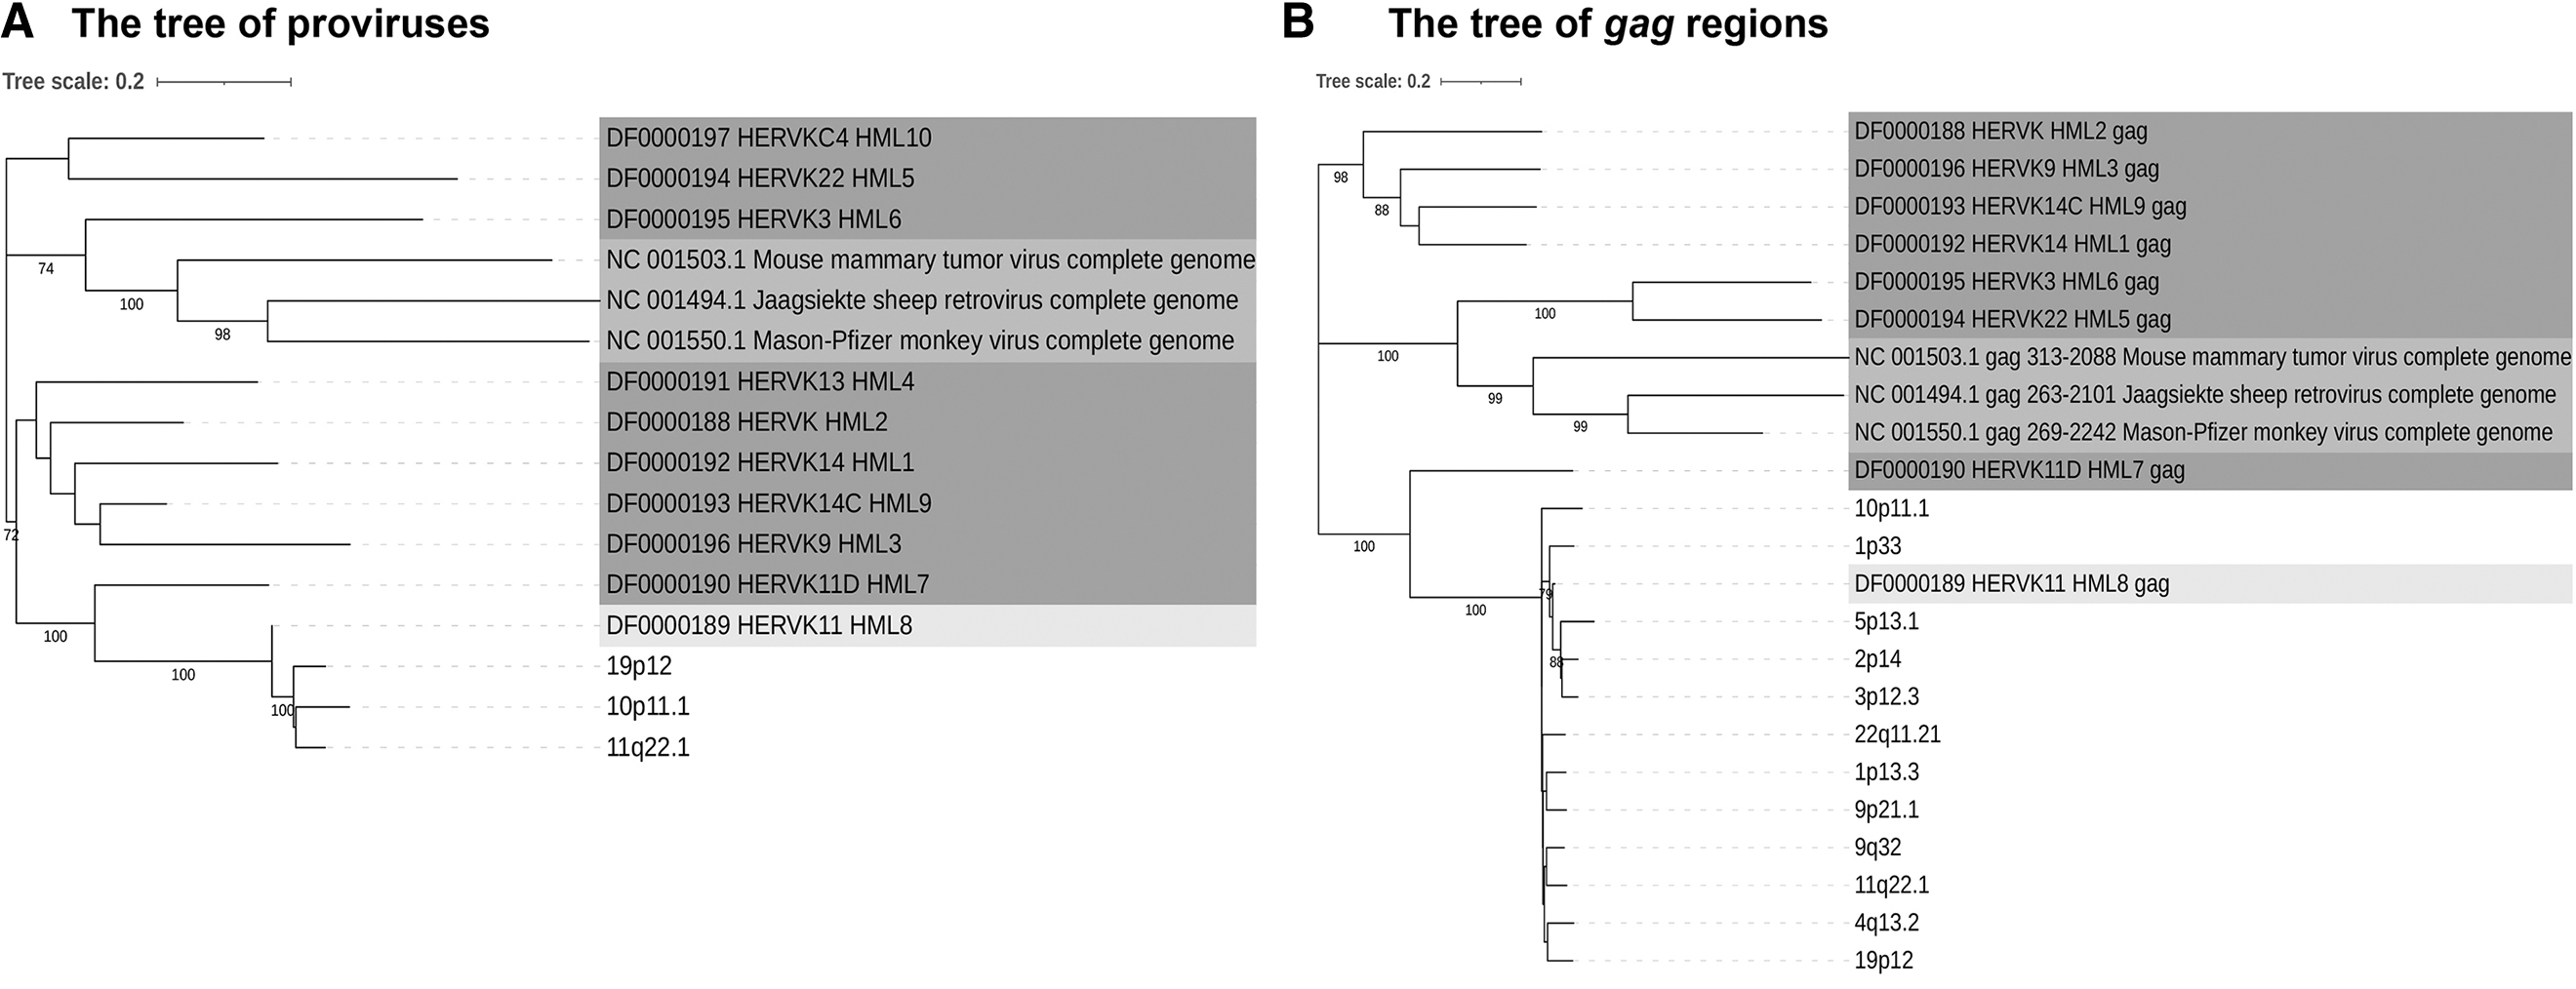
Phylogenetic analysis of the HML-8 near-full-length proviruses and four subregions by Maximum Likelihood method. Phylogenetic analyses of HML-8 proviruses

In addition, we further constructed ML subregion trees for the 12 sequences of gag elements, 15 pro elements, 10 pol elements, and 15 env elements (Fig. 3B–E). These phylogenetic groups of different regions of HML-8 all clustered together but were clearly separated from the other HERV-K groups (HML-1 to -7, -9, -10). Interestingly, within these main phylogenetic groups, we observed two different clusters located in the env section. They were statistically supported by bootstrap values (86% and 76%, respectively) and were named type a and type b. The type a sequences included the Dfam HML-8 env reference, whereas the type b elements showed a more divergent structure relative to the structure of the group reference elements. The solo LTR of HML-1 to -10 could not be used as a reference sequence because of its large differences from length to base composition, so we did not construct a phylogenetic tree of the HML-8 solo LTR.
Estimated time of integration
Because the LTRs of the provirus obtained were mostly deleted, we estimated the HML-8 provirus age based on the gag, pro, pol, and env regions. Each region longer than 90% of the corresponding reference section length was selected to calculate the integration time. The ancestral sequences of 4 regions were generated through MEGA 7, following the majority rule by the multiple alignments of all corresponding elements. The T value was estimated by the relation T = D%/0.2%, where 0.2% represents the human genome neutral mutation rate expressed in substitutions/nucleotide/million years. For each region of a provirus, the final T value was calculated. We have provided details on the period of provirus formation in Table 4. Overall, the results showed that the majority of HML-8 elements found in the human genome were integrated into the primate lineage between 23.5 and 52 mya. The average time of integration was 37.1 mya.
Estimated Time of HML-8 Elements' Integration
Chromosome: start-end (strand). Positions are referred to the human genome sequence, assembly GRCh38/hg38.
Comparative identification of orthologous insertions in hominoids
To identify the HML-8 orthologous sequences of different hominoids to human, and assess the period of germline “capture” event of the evolutionary lineage, we performed BLAT searches in the genome sequences of chimpanzees, gorillas, and orangutans using the HML-8 consensus sequence as a query, constructed phylogenetic trees with human, and estimated the integration time.
A total of 9 chimpanzee sequences, 8 gorilla sequences, and 10 orangutan sequences identified belong to the HML-8 subgroup. These hominoid sequences with three human proviral sequences of HML-8 were used to construct phylogenetic trees to confirm the phylogenetic relationships between human and hominoids. The results showed that except for chr19: 19066083–19080391 (gorilla) and chr19: 23582963–23597406 (chimpanzee), all the other proviruses were clustered together with HML-8 consensus (Fig. 4A). In addition, we constructed chimpanzee, gorilla, and orangutan phylogenetic trees, and the results showed the HML-8 orthologous insertions in nonhuman primates (Fig. 4B–D).
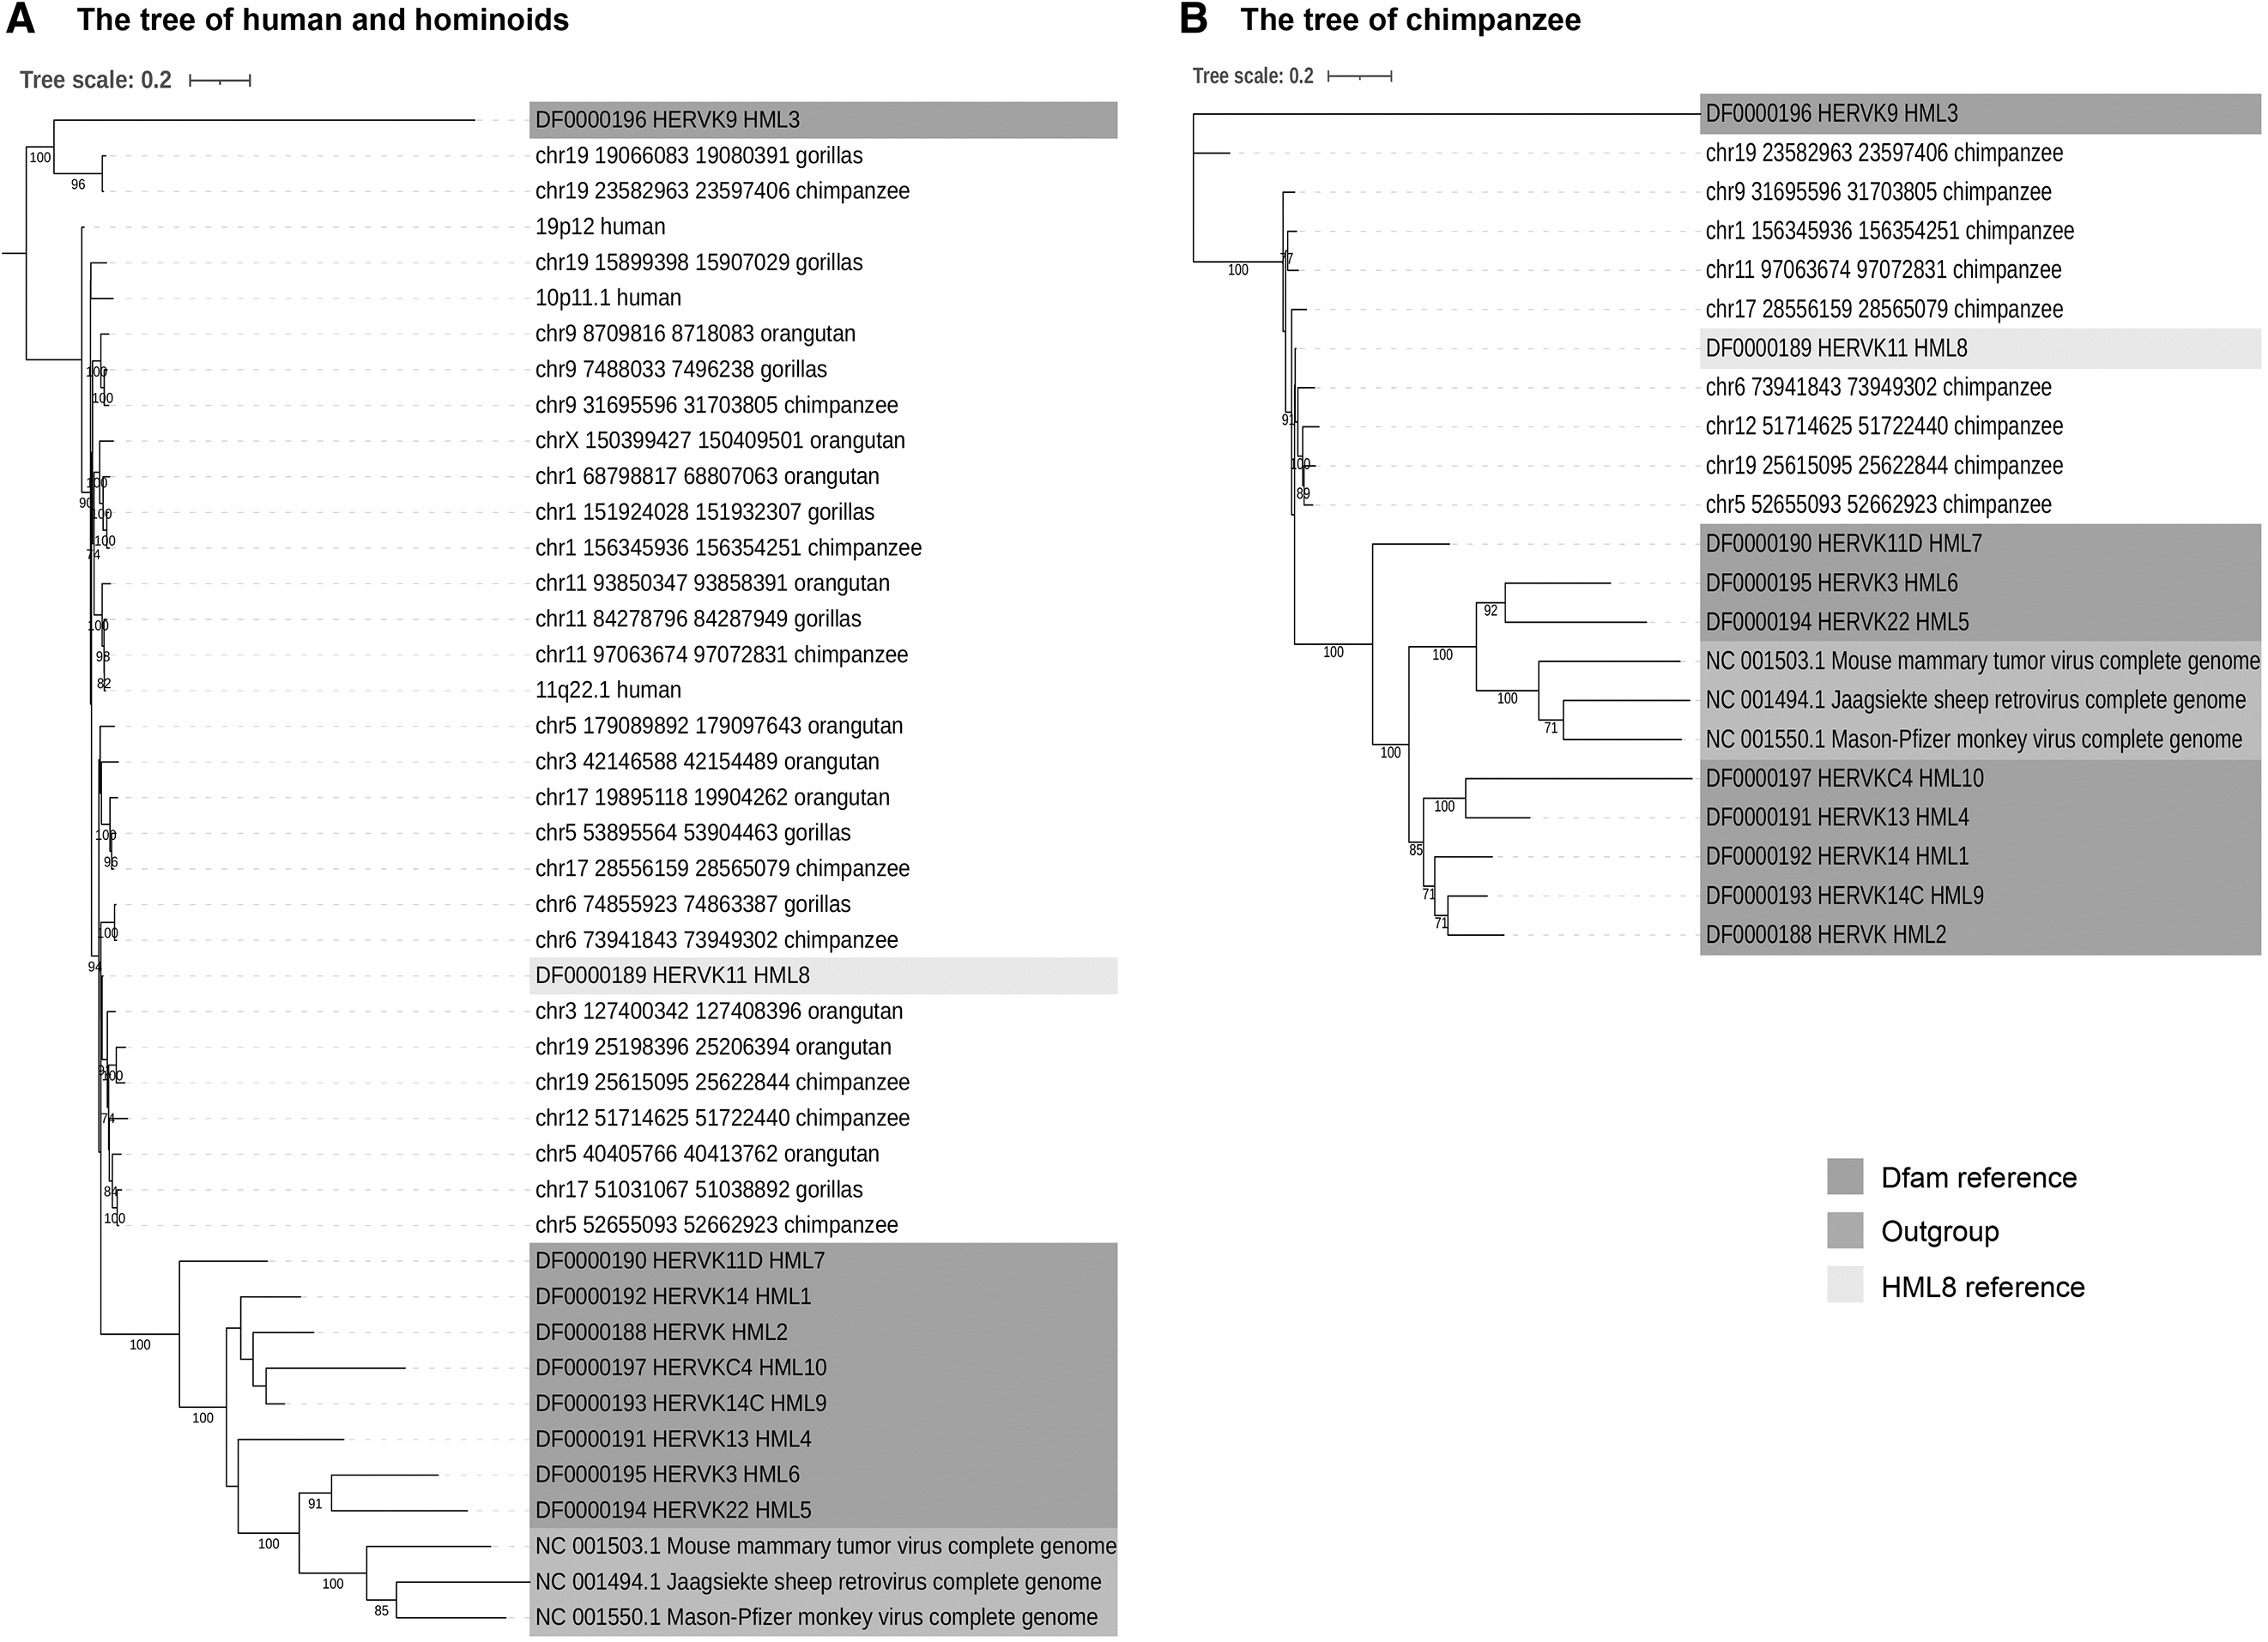
Phylogenetic analysis of the HML-8 near-full-length proviruses for human and hominoids by Maximum Likelihood method.
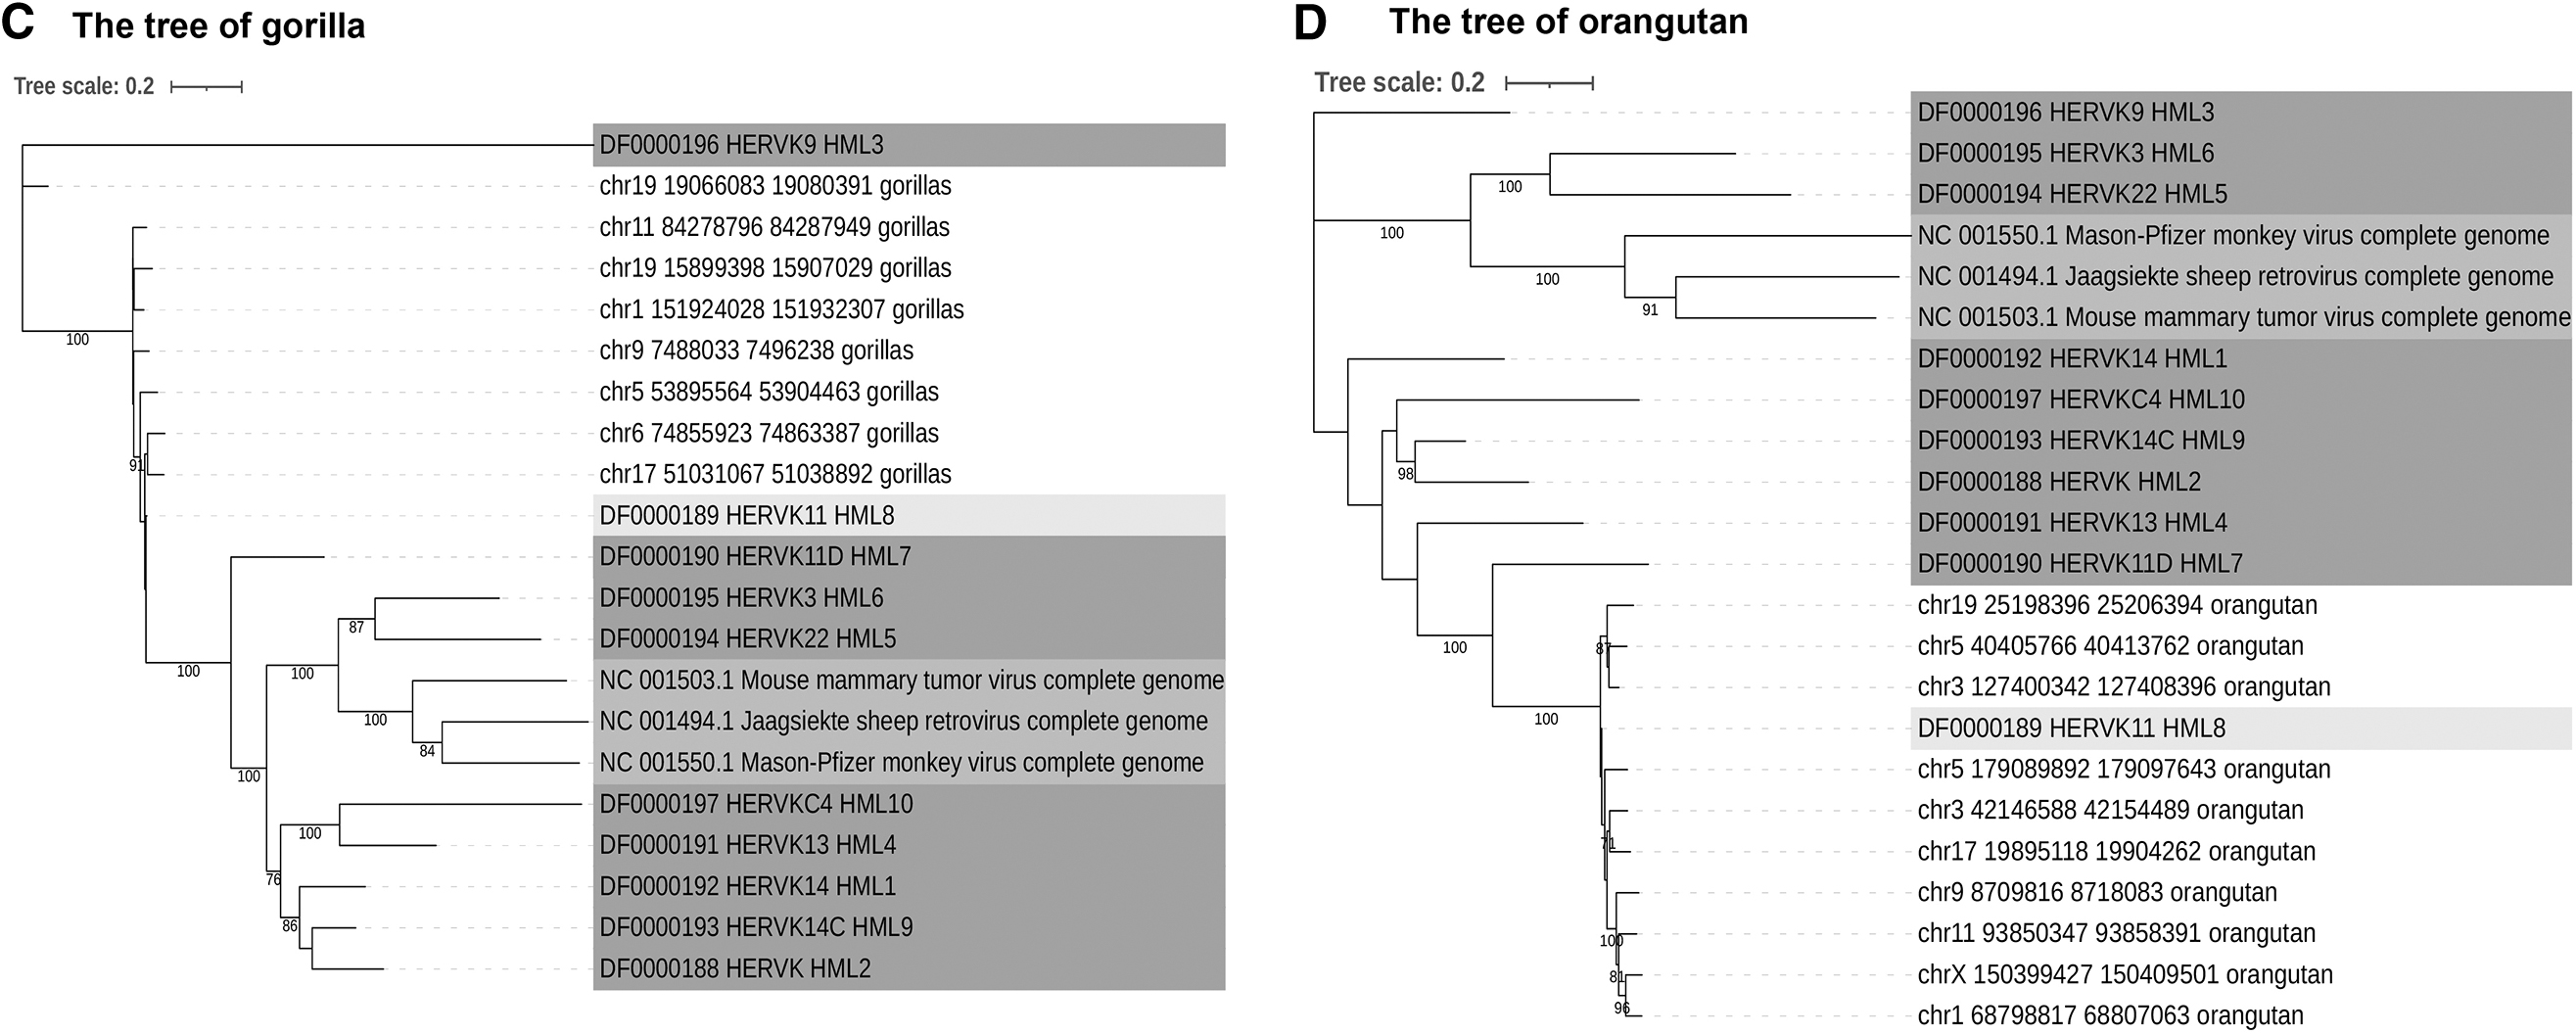
The integration time of HML-8 elements in chimpanzees, gorillas, and orangutans was also estimated. The results showed that the integration time of chimpanzees (Worksheet chimpanzees in Supplementary Table S3) ranged from 15 to 52.33 mya (the average time of integration was 35.86 mya), and the integration time of gorillas (Worksheet gorillas in Supplementary Table S3) ranged from 18.5 to 70.13 mya (the average time of integration was 39.9 mya), the integration time of orangutans (Worksheet orangutans in Supplementary Table S3) ranged from 22.5 to 92.8 mya (the average time of integration was 41.4 mya), which is consistent with that in human. Taken together, most HML-8 elements entered into the primate lineages around 35 and 42 mya, during primates' evolutionarily speciation.
Functional prediction of cis-regulatory elements and enrichment analysis
The GREAT analysis results are shown in Table 5, which describes the associations between each solo LTR and its putatively regulated gene(s). A total of eight genes were predicted. Among these, one LTR was not associated with any of the genes; the other four LTRs were associated with two genes each (Fig. 5A). The absolute distances of these eight genes to the transcription start site (TSS) were between 5 and 500 kb (Fig. 5B, C).

The genes associated with solo LTRs and GO analysis.
The Associations Between Each Solo Long Terminal Repeat and the Gene(s) It Putatively Regulates According to the Association Rule Used
Chromosome: start-end (strand). Positions are referred to the human genome sequence, assembly GRCh38/hg38.
To analyze the biological classification of key genes related to solo LTRs, gene ontology (GO) Slim summaries were performed using WebGestalt. Biological process (BP) analysis revealed that these genes were mainly enriched in metabolic processes and biological regulation (Fig. 5D). The changes in cellular components (CCs) showed that these genes were significantly enriched in the cytosol and that their molecular function (MF) was enriched in protein binding (Fig. 5E, F).
Among eight unique Entrez gene IDs, eight were annotated to the selected functional categories and in the reference list, which was used for the enrichment analysis. Based on the parameters set in the Materials and Methods section, 10 categories were identified as enriched categories. As shown in Figure 6A, a total of 10 enriched categories were identified for BPs: carnitine biosynthetic process, positive regulation of DNA ligation, regulation of DNA ligation, amino acid betaine biosynthetic process, positive regulation of protein deubiquitination, single-strand break repair, regulation of protein deubiquitination, carnitine metabolic process, pentose metabolic process, and negative regulation of fibroblast growth factor receptor signal. A bar chart showing the enrichment rate of the results was constructed. When the top results are chosen to be returned and the FDR for the categories is ≤0.05, the colors of the bars are in a darker shade than when the FDR exceeds 0.05. The volcano plot in Figure 6B shows the log2 of the FDR versus the enrichment rate for all the functional categories in the database, highlighting the degree to which the significant categories emerge from the background.
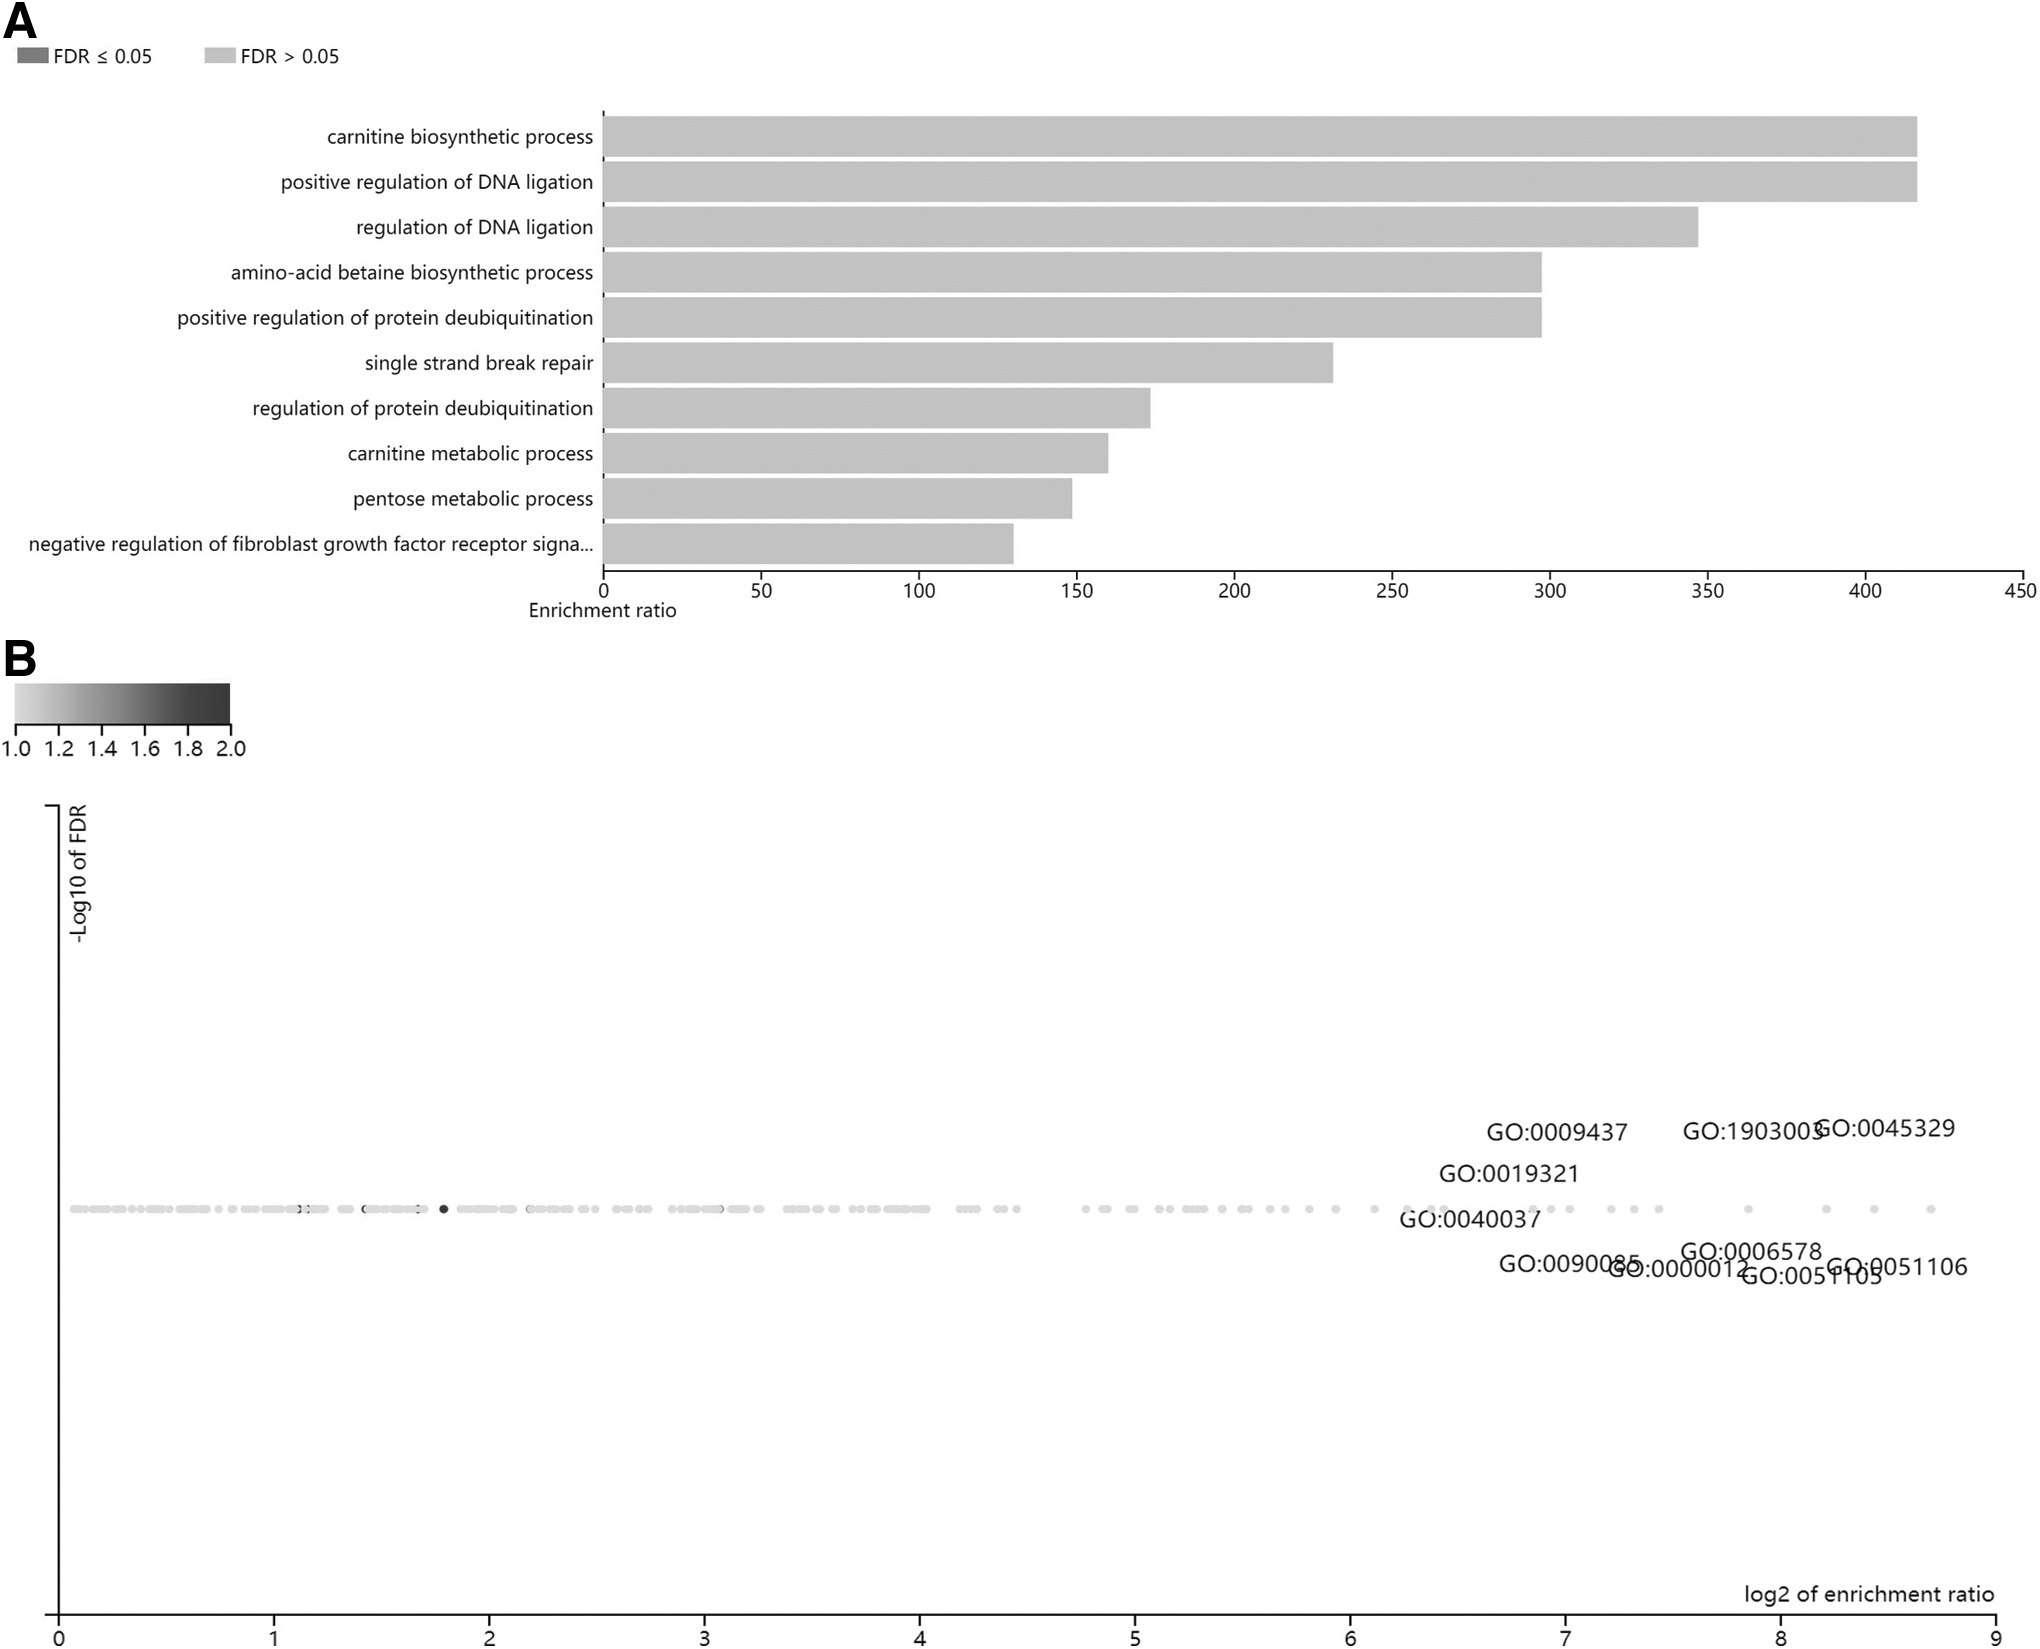
Enrichment result categories binned by Biological Process.
The size and color of the dot are proportional to the number of overlaps (for ORA). The significantly enriched categories are labeled, and the labels were positioned automatically by a force field-based algorithm run at startup. The enrichment results for CCs and MFs are illustrated in Supplementary Figures S1 and S2. Notably, these results are entirely speculative, and future research is needed to confirm any of the implied associations between solo LTRs and nearby genes.
In silico examination of the conserved transcription factor-binding sites
HML-8 exhibiting specific base insertions may influence the complexity of LTR transcriptional regulation. 21 A complete view of the putative transcription factor-binding sites within the HML-8 LTR is shown in Figure 7A. A total of 33 human transcription factor-binding sites were predicted, which included those of 21 transcription factors: HIF1A, SP1, SP2, SP4, STAT3, GATA2, GATA3, GATA4, MXI1, SOX10, RBPJ, KLF1, KLF5, KLF7, KLF12, PRDM1, CREB1, THAP1, MAZ, ZEB1, and THAP1. The motifs are indicated for the sense strand and antisense strand.
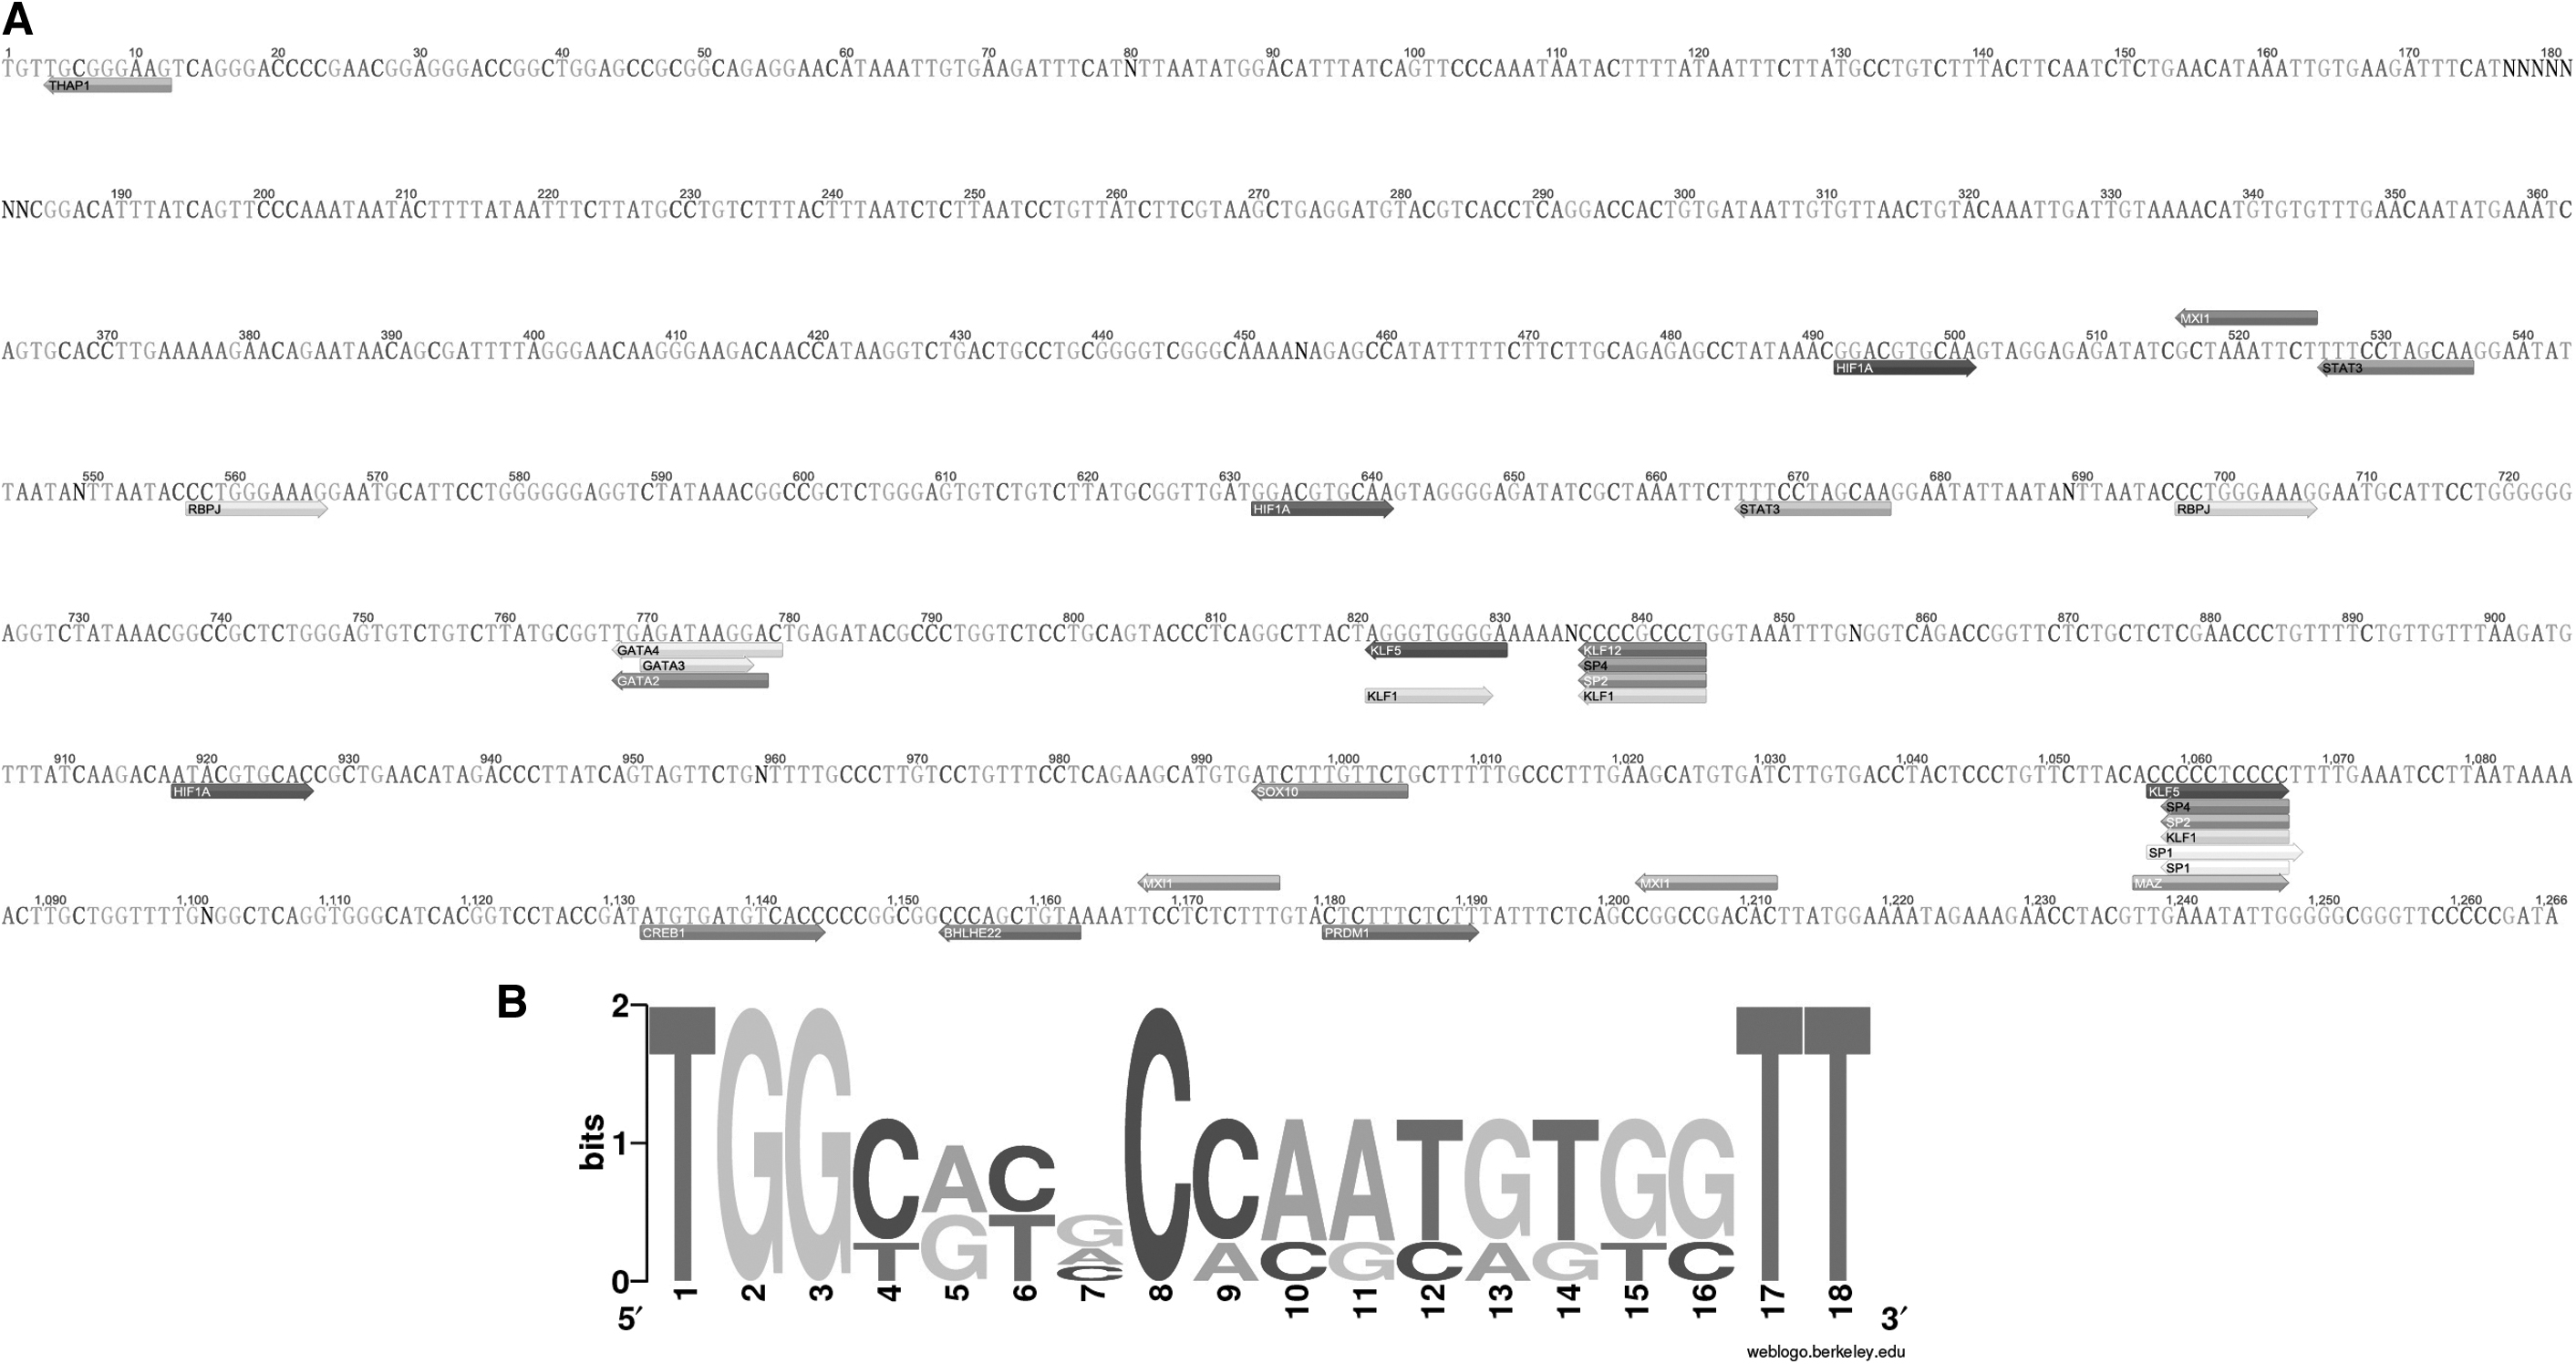
In silico examination of the conserved TFBSs and logos representing the PBSs of HML-8.
PBS features of HML-8 sequences
Traditionally, HERVs have been named according to the tRNA that binds their reverse trancriptase (RT) enzyme and PBS. 12 Thus, HERV-K is named after lysine-tRNA. In the 3 proviral and 1 consensus sequences of HML-8 elements analyzed, the PBS was located from approximately nucleotide 3–20 downstream of the 5′ LTR. To summarize the general variation of the PBS sequence within the HML-8 group, we generated a logo in which the letter height is proportional to the nucleotide conservation at each position (Fig. 7B). The results showed that the TGG starting nucleotides were the most conserved among the 18 bases analyzed. However, no PBSs belong to lysine, confirming the relatively low taxonomic value of this feature (Supplementary Table S4).
Discussion
Since the discovery that HERV-K family members play physiological and pathological roles in the human body, great attention has been dedicated to further understand their impact on hosts. One challenge that remains involves the lack of a complete and updated description of the HERV-K sequences in the human genome, the lack of information on their genomic background, and the lack of detailed knowledge of HERV-K single members. To date, the characterization and identification of HML-1 to -7 and HML-9 to -10 groups have been carried out. 21,43,55 –61 Among HML groups, HML-2 is the best-characterized one; full genomic characterization of HML-2 has been performed, and time of integration and subtypes have been investigated. 21 The precise identification of these subtypes has led to studies of their roles in physiological tumors or neurological diseases.
In the present study, we completed the identification and characterization of HML-8 proviruses and solo LTRs in human DNA, providing the first exhaustive description of this group. Following the approach carried out in a previous study, 59,60 we characterized a total of 40 HERV-K HML-8 proviruses and 5 solo LTR elements. The chromosomal distribution of these proviruses and the solo LTRs revealed a nonrandom integration pattern. Besides, all 40 identified proviral elements and 5 solo LTRs are usually enriched outside transcription units in the human genome (Tables 1 and 2). 54,62 The results revealed that these elements are mainly distributed within intergenic regions and introns. The reason may be that integration of an HERV provirus in the transcription unit is harmful and therefore subject to negative selection and elimination during evolution. 14,54,63 –66
Overall, the structural characterization revealed that only three HML-8 members (7.5%) retained the almost complete proviral structure. The majority of HML-8 elements show a defective proviral structure, with the complete loss of 5′ LTR (70%) and 3′ LTR (40%) sequences. The deletion of more than 40% of the reference length sequence of the gag, pro, pol, and env genes accounted for 52.5%, 50%, 55%, and 30% of those sequences, respectively.
Phylogenetic analysis showed that 3 sequences of HML-8 near-full-length proviruses as well as 12 sequences of gag, 15 elements of pro, 10 elements of pol, and 15 sequences of env form a unique monophyletic cluster distinctly separate from other HML groups and supported by the maximum bootstrap value. The phylogenetic tree of env regions revealed the presence of two well-supported clusters, identified here as types a and b and comprising 7 and 8 members, respectively.
Concerning the time of integration estimation, the traditional approach based on the divergence between the two LTRs of the same provirus was not applicable due to the lack of enough LTR sequences. Therefore, using gag, pro, pol, and env, we estimated the HML-8 provirus age. The results indicated that the main period of HML-8 integration occurred between 23.5 and 52 mya.
To identify HML-8 orthologous sequences in different hominoids, we screened 9 chimpanzee sequences, 8 gorilla sequences, and 10 orangutan sequences belonging to the HML-8 subgroup. The result showed that almost all hominoid sequences were clustered together with HML-8 consensus. The integration time analysis indicated that HML-8 sequences were integrated into the primate lineages around 35 and 42 mya, during primates' evolutionarily speciation. From this result, the integration time of HML-8 should be earlier than HML-2, HML-6, HML-7, and HML-10, whereas later than HML-5. 21,43,55 –61,67
A total of eight genes were identified as being potentially regulated by the five solo LTRs. GO analyses showed that these genes were mainly enriched in metabolic processes and biological regulatory processes, which indicated that these components may be involved in basic BPs. Through the prediction of transcription factors acting on HML-8 elements by JASPAR, many transcription factors were found to bind to the HML-8 sequence, indicating that HML-8 is likely to play a regulatory role in the expression of adjacent genes. It should be noted that these results are entirely prediction based. Experimental validation studies are required to confirm the associations between the LTRs and these genes.
Similar to previous work, 68,69 we further identified three proviral sequences and a consensus sequence. The result showed that no PBSs belong to lysine. This confirms that the traditional nomenclature of HERVs according to the tRNA that binds their RT enzyme and PBS 12 is imprecise.
Conclusion
In summary, the present exhaustive characterization of HML-8 composition and the genomic context of its insertion constitutes the first description of this poorly investigated group of elements. These elements can be activated in different tissues both under physiological conditions and in human disease development. Our study could contribute to better defining their real impact and contributions to the human genome.
Ethics Approval and Consent to Participate
Not applicable.
Consent for Publication
Not applicable.
Availability of Data and Materials
All data generated or analyzed during this study are included in this published article.
Footnotes
Acknowledgment
The authors thank Mingyue Chen for her help in data analysis.
Authors' Contributions
Research design: L.L. and C.Y. Performed the analysis: L.J., X.G., X.Z., H.L., J.H., X.W., Y.L., T.L., B.Z., Y.W, and J.L. Contributed to the composition of the article: M.L., L.J., and L.L.
Author Disclosure Statement
The authors declare that they have no competing interests.
Funding Information
This study was supported by NSFC (31900157).
Supplementary Material
Supplementary Dataset S1
Supplementary Figure S1
Supplementary Figure S2
Supplementary Table S1
Supplementary Table S2
Supplementary Table S3
Supplementary Table S4
References
Supplementary Material
Please find the following supplemental material available below.
For Open Access articles published under a Creative Commons License, all supplemental material carries the same license as the article it is associated with.
For non-Open Access articles published, all supplemental material carries a non-exclusive license, and permission requests for re-use of supplemental material or any part of supplemental material shall be sent directly to the copyright owner as specified in the copyright notice associated with the article.