
Abstract
Despite virological suppression, the CD4+ T lymphocytes are not restored in some HIV-infected patients after antiretroviral therapy. These individuals are known as immune non-responders (INRs). INRs are at high risk of developing AIDS and non-AIDS-related events and have a shorter life expectancy. Hence, it is vital to identify INRs early and prevent their complications, but there are still no specific diagnostic indicators or models. Ferroptosis has lately been reported as a type of programmed cell death, which plays an indispensable part in diverse diseases. However, its particular regulatory mechanisms remain unclear and its function in the pathogenic process of defective immunological recovery is still unknown. Blood is mainly used for rapid diagnosis because it enables quick testing. To investigate the role of ferroptosis-related genes (FRGs) in early detection of INRs, we scrutinized Gene Expression Omnibus datasets of peripheral blood samples to estimate their effectiveness. To our knowledge, for the first time, gene expression data were utilized in this study to discover six FRGs that were explicitly expressed in peripheral blood from INRs. Later on, multiple machine-supervised learning algorithms were employed, and a superlative diagnostic model for INRs was built with the random forest algorithm, which displayed satisfactory diagnostic efficiency in the training cohort (area under the curve [AUC] = 0.99) and one external validation cohort (AUC = 0.727). Our findings suggest that FRGs are implicated in the development of defective immune recovery, presenting a potential route for early detection and potential biological targets for the most effective treatment of defective immune recovery.
Introduction
Antiretroviral therapy (ART) can effectively block viral replication in HIV-infected patients, raise the CD4+ T lymphocyte (CD4 cell) counts to normal limits (500 cells/μL) in majority of patients, and identify them as immune responders (IRs). 1 However, 15%–30% of individuals who are referred to as immune non-responders (INRs) tend to have CD4 cell counts below 500 cells/μL even after years of ART. 2 In INRs, changing or intensifying the ART regimen has had little impact on the CD4 cell count.
Low CD4 recovery is associated with late ART onset, nadir CD4 cell count, pretreatment viral load (VL), older age, and signs of inflammation. 3 –5 Persistently low CD4 cell counts can accelerate AIDS disease progression and increase mortality from non-AIDS-related diseases. The mechanisms by which defective immune recovery occurs during ART are not yet fully understood. 6
At present, there is no set standard over what constitutes a defective immune recovery. The generally accepted standard is the U.S. Department of Health and Human Services (DHHS) definition for defective immune recovery: patients who have received effective antiretroviral medication for 4–7 years, but whose CD4 cell counts have not risen to 350–500 cells/μL. 1 However, the long time between the start of treatment and the diagnosis of INRs in this definition certainly adds to the difficulty of early prevention and treatment of INRs. Therefore, it is crucial to be aware that quick methods and biomarkers are still needed to identify INRs early.
In 2012, Stockwell introduced the novel form of regulated cell death known as ferroptosis, which is a type of cell death driven by iron-dependent lipid peroxidation damage. Iron deposition and subsequent lipid peroxidation are crucial factors in ferroptosis. 7 During the onset of ferroptosis, intracellular Fe2+ accumulation mediates generation of large amounts of lipid reactive oxygen species (ROS), which oxidize polyunsaturated fatty acids on the cell membrane, damaging it and leading to cell death. 8
The oxygenation–antioxidation equilibrium is disrupted, lipid ROS accumulate, and lipid peroxidation occurs in the cell membrane when intracellular antioxidant glutathione is constantly reduced. This also causes a reduction in activity of glutathione peroxidase 4. Lipid peroxidation then leads to loss of cell integrity and cell death, a process that antioxidants and iron chelators can inhibit. Genes regulating iron homeostasis, lipid metabolism, and amino acid metabolism are closely related to the biological process of ferroptosis. 9
Ferroptosis has recently been implicated in various diseases and functions as a tumor suppression mechanism. 10 –13 Immunotherapy-activated CD8+ T lymphocytes can exert their antitumor actions by boosting tumor cells' ferrogenesis. 14 Although evidence illustrates the significance of ferroptosis in cancer, few pieces of research focus on its function in HIV infection or therapy.
In the domain of HIV infection-related diseases, it is reported that dysregulation of iron homeostasis exacerbates the HIV condition and plays a crucial part in the pathogenesis of Alzheimer's disease. 15 Additionally, it has been stated that compared with uninfected cells, HIV-infected cells showed higher signs of programmed cell death, such as apoptosis, pyroptosis, and ferroptosis. 16 However, in HIV-related illnesses, particularly in the inadequate immunological response, the underlying modulation of ferroptosis remains obscure.
In this study, we used the Gene Expression Omnibus (GEO) database to screen the differentially expressed genes (DEGs) in INRs. Then, the genes associated with ferroptosis were extracted from the FerrDb database (
Ultimately, after contrasting five supervised machine learning algorithms, we created and assessed a random forest (RF) diagnostic model that was based on these genes and ratified it in another dataset in GEO. Furthermore, as far as we are aware, no machine learning technique is used to forecast INRs, following protracted ART.
Methods
Data collection
Two related HIV databases, GSE143742 and GSE106792, were picked and downloaded from the GEO database (
The standard adopted in GSE106792 is as follows: INRs were defined as having CD4 cell counts under 350 cells/μL and IRs as having CD4 cell counts higher than 350 cells/μL after no less than 2 years of ART with virologic constraints. 22 In GSE143742, the criteria for INRs are ART for at least 3 years and CD4 cells <350 cells/μL and the criteria for IRs are ART treatment for at least 3 years and CD4 cells >500 cells/μL.
All of the data are freely available online. The scale function in the R 4.0.3 program was then used to normalize and check the quality of these two gene expression profiles.
Differential gene expression
The linear models for microarray data analysis (LIMMA) R package was used to determine the genes whose expression varied between INR and IR samples. The criteria were as follows: (1) adjusted p < .05, a moderate t-test corrected by Benjamini and Hochberg's method; and (2) log fold change (FC) of genes ≥0.5. The ggplot and pheatmap packages were then used to create heat maps and volcanic maps for the dataset.
Gene set enrichment analysis
With the help of Java GSEA software, version 3.0 (
Collection of ferroptosis-related genes
Genes associated with ferroptosis were gathered and obtained from the FerrDb database (
Analysis of differential FRGs
Pod plots show the differential expression of FRGs. Protein–protein interaction (PPI) networks, encompassing direct and indirect interactions between proteins and their functional correlations, are predicted using the STRING database (version 11.5). Additionally, the prcomp package was used to conduct principal component analysis (PCA) on the genes associated with ferroptosis, which were differentially expressed, as a dimension reduction technique to separate INR and IR groups.
Construction of diagnostic prediction models through machine learning
A prediction model for INR diagnosis that was based on FRGs was constructed by taking those genes' differential expression levels as independent variables. In this study, the test set was the GSE106792 dataset, with the GSE143742 dataset functioning as the training and validation set (4:1). To raise the training set's competence to generalize results, we utilized K-fold cross-validation with cv = 15 in this study to counteract the overfitting phenomena that were caused by the complex model.
With the Python library sklearn.model selection, feature selection was applied. To establish the diagnostic prediction model, five alternative supervised machine learning algorithms were first employed. Among the five algorithms, logistic regression (LR) and artificial neural network (ANN) were built through the pROC, ggplot, neuralnet, neuralnettools, caret, glmnet, and pheatmap packages in R. The least absolute shrinkage and selection operator (LASSO), SVM classifier, and random forest were implemented with the sklearn.linear_model, sklearn.svm, and sklearn.ensemble Python libraries.
After evaluating the effectiveness of various models, we discovered that random forest was the best classifier for constructing an INR prediction model. The diagnostic model's capacity for generalization was then measured using one external validation cohort. R's pROC package was used to display receiver operating characteristic (ROC) curves, and after the validation set had been used to validate the prediction model, the test set was then utilized to reveal the diagnostic model's power to generalize results.
Results
Research flow chart and collection of FRGs
GSE143742, a GEO dataset of INRs and IRs, was retrieved for additional differential gene screening from the GEO database. There were 44 INRs and 17 IRs in this dataset. After quality assurance and normalization of the gene expression matrix, analysis of differential expression and functional enrichment was conducted. Then, 290 FRGs were confirmed, making use of the FerrDb database and other earlier published references. These genes' expression differences were then tested in the two groups using the intersection of differentially expressed and FRGs.
Additionally, the PPI network of these distinct FRGs was constructed. The GSE143742 dataset was split into training and validation sets using a 4:1 ratio. After K-fold cross-validation, comparisons of several machine learning methods, and validation on the test set, GSE106792, which included 12 INRs with 12 IRs, a diagnostic prediction model of INRs based on the RF approach was created (Fig. 1).
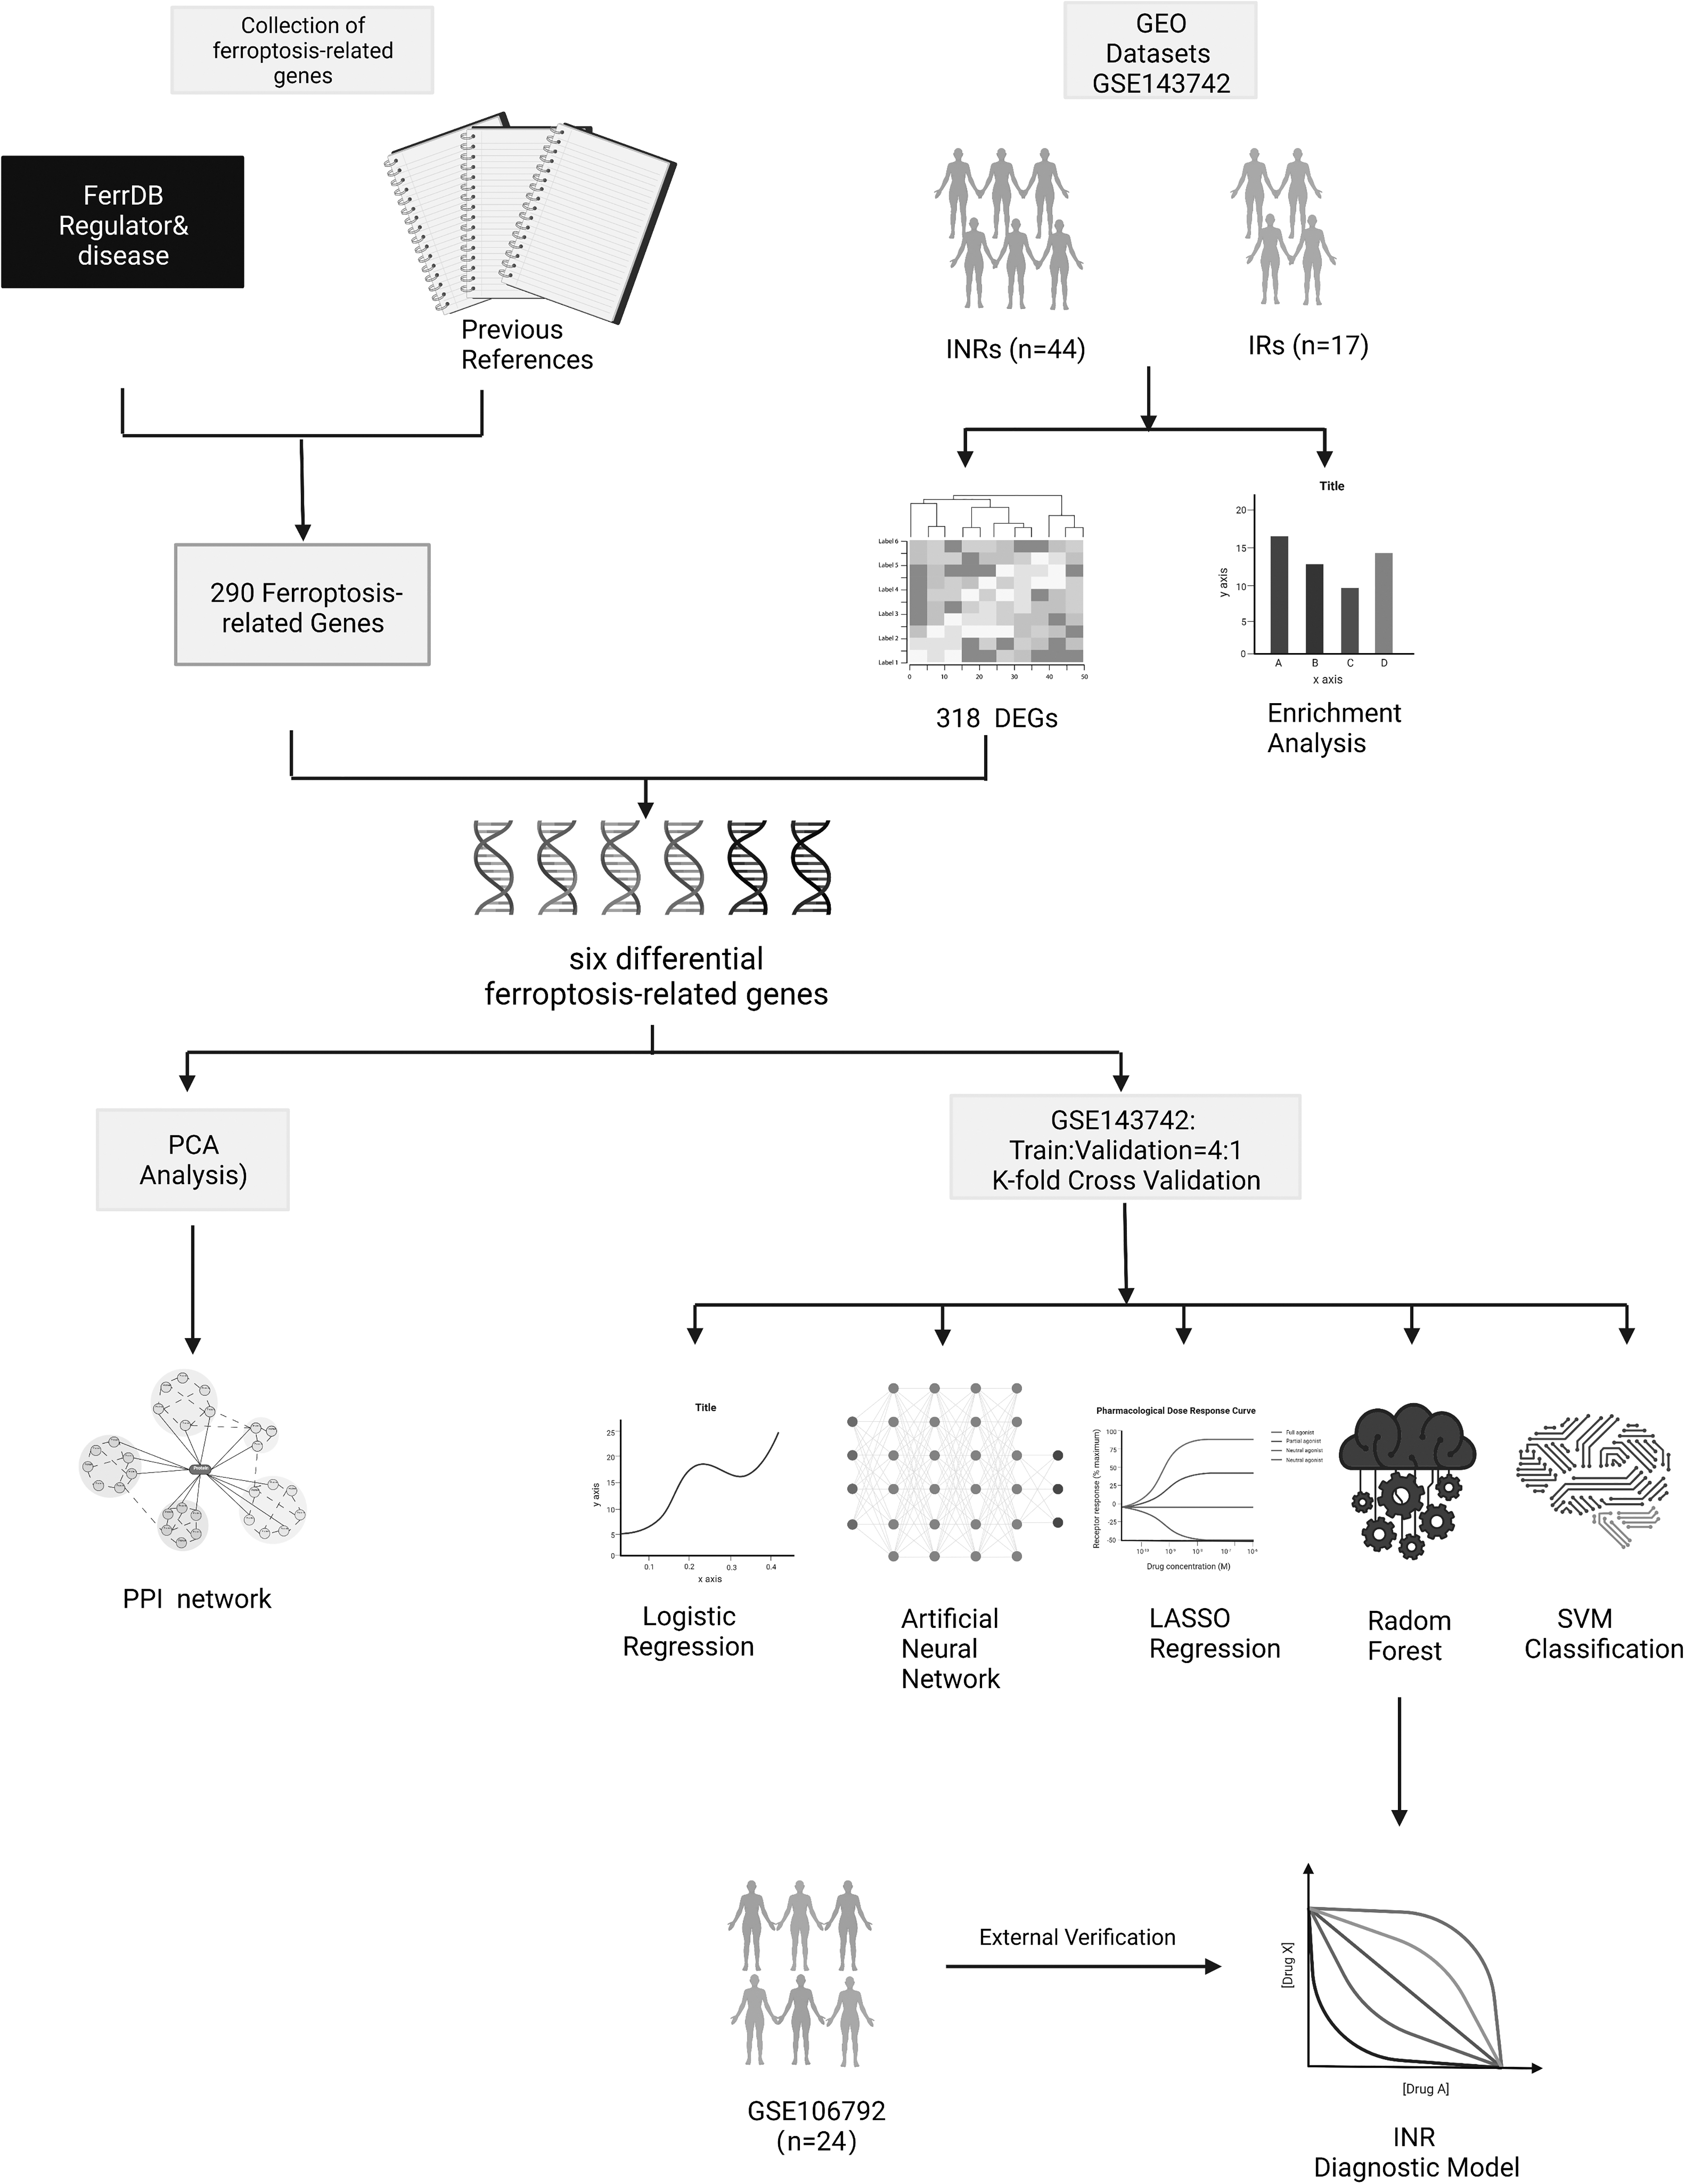
Flow chart of research design and analysis. GSE143742 was used to examine the genes that are DEGs between INRs and IRs. Genes involved in ferroptosis were gathered from the FerrDb database and other sources. Six differential ferroptosis-related genes were chosen to build a clinical diagnosis model after the DEGs and ferroptosis-related genes were examined. Compared with other supervised learning techniques, such as the RF, LASSO, SVC, LR, and ANN, the INR diagnosis model was created using the RF methodology, which was validated externally with GSE106792. ANN, artificial neural network; DEGs, differentially expressed genes; GEO, Gene Expression Omnibus; INRs, immune non-responders; IRs, immune responders; LASSO, least absolute shrinkage and selection operator; LR, logistic regression; PCA, principal component analysis; PPI, protein–protein interaction; RF, random forest; SVC, support vector classification; SVM, support vector machine.
Verification and function analysis of DEGs in INRs
The limma R package was used to calculate the logFC for 61 samples from the GSE143742 INR and IR groups after normalization. Heat maps and unsupervised hierarchical clustering were used to discover differential genes (Fig. 2A). Then, 318 genes, differentially expressed between the INR and IR groups, were picked after the threshold parameters (logFC >0.5 and adjusted p value <.05) were set, including 152 downregulated genes and 166 upregulated genes (Fig. 2B).
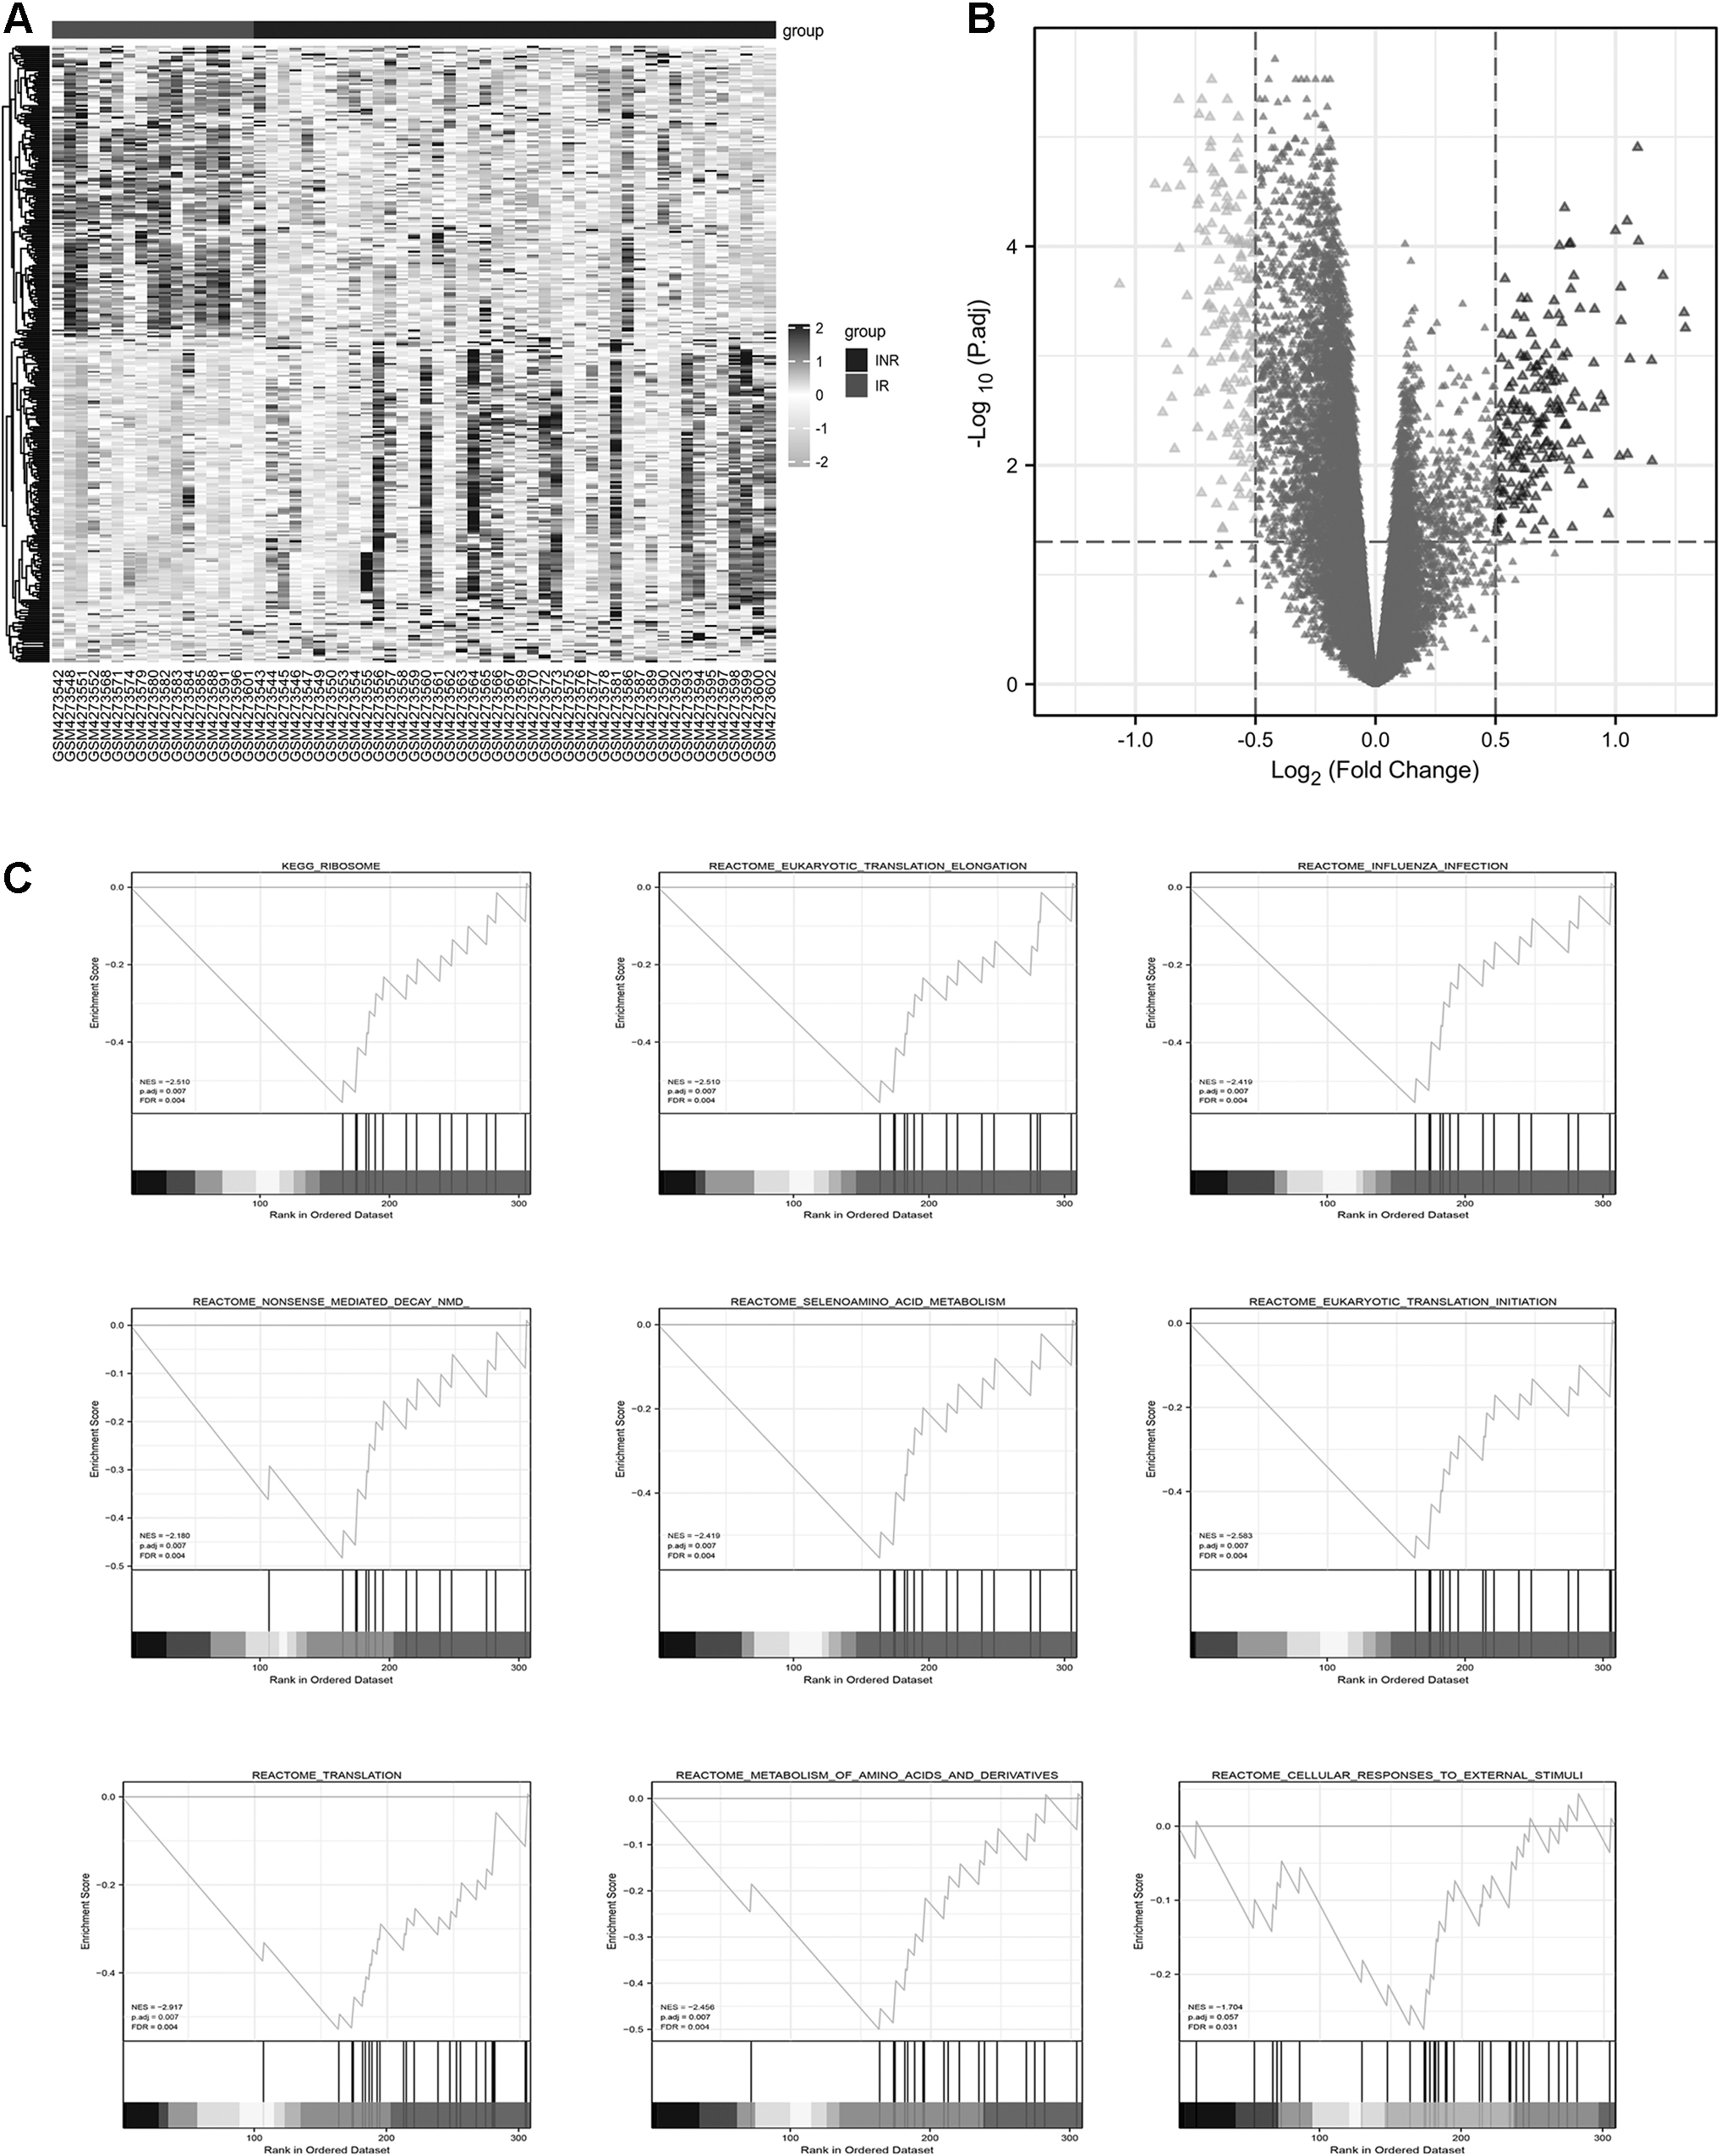
Verification and functional evaluation of DEGs in INRs.
We next carried out GSEA to acquire insights into the biological processes involving the DEGs in INRs and further study the pathophysiological functions of these DEGs in INRs. The GSEA-identified gene sets related to ribosome, eukaryotic translation elongation, influenza infection, nonsense-mediated decay (nmd),” selenoamino acid metabolism, eukaryotic translation initiation, translation, metabolism of amino acids and derivates, and cellular responses to external stimuli were enriched in IRs (Fig. 2C).
Corresponding literature confirmed and echoed these pathway enrichments. 23 –25
Expression and functional analysis of differentially expressed FRGs
Initially, we discovered 318 genes that were expressed differently from the chip and collected 290 FRGs through public sources (Fig. 3A). Six differentially expressed FRGs were detected by combining the collected FRGs with the DEGs referred to above, including HIF1A (hypoxia-inducible factor 1 subunit alpha), JUN (jun proto-oncogene, AP-1 transcription factor subunit), CD44 (CD44 molecule), UBC (ubiquitin C), HSPB1 (heat shock protein family B [small] member 1), and GPX1 (glutathione peroxidase 1) (Fig. 3B).
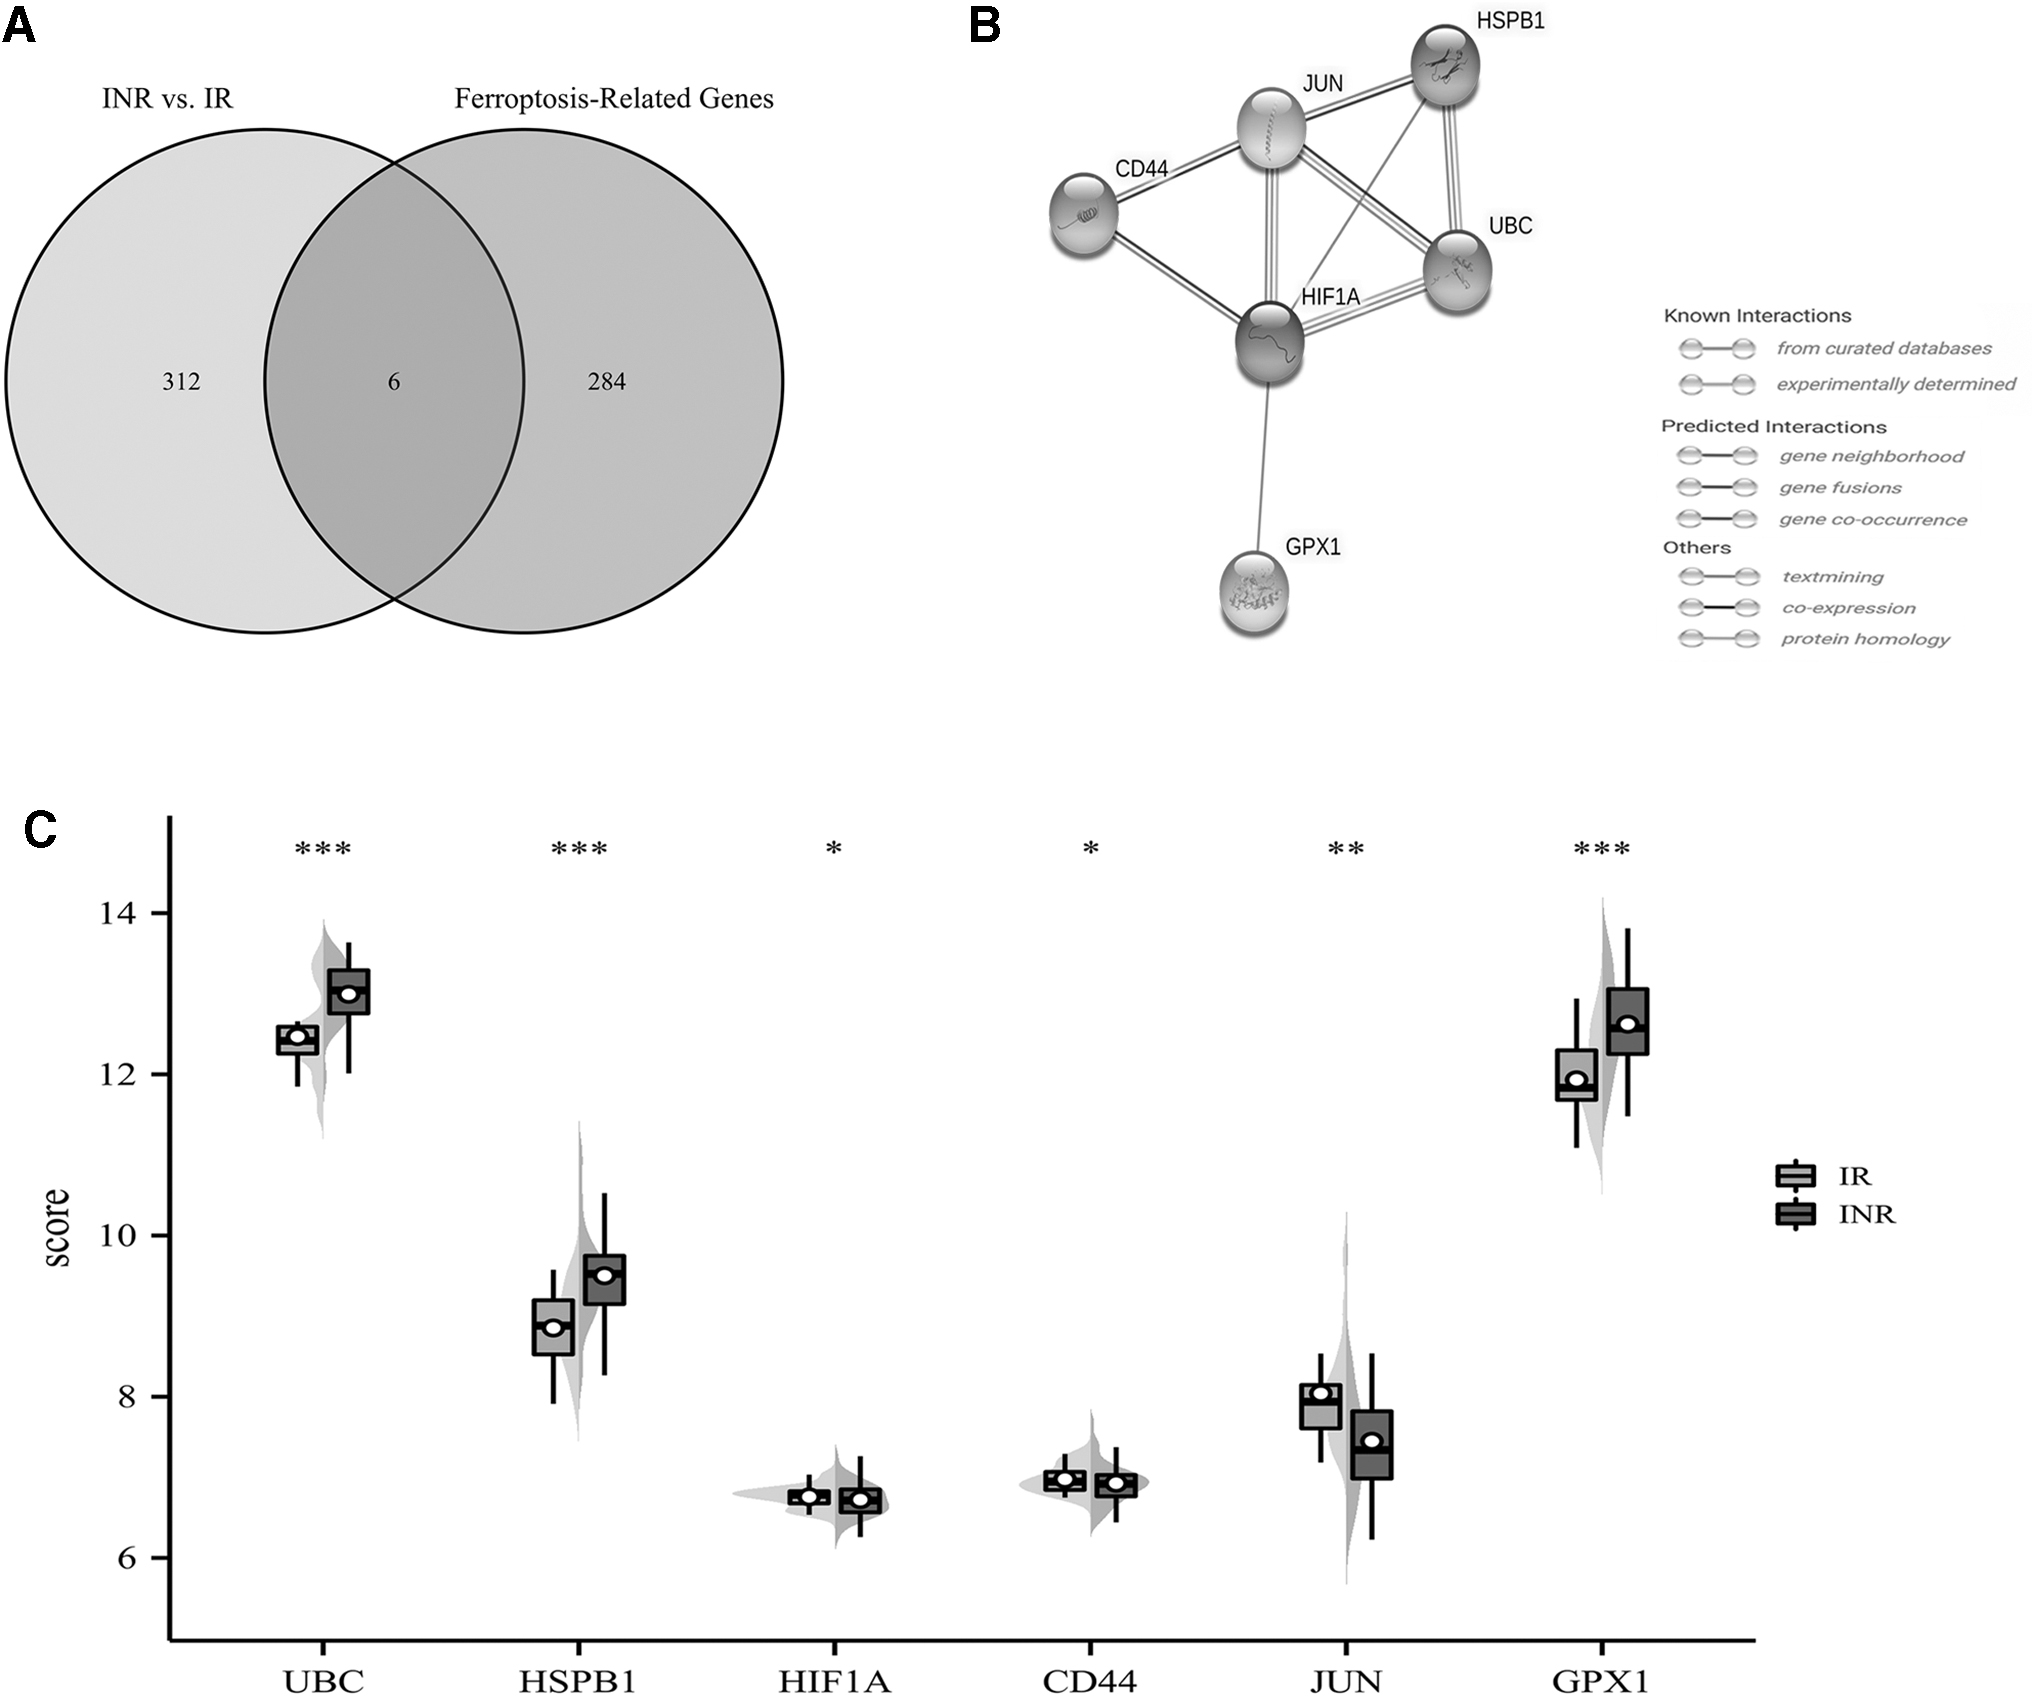
Different ferroptosis-related gene expression levels and functional characterization in INRs.
Table 1 illustrates pertinent information about all these genes. Using the String database, a PPI network of these genes was generated, revealing HIF1A and JUN as the hub genes (Fig. 3B). UBC, HSPB1, and GPX1 were upregulated in INRs, while HIF1A, CD44, and JUN were downregulated in INRs (Fig. 3C).
Summary of the Ferroptosis-Related Genes Differentially Expressed in Immune Nonresponders
Construction of the diagnostic model based on FRGs with differential expression
First, as a dimension reduction technique, PCA was carried out on the aforementioned differentially expressed FRGs. The findings demonstrate that the INR and IR groups could be precisely distinguished, suggesting that these different genes may be utilized as independent feature markers for the diagnosis of INRs (Fig. 4A). Second, the GSE143742 dataset, including 44 INRs and 17 IRs, was taken as the validation and training set (4:1) and the GSE106792 dataset, including 12 INRs with and 12 IRs, was considered to be the test set.
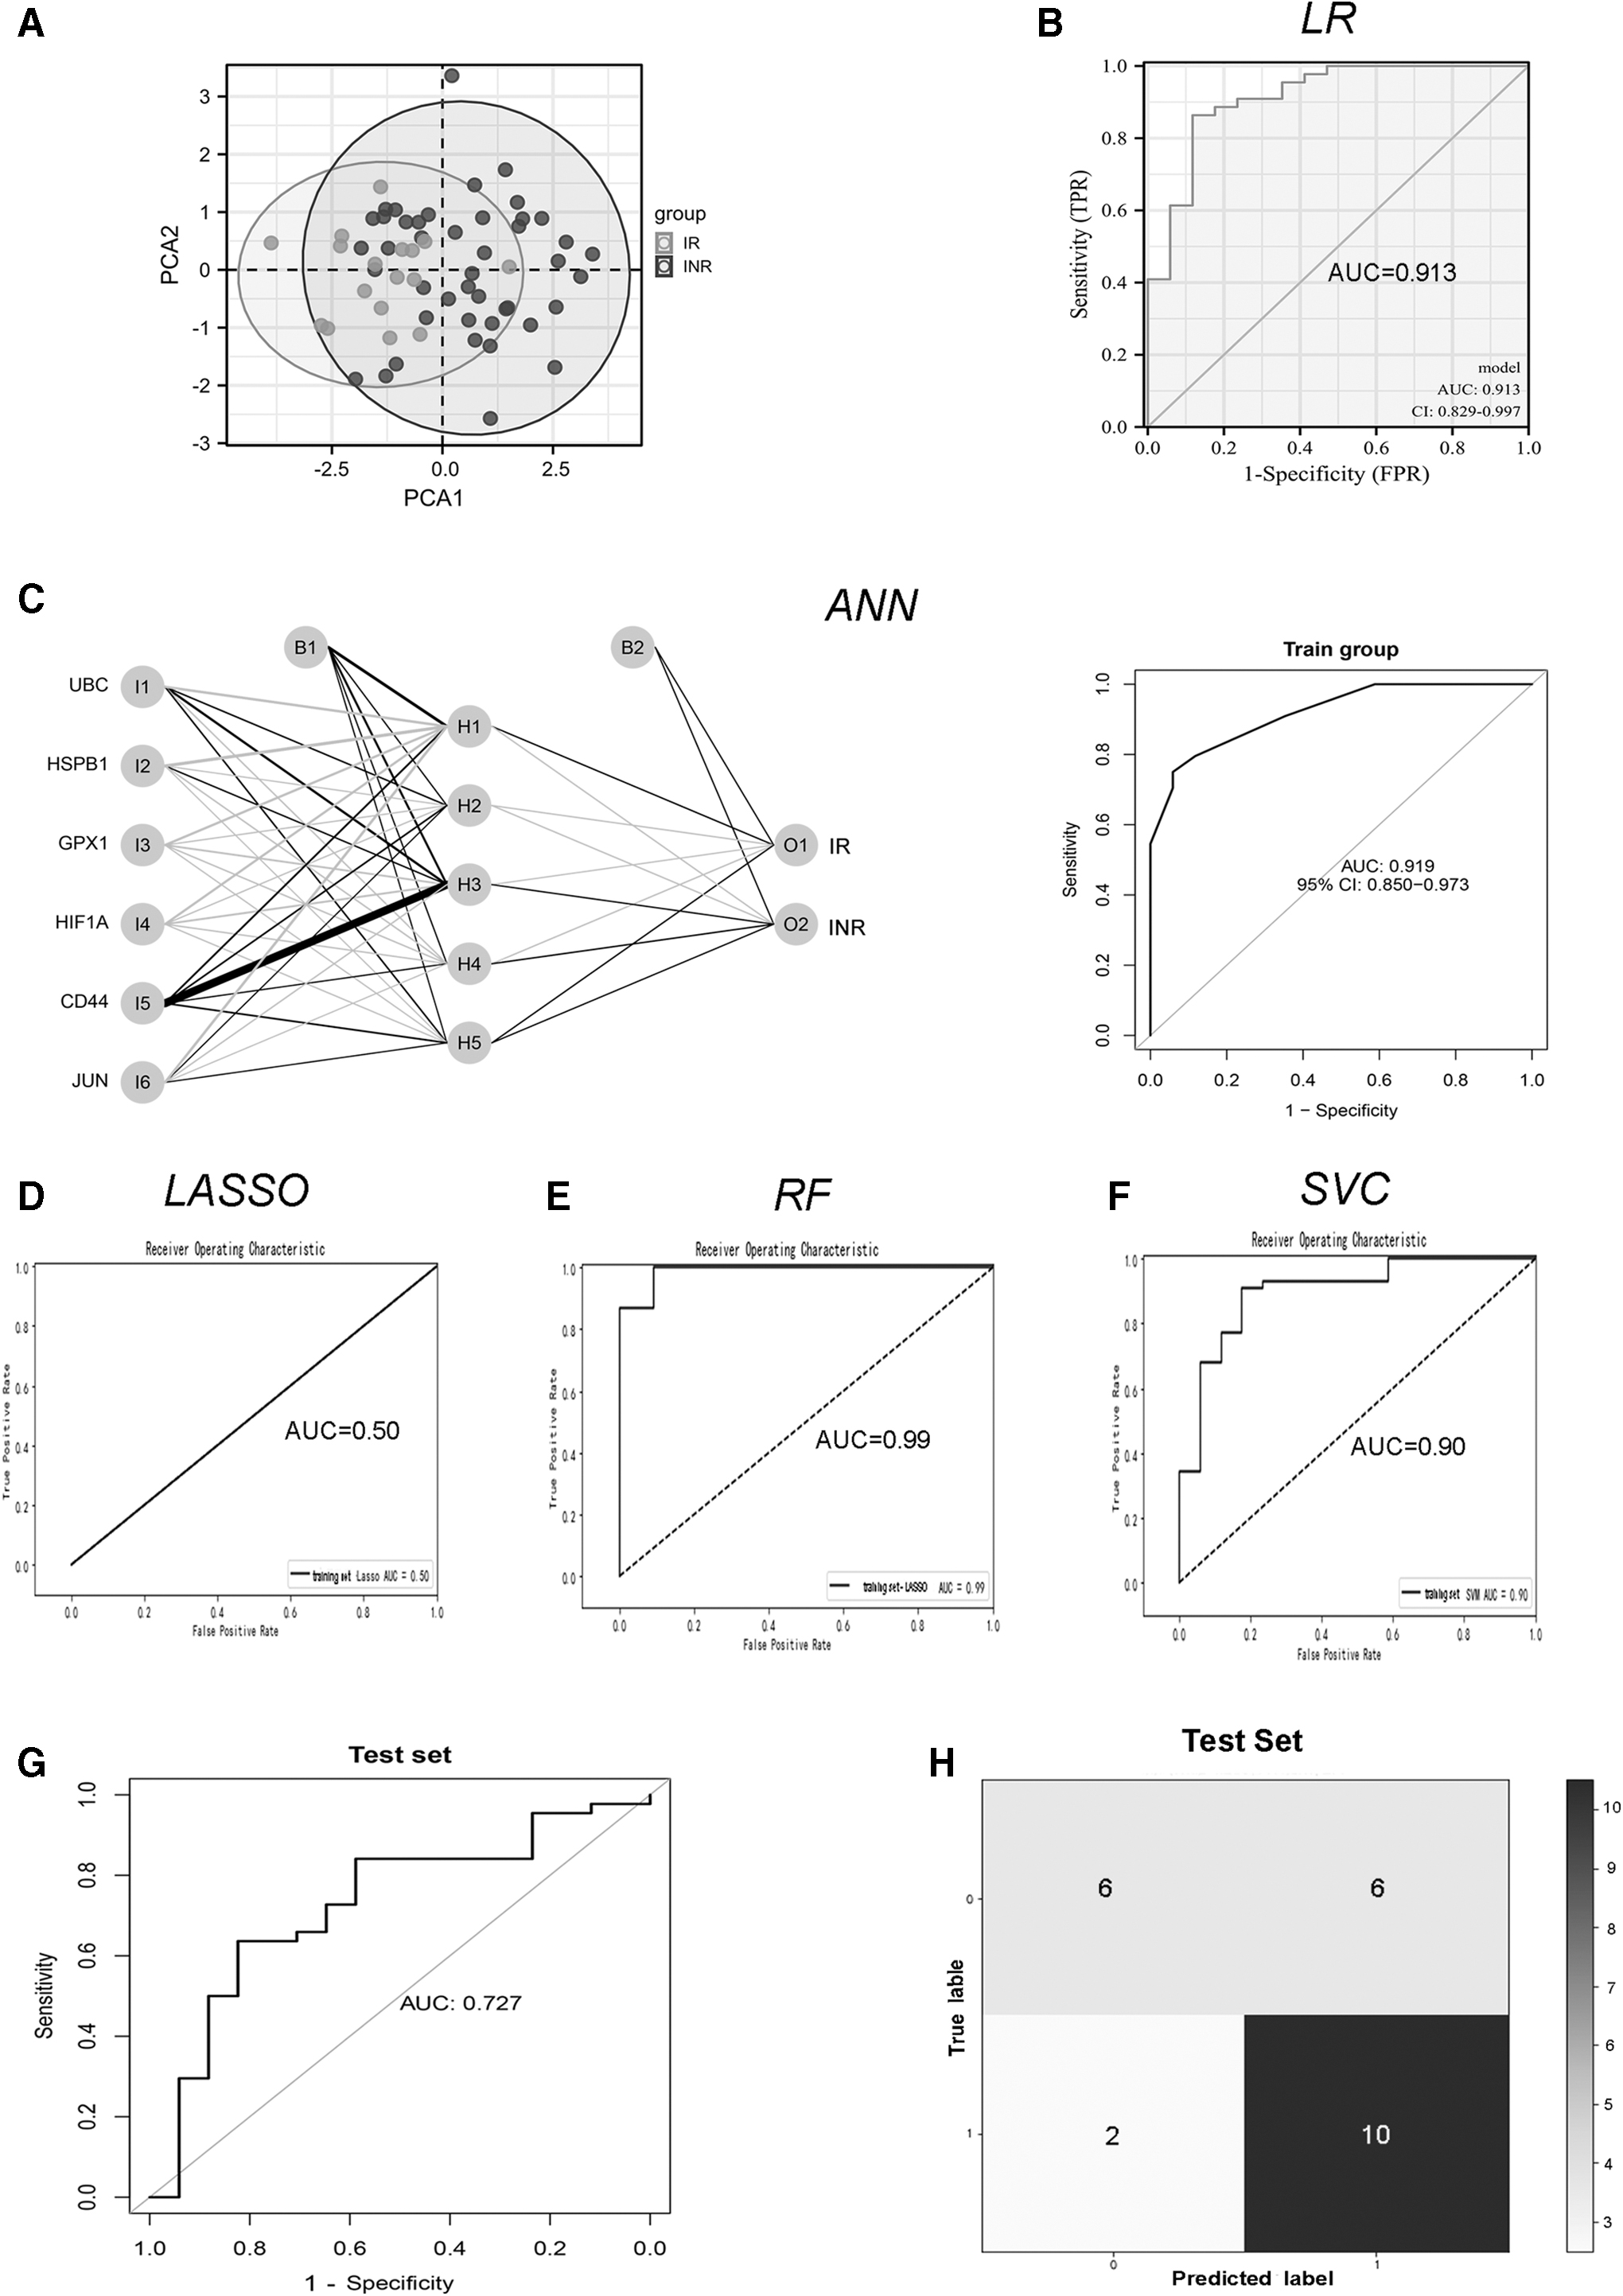
Development of the RF diagnostic model for INRs based on distinct ferroptosis-related genes (INRs).
The training set's generalization capacity was enhanced to avoid overfitting after using K-fold cross-validation with cv = 15. The diagnostic prediction model of INRs was then built using five different supervised machine learning algorithms, including LR, ANN, LASSO, RF, and support vector classification (SVC).
Table 2 displays the evaluation outcomes for all five algorithms. Using the Youden index (Youden index = sensitivity + specificity −1, YI), the appropriate threshold's sensitivity, specificity, and accuracy were calculated. The optimum cutoff value was determined using Youden index's maximum value, often known as Youden's J statistic (J = sensitivity + specificity −1).
Comparison of Diagnostic Effectiveness of the Test Set's Five Different Supervised Learning Models
AUC, area under the curve; LASSO, least absolute shrinkage and selection operator; ROC, receiver operating characteristic.
In this study, it is revealed that the RF method is most advantageous for separating the two groups with YI = 0.88, whereas the YI values of the other four algorithms were 0.75, 0.45, −0.28, and 0.00, respectively. Additionally, we discovered that the RF model's diagnostic precision (accuracy = 0.96) was higher than that of the other four models (accuracy = 0.95, 0.83, and 0.72).
Furthermore, another evaluation characteristic that was crucial for identifying INRs was the recall rate. The recall rate of the RF algorithm, LASSO regression model, and SVC (recall = 1.0) was higher compared with the other two models (LR model, 0.86; and ANN, 0.98). It was disclosed that the RF model could minimize the amount of missed INR instances, which might provide the possibility of early drug change or adjuvant therapy.
Besides, the ROC curves of the validation set from GSE106792 likewise implied that the RF model's area under the curve (AUC) was 0.99, more eminent than those of the other four groups (AUC = 0.91 for the LR model, 0.92 for the ANN, 0.50 for the LASSO regression model, and 0.90 for the SVC) (Fig. 4B–F). After careful examination of these parameters, the RF approach was chosen to build the INR model further.
Simultaneously, the diagnostic model based on the RF approach was externally validated using GSE106792 as a test set. By external data, the ROC curve in Figure 4G is supported and its AUC is 0.829 (Fig. 4G), indicating an impressive diagnostic performance. Additionally, the classification model's confusion matrix has been shown for evaluation (Fig. 4H). Ten INRs were correctly classified, and six IRs were successfully separated.
Admittedly, we also noticed that certain INRs (n = 2) and IRs (n = 4) were mislabeled as INRs and IRs. However, overall, the RF model's diagnostic accuracy and efficacy were high.
Discussion
AIDS, a disease caused by HIV infection, is a significant public health problem that seriously threatens public health worldwide, and ART has made AIDS a treatable chronic disease. 2 ART can inhibit HIV-1 RNA replication, reduce plasma HIV-1 RNA to undetectable levels, improve immune system function, and markedly reduce the incidence and mortality of AIDS patients. Recent studies have found that some HIV patients with well-controlled VLs fail to achieve optimal immune reconstitution and even undergo disease progression or mortality. 6
Guidelines issued by the U.S. DHHS consider a CD4 cell count below 350 cells/μL or 500 cells/μL after 4–7 years of ART as a diagnostic criterion for defective immune recovery. 1 Most previous studies have focused on the long-term immune rebuild in patients with AIDS. Still, fewer studies have examined patients with early deficient immune recovery after short-term ART treatment. 26,27 Therefore, this study aimed to construct a diagnostic model for the early discovery of INRs, offering the possibility of early intervention for INRs.
Iron-dependent lipid peroxide aggregation is the cause of the newly discovered form of cell death known as ferroptosis. 18 In contrast to necrosis, apoptosis, and autophagy, ferroptosis is morphologically devoid of development of autophagic lysosomes. The prominent organelle involved is the mitochondria, showing cellular wrinkling and increased mitochondrial membrane density, while not having typical apoptotic and necrotic features. 28
Intracellular iron accumulation and lipid peroxidation are critical cellular lethal pathways for ferroptosis. 8 The mechanisms by which ferroptosis occurs are mainly related to disorders of iron metabolism, imbalance of the amino acid antioxidant system, and lipid peroxide accumulation. 9 When there is an excess of free iron in cells owing to malfunctions in iron metabolism, it is catalyzed by the Fenton reaction to produce ROS, which then boosts lipid peroxidation, giving rise to accumulation of lipid peroxide and inducing ferroptosis. 29
Ferroptosis has been linked to the emergence of a number of illnesses in recent years, including viral infections, 30 liver diseases, 31 and cancers. 32 In the field of HIV, according to earlier research, HIV-infected cells display higher apoptosis, pyroptosis, and ferroptosis, three types of programmed cell death, compared with uninfected cells. 16 Rapid iron accumulation and lipid peroxidation in the brain, hallmarks of ferroptosis, were observed in HIV patients infected with cryptococcal meningitis. 33 Both HIV and antiretroviral combination drugs increase the risk of iron toxicity by enhancing ferritin autophagy at the lysosomal level. 15,34 However, the relationship between HIV immune nonresponse and ferroptosis remains unknown.
Machine learning is the core of artificial intelligence, which is essentially an algorithm that enables machines to learn patterns from large amounts of data, form corresponding models, and validate and improve these models to identify and predict new samples by determining the correct probability distribution to infer the most likely successful decisions. 35 Based on the task and type of feedback, machine learning is broadly classified into three categories: supervised learning, unsupervised learning, and reinforcement learning. 36
The process of training machine learning models mainly includes feature extraction, data preprocessing, model optimization, and other steps, and common models include the ANN, support vector machine (SVM), K-nearest neighbor, RF, and decision tree. Machine learning has been widely used in the medical field, such as in medical imaging, 37 diagnosis of cardiovascular diseases, 38 drug development, 39 and diagnosis and treatment of tumors. 40
Therefore, assisted diagnosis through big medical data and machine learning technology has become one of the directions of modern medical development. In recent years, machine learning has become particularly prominent in the early diagnosis of diseases. 41,42 Machine learning offers new ways of thinking about traditional modes of diagnosis and treatment, is used to improve the diagnostic efficiency, and allows for more objective and humane assessments of patients.
In this study, we utilized multiple machine learning algorithms to build a stable INR diagnostic model that integrated six major ferroptosis-related markers, including UBC, HSPB1, HIF1A, CD44, JUN, and GPX1. We then systematically screened for FRGs that were specifically expressed in the whole blood of INRs. Additionally, an external cohort was used to verify the diagnostic model's predictive effectiveness. We first identified 318 DEGs.
Additionally, functional annotation revealed that DEGs are primarily involved in some classical signaling–regulatory pathways, including eukaryotic translation elongation, influenza infection, nonsense-mediated decay (nmd), selenoamino acid metabolism, eukaryotic translation initiation, translation, metabolism of amino acids and derivates, and cellular responses to external stimuli, demonstrating that metabolism, inflammation, and immunological responses are the main physiological mechanisms accounting for the INRs.
Our findings first supported these genes' probable involvement in INRs, even though the precise mechanism of ferroptosis in AIDS was not clear. The most noticeable variation in expression was still seen in GPX1, which was assumed to be connected to metabolism and glutathione metabolism. 43 The primary mechanism for modulating ferroptosis is the metabolism of glutathione, iron, and lipids. 18
Meanwhile, it is also shown that UBC and HSPB1 are significantly and highly expressed in INRs. UBC is associated with protein degradation, DNA repair, cell cycle regulation, and endocytosis, etc. 44 HSPB1 was reported to suppress ferroptosis through an unknown mechanism; this suggests that heat shock proteins may be necessary for setting the sensitivity to ferroptosis in some cell contexts. 8 Similarly, it was illustrated that increased HSPB1 expression promoted ferroptosis resistance by restricting iron uptake. 45 HSPB1 can also impede transferrin receptor-mediated iron uptake, which may further benefit the combat against ferroptosis. 46
Another fascinating difference was seen in HIF1A, which is essential for ferroptosis through lipid peroxidation. HIF1A acts a central regulator of the homeostatic response of cells and systems to hypoxia by activating the transcription of numerous genes, including those involved in energy metabolism, angiogenesis, apoptosis, and other protein products that increase oxygen delivery or promote metabolic adaptation to hypoxia. 47 By increasing the expression of proteins related to hypoxia and lipid droplets, it might selectively enrich polyunsaturated lipids.
CD44 is yet another key regulator. The cellular processes of T lymphocyte activation, recirculation and homing, hematopoiesis, inflammation, and the response to bacterial infection require CD44. 48
From those mentioned above, we find that all these genes play a role in ferroptosis.
There are several uses for machine learning in biomedicine, including improving the clinical diagnosis and proposing the best course of action. 36 Previous studies have also applied machine learning to HIV, but they have primarily focused on neuroimaging, 49 early efficacy of ART, 50 HIV care, 51 and automated HIV identification. 52 Few studies have been conducted on patients with defective immune recovery after long-term ART.
A stable, RF-based INR model was formulated in this study using the predictive capability of five machine learning classifiers (LR, ANN, LASSO, RF, and SVM). This model achieved superior predictive power in the training cohort (AUC = 0.99 and accuracy = 0.96). Promising effectiveness was also exhibited by the prediction model in the external validation cohorts (AUC = 0.727), offering fresh perspectives on the quick and early detection of INRs.
Due to the small sample size, the predictive models' accuracy and recall in the external validation cohort were unsatisfactory, which led to misdiagnosis and escaped diagnosis. Therefore, substantially larger cohort sizes for replication and validation studies are needed. Simultaneously, it may also be necessary to conduct further large-scale longitudinal cohort studies with comprehensive clinical data to confirm our findings and gain more knowledge on INR treatment strategies.
As there is no previous study of machine learning on HIV defective immune recovery, regrettably, a cross-sectional comparison with other studies cannot be made. Hopefully, this study will provide a new way of thinking about the future diagnosis and treatment of INRs.
Footnotes
Acknowledgment
The authors sincerely thank Qing Xiao of Beijing Ditan Hospital for providing technical support in machine learning.
Authors' Contributions
R.D. was involved in study design, methodology, project administration, writing—original draft, software, and visualization. J.H. was involved in writing—review and editing.
Author Disclosure Statement
The authors declare no conflict of interests.
Funding Information
The authors received no funding in support of this research.
Supplementary Material
Supplementary Data
References
Supplementary Material
Please find the following supplemental material available below.
For Open Access articles published under a Creative Commons License, all supplemental material carries the same license as the article it is associated with.
For non-Open Access articles published, all supplemental material carries a non-exclusive license, and permission requests for re-use of supplemental material or any part of supplemental material shall be sent directly to the copyright owner as specified in the copyright notice associated with the article.