
Abstract
Previously, an increase in clinical effectiveness of the antituberculosis treatment (ATT) and antiretroviral therapy (ART) in case of additional immunoglobulin G (IgG) administration in patients with multidrug-resistant tuberculosis (MDR-TB)/HIV coinfection was reported. The aim of this study was to investigate the impact of IgG administration in addition to the standard second-line ATT and ART on the humoral immunity status in patients with MDR-TB/HIV coinfection immune deficiency. The study involved 52 patients living with HIV with MDR-TB coinfection and CD4+ lymphocyte cell count below 50 cells/μCL. Patients in the control group and intervention group received the second-line ATT and ART; in addition, patients in the intervention group received IgG intravenously. The humoral immunity status was evaluated by measurement of IgA, IgE, IgG, and IgM in plasma. The standard ATT and ART resulted in a two-step change in humoral immunity: IgM, IgG, IgA, and IgE levels gradually increased to a maximal level at the 5-month mark and started to gradually decrease after the 8-month mark. Addition of IgG to the standard therapy resulted in a steeper decrease in the immunoglobulin level in serum, especially IgG, compared with standard therapy alone, allowing for an earlier initiation of ART in patients in the intervention group.
Introduction
Every year, up to 10 million patients are diagnosed with tuberculosis (TB) globally. In 2019, the average incidence of TB in Ukraine was 60.1 per 100,000, which is 3.6% lower than in 2018 (62.3/100,000). 1 Despite the downward trend in the number of new cases, there is a constant spread rate of Beijing strains that are characterized by higher propensity to multidrug resistance and poor clinical outcomes. 2 It has been established that in Ukraine, ∼50% of new TB cases occur in people living with HIV (PLWH). Deep immunosuppression is observed in all PLWH with chronic TB.
It was shown that multidrug-resistant tuberculosis (MDR-TB)/HIV-positive patients with a baseline CD4 count ≤100 cells/mm3 had a higher risk of mortality, while those with a baseline CD4 count >100 cells/mm3 had a hazard of death that was similar to that for participants who were HIV negative. 3,4 Furthermore, a recent CD4+ T cell count of ≤50 cells/μL is an important risk factor associated with poor outcomes and mortality 5 as well as extremely slow recovery of the CD4+ count, which can take up to 5 years. 6
Thus, the degree of immunosuppression is an important prognostic factor for treatment outcome among HIV-infected multidrug-resistant (MDR)-TB patients, and it is important to develop an advanced strategy for treatment of MDR-TB/HIV-positive patients with a CD4+ T cell count of ≤50 cells/μL.
In recent years, positive effects of immunoglobulin G (IgG) administration on clinical outcomes in severe TB cases have been reported. 7,8 The administered IgG contained ready-to-use antibodies, which bind to and remove viral and bacterial antigens, thereby reducing the infectious and toxic load on the organ systems of patients.
Previously, an increase in the clinical effectiveness and decrease of toxicity of the second-line agents of antituberculosis treatment (ATT) and antiretroviral therapy (ART) in case of additional IgG administration in patients with MDR-TB/HIV coinfection with severe immune suppression were reported. 9,10 For example, after 8 months of treatment with second-line agents of ATT and antiretroviral agents (ARV) and addition of intravenous IgG, the number of patients with an increased bilirubin level was 1.7 times lower than in the control group (p < 0.05), with increased ALT, AST, or GGT activity that was 2.5 times (p < 0.01), 2.7 times (p < 0.01), or 2.4 times (p < 0.05) lower, respectively. 9
In patients treated with second-line agents of ATT and ARV and addition of intravenous IgG, the absolute number of CD3+ and CD4+ cells at the end of the 20th month of treatment normalized in 26.9% (absolute amount) and 42.3% (relative amount) of subjects, while in the control group, this indicator remained below the normal level (p < .05). 10 However, the long-lasting effect of IgG on humoral immunity in the complex treatment of such patients has not been studied before. The role of humoral immunity in protection against TB was previously thought to be minimal, but recent studies suggest that plasmocytes and antibodies may also contribute to the response to M. tuberculosis infection. 11
For example, both in active and latent TB, B cell subsets correlate with clinical and laboratory parameters, suggesting that these CD5+ and CD10+ B cell subpopulations have the potential to be biomarkers to differentiate between latent and active TB. 12 While IgG is formed against M. tuberculosis antigens in patients coinfected with M. tuberculosis and HIV-1, some studies have observed substantially lower titers of M. tuberculosis-specific IgG and other isotypes. 13
At the same time, other groups have found an increase in M. tuberculosis-specific antibody titers and reactivity in HIV/TB coinfection, which they attribute to a high M. tuberculosis bacillary burden in HIV-infected individuals. 14 Additionally, it was discovered that HIV antibodies are broader and more potent in people with HIV in the presence compared with the absence of M. tuberculosis disease. 15
By focusing on the B cell response, we can develop new strategies to enhance immunity against TB and reduce the burden of disease, for example, by regulating CD4+ T cell and macrophage responses and cytokine production. 16
In this study, we aimed to investigate the effect of IgG administration in addition to the standard second-line anti-TB agents and ART on the humoral immunity status in patients with MDR-TB/HIV coinfection at the level of CD4+ lymphocytes below 50 cells/μCL.
Materials and Methods
The study included 52 MDR-TB/HIV patients (54.8% men and 45.2% women) with a CD4+ lymphocyte count below 50 cells/μL and who were treated at Odesa Regional TB Hospital (now Odesa Regional Center for Socially Significant Diseases [ORCSSD]; Odesa, Ukraine) during the period 2015–2017. All patients were HIV positive with laboratory-confirmed MDR-TB, using the Xpert MTB/RIF assay performed according to the manufacturer's recommendations on the same sputum sample used for smear microscopy and culture, with a subsequent drug-susceptible test collected from the patient within 1 day of sputum collection for testing using conventional assays (microscopy and culture).
HIV status was confirmed by enzyme-linked immunosorbent assay (ELISA) test in all patients using a blood sample at admission to the ORCSSD. The ELISA test was performed on the NeoEldex ELISA analyzer (Monobind) according to the manufacturer's recommendations on the blood sample. Patients with MDR-TB/HIV were divided into two groups: Group 1 (control): 26 patients who received the standard treatment with second-line antituberculosis agents and ARV. Group 2 (intervention): 26 patients who received the standard treatment with second-line antituberculosis agents and ARV, with the addition of intravenous IgG.
IgG was administered intravenously, 4 mL/kg, on the first day and then three times more—after 4/8/12 weeks and then in the 5th and 8th months of the intensive phase and in the 14th and 20th months of the maintenance phase of the treatment. The standard antituberculosis treatment (ATT) according to the DOTS-Plus protocol (i.e., fluoroquinolones + cycloserine + bedaquiline + linezolid) was started from the second day of treatment; 2 weeks later, the treatment with ARV was added.
Humoral immunity assessment with determination of levels of serum immunoglobulins (IgM, IgG, IgA, and IgE) was carried out using the immune agglutination method on a cobas 6000/cobas 8000 analyzer (Roche Diagnostics, Switzerland) (certified according to the ISO 15189 standard) during the initial 3 months of treatment (IgG + ATT + ART) and the following period of 3–20 months of treatment (ATT+ART). After clotting and centrifugation, immunoglobulin IgG, IgM, IgA, and IgE concentrations were determined by the immunoturbidimetric method on a cobas 6000 (Roche) analyzer. 17
At first, in patients HIV infection appeared, secondary during following 2–15 years MDR-TB developed. Immunological diagnostics with determination of the level of CD4+ T lymphocytes in the subgroup was carried out in the clinical laboratory of the Odessa Regional AIDS Center, using an AQUIOS™ CL flow cytometry device manufactured by Beckman Coulter at the beginning and after 3–20 months of treatment. This is a direct volumetric method for a single platform. 10
The sample was processed using two multitasking probes: one probe pricked the lid and transferred the sample into a 96-well microplate, while the other aspirate obtained was prepared as the sample for analysis. While the first sample was incubated, the system continued to prepare additional samples and add them to the queue. Whole blood (140 μL) was added to every well, then specific white blood cell staining was performed by incubating whole blood with a monoclonal antibody reagent. Then, the red blood cells were removed by lysis without washing, and the remaining leukocytes were analyzed by flow cytometry.
Statistical analysis was performed using the Statistica 10.0 software (Dell Software, Austin, TX, USA). The average immunoglobulin levels were compared between the two groups. Quantitative indicators in the text and tables are presented in the form M ± m (M: arithmetic average and m: standard error of the mean). Statistical significance was assumed at the p level <.05. The Mann–Whitney test and t-test were used for nonparametric and parametric variable assessment, respectively; the chi-square test was used for paired data.
Ethical approval
The project was approved by the Ethics Committee of Odessa National Medical University, Ukraine (protocol N84, June 16, 2015). It was conducted according to the Declaration of Helsinki standards. All patients gave written informed consent and explicit permission for treatment and blood analyses, as well as for collection of relevant clinical data.
Results
Of the 52 patients, 46.2% were women and the rest 53.8% were men; and the average female age was 39.20 ± 3.17 years and male age was 36.50 ± 2.84 years. All patients had MDR-TB and were HIV positive. Around 61.5% of patients were new cases of TB and 30.5% were retreatment cases (failure or relapse).
Patients in the intervention group were able to start ART in the second week of ATT due to IgG administration. In the control group, ART was started much later: 1 month after the ATT was started in 4 individuals of 26 (15%); after 2 months in 11 persons (42%); and after 3 and 4 months in 4 (15%) and 7 (28%) individuals, respectively. At the end of the treatment, recovery from TB (including smear conversion, closing of TB cavity, and resolution of the TB infiltrate and TB lesions in patients who completed ATT) was achieved more often in the intervention group than in the control group (81% vs. 54%, p < .05), while the ATT was interrupted more often in the control group than in the intervention group (31% versus 19%, p < .05).
The initial IgM level in serum was normal in 73% of patients in the control group and 77% of patients in the intervention group; there was no difference in the average level of IgM in serum in both groups—1.57 and 1.59 g/L, respectively (Fig. 1 and Table 1). During the treatment, the number of patients with a normal level of IgM in the control group decreased to 61% at the end of the 5-month mark (average IgM level: 1.75) and then increased to 89% at the end of the 20-month mark (average IgM level: 1.46).
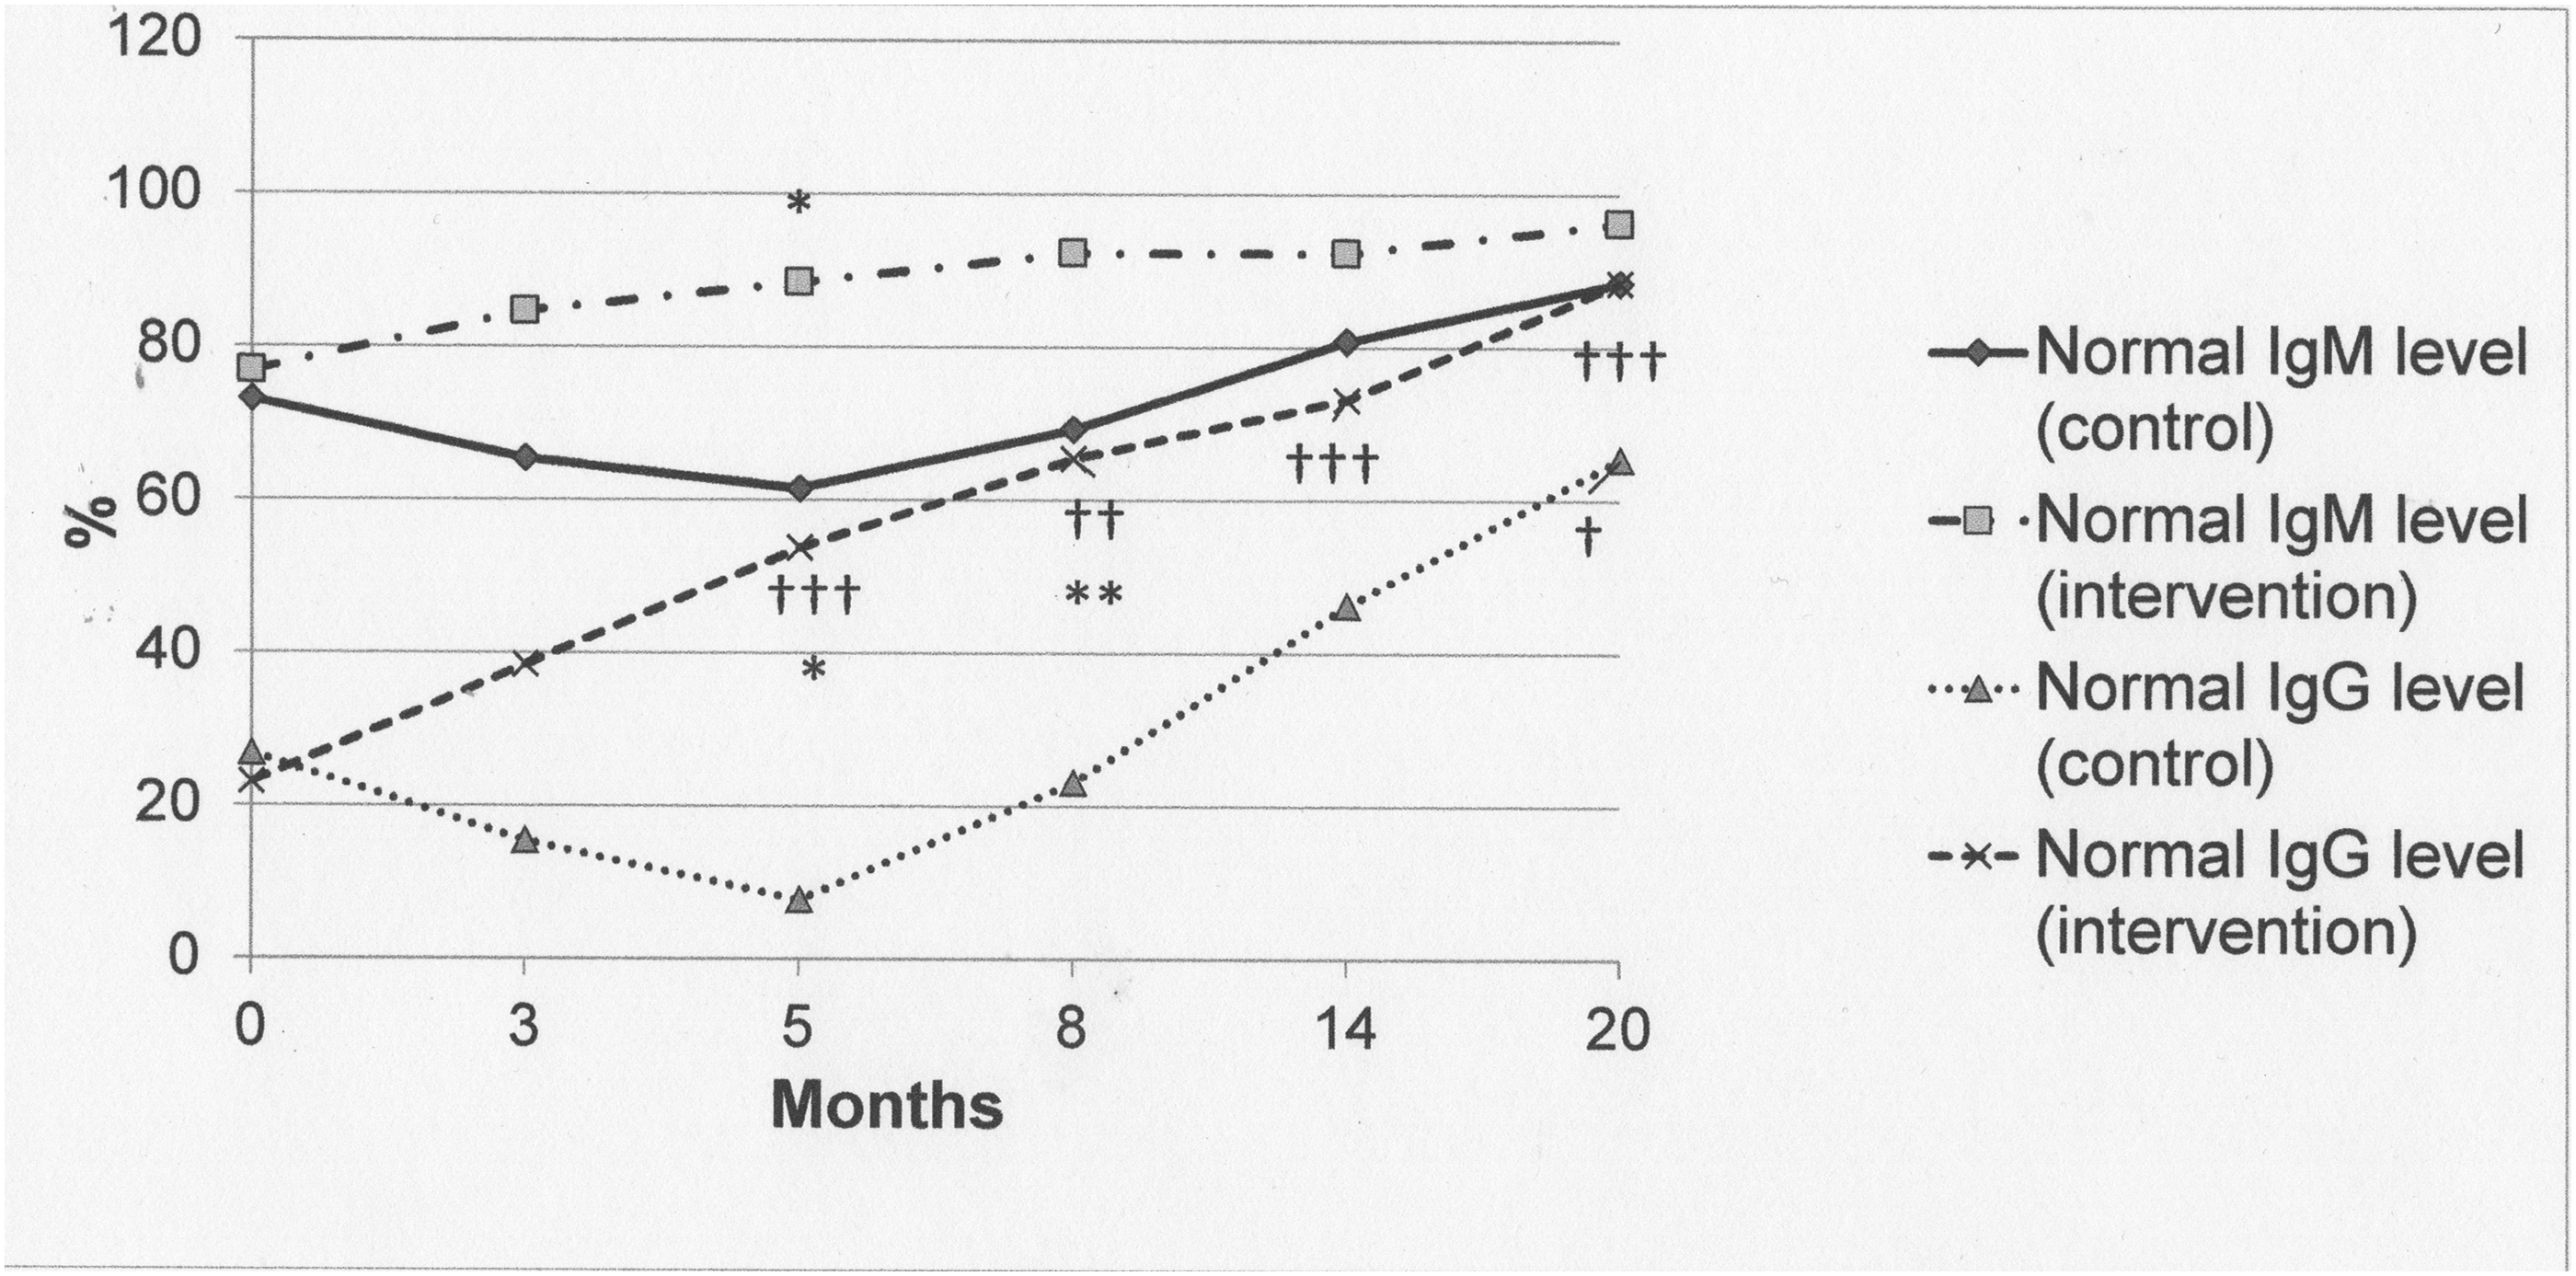
Number of patients with normal IgM and IgG levels in serum by treatment group. */**/***The difference is significant between the control and intervention groups (p < .05/p < .01/p < .001). †/††/†††The difference is significant in comparison with the initial state (p < .05/p < .01/p < .001).
Absolute Level of Humoral Immunity Indices in Patients with Multidrug-Resistant Tuberculosis/HIV with the CD4+ Lymphocyte Count Below 50 Per Microliter (0–20 Months) (M ± m)
The difference is significant in comparison with the initial state (p < .05); *the difference is significant between the control and intervention groups (p < .05); ††the difference is significant in comparison with the initial state (p < .01); **the difference is significant between the control and intervention groups (p < .01); †††the difference is significant in comparison with the initial state (p < .001); ***the difference is significant between the control and intervention groups (p < .001).
IgG, immunoglobulin G.
In the intervention group, the number of individuals with a normal level of IgM gradually increased to 96% at the end of the 20th month (average IgM level: 0.97). After 5 months of treatment, the number of patients with a normal level of IgM was 1.4 times higher in the intervention group compared with the control group (88.5% vs. 61.5%, p < .05).
At the beginning of the study, an increase in the IgG level in serum was recorded in 73% of patients in the control group and 77% of patients in the intervention group, with an average of 27.4 ± 1.57 and 28.2 ± 1.45 g/L, respectively. Then, at 3 and 5 months, an increased IgG level in serum was observed in 85% and 92% of patients in the control group and in 61% and 46% of patients in the intervention group, respectively.
Hence, at the 5-month mark, the number of patients in the intervention group with an increased IgG level was half of that in the control group (p < .05) and 1.8 times lower than at the beginning of treatment (p < .001). In addition, the average level of IgG in the intervention group decreased by 27.6% (p < .05) and 35.6% (p < .01) at the 3rd and 5th months, respectively, compared with the initial level, while in the control group, it increased by 15.5% (p < .05).
After the 8th month and until the end of the observation period (up to 20 months of study), the number of patients in both groups with increased IgG levels declined to 35% in the control group and 12% in the intervention group, which were 2.1 times (p < .05) and 6.7 times (p < .001) lower, respectively, compared with the beginning of the treatment. During the study, the lowest level of IgG occurred at the end of the 20th month: −21.50 ± 1.50 and 17.90 ± 1.78 g/L in the control and intervention groups, respectively; it was 21.5% and 36.5% lower, respectively, than at the beginning of the observation period (p < .05).
In contrast, during the 20 months of treatment, the number of patients with a normal value of IgG in serum in the intervention group increased from 23.1% to 88.5% (p < .001) with a decline in the average level from 9.80 ± 0.78 to 8.05 ± 0.50. Thus, a two-step change in the number of patients with normal IgG levels occurred in the control group—dropping at the 5-month mark to 8% and increasing during the 8–20 months of treatment to 65%.
At the beginning of the treatment, the IgA level in serum was beyond 4.0 g/L in 54% and 58% of patients in the control and intervention groups, respectively, with the average values of 7.24 ± 0.45 and 7.38 ± 0.47 g/L, respectively (Table 2 and Fig. 2). At the 3rd and 5th months of IgG administration, an increased level of IgA was observed in 62% and 65% of patients, respectively, in the control group, while during the next months of treatment, it gradually decreased to 19% at the end of the treatment, which is 2.8 times lower than the initial value (p < .05).
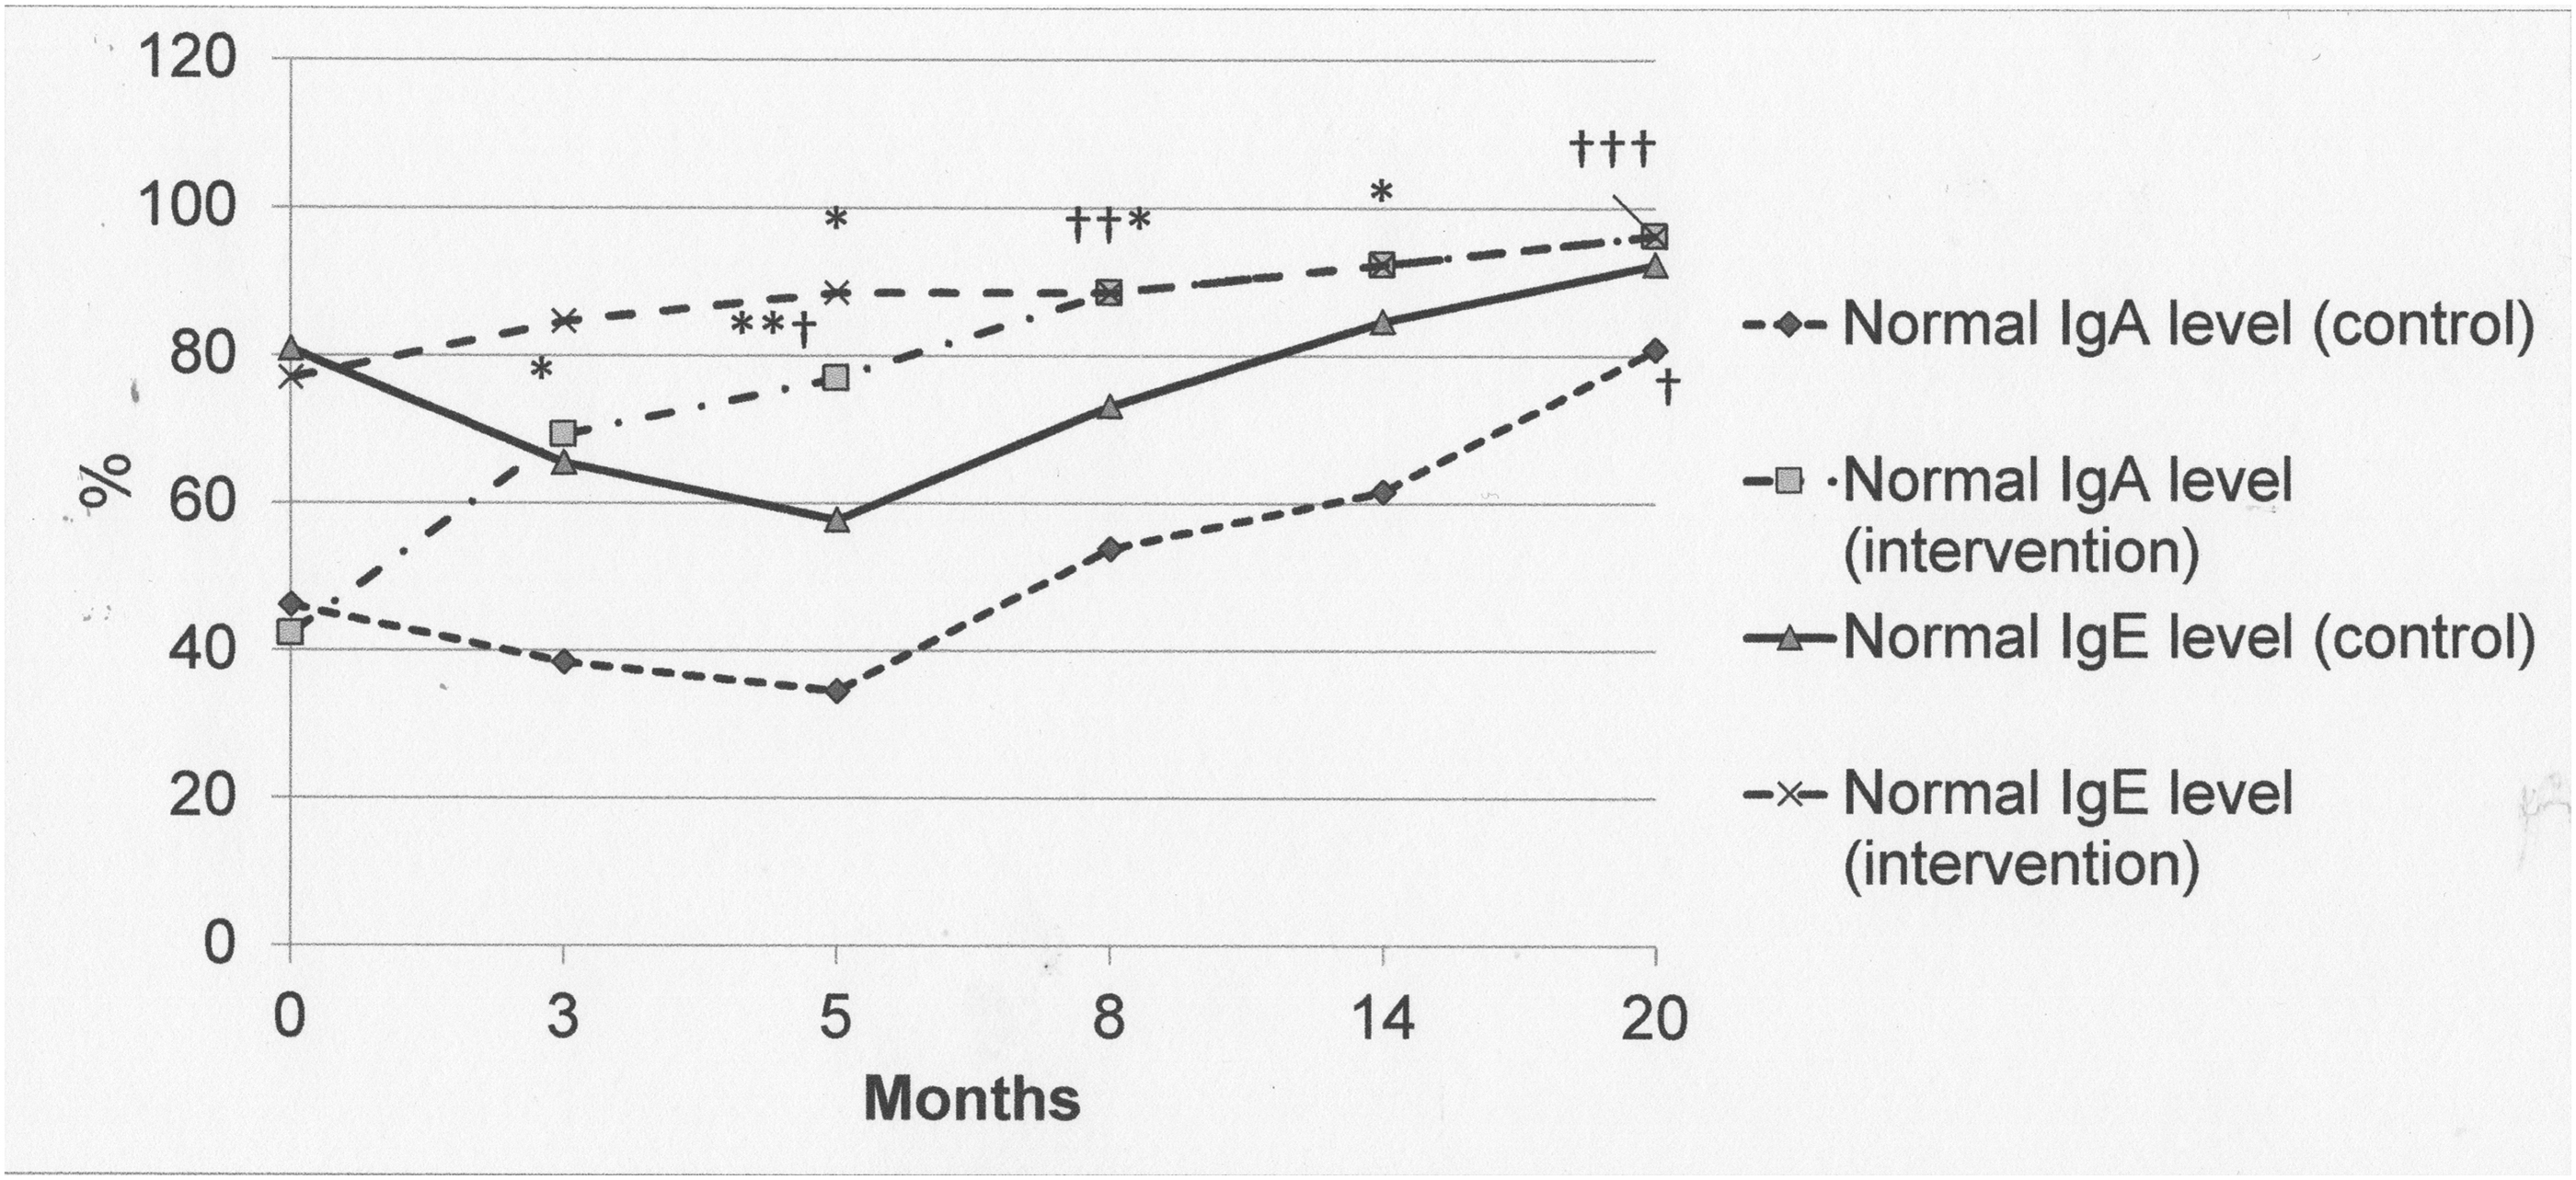
Number of patients with normal IgE and IgA levels in serum by treatment group. */**/***The difference is significant between the control and intervention groups (p < .05/p < .01/p < .001). †/††/†††The difference is significant in comparison with the initial state (p < .05/p < .01/p < .001).
Absolute Level of Humoral Immunity Indices in Patients with Multidrug-Resistant Tuberculosis/HIV with the CD4+ Lymphocyte Count Below 50 Per Microliter (0–20 Months) (M ± m)
The difference is significant in comparison with the initial state (p < .05); *the difference is significant between the control and intervention groups (p < .05); ††the difference is significant in comparison with the initial state (p < .01); **the difference is significant between the control and intervention groups (p < .01); †††the difference is significant in comparison with the initial state (p < .001); ***the difference is significant between the control and intervention groups (p < .001).
At the same time, among patients with increased IgA levels in the intervention group, a downward trend was observed from 31% to 23% (both statistically significantly different compared with the initial level, p < .05) in the 3rd and 5th months; decreasing by 12%, 8%, and 4% at the 8th, 14th, and 20th months respectively. On the contrary, the number of patients with normal IgA levels in serum gradually increased in both groups, more substantially in the intervention group (Fig. 2).
The average content of IgA in serum in the control group increased at first and then decreased after a peak in the 5th month regardless of the initial level of IgA. At the same time, in the intervention group, the average level of IgA gradually decreased throughout the observation period (20 months). In general, the average level of IgA in the intervention group was significantly lower than in the control group (Table 2 and Fig. 2).
A normal IgE level in serum was registered among the majority of patients in both groups—in 81% of individuals in the control group and 77% of individuals in the intervention group, with an average value of 59.1 ± 11.2 and 58.8 ± 11.7 IU/mL, respectively (Table 2 and Fig. 2). During the 20-month course of treatment, this figure consistently increased to 96% in the intervention group, which was associated with double the reduction in the average level of IgE to 27.7 ± 5.1 (p < .05 compared with the initial level).
In patients in the control group, there was a two-step change in the IgE level in response to the treatment: at the first 5-month mark, there was a significant decrease in the number of patients with normal values of IgE (up to 58%), and from the 8th to 20th month, there was an increase in the studied value—from 73% to 92%. Nevertheless, at the end of the treatment, the average level in the control group was 34.6% lower than in the intervention group (42.3 vs. 27.7; p > .05; Table 2).
Discussion
The involvement of humoral immunity in protection against TB remains controversial. The available literature suggests that B cell responses are differently modulated in active TB disease and latent TB infection. 18 In general, numerous references witnessed an increase in the M. tuberculosis-specific IgG level in plasma, 11,14,19 while one study shows lower serum titers of M. tuberculosis-specific IgG. 13 High IgG antibody levels in TB patients have been reported in several studies and are believed to reflect the burden of infection. 19
In this study, the humoral immunity changes among patients with MDR-TB/HIV corresponded to the clinical course of the disease, medical history, and results of hematological and biochemical studies. 9,10 The obtained results showed a high IgG level—around 75% of all MDR-TB/HIV-positive patients have an increased IgG level in serum. It correlates with the fact that antibody levels and avidity of M. tuberculosis-specific IgG were both significantly higher in untreated TB patients than in the controls. 11
During the treatment, in the control group, there was a two-step change in the number of patients with normal IgG levels—dropping at the 5-month mark to 8% and increasing during the 8–20 months of treatment to 65%. These phenomena could be explained by an intense stimulation of the humoral response by antigens released from killed bacteria, reflecting early bactericidal activity of antituberculosis drugs leading to production of low-affinity antibodies against these released antigens. 11 The combination of intravenous administration of IgG with standard ART and ATT promotes more rapid normalization of the IgG level in serum than standard ART and ATT only.
According to references, in TB serum samples, levels of IgG antibodies were significantly higher than IgM and IgA, whereas IgM and IgA antibody levels were comparable. 18 Initial exposure to M. tuberculosis is likely to trigger the production of IgM, which is the first antibody released during a humoral immune response and may provide protection at an early stage of infection. As a result of the increasing burden of infection, a progressively dominant production of IgA takes over. 18
With increasing burden of infection, antibody responses may shift from a predominantly IgM to IgG type. This statement correlates with our results, where at the beginning of treatment, around 23.1%–26.9% of TB patients have a high IgM level and 42.3%–46.2% have a high IgA level. It has been described that the presence of TB infection currently or in the past is associated with an allergic status and an increase in the IgE level, as well as with the severity of TB infection. 20 The majority of recruited TB patients, 76.9%–80.8%, showed a high serum level of IgE.
Thus, we found that patients with MDR-TB/HIV were in a state of deep immunosuppression associated with increased levels of IgM, IgG, IgE, and IgA. Application of standard anti-TB and antiretroviral therapy caused a two-step change in the immunoglobulin level—at first, it led to further increase in IgM, IgG, IgE, and IgA levels, with the maximum level at the 5th month, while after the 8th month, there was a gradual decrease in the immunoglobulin level.
At the same time, the combination of standard ART and ATT with IgG administration was accompanied by a continuous drop in the immunoglobulin level during a period of 20 months.
Due to recommended immune stimulation, the patients of the intervention group could start ART after 2 weeks of anti-TB treatment. At the same time, in the control group, ART was started much later—after 1 month of anti-TB treatment in 4 individuals of 26; after 2 months in 11 persons; and after 3 and 4 months in 4 and 7 individuals, respectively. Probably due to higher effectiveness and lower toxicity of ATT in combination with intravenous administration of IgG, patients in the intervention group showed more compliance with the therapy than patients in the control group, where ATT was interrupted more often than in the intervention group (31% vs. 19%, p < .05). 9,10
In turn, better adherence to the ATT to a certain degree would improve effectiveness in the intervention group, compared with the control group. The usage of intravenous administration of IgG can be effective and feasible in patients with severe immunodeficiency—its cost is comparable with the price of modern second-line ATT.
In general, addition of IgG administration to standard therapy caused a more rapid normalization of the studied immunoglobulin level in serum than with standard therapy alone. Thus, the significant and rapid decrease in immunoglobulin levels in serum after IgG administration was associated with better clinical outcomes (early start of ART and ATT and higher TB recovery and treatment completion rates). However, the following question remains unanswered in the current research: Were the humoral immunity changes in the intervention group causative agents or a consequence of treatment success? This will probably need additional research.
In addition, it is not easy to predict the putative effectiveness of IgG intravenous administration in latent tuberculosis infection (LTBI) treatment because there are certain differences in immune status between patients with latent and active TB. 12 However, as was mentioned before, the administered IgG can remove viral and bacterial antigens, thereby reducing the infectious and toxic load on organ systems of patients, 7,8 supporting certain usefulness of intravenous administration of IgG in LTBI treatment as well.
It was hypothesized that the immune complexes that form a granuloma would have different IgG densities and would signal the macrophage to behave differently. 16 Thus, macrophages closest to the granuloma center would encounter immune complexes with lower IgG densities and can be predicted to be more proinflammatory than macrophages at the periphery, whose interaction with immune complexes with high IgG densities should result in production of interleukin-10.
In addition, it is supposed that B cell functions during the course of TB are infection phase specific: in the acute infection phase, B cells are required for an optimal granulomatous response and effective immunity against M. tuberculosis aerosol infection (limit pulmonary inflammation), while in the chronic phase of infection, the immunologically active B cell aggregates likely play a role in promoting perpetuation of effective local immunity so as to contain persistent bacilli and prevent disease reactivation. 16
Limits of this research include the absence of analysis of the local humoral immune status in lungs or in the gut—it could be a subject of further study. At the same time, it is not easy to measure the bacillary burden in bronchoalveolar lavage because in TB/HIV patients, the process of TB cavitation in lungs is not very common and bacillary burden, as a rule, is low.
The obtained results suggest a B lymphocyte role for immunoglobulin-mediated endocrine immune regulation during M. tuberculosis infection, but functions of the germinal center-like B cell clusters in the lungs of a chronically infected host remain unclear and a better understanding of the putative role of natural antibodies could lead to effective vaccine development. 16
Footnotes
Acknowledgments
The authors would like to acknowledge the support of the clinicians, nurses, and laboratory personnel who contributed their efforts and made this study possible.
Authors' Contributions
N.A.M. was involved in conceptualization, project administration, supervision, investigation, formal analysis, and writing—original draft; A.V.K. was involved in methodology, investigation, resources, software, formal analysis, and writing—original draft; T.I.V. was involved in funding acquisition, data curation, visualization, and writing—review and editing; P.B.A. was involved in formal analysis, data curation, validation, and writing—review and editing; and K.A. was involved in funding acquisition, software, and writing—review and editing.
Author Disclosure Statement
No competing financial interests exist.
Funding Information
The current research was supported by a grant from the Ministry of Health of Ukraine (No. 0121U107508). T.I.V. was supported by the Branco Weiss Fellowship.