




Abstract
Our goal was to assess the accuracy of next generation sequencing (NGS) compared with Sanger. We performed single genome amplification (SGA) of HIV-1 gp160 on extracted tissue DNA from two HIV+ individuals. Amplicons (n = 30) were sequenced with Sanger or reamplified with barcoded primers and pooled before sequencing using Oxford Nanopore Technologies (ONT) and Pacific Biosciences (PB). For each amplicon, a consensus sequence for NGS reads was obtained by (1) mapping reads to the Sanger sequence when available (“reference-based”) or (2) mapping reads to a “pseudo-reference” sequence, i.e., a consensus sequence of a subset of NGS reads (“reference-free”). PB reads were clustered based on genetic similarity. A Sanger consensus sequence was obtained for 23/30 amplicons, for which all NGS consensus sequences were identical (n = 9) or nearly identical (n = 14) compared with Sanger. For the nine mismatches between Sanger/NGS, the nucleotide in the NGS sequence matched all other sequences from that patient. Of the 7/30 amplicons without a Sanger sequence, NGS sequences had ≥35 ambiguous calls in five amplicons and 0 ambiguities in two amplicons. Analysis of the electropherograms showed failure of a single sequencing primer for the latter two amplicons (consistent with a single template) and overlapping peaks for the other five (consistent with multiple templates). Clustering results closely followed the Sanger/NGS consensus results, where amplicons derived from a single template also had a single cluster and vice versa (with one exception, which could be the result of barcode misidentification). Representative sequences from the clusters contained 2–13 differences compared with Sanger/NGS. In summary, we show that both ONT and PB can produce amplicon consensus sequences with similar or higher accuracy compared with Sanger and, importantly, without the need for a known reference sequence. Clustering could be useful in some circumstances to predict or confirm the presence of multiple starting templates.
Introduction
HIV-1 has a highly variable genome, with changes consisting of both single nucleotide polymorphisms (SNPs) and length variation, particularly in the genomic regions most useful for evolutionary analyses (i.e., the gp160 envelope gene). Because recombination among distinct genomes in bulk amplification can result in chimeric sequences which distort subsequent analyses, the HIV-1 field has largely adopted single genome amplification (SGA), which uses a limiting dilution nested PCR approach and direct sequencing of resulting amplicons. 1 –5 Using an SGA approach, DNA or complementary DNA (cDNA) is diluted serially over a range of concentrations, followed by nested PCR of ≥10 reactions per dilution. Based on the Poisson distribution, the dilution that yields ≤30% positive reactions has about 80% probability of deriving from a single amplifiable template. 6 Direct sequencing of amplicons has been typically performed using Sanger sequencing, 7 which is highly accurate, but also suffers several limitations related to the cost, the need for one or more internal sequencing primers which may not work for all study subjects (and which result in a loss of the entire sequence if a single primer fails), and low-throughput manual processing of individual electropherograms to generate a consensus sequence. 8 Furthermore, if the starting reaction contained multiple genomes, the electropherograms will likely contain long stretches of ambiguously called bases resulting from length variation in variable regions or ambiguities at point mutations between starting genomes.
The use of next-generation sequencing (NGS) platforms may offer numerous advantages over Sanger sequencing of single genome amplicons, including the potential for automated analyses, multiplexing samples to reduce the costs, and the elimination of sequencing primers. 8 –10 The Illumina sequencing platforms, which generate reads of <500 bp, have been widely used for sequencing HIV-1, including near full-length genomes. 11,12 Long-read platforms, such as Pacific Biosciences (PB) and Oxford Nanopore Technologies (ONT), may also be useful for generating single genome sequences, 13 as well as potentially enabling recovery of multiple genomes from an individual amplicon that actually derived from >1 starting template using NGS and a clustering approach, 14,15 which would not be possible with Sanger sequencing and computationally difficult with shorter Illumina reads 16 –18 (although PCR recombinants would still need to be identified in such cases). The major drawback with NGS is that both ONT and PB platforms are notoriously error prone. 19 To improve accuracy, PB utilizes circular consensus sequencing (CCS) to combine data generated from multiple sequencing passes of the same template molecule, 20 and ONT has developed novel R10 nanopores which include a longer barrel and dual reader head to improve read accuracy over previous versions. 21 However, it is unclear whether these steps can sufficiently reduce the error rate to enable accurate reconstruction of single template amplicons compared with Sanger. The use of NGS over Sanger for HIV-1 sequencing would be especially useful in lower-resource settings, as NGS reduces the cost and labor and ONT in particular enables sequencing to be performed in-house.
Our goal was to determine whether long-read NGS platforms (ONT and/or PB) can be used reliably and accurately for sequencing single template amplicons of HIV-1 gp160. We used both reference-free and reference-based mapping of the NGS reads to generate single consensus sequences and compared them to Sanger sequences. We also used a parallel clustering approach to compare the accuracy of this approach with Sanger and the mapped consensus sequences, as well as to determine if this method would enable reconstruction of genomes when >1 starting template was suspected.
Methods
Samples
Fresh frozen tissues from two participants (“2004” and “5095”) enrolled in the National Neurological AIDS Bank, a member of the National NeuroAIDS Tissue Consortium, were obtained through the AIDS and Cancer Specimen Resource. Extensive details regarding the subjects can be found in our previous publication. 22 In brief, patients were infected for 4 years (5095) and 17 years (2004), with an antiretroviral history that included poor adherence (5095) or many years without it (2004). Spleen (“SP”) and/or lymph node tissue (“LN”) were prepared in single-cell suspensions by disaggregation. CD3 cells were sorted using positive (“CD3”) and negative (unfractionated, “UNF”) bead selection, resulting in a total of five samples as follows: three from participant 2004 (2004-LN-CD3, 2004-LN-UNF, 2004-SP-UNF) and two from participant 5095 (5095-LN-CD3, 5095-LN-UNF). These samples were determined to be exempt by the Western Institutional Review Board (#1-1045652-1).
Single genome amplification
The limiting dilution PCR methods used in this study for the amplification of HIV-1 gp160 were based on our previously published methods. 23,24 Briefly, genomic DNA (gDNA) was extracted from unfractionated and sorted cells using DNeasy Blood and Tissue Kit (Qiagen) and the concentration measured using an Invitrogen Qubit 3 Fluorometer (Thermo Fisher Scientific). A nested PCR was performed using first round primers that produced a 3,465-bp product, followed by second round that produced a 3,388-bp product (Supplementary Table S1). gDNA was diluted serially until an average of ≤30% of the nested PCRs were positive. Second round PCRs were visualized on 1% agarose gels stained with GelRed Dye (Biotium), and reactions containing a single band near the expected length were selected for sequencing (n = 30; henceforth referred to as “amplicons”).
Sanger sequencing
Sequencing reactions were performed on nonbarcoded second round amplicons at Azenta Life Sciences on an Applied Biosystems 3730xl DNA Analyzer (Thermo Fisher Scientific). Electropherograms generated from sequencing reactions of the same amplicon were de novo assembled using Geneious Prime software (Biomatters, http://www.geneious.com), and manual examination of the assemblies was performed to resolve ambiguous consensus base calls where possible. For some cases, the amplicon sequence could not be completely obtained if multiple peaks were present in electropherograms indicating more than one starting template in the PCR, and/or if a sequencing primer failed to produce adequate useable sequence to complete de novo assembly. A single consensus sequence was generated from each of the finished assemblies that contained overlapping electropherograms across the entire HIV-1 gp160.
Barcoding amplicons for multiplexing
For each amplicon, the corresponding first round PCR was reamplified using barcoded second round primers (Supplementary Table S1). The forward primer BEF2 was synthesized to include an ONT 24 bp barcode at the 5′ end by Integrated DNA Technologies. The ONT barcode sequences utilized were the same as those utilized in ONT barcoding kits (SQK-NBD114.24 or RBK114.24). The reverse primer included one of two Golay barcodes, similar to those used in 16S sequencing of bacterial population studies. 25 The combinatorial barcoding approach allowed for multiplexing amplicons for NGS, while still using the common ONT barcode set. Each barcoded reaction was visualized on an agarose gel to confirm PCR success and then purified using the DNA Clean and Concentrator-5 kit (Zymo Research) according to manufacturer’s instructions. DNA concentrations were measured with the Qubit 3 Fluorometer (Thermo Fisher Scientific). The purified barcoded second round PCR products (n = 30) were pooled equimolar and divided into two 1.5 μg aliquots for NGS.
NGS sequencing
Purified pooled barcoded PCR products were used as the template in the Ligation Sequencing Kit V14 SQK-LSK114 (Oxford Nanopore Technologies; ONT). Sequencing was performed on an ONT minION sequencer using a R10.4.1 flowcell. Base calling was performed using Guppy (version 5.0.16) in super high accuracy mode and rejecting failed reads. Purified pooled barcoded PCR products were used for library prep with Binding Kit 3.2 (Pacific Biosciences) to produce a SMRTbell library. After bead cleanup, the library was sequenced on the Sequel IIe (Pacific Biosciences) in CCS mode with a 20 hour movie length.
NGS processing
A schematic of the processing is shown in Figure 1. PB pooled reads were filtered on quality by selecting only reads with >15 CCS passes, corresponding to a >99.99% accuracy. ONT reads were filtered on a mean read quality score of 15 using NanoFilt. 26 Both PB and ONT were also filtered to retain reads between 3,200–3,600 bp (cutadapt for PB, NanoFilt for ONT). The filtered pooled reads were then demultiplexed by the forward barcodes (BC1–BC24) using default settings in Porechop (https://github.com/rrwick/Porechop) with modifications (https://github.com/artic-network/Porechop) which enabled retaining the barcode orientation in the read name. “Matches” between read/barcode were defined as ≥4 bases aligning with ≥75% identity, and the read was assigned to a given barcode if it was ≥5% better than the second-best match. Reads that did not match a barcode with those criteria were discarded. For each BC, reads in the reverse direction were extracted, reverse complemented, and combined with the forward reads. BC reads were further demultiplexed by the reverse barcode (Golay1 and Golay2) using regex searches for exact matches, for a final set of filtered, double-demultiplexed, unaligned (“processed”) reads for each amplicon.
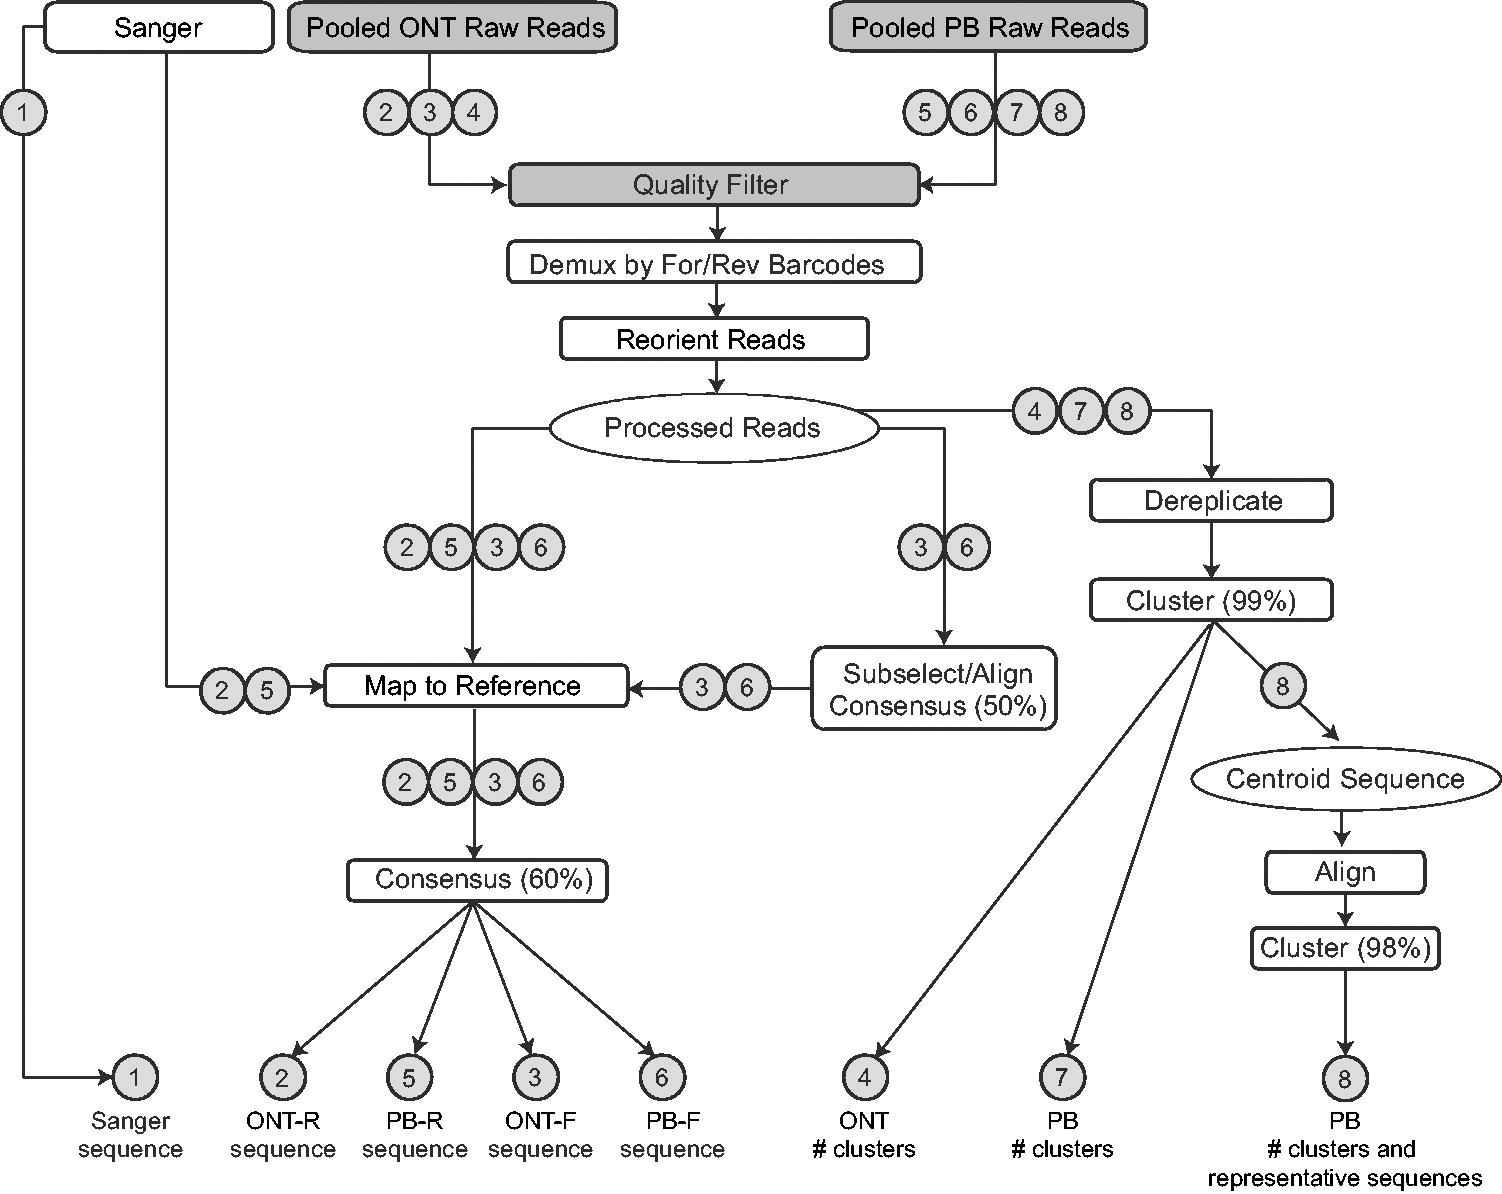
Flow chart of analyses. Gray boxes indicate that amplicons are pooled; white boxes indicate that amplicons are processed separately; arrows show the steps of each analysis track. Gray circles with numbers indicate a specific output and denote each of the steps performed. ONT, Oxford Nanopore Technologies; PB, Pacific Biosciences; ONT-R/PB-R, mapped to Sanger reference; ONT-F/PB-F, mapped to pseudo reference.
NGS mapping
First, for all of the amplicons with a corresponding Sanger sequence, we used a reference-based mapping method for the ONT data (“ONT-R”) and PB data (“PB-R”) where the reads for each amplicon were mapped to the corresponding Sanger sequence using minimap2 27 with the map-ont or map-pb option. To simulate conditions where the Sanger sequence is unknown, we also used a “reference-free” mapping method for both the ONT (“ONT-F”) and the PB (“PB-F”) data as follows: for each amplicon, a “pseudo-reference” was created by randomly selecting 1000 reads, aligning them with mafft, 28 and generating a gap-free strict majority consensus sequence using CIAlign. 29 The full set of reads was then mapped to the pseudo-reference sequence using minimap2 and the platform-specific option.
For all methods, a final consensus sequence was generated from the mapped bam file using samtools 30 with a simple frequency rule of 60%, excluding any insertions.
NGS clustering
We also used a clustering method to (1) identify the number of genetic clusters present and (2) determine if we could identify the sequence of each of the starting templates. To reduce the number of reads, first the unaligned processed reads for each amplicon were dereplicated, sorted by decreasing abundance, and clustered at 99% similarity using vsearch. 31 For each cluster that represented >100 reads, the “centroid sequence” was selected, i.e., the sequence that seeded the cluster. 31 All of the centroid sequences for each amplicon were then aligned using Gene Cutter (https://www.hiv.lanl.gov/content/sequence/GENE_CUTTER/cutter.html). The resulting alignments were manually adjusted as needed, restricted to just gp160, then clustered again at 98% similarity (for each amplicon separately). Clusters containing ≥10% of the starting number of reads were retained as the “final clusters.” For sequence comparison, the centroid sequences from this final set of clusters were designated as the “representative sequence(s).”
Phylogenetic trees
To visualize the relationship between sequences generated through the different methods, phylogenetic trees were inferred using IQTree v2 32 and visualized in FigTree v5 (https://github.com/rambaut/figtree/).
Results
Sequencing results
For the Sanger sequencing, 23/30 amplicons resulted in finished assemblies that contained overlapping electropherograms across the entire HIV-1 gp160. For NGS, the pooled 30 amplicons contained a total of 1,291,670 (ONT) and 156,172 (PB) raw reads, which were reduced to 859,107 (ONT) and 113,165 (PB) reads after filtering. After demultiplexing for both the forward and reverse primers, the total number of reads per amplicon ranged from 1,554 to 53,440 (ONT) and 834 to 8,294 (PB; Supplementary Table S2).
ONT vs. PB vs. Sanger (n = 23)
For the 23 amplicons with a complete gp160 Sanger sequence, we compared the NGS sequences versus the Sanger sequences considering three features as follows: (1) the number of frameshift mutations; (2) the number of ambiguous base calls; and (3) the number of mismatches (defined as two different nonambiguously called nucleotides at the same position, i.e., A, C, T, G).
Considering first just the NGS consensus sequences derived from the different platforms/methods, there were at most two differences between any two sequences, due to either a deletion or an ambiguously called base (Supplementary data S1). Importantly, there were no outright mismatches between any of the NGS sequences. Furthermore, the ONT-F and PB-F were identical in all cases, and the ONT-R and PB-R were identical in all cases. Therefore, for these 23 amplicons, they are hereafter referred to as NGS-F and NGS-R (Table 1).
Comparison of Sanger and NGS Consensus Sequences for 23 Amplicons
NGS, next generation sequencing; SGA, single genome amplification.
When comparing the Sanger vs. NGS sequences, nine amplicons had identical sequences for all platforms/methods (Table 1). For the other 14 amplicons three patterns were present as follows: (#1) Sanger/NGS-R shared one frameshift mutation compared with none in NGS-F (n = 5); (#2) Sanger had three frameshift mutations compared with 0 or 2 in NGS-R and none in NGS-F (n = 2); and (#3) the NGS-F and NGS-R sequences shared 1–2 ambiguities compared with none in Sanger (n = 7). In addition, three amplicons with pattern (#3) and one amplicon with pattern (#2) also showed 1–6 mismatches between the NGS-F/NGS-R and the Sanger sequences. For all mismatches, the nucleotide in the NGS sequences was the same in the other amplicon(s) from that patient, whereas the nucleotide in the Sanger sequences was different (Supplementary data S1).
We then visualized the Sanger, NGS-R, and NGS-F sequences for each amplicon in a phylogeny (Fig. 2). For all 23 amplicons, the three sequences were grouped together on a well-supported (≥90% bootstrap) branch. For two amplicons (5095-LN-UNF-117 and 5095-LN-CD3-109), all six sequences were identical (with the exception of one mismatch in the Sanger sequence of 5095-LN-CD3-109).
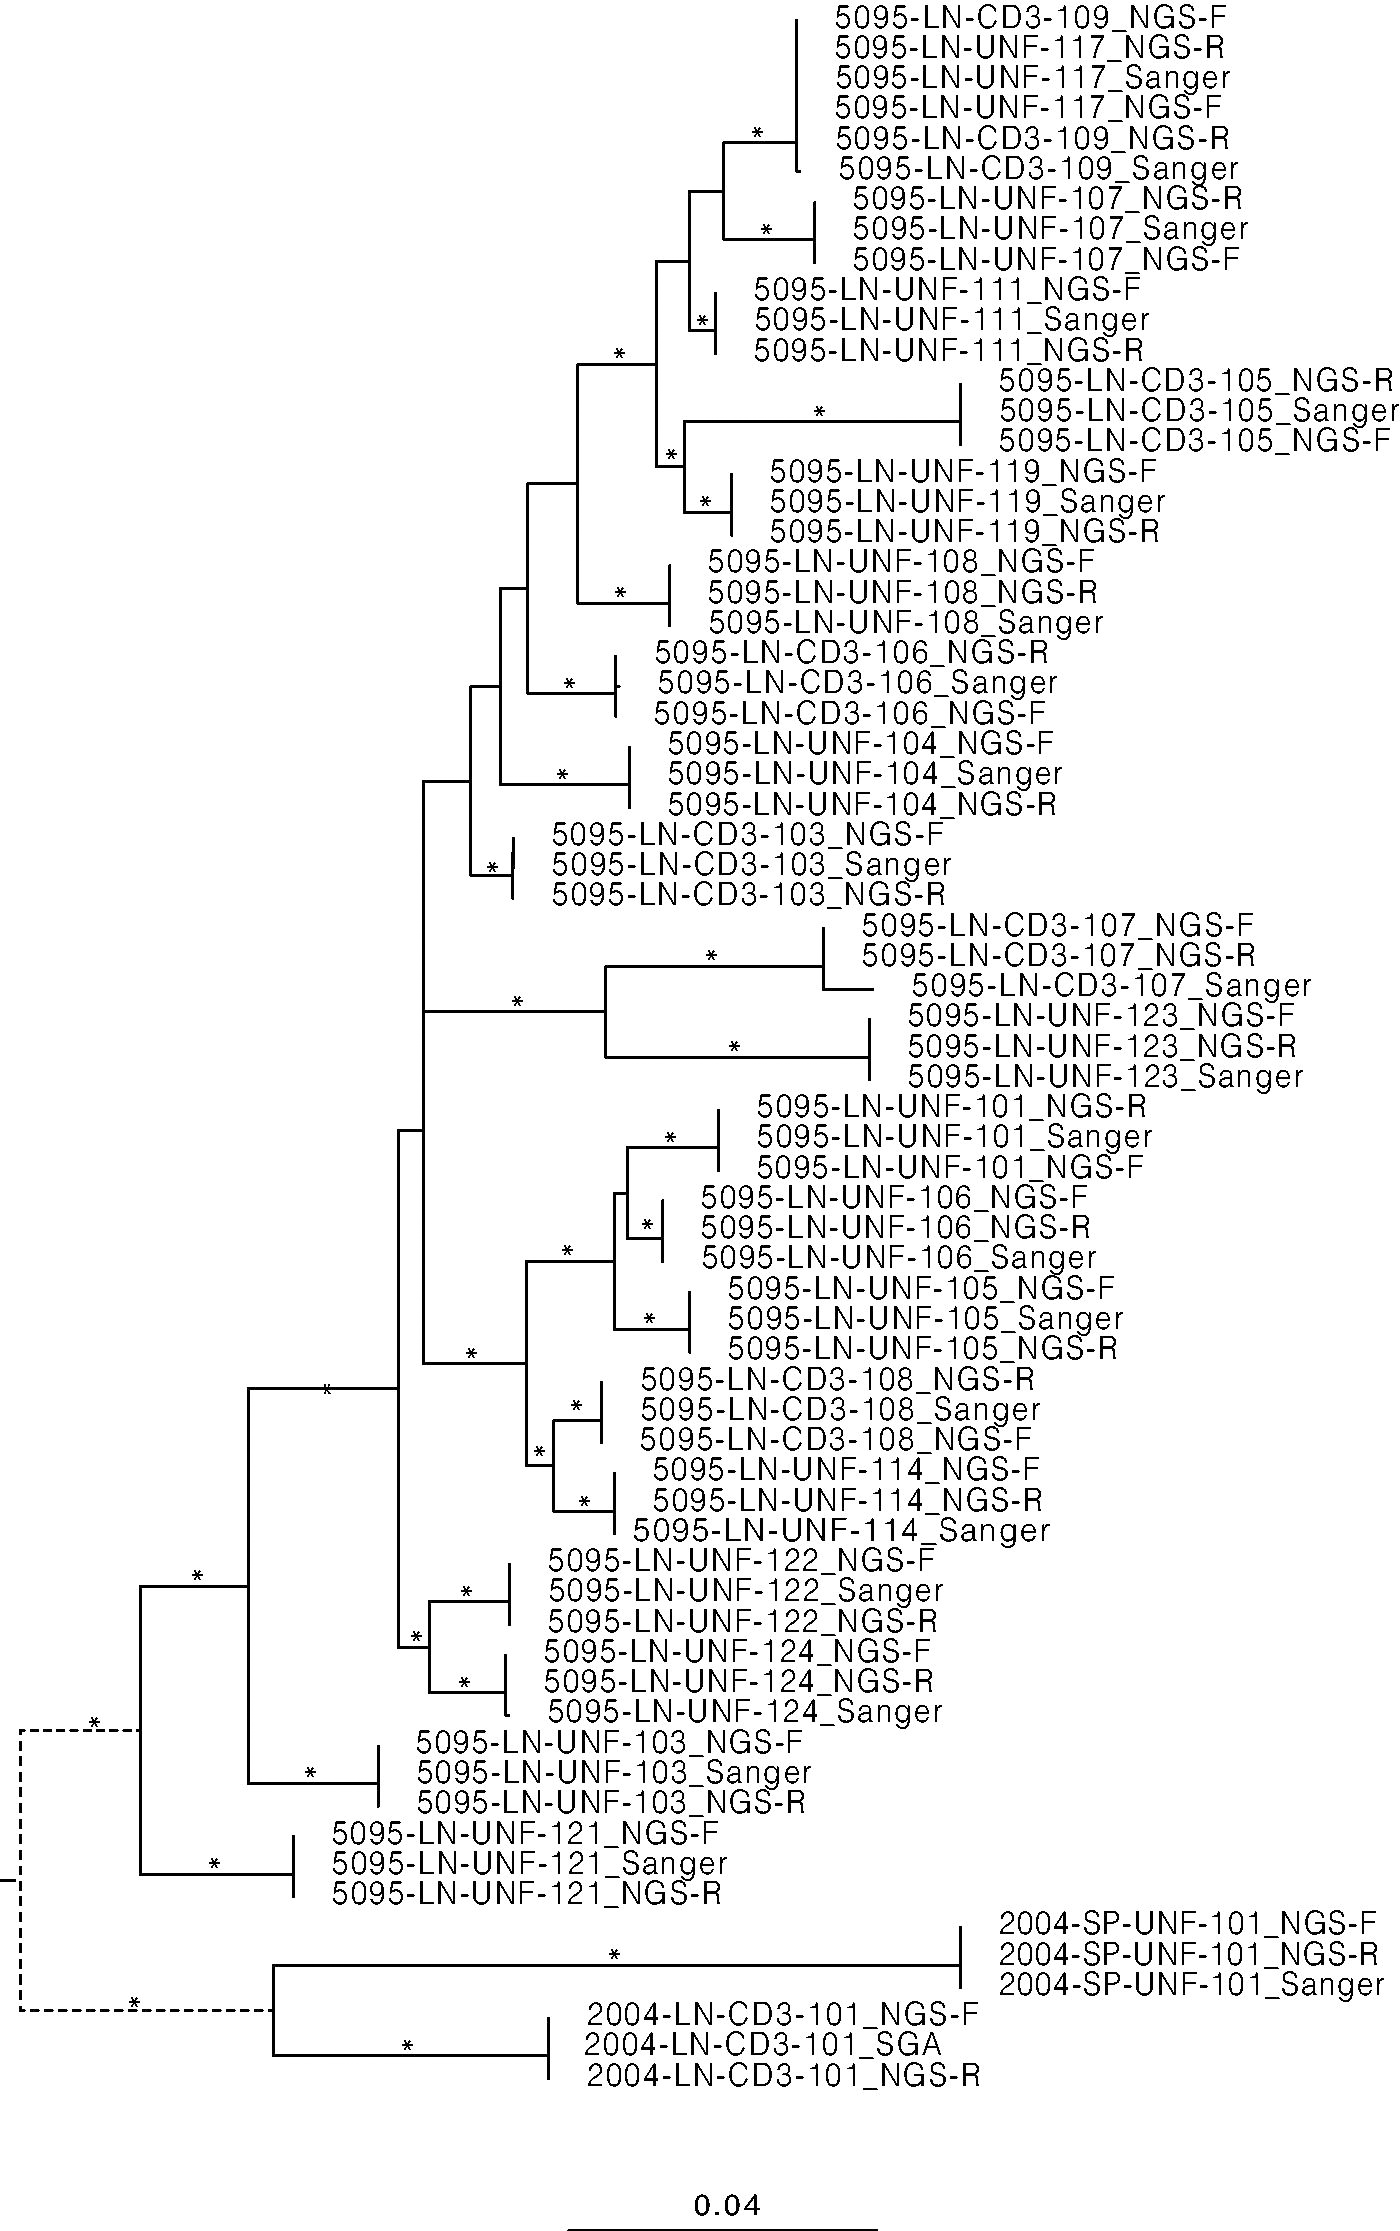
Maximum likelihood tree of sequences for 23 amplicons with a Sanger sequence. Asterisks indicate branch support >80%. Branch length is proportionate to the substitution rate according to the scale bar at the bottom. The tip labels are shown, where the name consists of the amplicon ID and the type of analysis used to generate it (Sanger, NGS-F, NGS-R). The dotted branch separating the two patients is disproportionately shorter.
ONT vs. PB only (n = 7)
For the seven amplicons without complete Sanger gp160 sequences, since a reference-based consensus sequence could not be generated, we compared only the reference-free consensus sequences for each platform. Two amplicons (5095-LN-UNF-113 and 5095-LN-UNF-118) showed nearly identical ONT-F and PB-F sequences, with only two frameshift mutations in the ONT-F (Table 2; Supplementary data S2). Inspection of the Sanger electropherograms revealed that both amplicons had insufficient primer binding in one of the Sanger sequencing primers resulting in incomplete Sanger sequence spanning the entire gp160 region (and thus failure of the entire sequence).
Comparison of Consensus Sequences from the Reference-Free Method for Seven Amplicons
ONT, Oxford Nanopore Technologies; PB, Pacific Biosciences; ONT-R/PB-R, mapped to Sanger reference; ONT-F/PB-F, mapped to pseudo reference.
In one amplicon (5095-LN-UNF-116), the ONT-F had 87 ambiguities, whereas the PB-F had none (Table 2). In the other four amplicons, both the ONT-F and the PB-F had ≥35 ambiguities (one of which [2004-LN-UNF-102] also had 44 mismatches between the two sequences). Inspection of the Sanger electropherograms revealed that these five amplicons with high levels of ambiguities had multiple competing signals at individual positions for long stretches (>100 bp), indicating multiple starting templates present and preventing the assembly of the electropherograms to generate a complete Sanger gp160 sequence.
Clustering
To investigate the possibility of >1 starting template, we used a parallel approach in which several rounds of genetic clustering was performed. Clustering, unlike the mapping/consensus method described above, enables multiple representative sequences to be recovered for each amplicon, rather than forcing all reads to converge into a single consensus sequence. Processing occurred on each amplicon separately.
For the ONT data, after the initial round of clustering on the unaligned reads, the number of clusters for each amplicon ranged from 8,160 to 53,368 (Supplementary Table S3). Only one amplicon (2004-LNCD3-101) had a cluster with >100 reads, although it still contained <1% of the processed reads. Because the high number of clusters would require intense computational resources for further processing (e.g., alignment), the ONT data were not processed any further with this method.
For the PB data, after the initial round of clustering on the unaligned reads, the number of clusters per amplicon ranged from 1 to 186, and the number of clusters with >100 reads ranged from 1 to 10 (Table 3). The centroid sequence from each cluster was extracted, combined into a single file, aligned, and clustered again at 98% similarity. A single final cluster (containing >10% of the initial set of processed reads) was obtained for the majority of amplicons (n = 24), whereas 2–3 final clusters (each containing >10% of the initial set of processed reads) were obtained for the other six amplicons (Table 3).
Clustering Results of PB Reads
Sequence comparison among all methods
For each amplicon, the representative sequence(s) from the clustering analysis were compared with the NGS-F sequence (for the 23 amplicons with a Sanger sequence) or the PB-F sequence (for the 7 amplicons without a Sanger sequence). For amplicons with 2–3 clusters, we used the representative sequence most closely related to the PB-F sequence. The number of mismatches per amplicon (not including positions with ambiguities or insertions/deletions) ranged from 2 to 13 (Table 3). Inspection of the alignment showed that for amplicons with >1 representative sequence, all of the ambiguous positions in the PB-F sequence corresponded to positions where the representative sequences had different nucleotides; i.e., the ambiguities in the consensus sequence reflected the mismatches in the representative sequences (Supplementary data S3).
To visualize the relationship among the sequences, we combined the representative sequences from clustering, the NGS-F/PB-F sequences, and the Sanger sequences (when available) into a single alignment/tree (Fig. 3, Supplementary data S3). Of the 23 amplicons with a Sanger sequence, 22 also had only one representative sequence (i.e., cluster). For each of these 22 amplicons, all sequences grouped together on the tree on a single branch with high (>80%) bootstrap support. For the other amplicon with a Sanger sequence (5095-LN-UNF-111), two genetic clusters were found; the Sanger, NGS-F, and the representative sequence from the cluster containing the most sequences (i.e., “Rep1”) grouped together, whereas the other representative sequence grouped elsewhere in the tree.

Maximum likelihood tree of sequences for 30 amplicons. Asterisks indicate branch support >80%. Branch length is proportionate to the substitution rate according to the scale bar at the bottom. The tip labels are shown, where the name consists of the amplicon ID and the type of analysis used to generate it (Sanger, NGS-F/PB-F, PB-Rep [representative sequence from clustering analysis]). Tip labels are colored as follows: blue = amplicons with a Sanger sequence and a single cluster (n = 22); green = amplicons without a Sanger sequence and a single cluster (n = 2); red = amplicons with a Sanger sequence and multiple clusters (n = 1); gray = amplicons without a Sanger sequence and multiple clusters (n = 5).
For the two amplicons (5095-LN-UNF-113 and 5095-LN-UNF-118) that did not have a Sanger sequence due to primer failure, and each of which only had a single representative sequence, all four sequences from those two samples grouped together on a long branch with high support, to the exclusion of any others.
For the remaining five amplicons without a Sanger sequence and multiple clusters, the PB-F sequence grouped with the Rep1 sequence with high bootstrap support. For one amplicon (2004-LN-UNF-102), all sequences grouped together and with no other amplicons, although with a long branch leading to one of the representative sequences. For the other four amplicons, one or more representative sequences were placed elsewhere on the tree (with sequences from the same patient, i.e., 5095).
A diagram showing a summary of the results is shown in Figure 4.

Visual summary of results. The quadrants represent combinations of 1 vs. >1 cluster, and 0–2 vs. >2 ambiguities. The color of the circle represents the presence/absence of a Sanger sequence according to the color legend (and also notes the reason for failure). The size of the circle is proportionate to the number of amplicons in each category (and also indicated). The upper and lower left quadrants are noted as being consistent with single starting templates.
Discussion
Our goal in this study was to determine (1) whether ONT or PB NGS (with barcoded and pooled amplicons) could be used to reconstruct a single consensus sequence as accurately as Sanger, and if so, would a prior reference sequence be required for accurate read mapping; and (2) whether ONT and/or PB NGS could be used to identify amplicons where >1 genome was likely present, and, if so, whether those multiple starting templates also could be accurately reconstructed. Overall, we found that for both long-read platforms, for the amplicons with a Sanger sequence (n = 23), the reference-based (ONT-R/PB-R) and reference-free (ONT-F/PB-R) produced identical (n = 9) or nearly identical (n = 14) sequences. In the 14 cases where all five sequences were not identical, the NGS-sequences were more likely to have ambiguities, but the Sanger sequences (and the NGS sequences mapped to the Sanger sequences) were more likely to have frameshift mutations. These results suggest that either ONT or PB reads alone (without an outside reference sequence) can be used to produce accurate sequences. Furthermore, these results suggest that NGS may be more reliable than Sanger in not producing potentially false frameshift mutations. In addition, in all cases of mismatches between Sanger and the NGS consensus sequences, the nucleotide in the NGS sequence matched all the other sequences (from other amplicons) from that patient, again suggesting that NGS consensus mapping could produce more accurate results than Sanger.
In two amplicons without a Sanger sequence, both the ONT-F and the PB-F sequences resulted in a nearly identical sequence, without ambiguities (although with two frameshift mutations in the ONT-F). Reanalysis of the Sanger electropherograms showed that a single sequencing primer failed completely, resulting in the lack of a complete Sanger sequence. Therefore, the evidence suggests that these amplicons were not actually derived from multiple templates (and further evidence of why Sanger sequencing can be limited compared with NGS).
In the other five amplicons without a Sanger sequence, ≥35 mismatches and/or ambiguities were found in one or both of the NGS sequences. The co-occurrence of the inability to produce a complete Sanger consensus due to ambiguous electropherograms and the noisy NGS sequences suggested to us that these amplicons had >1 starting template. Altogether, the results suggest that 25/30 (83%) amplicons were derived from single template, which is consistent with the expected proportion using the serial dilution method. Typically, sequences suspected of being derived from multiple templates would be discarded from an analysis, and/or the PCR would be repeated at a lower dilution. However, this also increases the cost of the experiment in both reagents and time. We were interested in whether these amplicons could be “saved”—that is, could we identify the sequence of each starting template from the NGS data.
To investigate this, we used a parallel method based on clustering to identify representative sequences for each of the 30 amplicons using the set of processed reads (i.e., filtered on length and quality, and demultiplexed, but not aligned). For the ONT reads, the first round of clustering did not result in an appreciable reduction in the number of reads, which would have made further aligning steps computationally intense. In contrast, the first round of clustering on the PB processed reads resulted in a reduction by several orders of magnitude, resulting in a dataset that could be easily aligned. Since the reads were not aligned at this first stage, reads starting even one nucleotide before or after another read would result in nonclustering. Nonetheless, the difference between the two long-read platforms was striking.
We generated a final set of 1–3 clusters of the PB reads for all amplicons. The presence of a single cluster was highly associated with also having a Sanger sequence: 22/30 amplicons had both, 5/30 amplicons had neither. Of the remaining three amplicons, the two amplicons which failed Sanger due to a single primer (but which had clean NGS consensus sequences) also had a single cluster. The phylogeny showed that sequences from these amplicons grouped together on a long branch, indicative of considerable divergence, which could also explain why that sequencing primer failed. The remaining amplicon (with a Sanger sequence, identical NGS consensus sequences, but two clusters) is more difficult to explain. If multiple templates were present, they would be expected to be represented in the amplified PCR product in approximately equal proportions (and therefore resulting in a failed Sanger sequence and/or many ambiguities in the NGS sequences); however, extremely asymmetrical amplification of the two products is possible, particularly if one template has less efficient binding to one of the amplification primers. It is also possible that, in the pooled set of PB reads, the barcode for a different amplicon was mistakenly binned with these, due to sequencing error in the barcodes themselves. This possibility would need to be explored in more depth, for example, by comparing different settings in the demultiplexing step. While outside the scope of this study, additional investigation of the design and analysis of barcodes could be useful, in particular when using larger sets of barcodes.
In all six amplicons with multiple clusters, all representative sequences grouped with sequences from the same patient, although for 5/6 amplicons, the lower-frequency representative sequence clustered with a different amplicon. These results are consistent with the hypothesis of multiple starting templates. While it is possible that these results could instead be indicative of cross-contamination between samples or incorrect barcode assignment, the high association between multiple representative sequence and issues with Sanger sequencing weigh in favor of multiple starting templates as an explanation. In several instances, the tree showed that two amplicons shared identical sequences. This could be evidence of clonal expansion of an infected cell, which would be consistent with the T cell dominant population in the spleen and lymph node tissues studied here. However, insertion site analysis would be necessary to confirm that clonal expansion rather than barcode hopping or cross-contamination is responsible.
To determine how accurate the representative sequence(s) from the clustering analysis was compared with the PB-F consensus sequence, we counted the number of mismatches, ignoring ambiguities (which are not considered in the clustering) and frameshift mutations (which may have been eliminated in the manual alignment cleanup). This conservative estimate ranged from 2 to 13 mismatches. Assuming that the PB-F sequence was correct (given the high similarity with the Sanger sequence shown earlier), this suggests that the clustering method may not produce the most reliable sequence compared to mapping. This is also not unexpected, since the consensus sequence methods by definition take the majority nucleotide at each position, which largely eliminates sequencing-induced errors. In contrast, the representative sequence(s) are not consensus sequences, but rather an actual read that represents a genetic cluster. In addition, a number of different factors can impact the selection of the representative sequence (e.g., the order of the input sequences). For these reasons, a representative sequence generated through clustering is not necessarily an error-free sequence. While this is a limitation of the clustering method—especially given the high error rate of the long-read platforms—clustering still could be potentially useful for other applications, e.g., determining a possible source of contamination, or the number of starting templates. We also note that this method does not account for PCR-induced recombination, which is the major reason why SGA is performed in the first place.
In conclusion, we have systematically shown that both ONT and PB are reliable platforms that can produce a consensus sequence from a single starting template with equal (or better) accuracy compared with Sanger and, importantly, that no prior reference sequence (i.e., Sanger sequence) is required. We also demonstrated that a clustering analysis such as the one performed here can be used as a complementary method for investigating specific questions, although the exact accuracy of representative sequences should not be assumed.
Footnotes
Authors’ Contributions
D.J.N.: Conceptualization (equal), Investigation (equal), Methodology (equal), Formal Analysis (equal), Validation (equal), and Writing (equal). J.D.: Investigation (supporting). R.B.: Investigation (supporting). K.G.: Investigation (supporting). K.L.: Project administration (lead). C.H.: Software (equal). S.R.: Software (equal). S.L.L.: Funding acquisition (lead) and Writing review (lead). R.R.: Conceptualization (equal), Investigation (equal), Methodology (equal), Formal Analysis (equal), Validation (equal), Writing (equal), and Supervision (lead).
Author Disclosure Statement
D.J.N., J.D., C.H., S.R., S.L.L., and R.R. work for BioInfoExperts, LLC.
Funding Information
S.L.L. was funded by a
Supplementary Material
Supplementary Data S1
Supplementary Data S2
Supplementary Data S3
Supplementary Table S1
Supplementary Table S2
Supplementary Table S3
References
Supplementary Material
Please find the following supplemental material available below.
For Open Access articles published under a Creative Commons License, all supplemental material carries the same license as the article it is associated with.
For non-Open Access articles published, all supplemental material carries a non-exclusive license, and permission requests for re-use of supplemental material or any part of supplemental material shall be sent directly to the copyright owner as specified in the copyright notice associated with the article.
