
Abstract
Asanté HIV-1 Rapid Recency Assay identifies HIV-1 recent infection based on antibody avidity among newly diagnosed individuals. We estimated the mean duration of recent infection (MDRI), false recency rate (FRR), the probability of being classified as recent over time and examined the assay reproducibility. A total of 967 longitudinal plasma specimens from 180 HIV-1 seroconverting individuals, all antiretroviral treatment (ART) naïve, from multiple countries were used to determine the MDRI, while cross-sectional plasma specimens from individuals infected for >1 year (total n = 1,285; n = 926 without AIDS; n = 359 with AIDS; all ART naïve) were tested to estimate the FRR. All specimens were tested by two testers and results were interpreted visually, followed by a line intensity reader. Linear interpolation and polynomial regression were used to estimate the duration of recent infection by subject. MDRI was calculated as a mean of individual duration of recency while FRR was calculated as a fraction of long-term (LT) cases that were misclassified as recent. The LT line intensity, a reflection of antibody avidity, demonstrated an overall increase over time, especially during the first year after seroconversion. The MDRI was 160 days [95% confidence interval (CI), 140–181] by linear interpolation and 167 days (95% CI, 147–187) by polynomial regression among ART-naïve cases. Probability of individuals testing as recent infection was 97.9% (95% CI, 93.9%–99.3%) by 1 month post-seroconversion and decreased to 10.3% (95% CI, 6.3%–16.5%) by 12 months. FRR was 2.1% (95% CI, 1.3%–3.2%) among ART-naïve individuals infected >1 year and 5.1% (95% CI, 3.4%–7.8%) among patients with AIDS. The assay indicated high inter-tester reproducibility of 96.2%. It can be a valuable tool for program-based HIV-1 recent infection surveillance for a better understanding of risk factors of acquiring new infections. Our study provides evidence about the performance of the assay for data interpretation of recency surveillance among newly diagnosed individuals.
Introduction
Since HIV was first identified in 1980s in patients with AIDS, 1 –3 it’s estimated that >42 million people have died from AIDS-related illnesses by 2023 and almost 40 million people were living with HIV worldwide. 4 Global efforts led by The Joint United Nations Programme on HIV/AIDS (UNAIDS) aim to end HIV/AIDS as a public health threat by 2030. Attributed to the broad availability of effective treatment and prevention tools, countries are making progress toward epidemic control. However, there are still many challenges holding the program off interim UNAIDS milestone. 5
It is essential to identify where and why new HIV infections are occurring to implement cost-effective targeted measures. As early as nearly 20 years ago, there were already attempts in Europe to establish recent infection surveillance to characterize the HIV epidemics using laboratory-based testing for HIV recent infection, 6 –8 and this approach was recently piloted in Kenya and Zimbabwe as well. 9 Laboratory-based recency testing requires a cold chain during specimen transport to a central laboratory, skilled laboratorians, and well-maintained laboratory devices, which can be challenging for a program-based surveillance in resource-limited settings. 10
Asanté HIV-1 Rapid Recency® Assay (ARRA) is a rapid test that can verify HIV-positive status [positive verification (PV) line] and detect recent HIV-1 infection [long-term (LT) line] in the same device (Sedia Biosciences Corporation, Oregon). It is based on the concept of limiting antigen avidity assay first described by our group in 2010. 11 A prototype in rapid test format was developed in 2013, 12 and it is the first and only commercially available test in this genre. The assay’s LT line contains a previously described HIV-1 rIDR-M recombinant antigen 11 coated at a specific but limiting concentration, so it only binds HIV-1 antibodies with high avidity, typically found in blood samples of individuals with LT infections. As a rapid test, the assay is easy to use and requires no additional equipment. With appropriate training, testers/health care personnel can conduct the testing in clinic/community settings. 13 The innovation and successful commercialization of rapid testing for recent infection make it possible to establish a near real-time surveillance for HIV-1 recent infections at scale in resource-limited countries, in conjunction with routine HIV testing services (HTS). 12 Supported by the U.S. President’s Emergency Plan for AIDS Relief (PEPFAR) program, as of 2024, more than 20 countries are using ARRA for HIV recent infection surveillance under the Tracking with Recency Assays to Control the Epidemic (TRACE) initiative. 14
Mean duration of recent infection (MDRI) and false recency rate (FRR) are two key performance parameters of recency assays. MDRI is the average time that subjects remain classified as “recent infection” by recency assay after seroconversion. FRR is the proportion of individuals with a LT infection (i.e., greater than 12 months) misclassified as recently infected.
In this study, we estimated the MDRI and FRR of ARRA using previously collected longitudinal and cross-sectional specimens, respectively, from various sources. In addition to visual interpretation, we used electronic reader supplied by the manufacturer to get quantitative numbers of line intensity to facilitate analysis. Furthermore, we conducted descriptive analyses to determine the probability of individuals testing recent infection on ARRA over time post-seroconversion. These findings provide laboratory evidence to guide the interpretation of data collected through surveillance using ARRA. Use of the ARRA in this context is not to estimate incidence but to identify factors that drive ongoing transmission of HIV-1 infections, as described. 15 –17
Materials and Methods
Specimens
We used 967 longitudinal plasma/serum specimens collected from 180 antiretroviral treatment (ART)-naïve HIV-1 seroconverters to estimate the MDRI. These specimens were historically collected in the 1990s as part of various cohort studies in the Netherlands (Amsterdam), 18 Trinidad, 19 –21 Ethiopia, 22 Thailand, 23 and the United States. 24 These specimens also included 25 commercial panels covering the very early period after seroconversion. Specimen background information including study origin, HIV-1 subtype, number of subjects, and specimens is summarized in Table 1. We assumed that seroconversion occurred at midpoint between the date of the last negative sample without detectable antibody and date of first sample with detectable antibody, and days since seroconversion of each specimen were calculated accordingly. On average, the first sample with detectable antibody for individuals was collected 81 days post-seroconversion (range 0–305). The characteristics of seroconversion panels are listed in Supplementary Data S1. Commercial seroconversion panels from Boston Biomedica Inc. (BBI) and North American Biologicals Inc. (NABI) have a very short duration of follow-up with 93.0% of all specimens collected ≤60 days since seroconversion. Although these individuals did not transition from recent to LT status, these specimens are included to assess the performance of the test during the very early phase of seroconversion.
Summary of Seroconversion Panels
Subtypes of Thai BMA specimens were determined by V3-peptide based serologic assay (Pau et al. 25 ), one panel was not typable; subtypes of rest of the specimens were inferred based on geographic locations where samples were collected.
We used 1,341 cross-sectional HIV-1 positive plasma specimens collected from treatment-naïve individuals who were known to be infected more than 1 year ago to estimate the FRR. These specimens comprise 952 specimens from Ghana, 261 specimens from patients with AIDS in the United States, 26 and 128 specimens from patients with AIDS (CD4 < 200) coinfected with TB in Thailand.
The specimens used in this study were historically obtained from various collaborators and were confirmed as HIV-1 positives by laboratory-based algorithm (ELISA + Western Blot). These specimens were also used for successful characterization of other laboratory-based incidence assays as previously reported. 27 –29
Testing
ARRA test kits and strip readers were from Sedia Biosciences (Beaverton, Oregon, USA). Trained testers performed independent testing on all specimens following the manufacturer’s instructions, except for reader-based interpretation (see below). To ensure precise follow-up of testing steps including sample-incubation time, all testing was conducted in batches of ≤10 specimens, and the strips were read immediately after 20 min as instructed.
Specimens of seroconversion panels were tested by two testers independently except for eight specimens with insufficient volume. Test strips were first read visually as per the kit insert, then using a strip reader. Strip reader was used to get quantitative results of line intensities to facilitate the determination of MDRI. The visible interpretation and intensity unit (IU) of the control line, PV line, and LT line were recorded. Mean reader values of the two testers were used for further analysis. For interpretation of reader results, we used IU 2.800 as cutoff for PV line and IU 2.900 for LT line based on the previously published evaluation, i.e., it was classified as recent infection when PV line IU ≥2.800 and LT line IU <2.900, LT infection when PV line IU ≥2.800 and LT line IU ≥2.900, and HIV-negative when PV line IU <2.800 and LT line IU <2.900 (Supplementary Data S1). These cutoffs were determined based on carefully conducted correlation with visual results, as described. 30,31
Cross-sectional specimens for FRR were first tested by two testers independently. Test strips were read visually, and the visibility of each line was recorded. When results between first two testers were discordant, the specimen was retested by the third tester as a tie breaker (Supplementary Data S2). The final visual results of the specimens were used for FRR calculation.
Data analysis
MDRI estimation
The mean IU of LT line, representing antibody avidity, from the two runs was used to estimate the MDRI; specimens that were HIV-negative by the assay were excluded from the analysis. As mentioned above, we assumed that seroconversion (day 0) occurred at the midpoint between the last negative and first positive. We assigned a value of 1.083 IU to day 0 based on the median LT line IU of 915 HIV-negative samples previously tested.
To estimate the MDRI, we first calculated the individual duration of recent infection (IDRI), that is, the period that each subject remains in the “recent infection” stage by ARRA after seroconversion. We then calculated the MDRI and 95% confidence interval (CI). Two successful and validated approaches, used in our previous study
29
were applied to estimate IDRI as described below.
Additionally, we calculated the probability of individuals testing recent at certain time (in months) post-seroconversion based on the IDRI by linear interpolation. For the individuals that had not converted to ARRA-LT status by the end of the cohort, the probability of testing as ARRA recent infection beyond the last visit was estimated using the proportion of individuals testing recent at a corresponding time based on available IDRIs.
FRR calculation
FRR was calculated as the proportion of specimens among a cross-sectional panel, collected from patients with HIV-1 who were infected >1 year, that was misclassified as recent infection by ARRA. Only specimens tested as HIV-positive on ARRA (n = 1340) were included in the calculation of FRR.
Reproducibility and diagnostic sensitivity
The visual results of all specimens were examined for the inter-tester reproducibility of ARRA, defined as the proportion of specimens with concordant results between tester 1 and 2. Additionally, we evaluated the sensitivity of the ARRA in detecting all HIV-positive specimens (as either recent or LT), including seroconversion panels and cross-sectional specimen sets.
Results
Seroconversion panels and estimation of MDRI
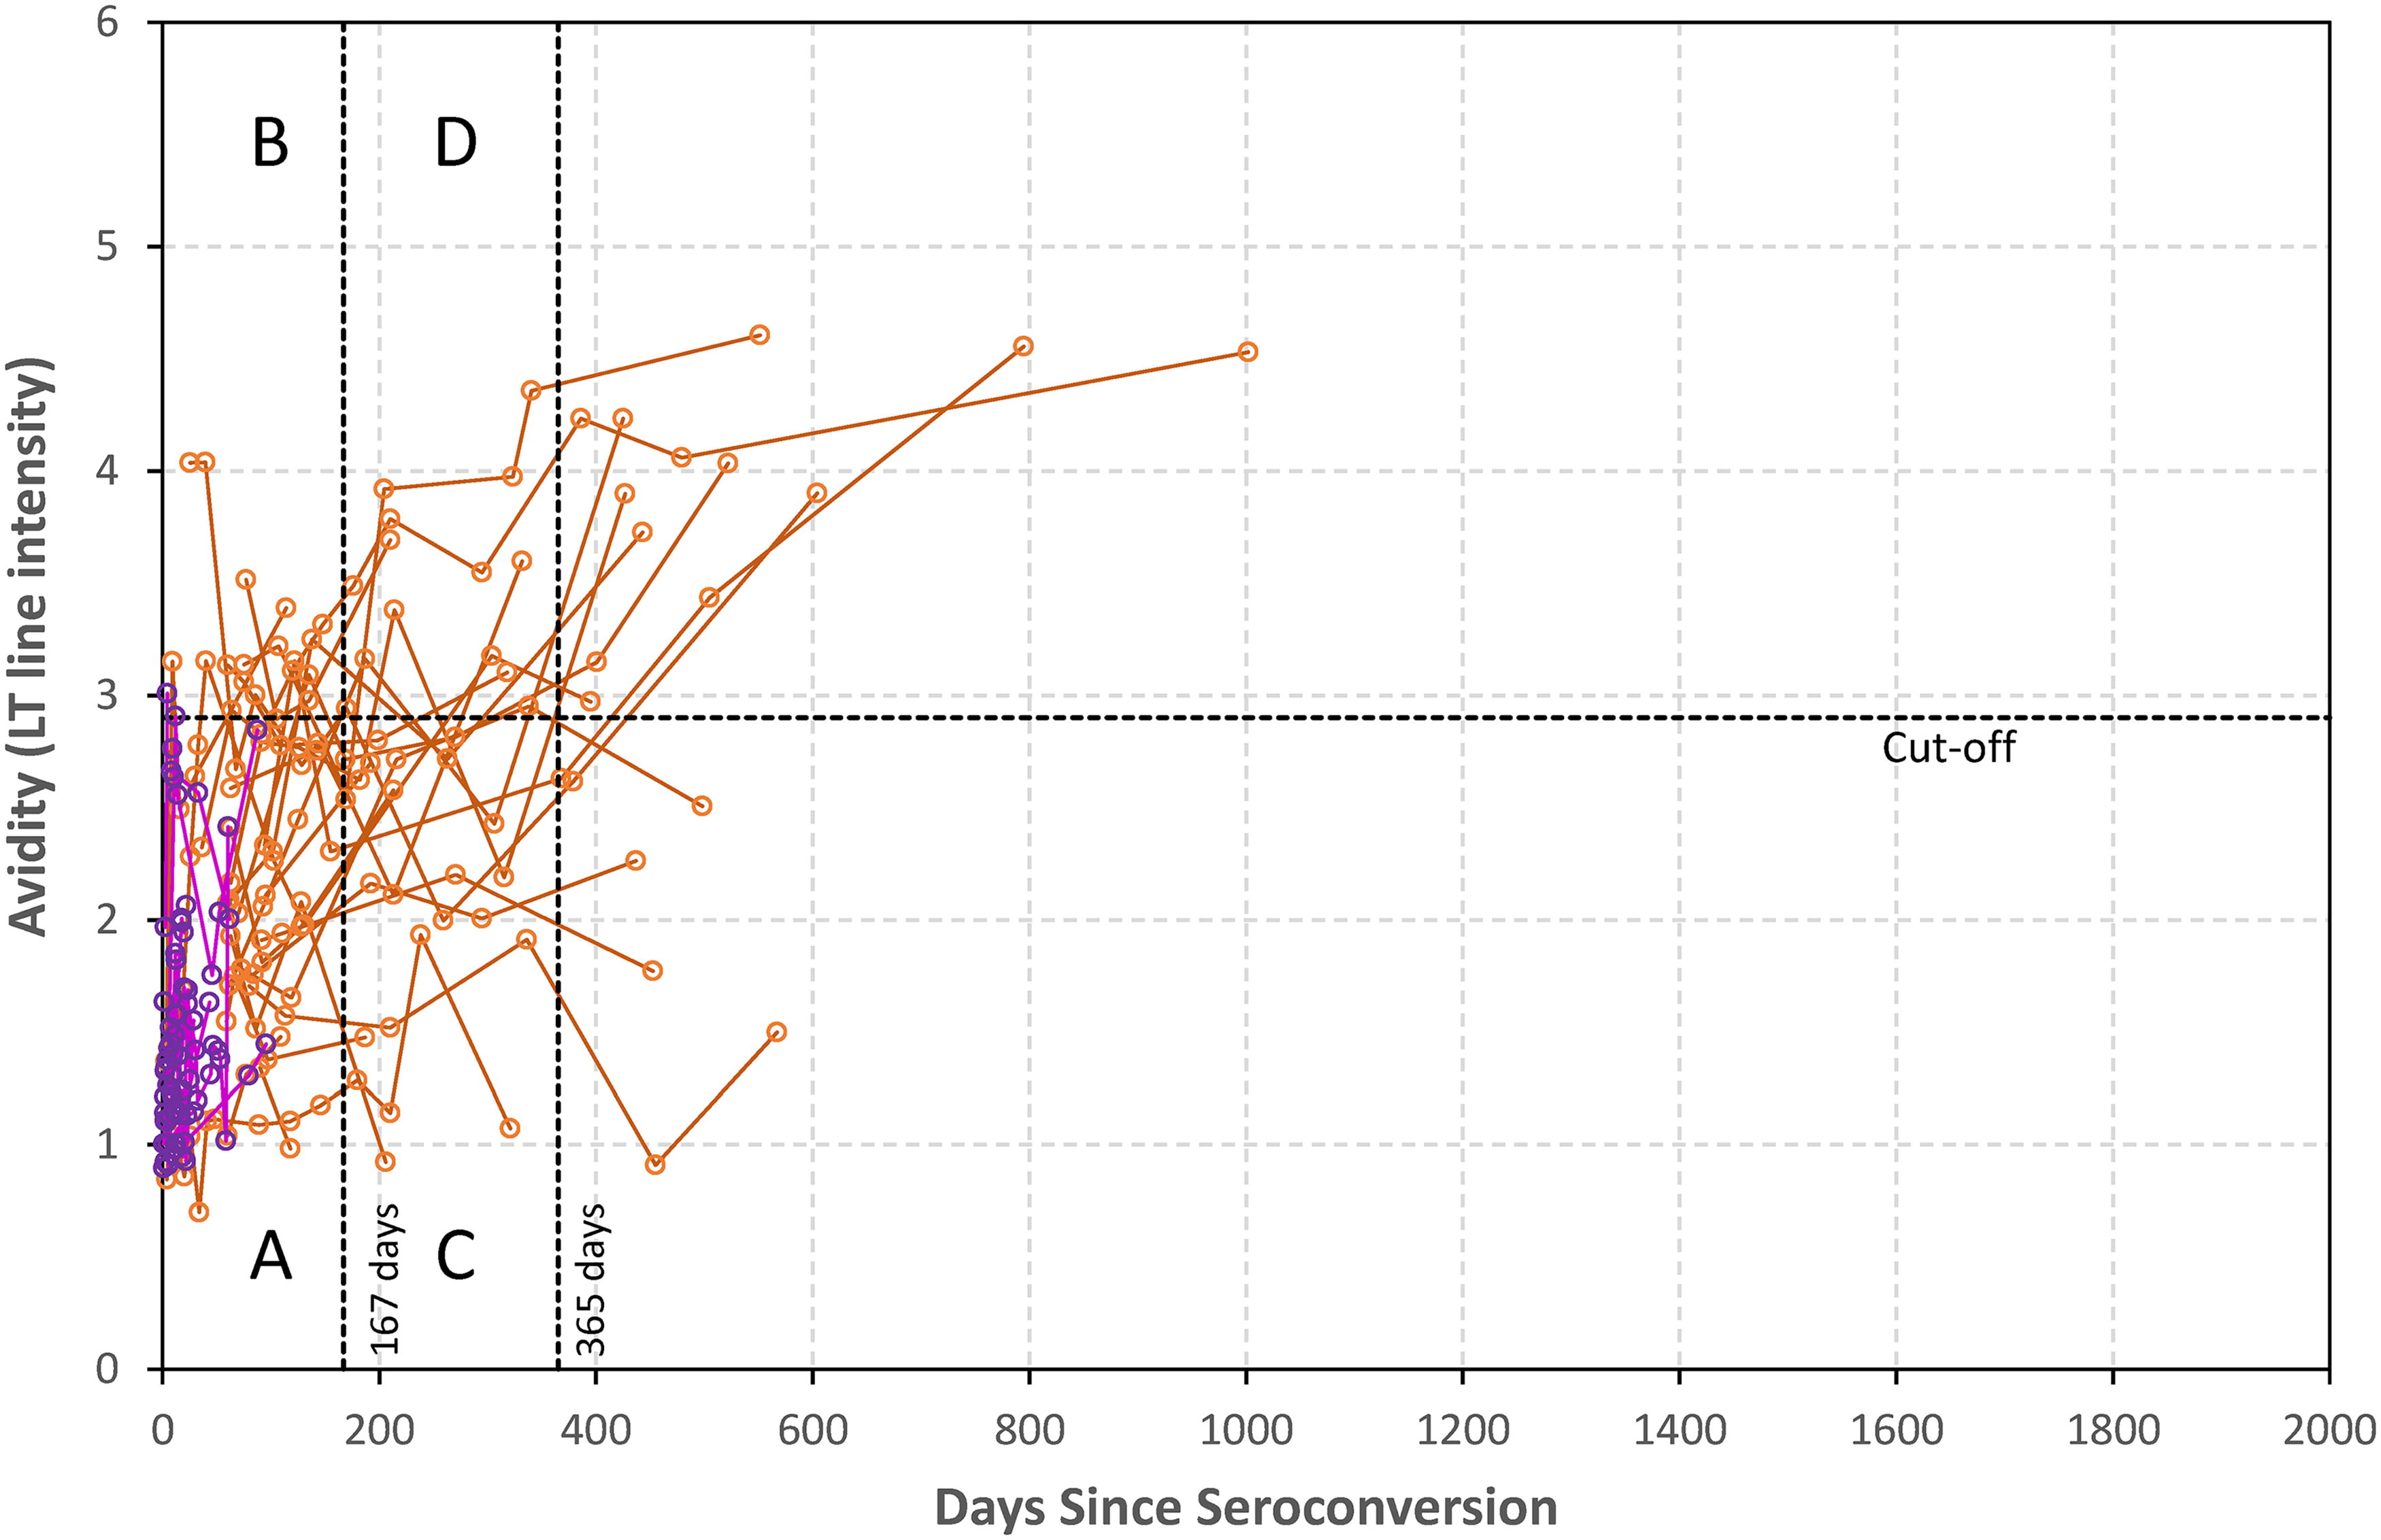
Seroconverting individuals show typical increasing antibody avidity overtime when tested by the ARRA, as indicated by the LT line intensity (Fig. 1). The plot represents avidity data from panels that crossed the threshold cutoff and were used to estimate the MDRI. Each line represents an individual donor over time. As expected, there is variability between individuals, resulting in differences when they transition from recent to LT status crossing the LT line threshold cutoff of 2.9 (dashed horizontal line). Most early specimens are in the lower left region (A), starting as recent cases. Those with rapid antibody development transition to LT status before the MDRI (vertical line at 167 days) and are in upper left region B (red lines). Those with slower developmental kinetics remain below the cutoff after the MDRI and are in lower right region C (blue lines). Most individuals have transitioned to LT status between 6 and 12 months and are in the upper right region (D), with 35.9% (95% CI, 28.4%–44.1%) and 10.3% (95% CI, 6.3%–16.5%) recent infections at 6 months and 12 months, respectively. The four regions are defined by a threshold cutoff of 2.9 (horizontal line) and two vertical lines represented by the mean duration of recency (first line at 167 days; see later) and second line at 365 days (T = 1 year), respectively. Linear interpolation and polynomial regression lines, as described in section “Methods,” were used to estimate individual duration of recency for those panels crossing the threshold cutoff to facilitate calculation of MDRI. MDRI estimated from individual duration of recency calculated by linear interpolation model using data from panels that cross the threshold cutoff of 2.9 is 160 (95% CI, 140–181) days since seroconversion and 167 (95% CI, 147–187) days by polynomial regression model (see section “Methods”). This MDRI of 167 days is represented by the first vertical line while the second vertical line represents 1 year (time T = 365 days when most individuals transition to LT status) to separate most recent infections from LT infections. Overall, there were 374 specimens classified as recent (below the threshold cutoff of 2.9) and 362 (96.8%) were within 1 year of seroconversion (A + C). Between 1 and 2 years, 169 (94.4%) of 179 specimens were classified as long-term, while all 62 (100%) specimens collected 2 years after seroconversion were classified as LT.

Increase in antibody avidity with time since seroconversion as measured by Asanté HIV-1 Rapid Recency Assay. The plot represents developmental kinetics of avidity from longitudinal specimens from 130 seroconverter panels crossing the cutoff; each panel is connected by a line. Those shown in red have rapid kinetics and those in blue have slower kinetics reflecting variable distribution of duration of recency around the MDRI of 167 days (vertical line). Horizontal line represents threshold cutoff of 2.9 to classify recent or LT infection. First vertical line represents an MDRI of 167 days while the second vertical line represents inclusive time T of 365 days since seroconversion. Regions labeled A, B, C, and D within these lines are further described in the “Results” section. LT, long-term; MDRI, mean duration of recent infection.
Table 2 provides a summary of MDRI, overall and by subtype, using polynomial regression. The MDRI for subtype B and AE were quite similar, 149 days (95% CI 123–175) and 156 days (95% CI 124–181), respectively. Although the MDRI for subtype C was somewhat higher, 213 days (122–240), statistically, there was no difference among subtypes because of overlapping CIs. We recognize the limitations of fewer seroconverter panels and variable intervals between specimen collection from subjects with subtype C, including last negative and first positive specimens, which likely contributed to large 95% CI.
Summary of MDRI and 95% Confidence Intervals, Overall and by Subtypes, Using Polynomial Regression Method
CI, confidence interval; MDRI, mean duration of recent infection.
Figure 2 represents data from panels that did not cross the threshold or crossed more than once and therefore, were not used to calculate MDRI by the methods described. Twenty-five BBI and NABI commercial panels were included here to demonstrate performance of the assay soon after seroconversion (purple dots/lines), although they did not transition to LT status due to short follow-up period. These panels, with more precise time of seroconversion, have short duration of follow-up (maximum 96 days) and 67 (93%) of 72 specimens were within 60 days after seroconversion. Five (6.9%) of 72 were HIV-negative by the strip reader as well by both testers. These five specimens were collected within 4.5 days (median) of estimated seroconversion (range 0–23 days). Remaining 67 (93.1%) specimens, all collected within 12.5 days (median) of estimated seroconversion (range 1–96 days) were classified as recent (region A) by at least one tester demonstrating that most true incident infections, representing very recent infections, will be correctly identified as recent during this early period after seroconversion.
Avidity profile from seroconversion panels that were not used to calculate MDRI because either they did not cross the threshold or had more than one cross-over points. BBI/NABI panels with short intervals of specimen collected soon after seroconversion are shown in purple. Remaining panels are shown in orange/brown. Horizontal line represents cutoff of 2.9 and two vertical lines represent MDRI of 167 days and T of 365 days. BBI, Boston Biomedica Inc.; NABI, North American Biologicals Inc.
There were additional 22 individuals (n = 128 specimens) that show atypical seroconversion profile (Fig. 2, brown dots/lines). Of these, 12 (n = 81 specimens) crossed the threshold cutoff more than once or exhibited LT status throughout the follow-up period while 10 (n = 47 specimens) remained in recent infection status during the follow-up period. First group may represent lack of early/recent specimen due to a bigger interval between last negative and first positive specimens. The second group of individuals may represent elite controllers, which can result in poor development of antibody avidity due to controlled viremia. Although these panels were not ideal for MDRI calculation, the collective profile show transition to LT status similar to Figure 1.
These data were further analyzed by Box-Whisker plot demonstrating analysis by month showing a gradual increase in antibody avidity with time since seroconversion (Fig. 3). Midpoint of transition from recent to LT status occurred at about 6–7 months with most individuals classified as LT after 12–13 months when it reached a plateau, consistent with T = 1 year.
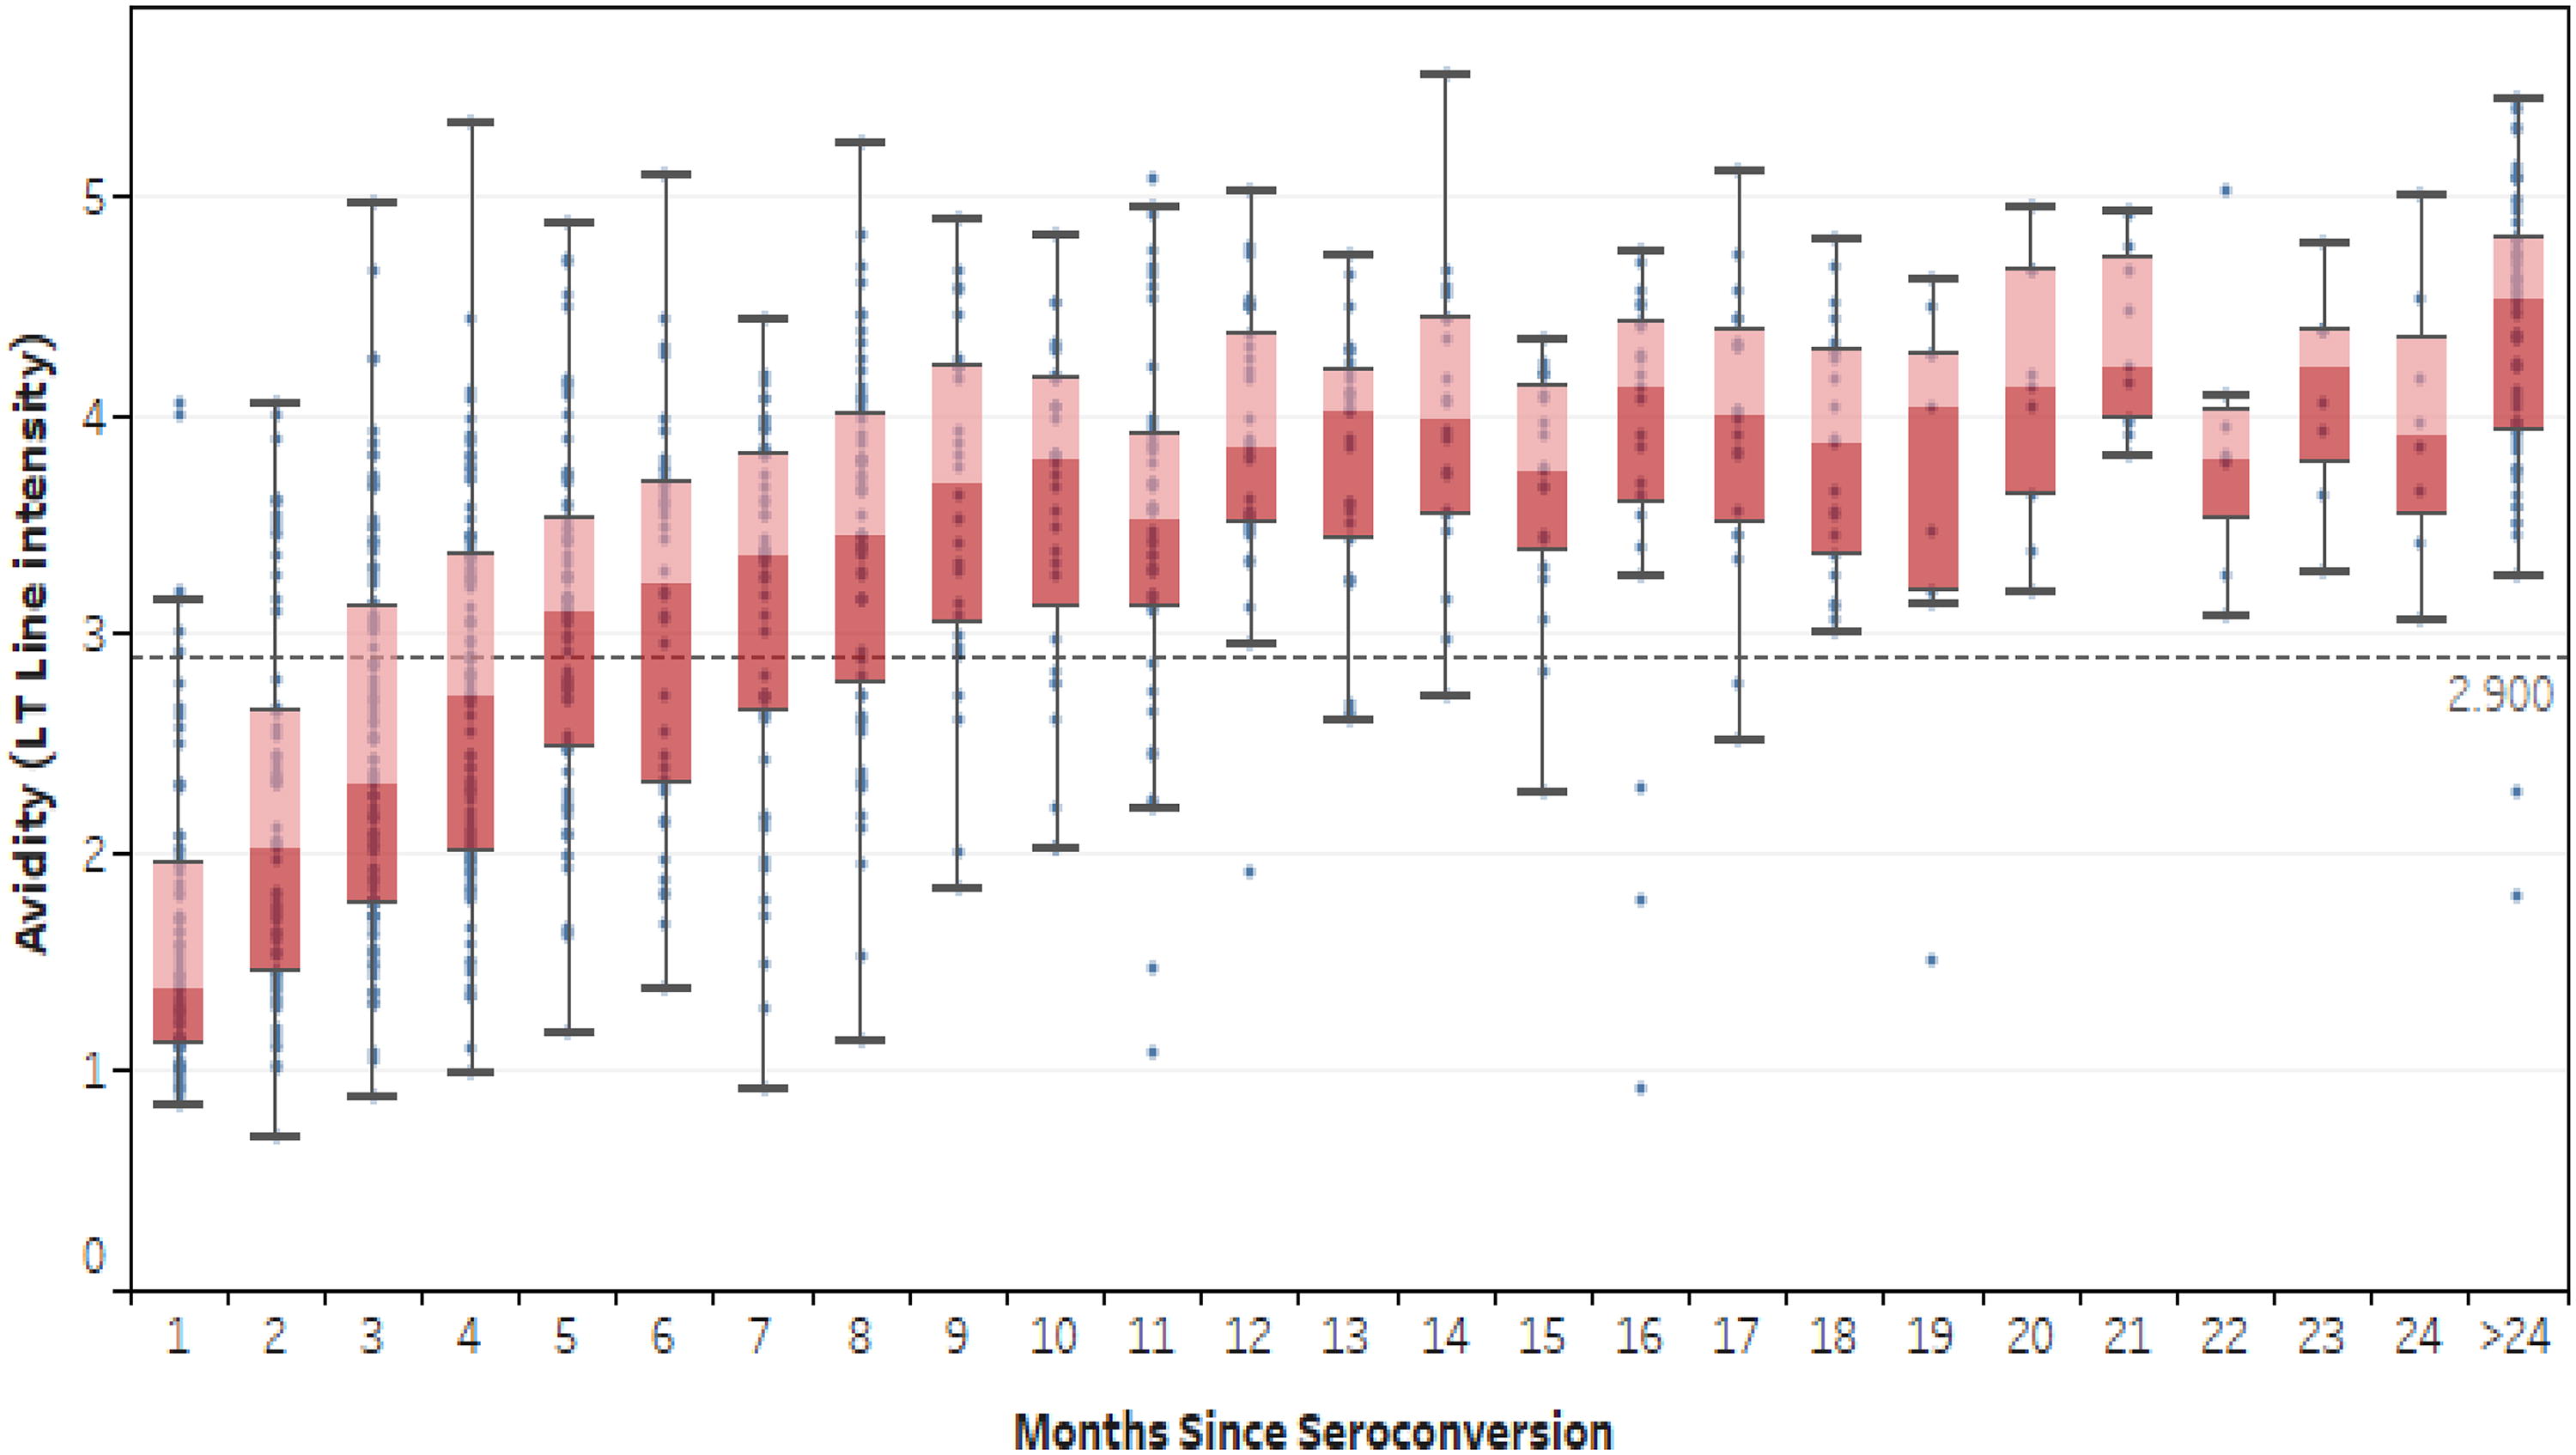
Box-Whisker plot demonstrating an increase of long-term line intensity (avidity) over time since seroconversion by months. The center line indicates the median, and the bottom and top of the boxes indicate the first and third quartiles, respectively. The lower and upper vertical lines extend from the first and third quartile lines, respectively, to the smallest and largest values no more than 1.5 times the IQR (interquartile range) away from the first and third quartile values. Values beyond that appear as points. The horizontal line in the plot indicates the cutoff of long-term line at 2.900.
The probability profile
The longitudinal data from seroconverting individuals were further analyzed to estimate probability of being recent on the ARRA with respect to time since seroconversion (Fig. 4). As expected, probability of testing as recent infection during the early period was high but declined over time since seroconversion (Fig. 4): it was 97.9% (95% CI, 93.9–99.3%) within first month of seroconversion and decreased to 35.9% (95% CI, 28.4–44.1%) by 6 months. By 12 months, probability of testing recent infection decreased to 10.3% (95% CI, 6.3–16.5%), i.e., roughly 90% of individuals transitioned to LT status within 12 months. This probability profile reflects variability of the antibody maturation and is similar to the pattern observed earlier with previously developed recent infection assays. 27,32 By 18 months, there is still a probability of testing recent at 2.2% (95% CI, 0.8–6.2%), which is comparable with the FRR estimated below using a cross-sectional panel.
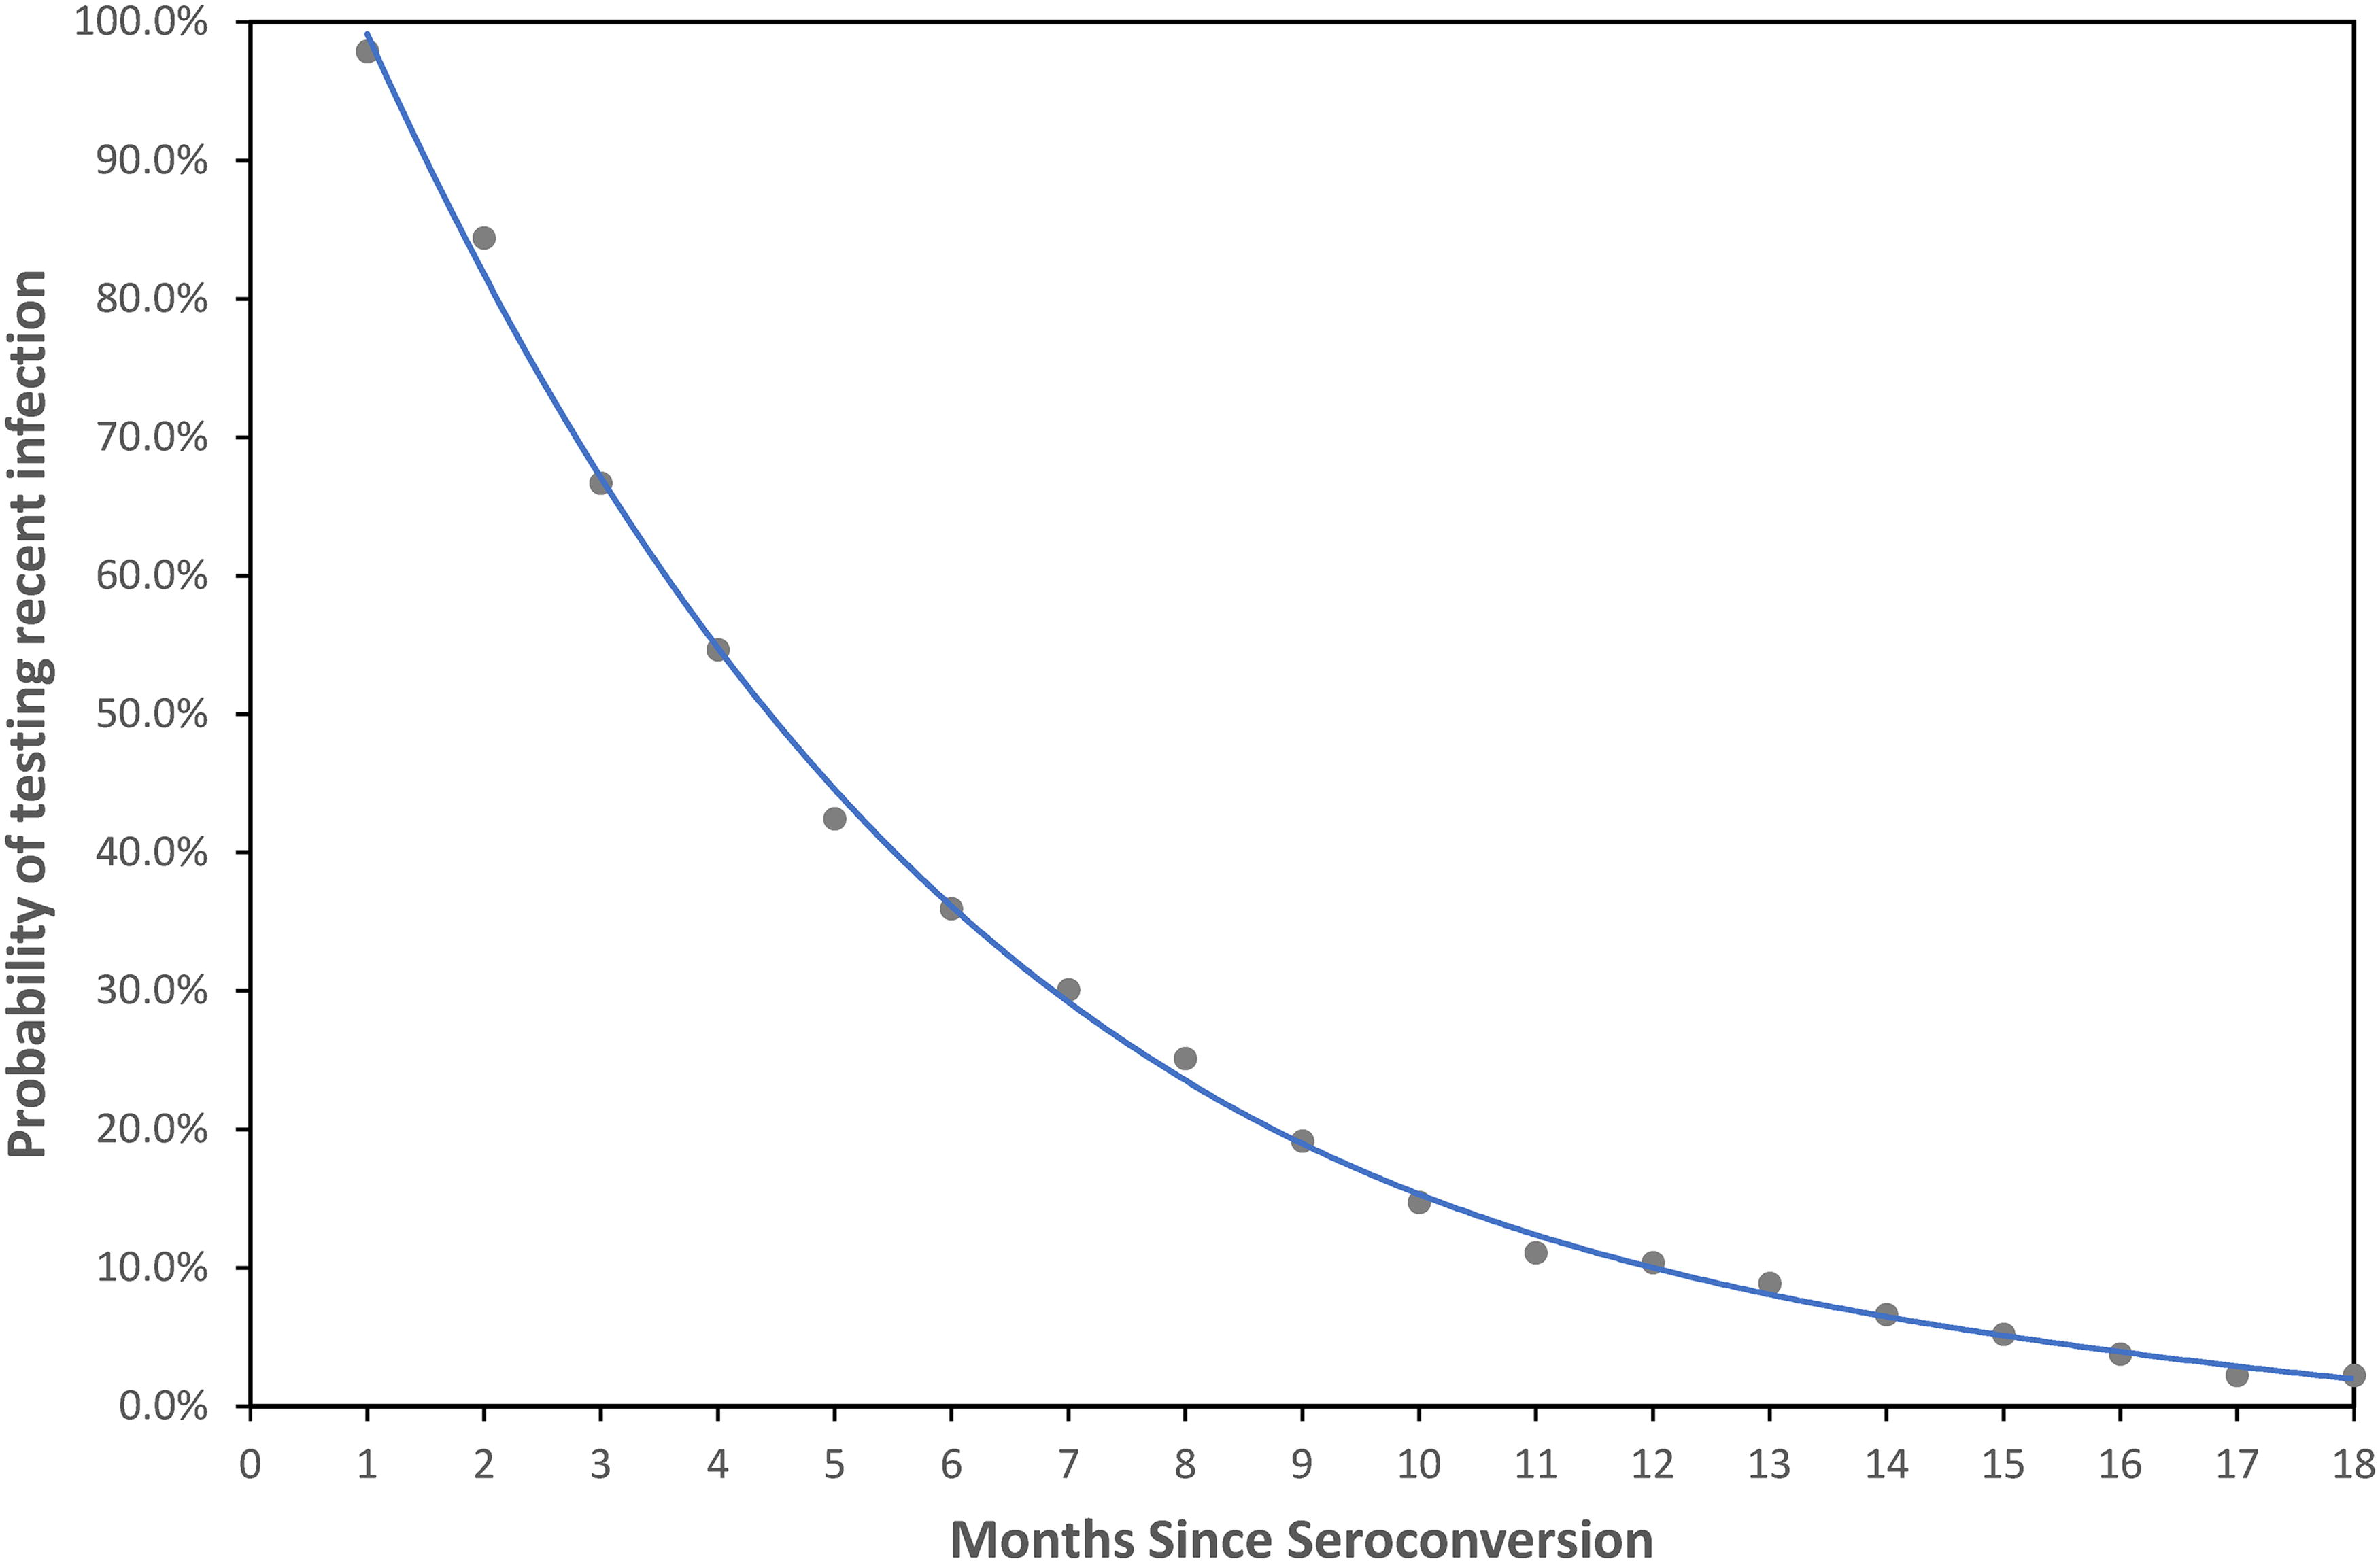
Probability of subjects testing Asanté HIV-1 Recency Assay recent over time since seroconversion by months. In total, 141 seroconverters were included in this analysis, including 131 individuals with determinable estimates of duration of recent infection and 10 individuals with no samples testing long-term infection during the follow-up. The blue line shows the best-fit trendline of polynomial regression of fourth degree (R 2 = 0.999).
False recency rate
Overall, 40 (3%) of 1,340 individuals with LT infection were misclassified as recent cases by ARRA (Table 3). When further analyzed by those with or without advanced disease (CD4 < 200/mm3 or >200/mm3, respectively) misclassification was at 5.1% (20/389), among those with AIDS while 2.1% of the non-AIDS LT cases (20/951) were misclassified.
Misclassification Among Cross-Sectional Specimens from Individuals with Long-Term Infections (>1 Year) and Results of Asanté HIV-1 Rapid Recency Assay
One inconclusive specimen (not recent or LT) was excluded from the calculation.
Sensitivity and reproducibility
Examining the ability of the ARRA to correctly verify HIV-positive diagnosis (presence of PV line), overall, 2,283 of 2,308 HIV-positive specimens (including individuals contributing to SC panels and FRR studies) were also positive (classified either as HIV recent or LT cases) on the assay, yielding a sensitivity of 98.9% for HIV diagnosis. It is noteworthy that one subject, likely an elite controller, contributed six specimens that were all negative on the ARRA. Keeping only one specimen from this individual to reduce bias, 2,282/2,303 were HIV-positive yielding a sensitivity of 99.1%. From the remaining 19 specimens giving false negative results, one was from FRR study collected 1 year after seroconversion while 18 were collected shortly after seroconversion (median = 12 days).
Among 2,308 specimens tested by two testers, 2,220 had concordant results between the testers, resulting in an inter-tester reproducibility of 96.2% (Cohen’s kappa = 0.86, 95% CI = 0.83–0.89). Specimens with discordant results yielded either very faint PV line (negative/recent discordance, n = 14) or faint LT line (recent/LT discordance, n = 74) with values close to the threshold cutoffs based on available reader results (median of PV line IU = 2.758, median of LT line = 2 .681).
Discussion
ARRA is the only commercially available HIV rapid test for detecting recent infection post-seroconversion, which we have further characterized in this report. Results from this study using seroconversion panels demonstrate that MDRI of the test is close to 160–170 days, similar to what was extrapolated from comparison with previously calibrated LAg-Avidity EIA at ODn cutoff of 2.0. ARRA evaluation by the Consortium for the Evaluation and Performance of HIV Incidence Assays (CEPHIA) reported comparable MDRI estimate (175 days since nucleic acid positive). 33 The small difference could be attributed to acute infection detection versus seroconversion estimates or differences in characteristics of the seroconversion panels. It is to be noted that previously collected panels are depleting and collection of new longitudinal panels from recently infected individuals is not possible now due to ethical reasons. Therefore, in the absence of valuable panels, a comparison with previously calibrated assays and extrapolation from the data, as we have done before, is the most obvious and practical approach to estimate MDRI. 30,31,34
It should be noted that the MDRI does not equate to “seroconversion of all individuals within 6 months” since it is a mean of the population. MDRI is useful at the population level, not for individual cases. However, when used in the context of individual cases, they are considered to be infected within past 12 months due to a bell-shaped distribution of recency period around the mean. MDRI is useful for estimating population incidence, which is not the intent here. Although there is a categorical classification, it is meant to be interpreted as “likely infected within 12 months,” considering individual variability and some level of misclassification that can persist. This is quite appropriate for this intended use since not all individuals transition from recent to LT status at or before 6 months.
Our study estimated an overall FRR of about 3% among individuals with LT infections and close to 2% among those without advanced disease. This is consistent with recommended product profile of a recency assay. However, the FRR increases to about 5% among those with CD4 < 200. Accordingly, although the test will classify 95% of individuals with CD4 < 200 correctly as LT cases, some individuals may misclassify as recent due to waning antibodies during late-stage progression. This misclassification can be mitigated or reduced with an appropriate recent infection testing algorithm (RITA) combined with robust case surveillance that can provide information about prior diagnosis, ART use, and advanced HIV disease with low CD4 and their exclusion from recent infection testing. In this context, baseline CD4 should be measured soon after diagnosis as part of the case surveillance and recency testing. Initial drop in CD4 during acute/early infection can be an issue in some cases when including this biomarker as part of the case surveillance. However, the intent here is to improve overall recency classification but not to classify every case correctly, which may not be possible due to complexity of host-virus interaction.
Determination of MDRI is meant to characterize the recency assays to assist in a better understanding of the recent cases. It is to be noted that MDRI represents the population mean of the duration of recency. Although all individuals will start as being recent (Figs. 1 and 4), there are individuals who transition early to LT status and others who transition later to LT status (Fig. 1). Our analysis estimated that after seroconversion about 40%–50% may transition to LT status by 5–6 months as shown by avidity maturation (Fig. 1) and probability profile (Fig. 4). It is to be noted that the assay classified 278 (64.2%) of the 433 specimens (regions A + B) that were within 167 days of seroconversion, as recent while 36.8% were classified as LT. Similarly, 340 (48.4%) of 702 specimens that were within 1 year of seroconversion were classified as recent. Moreover, this proportion can vary depending on the distribution of specimens, since very early specimens are more likely to be classified as recent (Fig. 4).
Accordingly, although the individuals with seroconversion within 6 months were technically true recent cases, only a subset were classified as recent because of rapid or slow maturation of antibodies. As the time passes, between 6 and 12 months, more individuals will transition to LT status. Recent cases identified by an assay represent average number of cases within the MDRI, where those missed by the recency assay before the MDRI (Fig. 1, upper left region B) are balanced by detection of additional recent cases after the MDRI (lower right region C) in population studies. This observation should not be misinterpreted as “sensitivity” of the recency assay, as reported by a study in Uganda. 35 Longitudinal specimens from seroconverting individuals are used to confirm expected maturation or changes in biomarker profile and estimate MDRI of an assay, not to determine sensitivity of an assay. In routine recent infection surveillance, if individuals are known to be recently infected, based on the testing history with last negative test within last 6–12 months, they should be classified as recent without testing by the recency assay. However, if they are tested, only a subset is likely to classify as recent due to varying maturation kinetics, as shown here. In fact, as pointed out in 2022 technical guidance, “sensitivity” is not a relevant term in the context of recency assays. 36
PV line of the ARRA, which is meant to verify HIV-positive status while classifying them as recent or LT, had a sensitivity of 99.1%. These results are consistent with previously published studies demonstrating that, if verified and approved by a regulatory agency, ARRA could be used as part of the HIV testing algorithm. 30,31,37
Until recently, laboratory-based tests have been used to identify recently infected individuals. 9,10,16,38 However, this requires specimen collection and robust transportation network to regional or central laboratory to maintain specimen integrity and quality for testing. ARRA is a rapid test that can be performed in non-laboratory settings. The development of a well-characterized rapid recency assay allows recency testing using whole blood specimens at or near the point of collection. However, the focus of the recency testing should be on surveillance. It is not recommended that these results be returned to the individual since it does not have any clinical benefit in the test-and-start era. 39 Currently, more than 20 PEPFAR-supported countries are implementing the ARRA to help identify subpopulations with ongoing transmission as part of the program-based surveillance in HTS. The test is well accepted by health care providers demonstrating feasibility of implementation as a surveillance tool. 13 This implementation is providing useful information about transmission hotspots and risk factors associated with acquiring HIV infections. 17,40 –42
We do not recommend use of ARRA for the estimation of incidence since population being tested in HTS settings is biased, may vary over time, and is not representative of the population. Incidence estimate also requires high coverage of the target population. Moreover, the precision of a rapid recency test, with visual interpretation, is not likely to be as high as laboratory-based assay, like LAg-Avidity EIA, which is the preferred method for estimation of incidence in cross-sectional surveys. 43 –45 We also do not recommend using the test as part of the HIV diagnostic strategy until the performance has been verified and approved by a regulatory agency.
Although the test is intended to be used among newly diagnosed ART-naïve persons who are identified in HTS settings, results from several countries indicate that a substantial proportion of individuals coming to HTS are prior positives and often on ART. They can be misclassified as recent due to decay of antibodies while on ART. This situation can be mitigated by adding viral load (VL) as part of the RITA. Testing clients coming to hospitals also indicated a significant proportion of individuals with advanced HIV disease/CD4 < 200/mm3. Ideally, both these populations should be excluded with robust case surveillance before the recency testing is performed, thereby reducing the need for VL.
The TRACE initiative, funded by the PEPFAR, is meant to complement cross-sectional surveys, such as population-based HIV impact assessment surveys, to identify recently infected individuals from routine testing services. If and when expanded to cover all newly diagnosed HIV-positives, along with appropriate RITA, it can provide a granular picture of ongoing transmission and help target appropriate prevention strategies. 14,41,46,47
It is reported that the performance of recency assay may vary across HIV subtypes. 29 The ARRA-LT line is coated with a multi-subtype recombinant protein rIDR-M to minimize such potential variation. Results didn’t indicate significant differences in MDRI across subtypes with overlapping 95% CI (Table 2). Moreover, these differences are unlikely to significantly affect recent infection surveillance. The primary objective of recent infection surveillance is to identify subpopulations with a high prevalence of recent cases infected within last 12 months rather than to estimate incidence rates.
Galiwango et al. reported a concordance of 72% between the two laboratories using only 45 specimens, all from recently infected individuals collected within 6 months of seroconversion. 35 Low concordance may be attributed to variability in training, individual visual acuity, and selection of specimens that are close to the cutoff. Recognizing that inter-laboratory reproducibility is expected to be higher than inter-tester reproducibility, our study demonstrated inter-tester reproducibility of >96% using more than 2,300 specimens with main discordancy observed for specimens close to the threshold cutoffs. Focusing just on specimens collected between 100 and 200 days since seroconversion from our dataset, we observed 177/202 (87.6%) specimens had concordant results, keeping in mind that all these individuals are recent infections (less than 1 year) and flip-flop while transitioning from recent to LT status is normal and expected. Considering inter-tester versus inter-laboratory settings, these results are not very different from Galiwango’s results. A well-planned hands-on training with a well-characterized panel is critical and should be part of a comprehensive quality assurance program to ensure good reproducibility. Trainings that can standardize the practice of testing and result interpretation on the ARRA should minimize variations. Furthermore, in real implementation settings, the proportion of challenging samples should be substantially lower than that of the panel used by Galiwango et al. where all specimens were from incident infections and were within 6 months of seroconversion.
Conclusions
The ARRA is a reliable rapid test for recent infection surveillance in programmatic settings. The determination of MDRI, FRR, and probability of testing recent by ARRA over time after seroconversion provide scientific reference for data interpretation for recency surveillance using Asanté. Overall, the ARRA is a valuable tool in the fight against HIV, helping to identify recent infections and target resources where they are needed most. Nevertheless, ARRA needs to be implemented with appropriate training, quality measures, and surveillance strategy and the surveillance data should be interpreted in the context of the target population.
Footnotes
Authors’ Contributions
X.T.: Laboratory testing, data review and analysis and article review/writing. M.D.: Laboratory testing and article review. S.V.: Laboratory testing and article review. T.D.: Laboratory testing and article review. E.Y.: Laboratory testing and article writing/review. B.S.P.: Planning, data review and analysis, article writing, overall supervision of the project.
Author Disclosure Statement
As an inventor of Rapid Recency Assay, B.S.P. receives a portion of the royalties from the technology transfer and sale of Asanté kits as per policy of the U.S. government. All other authors have no declared conflict.
Funding Information
This research has been supported by the President’s Emergency Plan for AIDS Relief (PEPFAR) through the Centers for Disease Control and Prevention (CDC). The findings and conclusions in this report are those of the authors and do not necessarily represent the official position of the funding agencies.
Supplementary Materials
Supplementary Data S1
Supplementary Data S2