




Abstract
Objective:
Cervical spinal cord injuries (SCIs) result in significant neurological and functional impairments. Current clinical assessments, such as the International Standards for Neurological Classification of Spinal Cord Injury, provide essential diagnostic and prognostic insights but have limited sensitivity in detecting residual motor control. This study aims to investigate whether surface electromyography (sEMG) signals can reveal distinct electrophysiological profiles that complement clinical information, potentially enhancing the assessment of SCI.
Methods:
sEMG signals were recorded from 184 upper extremity muscle groups across 22 adult individuals with cervical SCI. Time and frequency domain features were extracted. Multiple clustering algorithms, including k-means, k-medoids, density-based spatial clustering of applications with noise, and hierarchical clustering, were applied to identify distinct sEMG profiles. Internal validation metrics (Silhouette scores) and resampling-based robustness assessments were used to confirm the reliability of the clusters. Identified clusters were evaluated for their associations with clinical variables, including neurological level of injury (NLI), American Spinal Injury Association Impairment Scale scores, myotome levels, manual muscle testing scores, and lower motor neuron injury status.
Results:
Distinct and reproducible clusters were identified, and significant associations were found between the sEMG clusters and clinical variables, particularly the myotome level and NLI. However, the clusters were not fully explained by clinical variables, indicating that sEMG may capture additional physiological nuances, such as residual motor pathways or compensatory mechanisms, that are not readily assessed through standard clinical evaluations.
Conclusions:
This study demonstrates that in individuals with cervical SCI, sEMG-based clustering identified distinct muscle electrophysiological profiles. These profiles are partially aligned with clinical variables. Yet the additional dimensions captured by sEMG may have the potential to enhance neurological assessments and improve the clinical management of SCI. These findings underscore the need for further research with larger and more diverse datasets to validate the clinical relevance of sEMG clusters and explore their implications for rehabilitation strategies.
Introduction
Spinal cord injuries (SCIs) interrupt the motor pathways between the brain and muscles, leading to significant neurological impairments and permanent disability. The International Standards for Neurological Classification of Spinal Cord Injury (ISNCSCI) is the current gold standard for assessments of individuals with SCI. 1 The ISNCSCI framework classifies the neurological level of injury (NLI) and the severity of the SCI using the American Spinal Injury Association Impairment Scale (AIS). While well-established and widely used, these assessments have limitations in detecting residual volitional motor control, particularly in cases with no visible muscle contraction.2–4 Residual nerve fibers may traverse the injury site even in clinically motor-complete cases, as demonstrated by anatomical studies reporting some continuity across the lesion in at least half of the examined cases.5–7 Evidence from retrospective datasets also supports this, showing that about 14% of individuals with present motor evoked potentials were sensorimotor complete cases. 8 These findings highlight that the AIS distinctions between complete and incomplete injuries may not fully capture the extent of preserved pathways.
Surface EMG (sEMG) is a noninvasive technique for measuring electrical muscle activity and has been proposed to assess motor recovery after SCI.7,9–12 sEMG can detect subtle signals during voluntary movement attempts even when visible muscle contractions are absent,11–16 a phenomenon described as “discomplete” SCI.7,12,17,18 This highlights the potential of sEMG to provide more sensitive assessments of residual function and motor recovery. Furthermore, sEMG has demonstrated great potential in capturing the impact from SCI, which has not been utilized fully in clinical assessments and neurorehabilitation.19–25 sEMG features in both time and frequency domains contain rich physiological information on the source neuromuscular system, and their alterations can provide insights on the change of the system. 26 Changes in these features may reveal patterns related to residual motor activities that are not fully captured by conventional assessments. To address this, we used clustering analysis to investigate whether distinct muscle electrophysiological profiles could be identified in sEMG signals prospectively collected from individuals with cervical SCI. Furthermore, we sought to explore whether these profiles provide information that complements or extends clinical variables such as NLI, AIS, manual muscle testing (MMT), and myotome levels.
We hypothesized that distinct electrophysiological profiles could be identified from sEMG signals. We further sought to characterize the correlations of such profiles with existing clinical data, hypothesizing that sEMG-based clusters would be only partially correlated with existing clinical data. If the clusters are highly correlated with clinical data, it would indicate that sEMG primarily reflects existing clinical information. On the other hand, low or partial correlations would suggest that sEMG provides distinct and potentially complementary information, which would warrant further investigations into the diagnostic or prognostic applications of these data.
Methods
Data collection
This prospective study included 22 adult individuals with cervical SCI who were about to undergo functional electrical stimulation (FES) therapy. Participants were identified through one of three sources at the KITE Research Institute, University Health Network: the KITE Clinics, a clinical trial of MyndMove therapy (Clinicaltrials.gov: NCT 03439319), 27 and directly recruited for this study (Clinicaltrials.gov: NCT 05462925). The study protocol was approved by the Research Ethics Board of the University Health Network (approval number: 19-5395.6).
Participants had varying levels and severities of cervical injuries, including discomplete SCI, where no visible muscle contraction is observed yet EMG signals above noise level are detectable (Table 1). For each participant, the treating therapist identified for analysis 4–10 upper extremity target muscles relevant to the FES therapy plan, which was based on available clinical information and the patient’s functional goals, resulting in a total of 184 muscles (Table 1). This report focuses on the clustering analysis of baseline sEMG data; the relationship of these data with the FES therapy outcomes will be reported elsewhere.
Baseline Information of the Participants
Number of samples available to each clinical variable is included in parenthesis.
AIS, American Spinal Injury Association Impairment Scale; distance, distance to the injury level; MG, muscle group; MMT, manual muscle testing; NLI, neurological level of injury; SCI, spinal cord injury.
Participants underwent baseline sEMG assessments before any FES therapy. sEMG signals were recorded during resting (1 min), maximal (5 s), and submaximal (15 s) voluntary movements (three trials each). Submaximal trials were used for the analysis reported below, when available. If sEMG activity above the resting level was not visible during the maximal voluntary movements, no submaximal movement was attempted, and the maximal trial was used instead in the analysis. Resistance was provided according to the MMT protocol in the ISNCSCI or the Graded and Redefined Assessment of Strength, Sensibility, and Prehension. For muscles with no defined MMT protocol, the therapist team (led by S.K.-R.) developed custom protocols. sEMG signals were recorded with the Bagnoli data acquisition system (Delsy, USA) at a sampling frequency of 4 kHz with a 20–450 Hz bandpass filtering. Intramuscular EMG (iEMG) signals were recorded and interpreted from 47 muscle groups across 14 participants by a certified neurologist and clinical neurophysiologist (J.C.F.) to provide supplementary information.
Clustering analysis
To identify potential muscle electrophysiological profiles, we performed clustering analysis over time and frequency domain features extracted from baseline sEMG signals recorded from each target muscle.
sEMG feature sets
From the 184 muscle groups (22 participants), we recorded 554 contraction trials (3–4 attempts each). Given the small data set, stratification of the participants into subgroups was not explored for the purposes of the present study. Data preprocessing includes offset removal, bandpass filtering (20–450 Hz) to reduce motion artifacts, 60 Hz notch filtering to remove power line interference, and data segmentation. From each trial (maximal and submaximal), we extracted 3-s steady-state segments for sEMG feature extraction. The initial feature list was based on commonly used features in myoelectric pattern recognition for prosthetic control. These consisted of peak-to-peak amplitude, mean absolute values, root mean square, variance, zero crossings (ZERC), slope sign changes (SSC), waveform length, Willison amplitude (wAmp), log-detector, second-order moment, difference variance version, difference absolute mean value, mean and median frequency, cardinality, EMG histogram, 4th order autoregression coefficients, and 4th order cepstrum coefficients.28–32 The formulas can be found in the Supplementary Table S1.
We rescaled the features between 0 and 1 using min–max normalization. Then we reduced the dimensionality of the initial feature set with various feature selection and dimensionality reduction methods. The feature selection methods we used are variance thresholding (VT) and pairwise Kendall’s Tau rank correlation analysis (Corr). VT retained the top 5 uncorrelated features with the highest variance. Corr selected one feature from each group of highly correlated features (τ > 0.7). Additionally, from a recent SCI sEMG modeling study, we identified a set of features (MD) that are more differentiative of damage to the upper and lower motor neurons (LMNs) as well as muscle fiber loss after SCI. 26 Principal component analysis (PCA) further reduced the dimensionality of these feature sets by selecting components explaining more than 90% of the cumulative variance.
Clustering analysis and evaluation
We applied distance-based clustering methods consisting of k-means (centroid-based), k-medoids (less sensitive to potential outliers), and agglomerative hierarchical clustering (Fig. 1). We additionally explored a density-based clustering method, density-based spatial clustering of applications with noise (DBSCAN). Distance measures investigated were Euclidean distance, Manhattan distance, cosine similarity, and Chebyshev distance. We performed a grid search for clustering algorithm parameter tuning and optimized for the highest Silhouette score. The internal evaluation metric Silhouette score (range between −1 and 1) measures the similarities within and separation among clusters and was used to confirm distinct clusters do exist in a given feature space. Higher positive values indicate better separation of the clusters in a given feature space.

Clustering analysis and evaluation. Corr, feature set from Kendall’s Tau rank correlation analysis; MD, feature set from the SCI sEMG modeling; PCA, principal component analysis; sEMG, surface electromyography; SCI, spinal cord injury; VT, feature set from variance thresholding.
Validating the results of unsupervised learning methods can be difficult due to the lack of external labels, so confirming the robustness and reproducibility of results is necessary. To this end, we applied bootstrap resampling. For a given feature set and a given clustering method, we performed bootstrapping resampling (5 repetitions and 554 samples drawn each time with replacement) to obtain a stable clustering result. Considering the cluster number assignment was not ordered, we extracted the centroid of each identified cluster from every repetition. The centroids were then aligned across repetitions to match the identified clusters using the Hungarian algorithm. New cluster numbers were then assigned to each sample. Subsequently, the mean and standard deviations of matched centroids and Silhouette scores for each repetition were used to evaluate the model stability. A robust clustering algorithm should yield centroids with low variabilities.
In addition, we identified mutual samples, that is, muscle groups sampled in all 5 resampling repetitions. We calculated the percentage of repetitions where the same muscle group was assigned to the same cluster. Pairwise adjusted rand index (ARI), adjusted mutual information (AMI), and Jaccard index were computed for the mutual samples. A total of 10 pairs were obtained from the 5 repetitions. Mean and standard deviation of each metric from the 10 pairs were summarized to assess the agreement among all repetitions. ARI ranges between −1 and 1, with positive values indicating agreement (1 for perfect agreement), 0 indicating agreement expected by chance, and negative values indicating disagreement. AMI and Jaccard index range between 0 and 1, with 1 indicating perfect similarity and 0 no similarity. While AMI and ARI provide valuable information on cluster agreement, Jaccard index evaluates the overlap between clusters.
Subsequently, we used clinical information at both the person level and the muscle level for external evaluation to validate and interpret the semantic meaning of the distinct clusters. Person-level clinical information included SCI severity (AIS: A to D) and NLI (C3 to C6) (Table 1). Muscle-level information included myotome tested, the distance between the myotome level and NLI, baseline MMT score, and LMN injury status assessed via iEMG data (Table 2). The iEMG data categorized target muscles into three groups (Table 2): “no activation,” “damaged LMN,” or “inconclusive.” Note that iEMG data serve as supplementary information for validation due to its reliance on specialized personnel and equipment, adding invasiveness and complexity. In contrast, we are interested here in the diagnostic potential of sEMG because of its greater accessibility.
Muscle Group Categories Based on the Intramuscular Electromyography Data
LMN, lower motor neuron.
Statistical analysis
To investigate the relationship between identified clusters and the clinical data, we performed nonparametric univariate and multivariate analysis. For univariate analysis, we used (1) the Kruskal–Wallis test for nonparametric numerical clinical data (distance to the injury level) and (2) the chi-squared statistics for categorical clinical data (AIS and LMN) and for numerical data with no meaningful numerical differences between values (MMT, myotome, and injury level). These tests assessed the relationship between individual clinical variables and cluster assignments. Post hoc pairwise comparisons with Bonferroni correction were conducted for analysis involving more than two clusters.
To better understand the collective effect of clinical data, we used binomial and multinomial logistic regression with the cluster assignment as the response variable and clinical data as predictors. Cramér’s V correlation (range between 0 and 1) was used to identify and exclude highly correlated clinical variables to reduce redundancy. Cramér’s V correlation was suitable given that most of the variables are categorical. Although models such as the mixed linear model and generalized estimating equation are more robust to account for within-participant correlations, we chose logistic regression to better accommodate the response variable with more than two clusters (for which multinomial was used). A two-step process was implemented: (Step I) single-variable models identified significant predictors (alpha = 0.05), and (Step II) a final model with identified significant predictors. The Pseudo-R2 by McFadden, R2 (range between 0 and 1) was reported to assess the goodness of fit, with values above 0.2 indicating fair fit, above 0.4 moderate fit, and above 0.6 good fit. 33
Results
Clustering algorithm optimization
The initial feature set (Full) contains 24 features (Table 3). VT feature set retained 5 features, Corr retained 7, and the MD set identified 7 features from the SCI sEMG analysis. PCA further reduced their dimensionality, with 3 or 4 principal components (PCs) explaining over 90% of the variance.
Feature Sets Used for Clustering Analysis
ARCO1–ARCO4, 4th order autoregression coefficients; Card, cardinality; Ceps1–Ceps4, 4th order cepstrum coefficients; Corr, feature set from Kendall’s Tau rank correlation analysis; DAMV, difference absolute mean value; DVARV, difference variance version; EMGH, electromyography histogram; logD, log-detector; M2, second-order moment; MAV, mean absolute values; MeanF, MedF, mean and median frequency; MD, feature set from the SCI sEMG modeling; p2p, peak-to-peak amplitude; PCA, feature set from principal component analysis; RMS, root mean square; sEMG, surface electromyography; SSC, slope sign changes; VAR, variance; VT, feature set from variance thresholding; wAmp, Willison amplitude; wLen, waveform length; ZERC, zero crossings.
Figure 2 summarizes the highest Silhouette scores and corresponding cluster number (k) for each feature set and clustering method. Figure 3 shows the results from selected algorithms (k-means and k-medoids) on feature sets (VT+PCA, Corr+PCA, and MD), showing optimal clusters of 2 or 3 (Fig. 2). For PCA feature sets, the first 3 PCs are plotted (Corr+PCA only contains 3 PCs), while MD plots include ZERC, SSC, and wAmp.

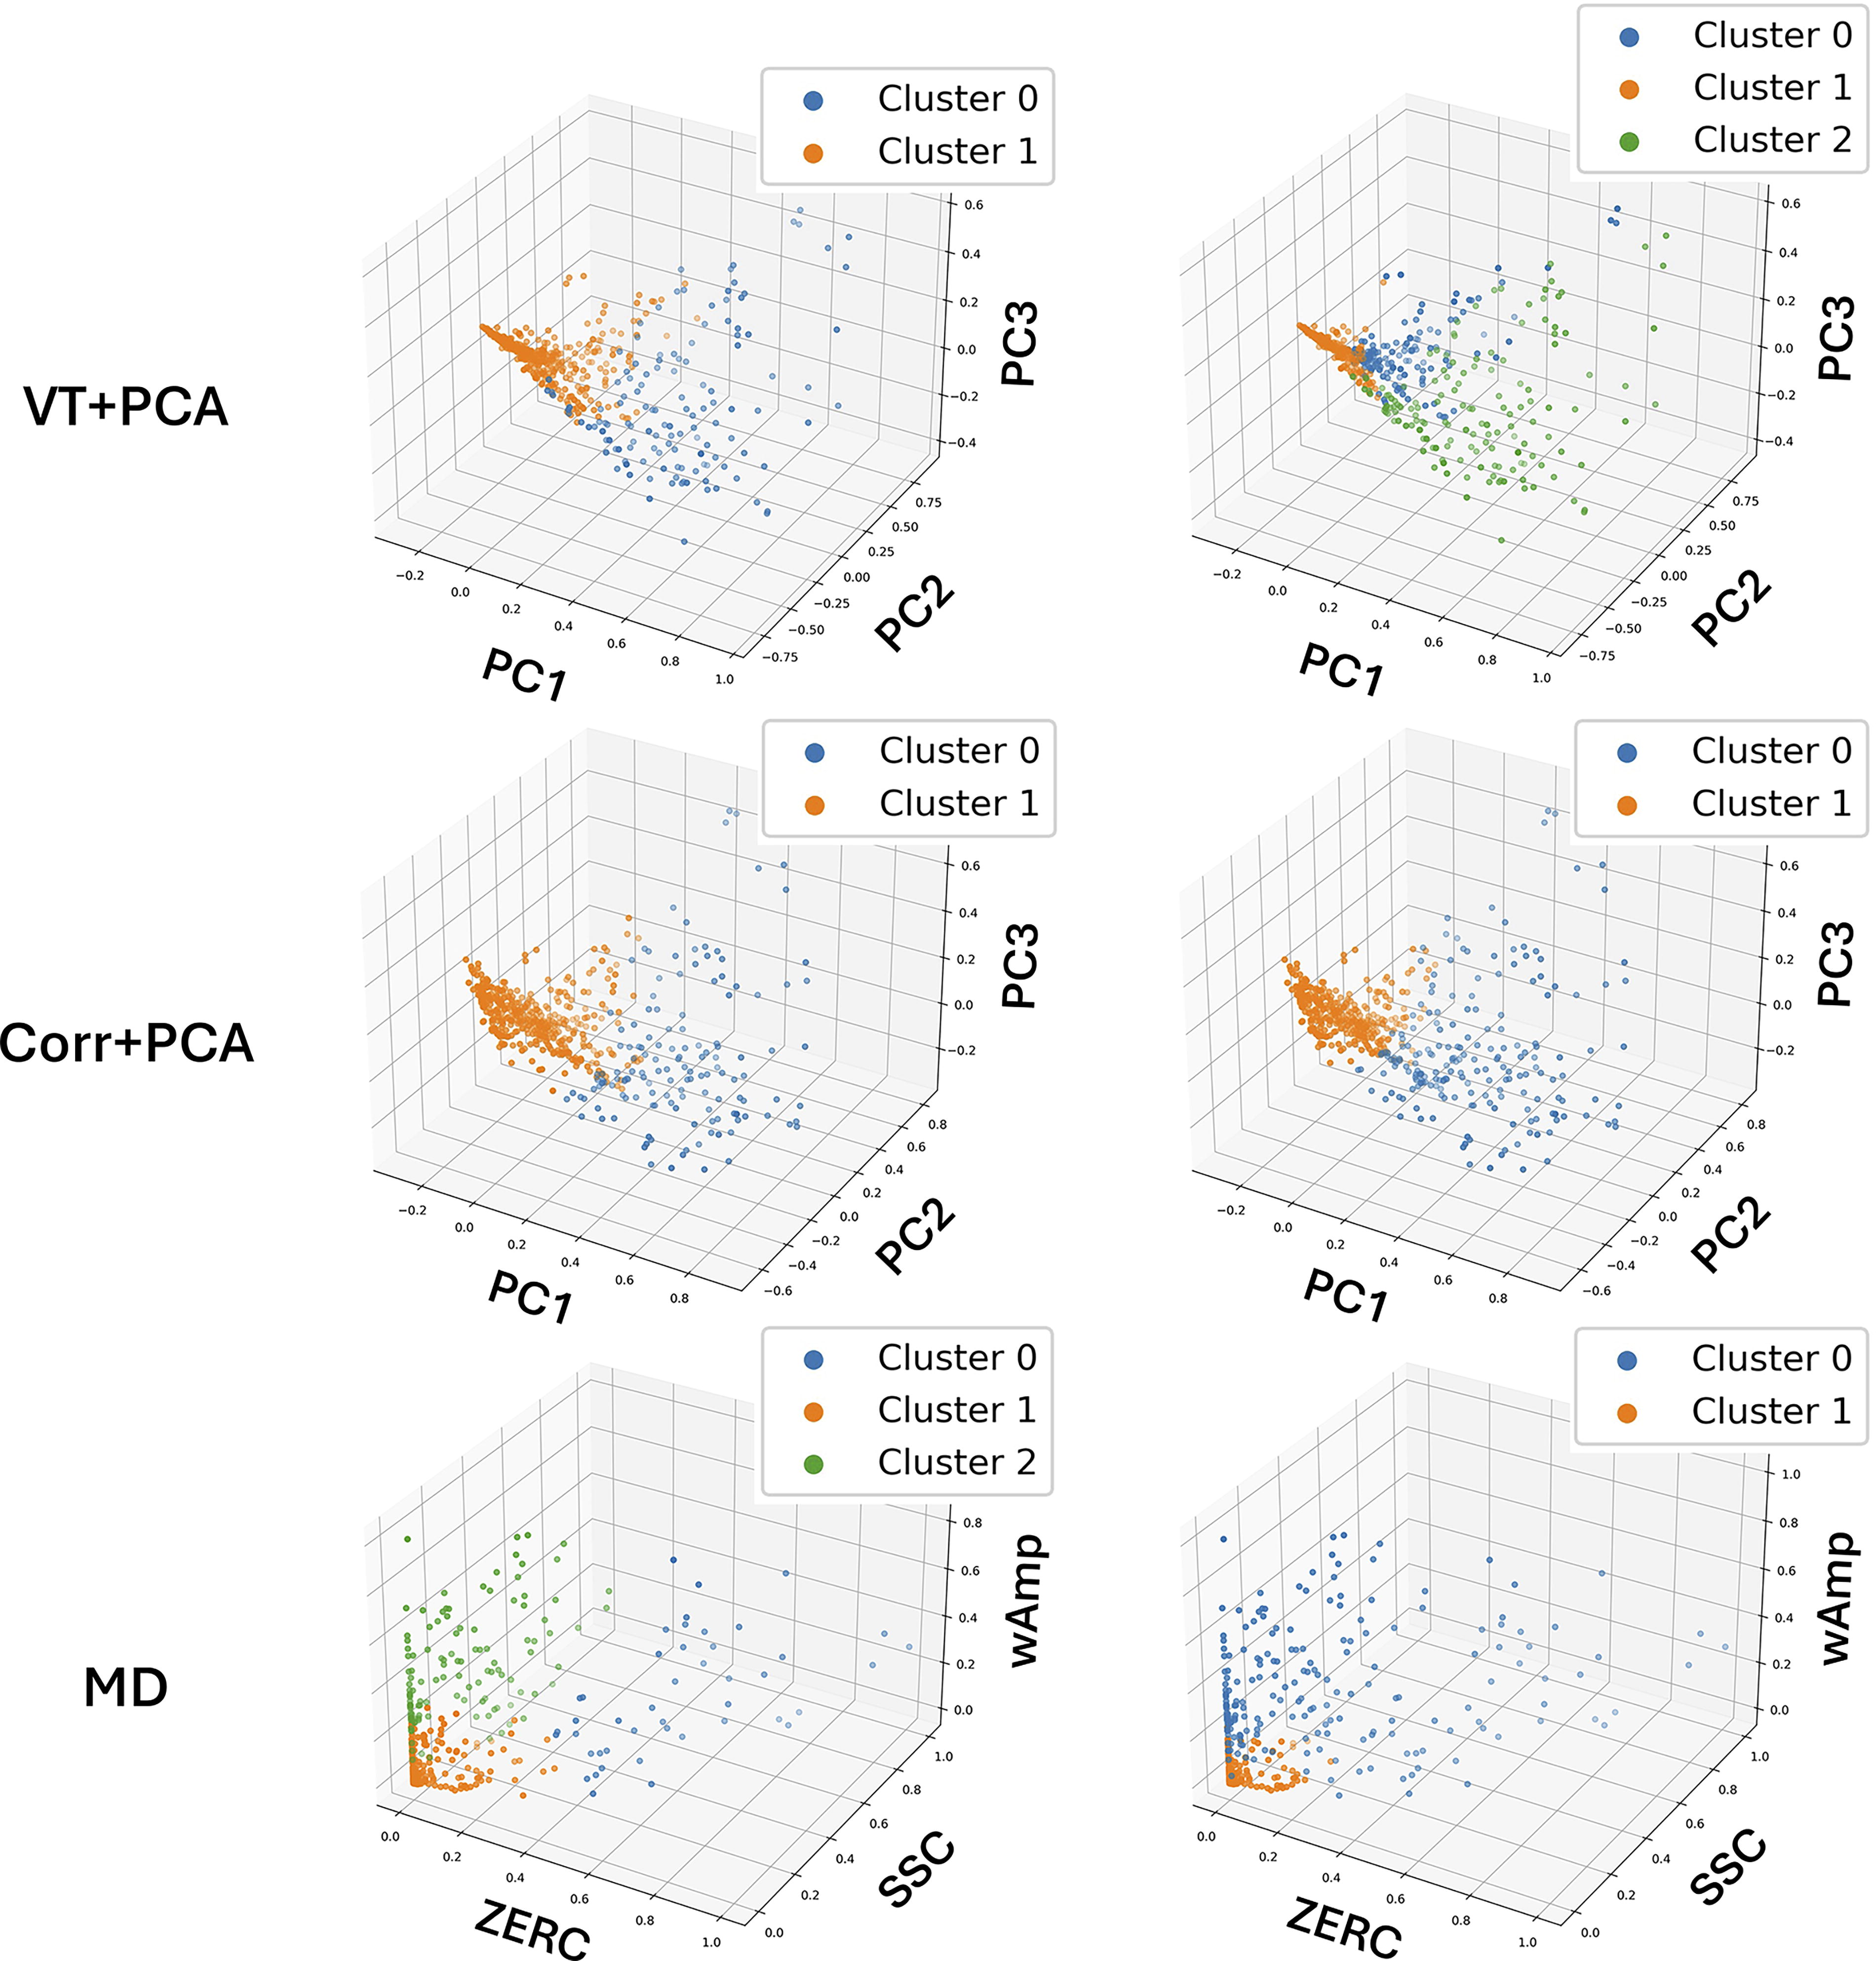
K-means (left) and k-medoids (right) clustering results visualized on the first three PCs for VT+PCA (top) and Corr+PCA (middle) and on three features in MD (bottom).
Robustness and repeatability assessment
Bootstrap resampling with random replacement assessed the robustness of the clustering algorithms with their optimal parameters (highest Silhouette score). DBSCAN exhibited great variability in cluster numbers (2–5) across repetitions, suggesting low robustness and leading to inconsistent centroid matching. Thus, DBSCAN results were excluded from further analysis.
For other algorithms, 175–181 unique muscle groups (out of 184) were sampled per repetition. Low variability (0.05 ± 0.07) of the matched centroids across repetitions indicated strong repeatability. Within each resampling set, we identified mutual samples (muscle groups). The percentage of samples with unstable cluster labels across repetitions is reported in Supplementary Table S2. Supplementary Figure S1 summarizes pairwise ARI, AMI, and Jaccard index within each resampling set.
Overall, ARI, AMI, and Jaccard index results are consistent for k-means and k-medoids. The positive ARI values indicate higher-than-chance similarities between each pair of repetitions in a resampling set. Positive AMI results also suggest high pairwise similarity. Although k-means produced lower Silhouette scores than k-medoids (Fig. 2), it demonstrated greater consistency, as reflected in the low percentage of muscle groups with unstable cluster assignment (Supplementary Table S2).
Clustering results relating to clinical information
Figure 4 summarizes the p-values from the univariate statistical analysis of clinical variables against clusters identified by k-means and k-medoids on feature sets VT+PCA, Corr+PCA, and MD. Asterisks (*) indicate the feature sets where three clusters were identified (k-means on feature set MD and k-medoids on feature set VT+PCA); the others identified two clusters. Post hoc analysis identified significant differences between cluster pairs (results not shown here). Supplementary Table S3 (Supplementary Data) provides the full summary of the univariate statistical analysis results between individual clinical variables and identified clusters from each feature set and clustering algorithm combination.
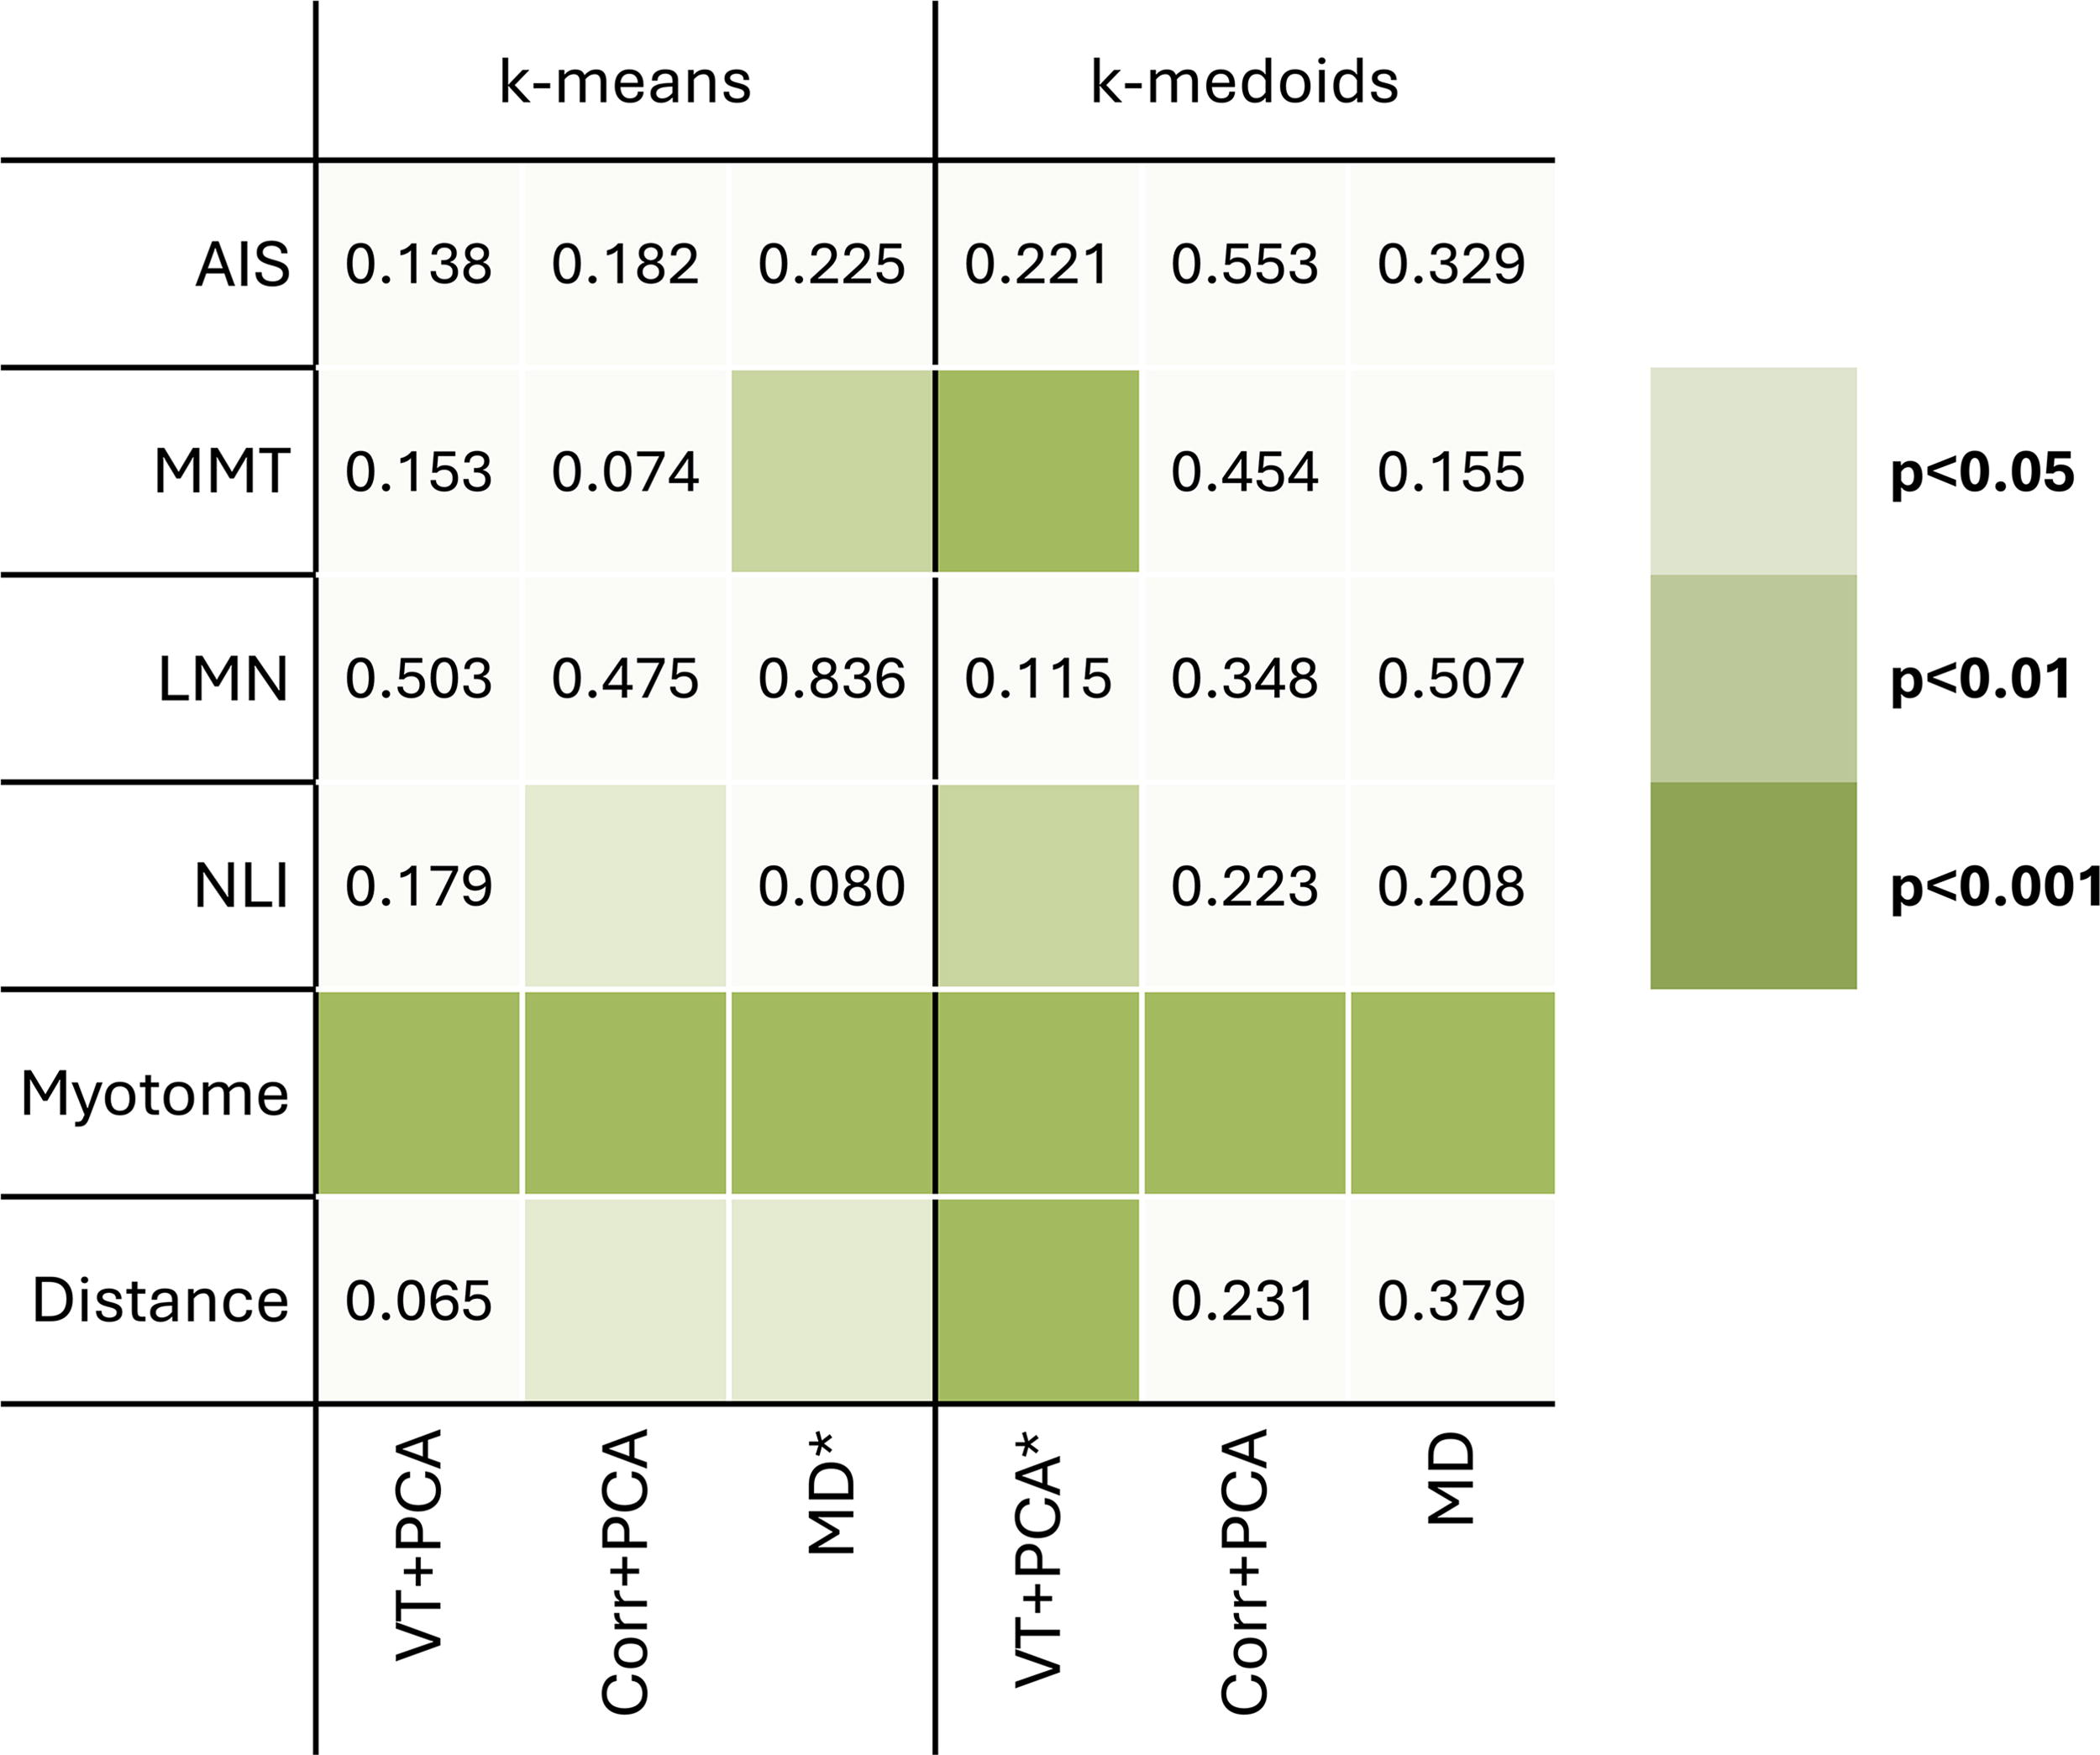
p-Values from univariate statistical analysis (alpha = 0.05) for each clinical variable between identified clusters from k-means and k-medoids on feature sets VT+PCA, Corr+PCA, and MD. Asterisk (*) marks the clustering results with three clusters (Fig. 2B). Darker green indicates smaller p-values.
Figure 5 illustrates the clinical data distribution for the three clusters identified by k-medoids on VT+PCA. In this example, AIS grade and LMN injury status showed no statistical differences among clusters. However, MMT scores were statistically significantly different between clusters 0 and 1. NLI and distance to the injury level were significantly different between clusters 0 and 2 and between clusters 0 and 1. Myotome was different for all cluster pairs. Note that the number of muscle groups analyzed varied by clinical variable (Table 1), limited by their availability.
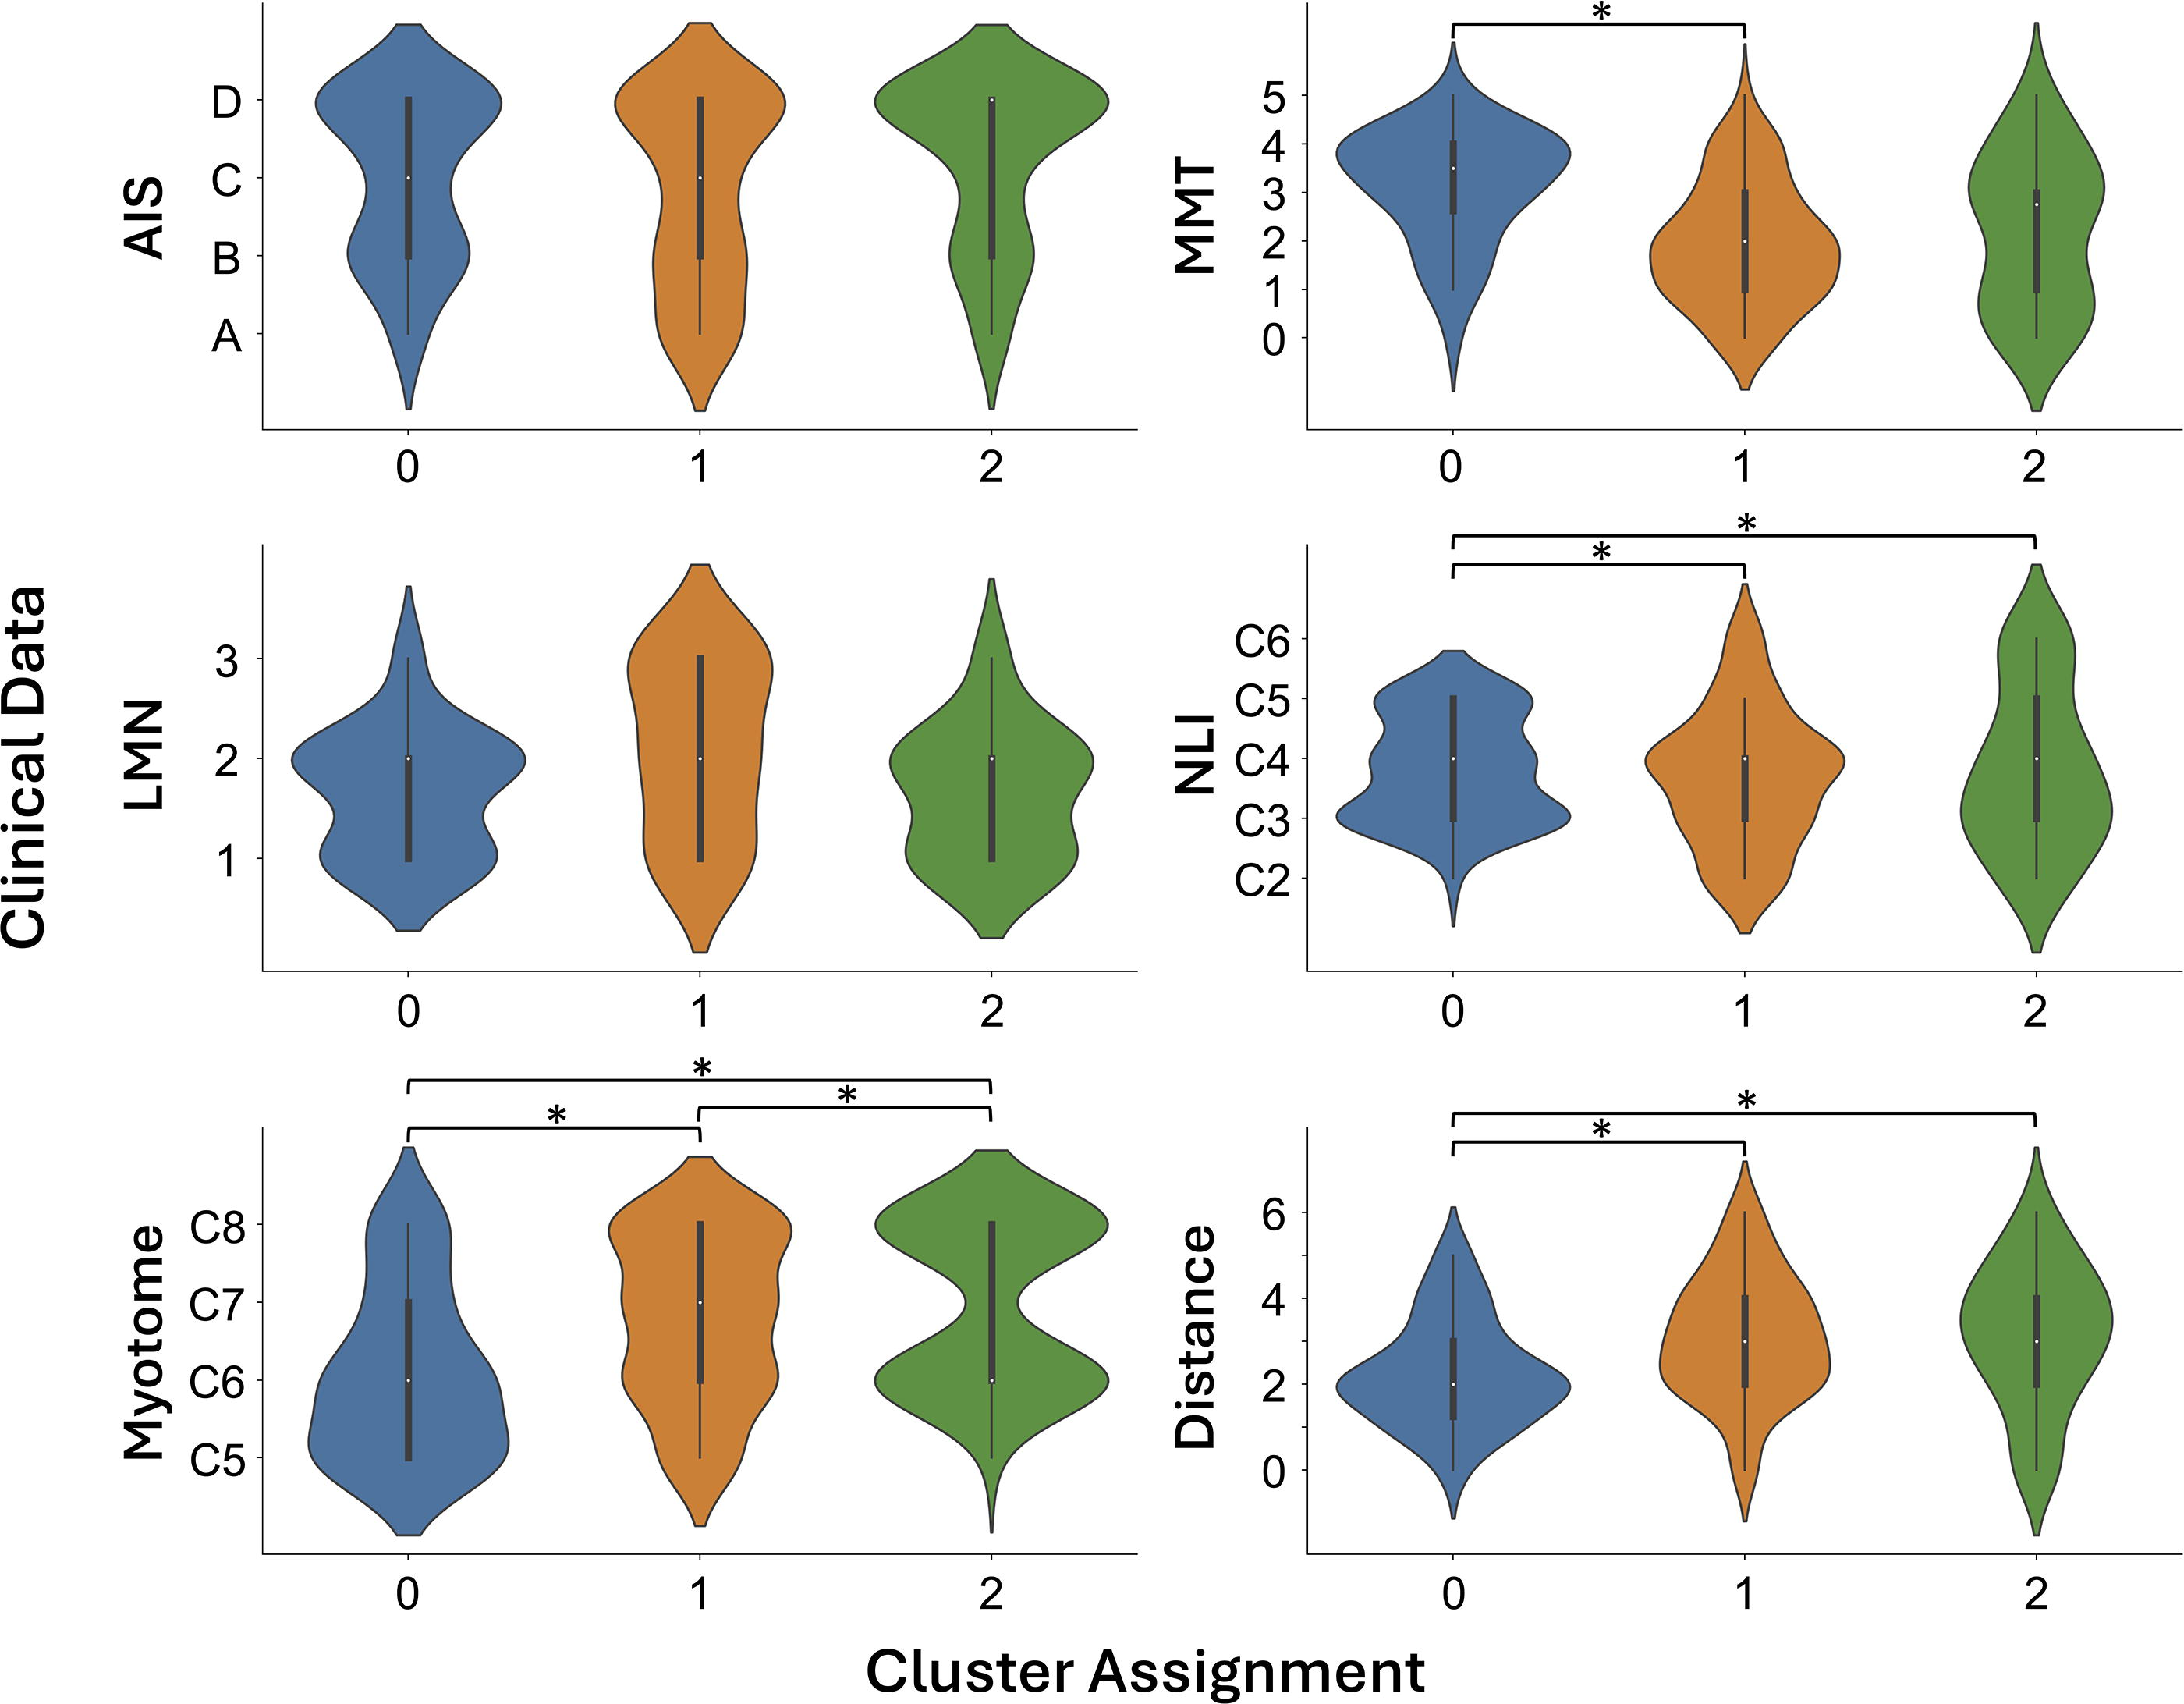
Clinical data distribution for the three identified clusters from feature set VT+PCA using k-medoids. Bar and asterisk (*) denote statistical significance from the chi-squared test (AIS, MMT, LMN, NLI, and myotome) and Kruskal–Wallis test (distance) with post hoc Bonferroni correction (when necessary). AIS, American Spinal Injury Association Impairment Scale; distance, distance to the injury level; LMN, LMN status (1 = inconclusive, 2 = damaged LMN, 3 = no activation, see Table 2); MMT, manual muscle testing; NLI, neurological level of injury.
From the same VT+PCA clusters, we identified the center (medoids) of each cluster and plotted the corresponding sEMG signals in Figure 6, along with participant ID, muscle group, and clinical information. The red bar denotes the steady-state segment (3 s) from which sEMG features were extracted.

sEMG signal of muscle groups from the center (centroid) of each cluster identified from feature set VT+PCA using k-medoids. W06, W20, and W15 are participant IDs. The AIS grade, neurological level of injury of the participants, and MMT score of the muscle groups are labeled. The red bar denotes the steady-state segment (3 s) for sEMG feature extraction. FDS, flexor digitorum superficialis; L, left; R, right.
Before performing multivariate analysis to examine the collective effects of the clinical variables, Cramér’s V correlation was used to evaluate the relationship between the clinical variables. No strong correlation between the clinical variables is observed from the results (Supplementary Fig. S2).
Logistic regression (binomial for two clusters, multinomial for three) was applied to predict cluster assignments (Fig. 3) from clinical variables. Significant predictors from Step I and R2 of the final models from Step II are shown in Table 4. For k-medoids on VT+PCA, myotome, NLI, and distance were significant predictors individually, but collinearity (distance = myotome − NLI) required excluding distance from the final model. R2 for the final models were overall low but above 0.2, indicating fair fit. 33 Supplementary Table S4 provides one example of the final model result.
Significant Predictors from the Single-Predictor Models in Step I (Alpha = 0.05) and R2 for the Final Models in Step II
Discussion
In this study, we explored whether distinct electrophysiological profiles could be identified from sEMG signals after cervical SCI and assessed their relationship to clinical variables. Using a systematic clustering approach, we identified distinct clusters. The existence of clusters was robust using multiple feature sets and clustering methods, highlighting the existence of underlying structure in the sEMG data. The identified clusters partially align with clinical variables, such as myotome and NLI. These findings suggest that while sEMG clusters reflect meaningful physiological patterns, they also capture nuances not fully accounted for by existing clinical assessments. This highlights sEMG’s potential to enhance and complement traditional methods, particularly in cases where manual assessments are limited.
Robust and repeatable sEMG clusters
Clustering analysis revealed meaningful separations in the sEMG feature space across several feature sets, particularly VT, Corr, and MD (with or without PCA). These curated feature sets consistently produced consistently higher Silhouette scores (above 0.4, Fig. 2) and stable cluster assignments, particularly with k-medoids and k-means. Resampling analysis confirmed the robustness of these clusters, with high agreement metrics (e.g., ARI, AMI, and Jaccard index) across repetitions. In contrast, the initial feature set (Full), showed inconsistent results, emphasizing the importance of feature selection and dimensionality reduction for analyzing complex physiological signals like sEMG.
The clustering performance of different algorithms also varied. The k-medoids algorithm is designed to be less sensitive to noise and outliers compared to k-means, so higher Silhouette scores were expected. But k-means here was more robust when evaluated with resampling (Supplementary Fig. S1, Supplementary Table S2). Hierarchical clustering, while occasionally yielding high Silhouette scores, often produced unbalanced clusters dominated by a single class, limiting its interpretability. Similarly, DBSCAN struggled with parameter sensitivity, producing inconsistent cluster numbers across repetitions. Overall, the results underscore the importance of selecting appropriate algorithms and feature sets to capture the meaningful structure in sEMG data.
The identification of distinct sEMG clusters supports the hypothesis that meaningful structure exists in the sEMG feature space. However, part of the unexplained variance in the cluster assignments might stem from measurement variability. Potential sources include signal noise, variability in electrode placement, and differences in muscle activation and compensation strategies across participants and muscle groups. While the strict data collection procedures and preprocessing steps aimed to minimize these effects, inherent limitations of biosignal data acquisition could still contribute to this variability. Nonetheless, robustness measures, including resampling and agreement metrics, demonstrated the reliability of the identified clusters. The clusters’ partial independence from clinical variables suggests that sEMG captures additional dimensions of neuromuscular function not reflected in standard clinical measures. This finding underscores the potential utility of sEMG in augmenting current assessments, particularly in cases where clinical evaluations have limited sensitivity, such as incomplete SCI. For example, sEMG may provide insights into residual motor control pathways or compensatory mechanisms that are not easily detected through manual assessments.
Clinical relevance of identified clusters
Clinical information does provide insights in interpreting the clustering results. Yet, the nuances captured by the sEMG clusters are not fully captured by available clinical information. Univariate statistical analysis results (Fig. 4, Supplementary Table S3) indicate that between identified clusters, clinical variables, especially myotome, MMT, and distance to the injury level, do differ. Figure 5 provides an example of different clinical data distributions on different identified clusters from VT+PCA feature set using k-medoids. Myotome is statistically different in each pair of the three clusters. MMT, NLI, and distance to the injury level are different for at least one pair in the three clusters. LMN does not show any statistically significant difference in this example and other clustering results (Fig. 4, Supplementary Table S3).
The range of these clinical variables varies from 3 (LMN status) to 6 (MMT and distance to the injury level) and is higher than the number of clusters in some of our results (Fig. 2). This could partially explain the relatively better association (Supplementary Table S3) between the clinical variables and the identified clusters from k-means on Full(+PCA) and MD(+PCA) and from k-medoids on Full(+PCA), VT(+PCA), and Corr, given that these combinations had higher numbers of clusters.
Among the clinical variables, overall weak correlation is observed, with Cramér’s V less than 0.5 for most pairs (Supplementary Fig. S2). This is important in limiting the redundancy of the predictors. We then used binomial and multinomial logistic regression to predict cluster assignment obtained from selected clustering algorithms (k-means and k-medoids) on selected feature sets (VT+PCA, Corr+PCA, and MD). As shown in Table 4, whether the response variable (cluster assignment) has two or three clusters, myotome persistently presents as a significant predictor. The significance of myotome from the logistic regression result is consistent with the results from chi-squared test (Fig. 4, Supplementary Table S3). NLI is among the significant predictors for k-medoids on VT+PCA. Although the chi-squared test suggested significance with k-means on Corr+PCA (Fig. 4), regression analysis did not demonstrate the same. Supplementary Table S4 shows the summary from one model (k-medoids on VT+PCA), highlighting again the significance of NLI and myotome. Related to myotome and NLI, distance is also among the significant predictors for k-means on MD and for k-medoids on VT+PCA. Distance to the injury level can impact the muscle denervation and reinnervation process and impact the compensatory mechanism development, affecting motor control strategies and thereby influencing sEMG signal generation.
In a recent retrospective study using the European Multicenter Study about Spinal Cord Injury (EMSCI) dataset, it was observed that muscle groups at different myotome levels had different probabilities of gaining 3 points or more in the muscle motor score, which is more prominent for muscle groups from participants with more severe injury (AIS A) and when the distance is higher (3 or more below the motor level of injury). 8 This EMSCI study contains a larger dataset than ours, allowing for muscle group stratification; nonetheless, the observed difference in strength recovery indicated by myotome supports the physiological and clinical importance of the finding in our study.
LMN status was not a significant predictor in these models, as shown in Figure 4, which is consistent with the chi-squared test results in (Fig. 4, Supplementary Table S3). One possibility for the negative result is that the underlying neurophysiological structure of the identified clusters is not related to LMN status. Given that both sEMG and iEMG signals contain valuable information on the integrity of the corticospinal tract after SCI23,34,35 and the limited clinical data availability (only 47 muscle groups with iEMG data and information on LMN status), a higher number of samples would provide more conclusive results.
Figure 6 shows the sEMG signals from the centers (medoids) of these three clusters, from participant W06 (AIS D, C3, MMT = 4), W20 (AIS D, C4, MMT = 2), and W15 (AIS D, C2, MMT = 5), respectively. Muscle groups at the centers of these clusters are all from participants with AIS D. This is not surprising because, as shown in the distribution of the AIS grade in Figure 5, for all three clusters, the AIS grade peaks at AIS D and does not present statistical significance from the chi-squared test. NLI and MMT for these center muscle groups are also at the peaks in their distributions in Figure 5. LMN status was only assessed for the biceps muscle from W06 (center of Cluster 0), which is “Inconclusive” (Table 2). Qualitatively, the sEMG signal at the center of Cluster 0, Center 0, has higher amplitude and a more consistent interference pattern compared to the other two sEMG signal segments, especially at the steady state (marked by the red bars). The sEMG signal at Center 1 (middle panel) has fewer LMN firings (also at a lower amplitude) compared to Center 0 and Center 2. The differences in these three sEMG signal segments underscore the separation of sEMG feature space (VT+PCA in this case).
Currently available clinical information is related to but cannot fully describe this separation, highlighting the untapped potential of utilizing sEMG data more fully in clinical practice. The weak correlation may partly reflect the contribution of measurement variability, both in sEMG feature space (as discussed above) and in clinical assessments. For example, clinical evaluations such as MMT and LMN status involve subjective elements and inter-rater variability, which could affect their alignment with the underlying physiological patterns captured by sEMG. Further analysis such as test-retest reliability could help quantify the extent to which measurement variability contributes to the observed results. Nonetheless, as a first step, our results suggest that there is a valuable structure in the sEMG data that can provide insights beyond what is possible with the existing clinical information alone, emphasizing the importance of sEMG in enhancing clinical understanding and decision-making.
Study limitations and future directions
Several limitations should be considered when interpreting these findings. First, the relatively small sample size and predominance of male participants (only two females) limit the generalizability of our results. A larger and more diverse dataset is needed to validate these findings and explore stratification by factors such as demographics or injury severity (AIS), which has been found to be very important in recovery prognostics.8,36 Second, because of the exploratory nature of the analysis, the parameter tuning was guided primarily by Silhouette scores, which can sometimes favor unbalanced cluster assignments (as observed in hierarchical clustering results). We did not perform an exhaustive search during parameter tuning, which might have affected the performance of DBSCAN. Finally, further development of clustering and feature selection techniques could improve the robustness and clinical interpretability of sEMG analysis. Another important consideration is the contribution of measurement error to unexplained variance. Future studies could include dedicated reliability assessments such as test-retest consistency. Despite these limitations, the findings provide a strong foundation for future research exploring the clinical utility of sEMG in SCI assessment and rehabilitation. While the present study demonstrates that the information content of sEMG signals is complementary to existing clinical data after cervical SCI, further work is warranted to explore how this information can be leveraged for diagnostic and prognostic applications. Future work with longitudinal data would also enable the exploration of how sEMG profiles evolve over time and relate to other clinical outcomes.
Conclusions
This study demonstrates that distinct electrophysiological profiles exist in sEMG data following cervical SCI. Through a comprehensive clustering analysis of various curated sEMG feature sets, we confirmed the existence of distinct clusters within multiple feature spaces. While these clusters show partial alignment with clinical variables, they also capture unique dimensions of muscle activity that are not fully explained by conventional assessments. These findings suggest that sEMG has the potential to complement conventional assessments for enhanced clinical understanding and decision-making, particularly in detecting residual motor function. Continued research is needed to expand on these results and to realize the full potential of sEMG as a clinical tool.
Footnotes
Acknowledgments
The authors thank MyndTec Inc. and their sponsored clinical trial “Restoration of Reaching and Grasping Function in Individuals With Spinal Cord Injury Using MyndMove® Neuromodulation Therapy” (USAMRAA CDMRP-SCRIP—Protocol SC150251, Clinicaltrials.gov: NCT 03439319) for access to individuals receiving FES therapy. The authors thank specialized therapists Alexandra Chen, Dr. Parvin Eftekhar, Dr. Cindy Gauthier, Cynthia Ho, and Wenky Ma, and Dr. Mohammad Alavinia, biostatistician at KITE Rehabilitation Institute, University Health Network, for their tremendous support to the project. Special thanks to all participants in this study.
Authors’ Contributions
G.L.: Investigation, data curation, formal analysis, methodology, software, validation, visualization, writing—original draft, and writing—review and editing. G.B.: Investigation, data curation, writing—review and editing. J.C.F.: Investigation, data curation, funding acquisition, and writing—review and editing. S.K.-R.: Investigation, data curation, funding acquisition, resources, and writing—review and editing. J.Z.: Conceptualization, funding acquisition, methodology, project administration, resources, supervision, writing—original draft, and writing—review and editing. All authors reviewed and approved the final article.
Author Disclosure Statement
No competing financial interests exist.
Funding Information
This work was supported by the Wings for Life Spinal Cord Research Foundation (Project #210).

References
Supplementary Material
Please find the following supplemental material available below.
For Open Access articles published under a Creative Commons License, all supplemental material carries the same license as the article it is associated with.
For non-Open Access articles published, all supplemental material carries a non-exclusive license, and permission requests for re-use of supplemental material or any part of supplemental material shall be sent directly to the copyright owner as specified in the copyright notice associated with the article.
