




Abstract
Background:
Glypican-3 (GPC3), a cell surface glycoprotein, regulates cell growth and exhibits increased expression in hepatocellular carcinoma (HCC) and squamous non-small cell lung cancer (SQ-NSCLC). This study developed an artificial intelligence (AI) algorithm for predicting GPC3 expression to accelerate clinical trial enrollment, comparing it with manual immunohistochemistry (IHC) scoring.
Methods:
Using 167 NSCLC and 133 HCC formalin-fixed paraffin-embedded tumor blocks, GPC3 expression was quantified via IHC assays. Machine learning (ML) models were trained on digitized NSCLC whole slide images to identify GPC3-positive tumor areas, applying data-driven cutoffs for classification. Association between GPC3 and programmed cell death-ligand 1 (PD-L1) IHC expression in NSCLC sample was explored.
Results:
GPC3 expression peaked in HCC (63.9%), followed by SQ-NSCLC (52.6%) and adeno-NSCLC (lung adenocarcinoma) (10.0%). No significant correlation was found between GPC3 and PD-L1 expression in SQ-NSCLC. AI-based screening surpassed clinical pathologists by 10% in precision, achieving 100% recall at a 1% cutoff. ML model quantification aligned well with pathologist consensus. Profiling GPC3 expression emphasized its prevalence in HCC and SQ-NSCLC.
Conclusion:
Our AI platform standardizes, scales, and reproducibly characterizes GPC3 in NSCLC, supporting patient selection in clinical studies.
Introduction
Glypican-3 (GPC3) is a crucial heparan sulfate glycoprotein anchored to the cellular membrane via a glycosylphosphatidylinositol anchor. 1 GPC3 not only engages with extracellular matrix components and cells but also interacts with biologically functional macromolecules, including various cell growth factors, influencing receptor signal transduction and regulating cellular processes such as cellular growth, differentiation, adhesion, proliferation, and migration, potentially contributing to malignant tumor development.2–5 GPC3 exhibits high expression levels in hepatocellular carcinoma (HCC) and squamous non-small cell lung cancer (SQ-NSCLC)6–8 but lower levels in melanoma,9–13 ovarian clear-cell carcinomas, yolk sac tumors, neuroblastoma, hepatoblastoma, Wilms’ tumor cells, and various tumors. Conversely, GPC3 is downregulated in breast cancer, mesothelioma, epithelial ovarian cancer, and lung adenocarcinoma (adeno-NSCLC).14–16
GPC3 serves as a potential tumor marker for HCC, with high expression observed in both HCC and other human cancers compared with adult tissue.6,17 Overexpression of GPC3 in patients with HCC, has been linked to worse prognosis, highlighting its significance as a molecular marker for diagnosis and a promising target for tumor-specific therapy. 18 GPC3 plays a role in cell proliferation and/or survival, by interacting with insulin-like growth factor-2 in HCC,19–22 which influences cell growth, differentiation, and migration.23–26
Notably, studies on GPC3 in lung cancer are limited and inconclusive. GPC3 was observed to be upregulated in SQ-NSCLC (with a GPC3-positive (GPC3+ve) rate of 55%) but not in adeno-NSCLC (with a GPC3+ve) of 8%), a phenomenon that could potentially be attributed to smoking. 8 Significant association between GPC3 expression and pathological N, pathological T, gender, and tumor stage in adeno-NSCLC samples were observed. SAR444200, a novel Nanobody®-based T cell engager simultaneously binds to TCRαβ and GPC3 to co-engage T cells with GPC3-expressing tumor cells, resulting in T cell-dependent cellular cytotoxicity and specific tumor cell killing (Fig. 1). SAR444200 is expected to offer potential benefits in treating solid tumors expressing GPC3, including HCC and NSCLC.
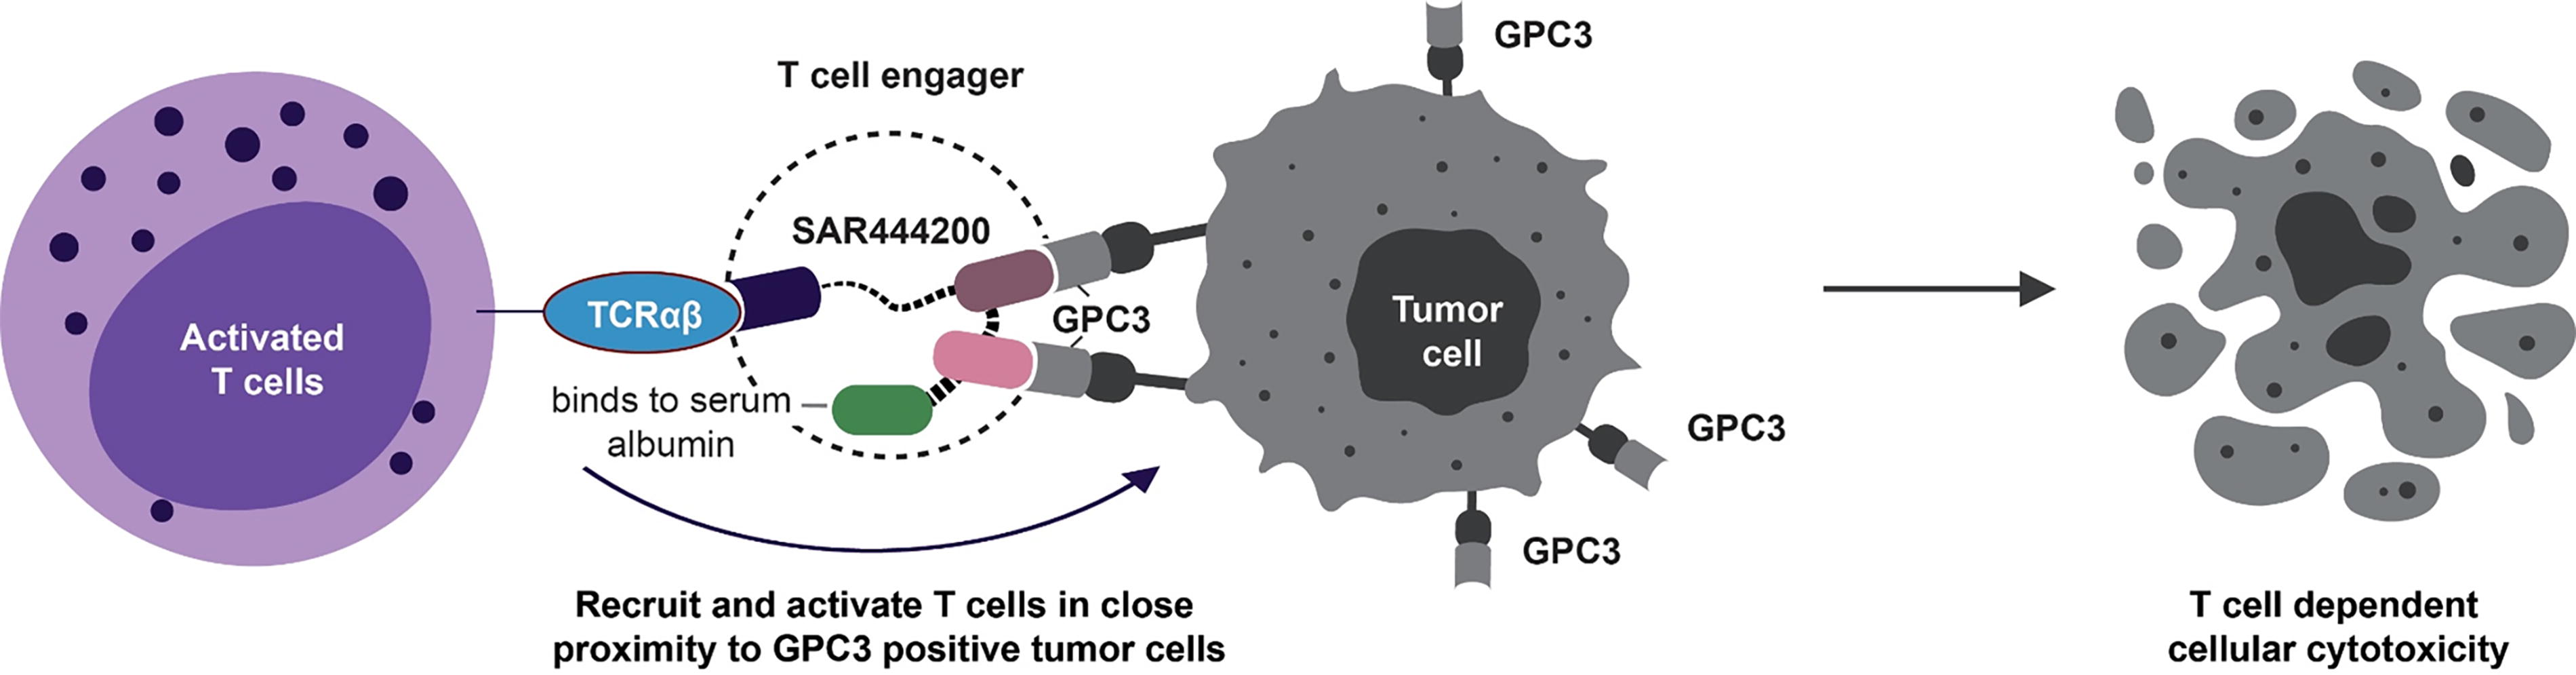
Mechanism of action of SAR444200. GPC3, glypican-3; TCRαβ, T cell receptor alpha beta.
As a biomarker in diverse tumor types, the conventional immunohistochemistry (IHC) approach for GPC3 protein level quantification involves manual assessment of GPC3+ve tumor cells. This process includes detecting GPC3 protein expression in formalin-fixed, paraffin-embedded (FFPE) human solid tumors. The IHC staining score criteria are consistent with those used in clinical trials. Tumor cell membrane staining is scored based on intensity (0–3), with GPC3 positivity defined by a histochemical score (H score) of ≥1. However, the application of digital pathology, involving computational analysis of digitized images of histological specimens, may offer valuable insights. Notably, computational models have demonstrated efficacy comparable to manual assessment in the analysis of biomarkers. 27 Convolutional neural networks (CNNs) represent a category of machine learning (ML) techniques designed for image analysis. They presently exhibit cutting-edge efficacy across diverse image classification endeavors. Within the computational pathology domain, the CNN-based image analysis has demonstrated comparable performance to pathologists in a range of tasks, including the assessment of programmed cell death-ligand 1 (PD-L1) via IHC and the classification of tumors and grades based on hematoxylin and eosin (H&E) staining.28,29 Recent approval by the Food and Drug Administration (FDA) further highlights that the role of these models could ensure quality and provide decision-making support in clinical practice for tumor detection.28–32
Assessing patients’ GPC3 expression levels from their IHC results relies on the analysis by individual pathologists, leading to discrepancies between pathologists (inter-rater) and variations in analyses from the same pathologist at different times (intra-rater), which are prevalent with these datasets.33,34 Research has demonstrated that ML has the capacity to unveil insights within H&E images that may elude human observation, presenting untapped potential within the field of pathology.35,36 Recently, unprecedented ability of ML to predict molecular biomarker expression in breast cancer from H&E tissue microarray images was demonstrated, surpassing the limitations of human interpretation and reproducibility. 37 Findings also revealed that estrogen receptor status could be accurately predicted, rivaling the quantification achieved by inter-pathologist assessment using IHC. 37 However, achieving such performance would require a large number of slides, which may not be available during the early stage of clinical development for therapies targeting novel drug targets like GPC3 or limited by clinical feasibility and small biopsies. To enhance the artificial intelligence (AI) model’s performance with limited data, we employed a novel same-tissue restaining technology which enables more accurate cell-level registration of H&E images and corresponding IHC images compared with the traditional approach which often results in different tissues being stained in H&E images and IHC images, respectively. Accurate cell-level registration allows for precise ground truth GPC3 expression annotations on the H&E images without assuming similar expression levels across consecutive tissue cuts, which may not hold for all samples.
This study aimed to create an AI-based model to forecast GPC3 expression characteristics across various tumor types based on H&E images. We established a qualitative metric for GPC3 expression and incorporated it into our algorithmic model for image processing, employing an automated AI-driven approach to mitigate inter-rater and intra-rater variability in GPC3 expression classification. This approach can potentially be used as a clinical trial prescreening tool to identify patients who are likely to have target GPC3 expression level based on the AI predictions and thus significantly speed up clinical trial recruitment.
Materials and Methods
Materials
A total of 167 NSCLC (97 SQ-NSCLC, 70 adeno-NSCLC) and 133 HCC FFPE samples of patient tumor blocks were purchased from BioIVT (Detroit, MI, USA) who obtained informed consent for collection and research use from each donor and approvals from the respective Institutional Review Board (IRB) of the participating institutions.
Sectioning and staining of FFPE blocks for GPC3 IHC and PD-L1 IHC analysis were performed by WuXi AppTec (Shanghai, China). An additional set of 5-mm sections was collected as FFPE curls for ribonucleic acid (RNA) isolation and RNAseq analysis. The HCC, adeno-NSCLC, and SQ-NSCLC tumor samples from patient-derived xenograft (PDx) models were provided by WuXi AppTec. H&E images were screened from 14 NSCLC patients in this first-in-human, open-label, dose-escalation, dose-expansion study of SAR444200 as a single agent or in combination with atezolizumab (NCT05450562).
Same-sample re-staining and digital pathology
The GPC3 IHC and PD-L1 IHC assays were performed by WuXi AppTec for GPC3+ve (GC33, Ventana) and PD-L1+ (22C3, Dako) on the procured tumor slides and then scanned at 20× using the Aperio Versa8 scanner for the image analysis. The pathologists read and scored all the IHC slides under microscope following clinical standards. GPC3 protein level was quantified by a qualified IHC assay for tumor cell membrane and cytoplasm individually. The PD-L1 staining and scoring was followed using the IHC FDA approved 22C3 pharmDx manual which is a clinical trial-proven companion diagnostic for NSCLC. PD-L1 expression was reported as tumor cell proportion score (TPS), combined positive score (CPS), and immune cell proportion score (IPS/IC) TPS, regardless of staining pattern and intensity. During the annotation process, two pathologists independently annotated all target regions. Subsequently, the Dice coefficient between their annotations was calculated. If the Dice coefficient was ≥0.8, a third, more senior pathologist reviewed and annotated only the discrepant regions. If the Dice coefficient was <0.8, the third pathologist reviewed and annotated the entire whole slide image (WSI). The interpretation was documented in written format.
The simultaneous pathology technique known as dual-dye decolorization and restaining pathology (3DP) was applied to 50 NSCLC samples. An additional slide was prepared for each sample, where H&E staining and whole slide scanning were performed first. Subsequently, the slides were manually decolorized, followed by GPC3 IHC staining on the decolorized tissue slides, and a second whole slide scanning was conducted. Pathologist annotations were utilized to identify the GPC3+ve tumor area in each sample by merging the H&E staining WSI with the GPC3 staining WSI. A digital imaging analysis was developed and applied to quantitatively assess GPC3 protein expression in 50 NSCLC tumor samples (Fig. 2a).
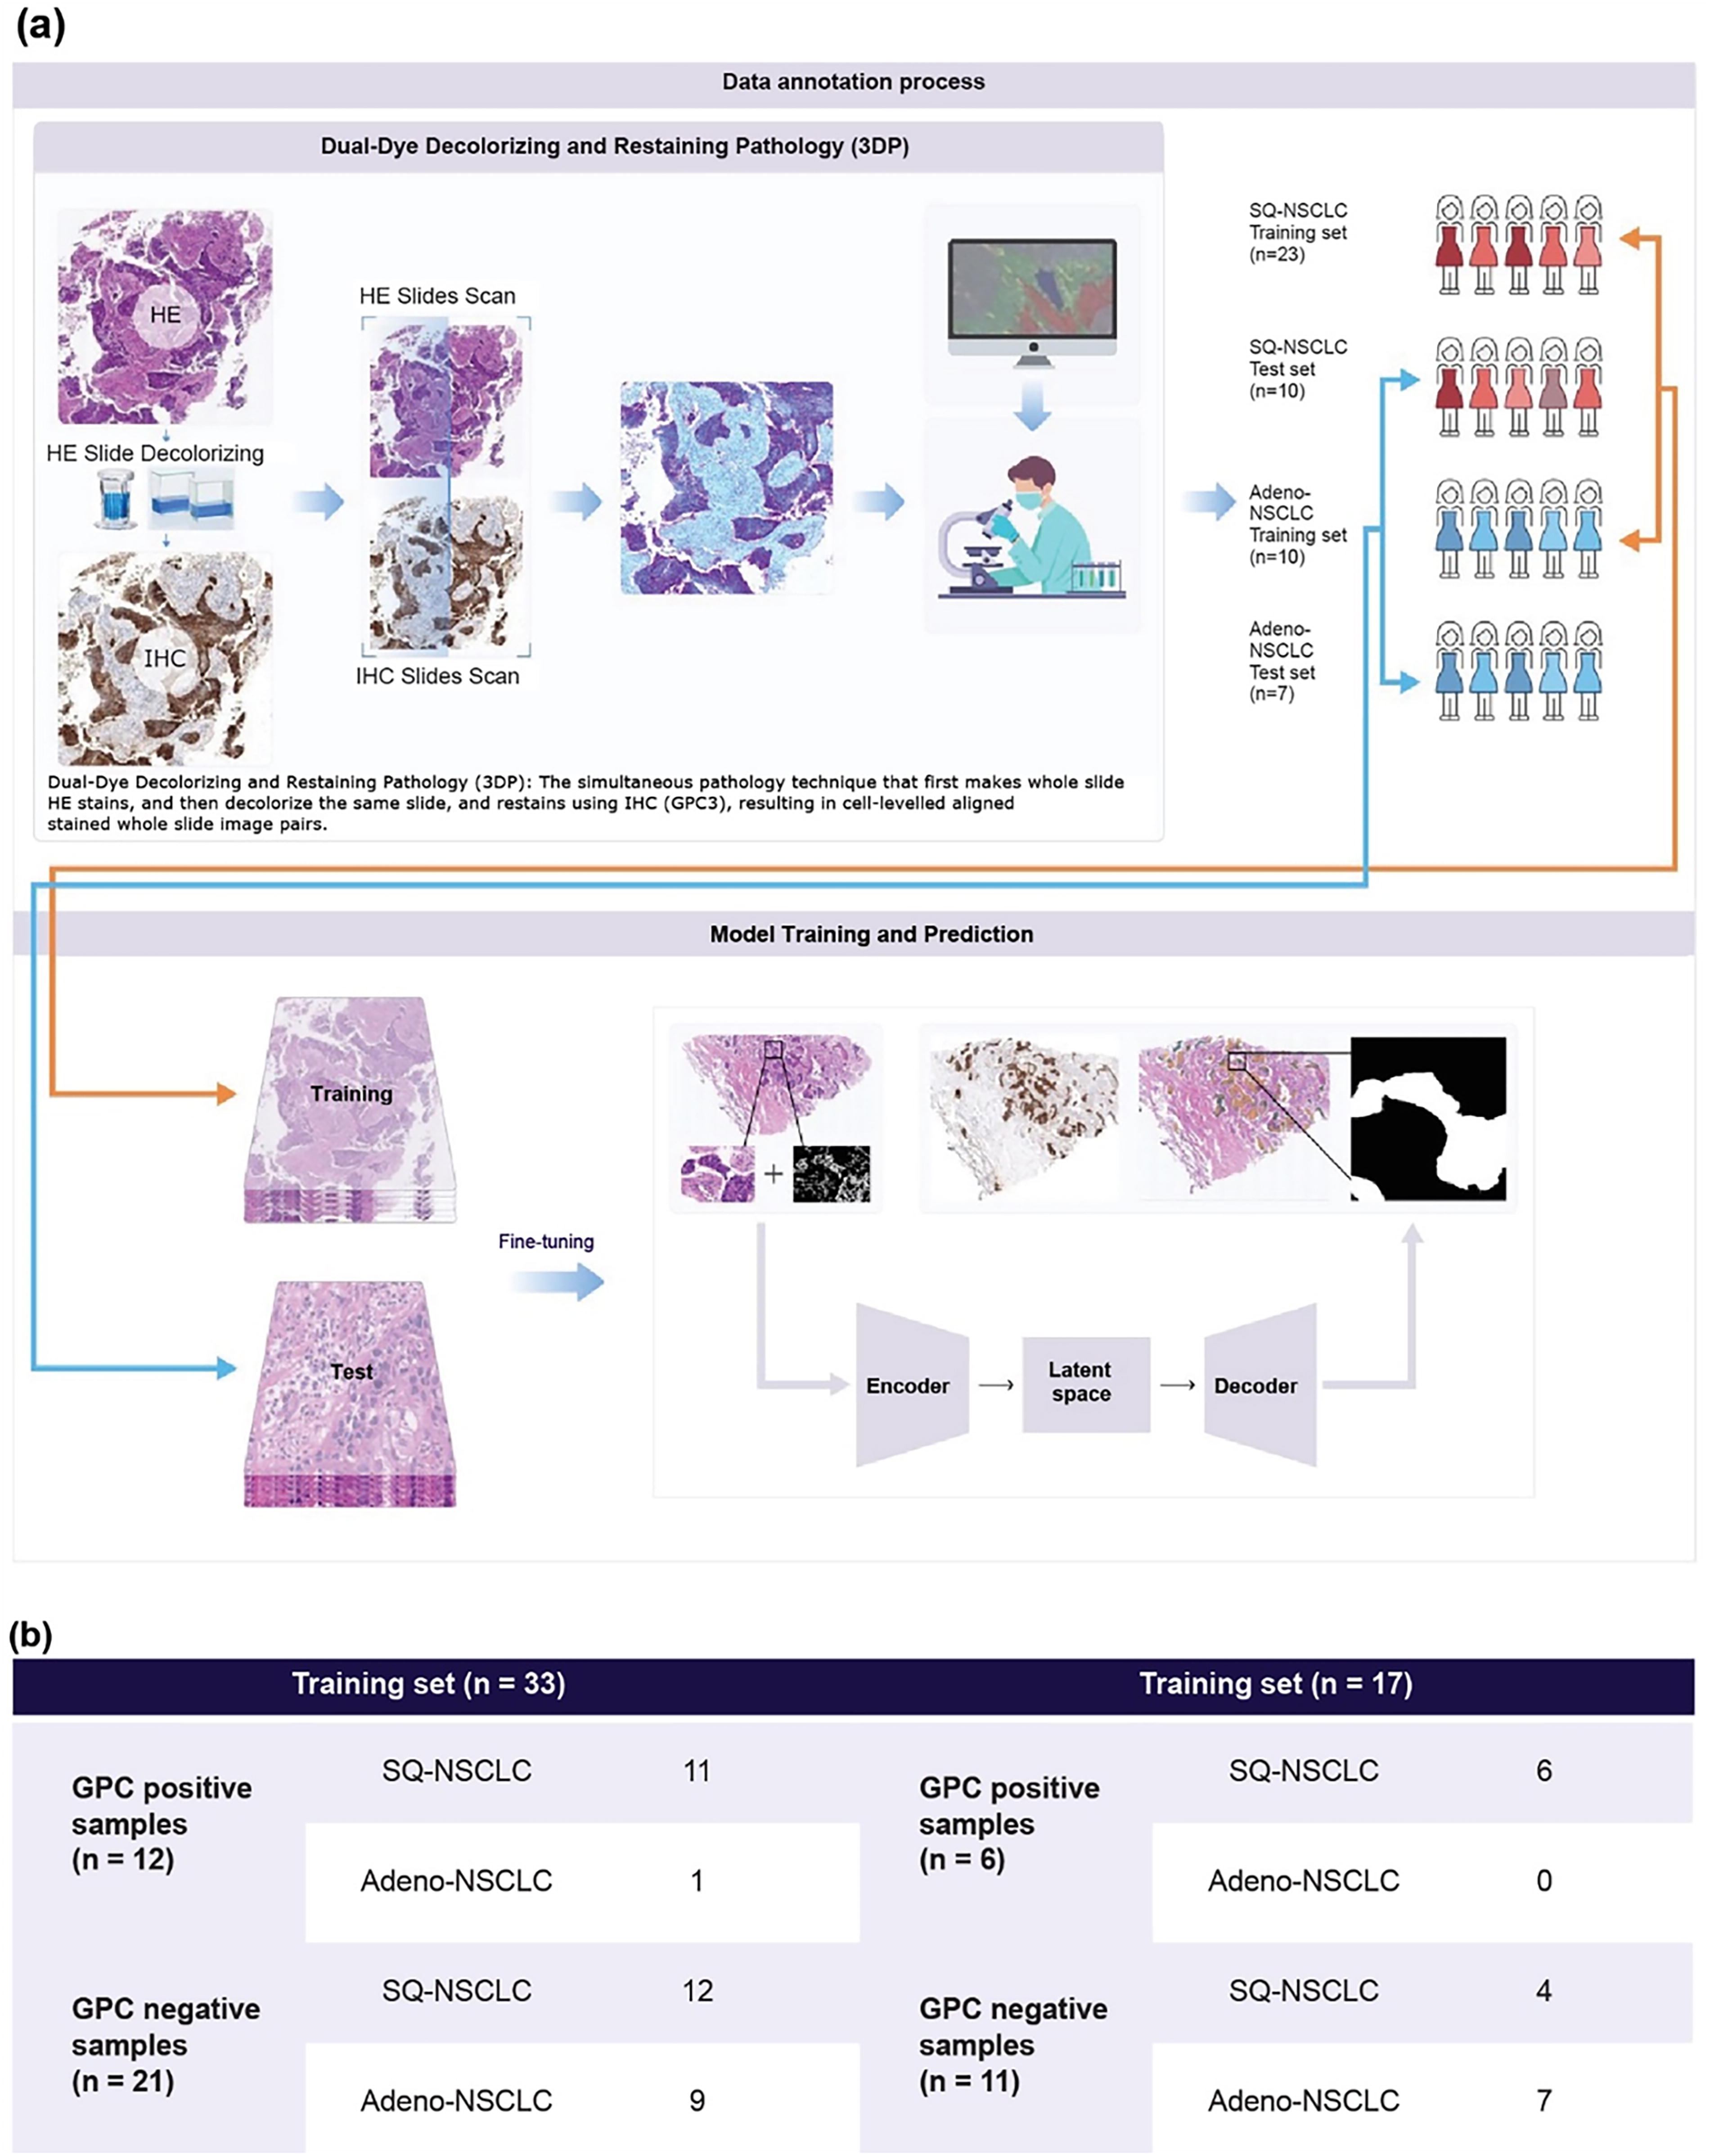
Data annotation workflow and sample partitioning for model training and testing.
RNA sequencing
RNA was isolated from FFPE patient tumor blocks to assess the GPC3 mRNA level. The RNAseq experiments included RNA extraction, target segment enrichment, library construction, quality control, and sequencing. The integrity of the extracted RNA was detected using agarose gel electrophoresis, and the RNA concentration was measured using a NanoDrop spectrophotometer. Messenger RNAs (mRNAs) containing oligoDT were enriched from total RNA using magnetic beads, followed by fragmentation and complementary DNA synthesis using reverse transcriptase. An “A” base was added to the 3′ end, and sequencing adapters were connected. Ligation products purification removed incomplete and empty linker self-ligation products. Polymerase chain reaction (PCR) amplification was carried out using primers complementary to the linker sequence. The sequencing library was purified by magnetic beads, and the final library concentration was quantified using Qubit, with size distribution analyzed using Agilent BioAnalyzer. Sequencing was performed using an Illumina NovaSeq 6000 system following Illumina-provided protocols for 2 × 150 paired-end sequencing.
Model design to predict GPC3 positivity by H&E stained slides
Within the model architecture, a semantic segmentation model, based on CNNs, was designed. The model’s input constituted a four-dimensional tensor (batch size, 512, 512, 4), encompassing RGB three-channel H&E tiles and a one-channel tensor for cellular segmentation results. This setup facilitated simultaneous processing and learning from WSI images and auxiliary cellular morphological data. During the training phase, a set of data augmentation techniques were employed, including scaling, translation, rotation, image flipping, blurring, Gaussian noise addition, and hue, saturation, and value transformation. These techniques broadened the spectrum of training samples, enhancing the model’s proficiency in discerning various patterns within the images. The model’s output was a tensor of dimensions (batch size, 512, 512, 3), with the three dimensions signifying the background, GPC3+ve, and GPC3-negative (GPC3−ve). This configuration enabled the direct extraction of GPC3+ve and GPC3−ve regional distributions from the model’s output.
Development and refinement of the AI digital pathology algorithm
A complete set of GPC3 IHC images from 50 NSCLC (17 ADC and 33 SQC) samples was acquired. These samples were decolorized and then stained with H&E followed by annotation on the H&E-stained slides with reference to the IHC-stained sections. The complete collection of H&E stained WSI images and IHC image-based annotations derived from the 50 tumor specimens were partitioned into a training dataset and an independent test dataset. The training set included 33 samples, representing 66.6% of the total number, whereas the test set comprised 17 samples, accounting for 33.3% of the total specimens. The distribution of data within the training and test datasets is depicted in Figure 2b.
To investigate data annotation quality and potential relationships within the data, a series of tools were developed for WSI annotation analysis and visualization. Due to the extensive size of WSI, there was a potential risk of Graphics Processing Unit (GPU) memory and Random Access Memory (RAM) overflow on the server; thus, the slides were segmented into fixed size tiles (512 × 512 pixels) for analysis and training. Using a pretrained encoder, which was not exposed to 50 slides of task data, we mapped tiles to a high-dimensional space and then projected this space onto a two-dimensional space using t-distributed stochastic neighbor embedding (t-SNE) (Fig. 3).

t-SNE analysis highlighting the necessity of 3DP for GPC3 type differentiation. Pretrained H&E models capture morphological features in clusters (right) but not enough to distinguish GPC3 types (left). Paired IHC samples are required in training for 3DP to learn the subtle features from H&E input. GPC3, glypican-3; t-SNE, t-distributed stochastic neighbor embedding.
For evaluating the model’s effectiveness, the test set was partitioned into tiles of fixed dimensions, with an overlap between different tiles. The partitioned tiles were put into the model to obtain pixel-level predictions for each tile. The segmented results were then assembled to yield a full-slide segmentation prediction. Through pixel-level predictions, the GPC3+ve area and the tumor area (GPC3+ve area + GPC3−ve area) were determined for each test slice, thereby enabling the calculation of the proportion of GPC3+ve within the tumor area. Using this ratio, the test set was classified at the patient level into positive and negative by setting different cutoff values. These classifications were then compared with the ground truth to generate the model’s evaluation metrics.
Model application to clinical sample images
The trained model was further applied to 14 clinical samples from patients with NSCLC, which were excluded from the test set, and the predictions were evaluated to generate confusion matrices and related metrics under different cutoff values. The testing method was identical to the method conducted on the test set.
Ethics statement
The study was conducted in compliance with the Declaration of Helsinki, the International Council for Harmonization Good Clinical Practice guidelines, and other applicable laws, rules, and regulations. The IRB approved the protocol. All participants provided informed consent prior to the initiation of the study.
Statistical analysis
Bar graphs represent the sample percentage among GPC3 membrane IHC expression H score categories, including highlighting the differences of GPC3+ve prevalence among HCC, adeno-NSCLC, and SQ-NSCLC. Boxplots with data points were used to visualize the distribution of GPC3 expression markers at different conditions. The box center and upper/lower lines indicate the median and upper/lower quartile, respectively. Vertical lines above and below the box indicate 1.5 times the interquartile range. The Wilcoxon Mann–Whitney test was performed to compare the GPC3 RNAseq expression (fragments per kilobase million [FPKM]) between GPC3 membrane IHC expression categories. Plots and tests were generated using R software version 4.0.4. (R: a language and environment for statistical computing).
Results
GPC3 epidemiology profiling in HCC and NSCLC
To investigate the GPC3 epidemiology in tumor tissues, serial sections from each tumor tissue were stained with H&E and IHC. The GPC3 protein expression and localization were evaluated using the murine GPC3 antibody in human tumoral tissues (Fig. 4). GPC3 expression was detected in 97 SQ-NSCLC, 70 adeno-NSCLC, and 133 HCC samples exclusively in tumor cells with two staining observed patterns: membrane + cytoplasm and cytoplasm-only. Epidemiological profiling revealed a higher expression of GPC3 protein in HCC (63.9% cases with ≥1 membrane GPC3 H score). Other tumor types presenting lower levels of membranous GPC3 IHC prevalence include NSCLC: 52.6% for SQ-NSCLC and 10.0% for adeno-NSCLC (≥1 membrane GPC3 H score). Further, correlation between GPC3 protein and mRNA expression levels (Fig. 5) revealed a good association between them in both PDx models and human samples for HCC and SQ-NSCLC.

Membrane GPC3 expression levels. The distribution of membrane GPC3 expression levels in patients with HCC, SQ-NSCLC, or adeno-NSCLC. adeno-NSCLC, lung adenocarcinoma; HCC, hepatocellular carcinoma; H score, histochemical score; mGPC3, membranous GPC3; SQ-NSCLC, squamous non-small cell lung cancer.

GPC3 protein and mRNA correlation in PDx and human tumor studies. GPC3 protein distribution and correlation with mRNA level in different tumor types from
Association between GPC3 and PD-L1 IHC expression in NSCLC
To evaluate the association between GPC3 and PD-L1 expression in NSCLC, PD-L1 expression was assessed in 50 tumoral tissues (33 SQ-NSCLC, 17 adeno-NSCLC) using TPS, CPS, and IPS/IC TPS, regardless of staining pattern and intensity of IHC staining. No PDL1 expression was found in adeno-NSCLC; therefore, subsequent analysis was conducted only in SQ-NSCLC. According to PD-L1 expression assessment recommendations, a positive ratio of membrane staining, irrespective of intensity, was evaluated in TPS. Subgroup analyses were performed in three PD-L1 TPS populations (<1%, ≥1%, and ≥50%).38,39
For GPC3 expression, samples were grouped by cell membrane H score (<1, [1,50] and ≥50) or membrane-positive GPC3 cell percentage (<1%, [1%, 50%] and ≥50%). 40 No significant correlation was found between GPC3 and PD-L1 expression in SQ-NSCLC, although a trend of lower PD-L1 expression level was observed in the samples with GPC3 ≥ 50% (Supplementary Fig. S1). A high membrane GPC3 H score (≥50) was observed in seven (21.2%) SQ-NSCLC samples. Among samples with ≥1% expression of PD-L1 TPS, one (5.8%) sample scored a high membrane GPC3 H score. In the PD-L1 TPS ≥50% subgroup, no sample expressed a high GPC3 H score. Regarding positive GPC3 cell percentage subgroups, a similar percentage of samples were distributed across different groups compared with membrane GPC3 H score populations.
AI-based qualification of GPC3 expression in NSCLC
This study aimed to develop a qualitative approach for assessing GPC3 expression using H&E slides. We developed a digital pathology approach to quantify GPC3 expression and predict GPC3 positivity in NSCLC. AI models were developed using digitized WSIs to identify relevant tissue regions (large positive areas, scattered positive points, and purely negative areas) and cell types (GPC3+ve tumor cells, GPC3-ve tumor cells, and other cell types). Human-interpretable features related to GPC3 were extracted, such as the ratio of pixel-level GPC3+ve regions to the tumor region, combined with different cutoff values for patient-level classification.
To evaluate our models’ performance, we compared its predictions with a consensus of annotations from two expert pathologists using Cohen’s kappa statistics. In addition, we calculated average correlation of a single manual pathologist annotator with the consensus. The model predictions demonstrated strong concordance with the consensus, with agreement values comparable to those of the average annotator versus consensus (Table 1).
Performance of the Machine Learning Model in Predicting GPC3 Expression from Hematoxylin and Eosin Image
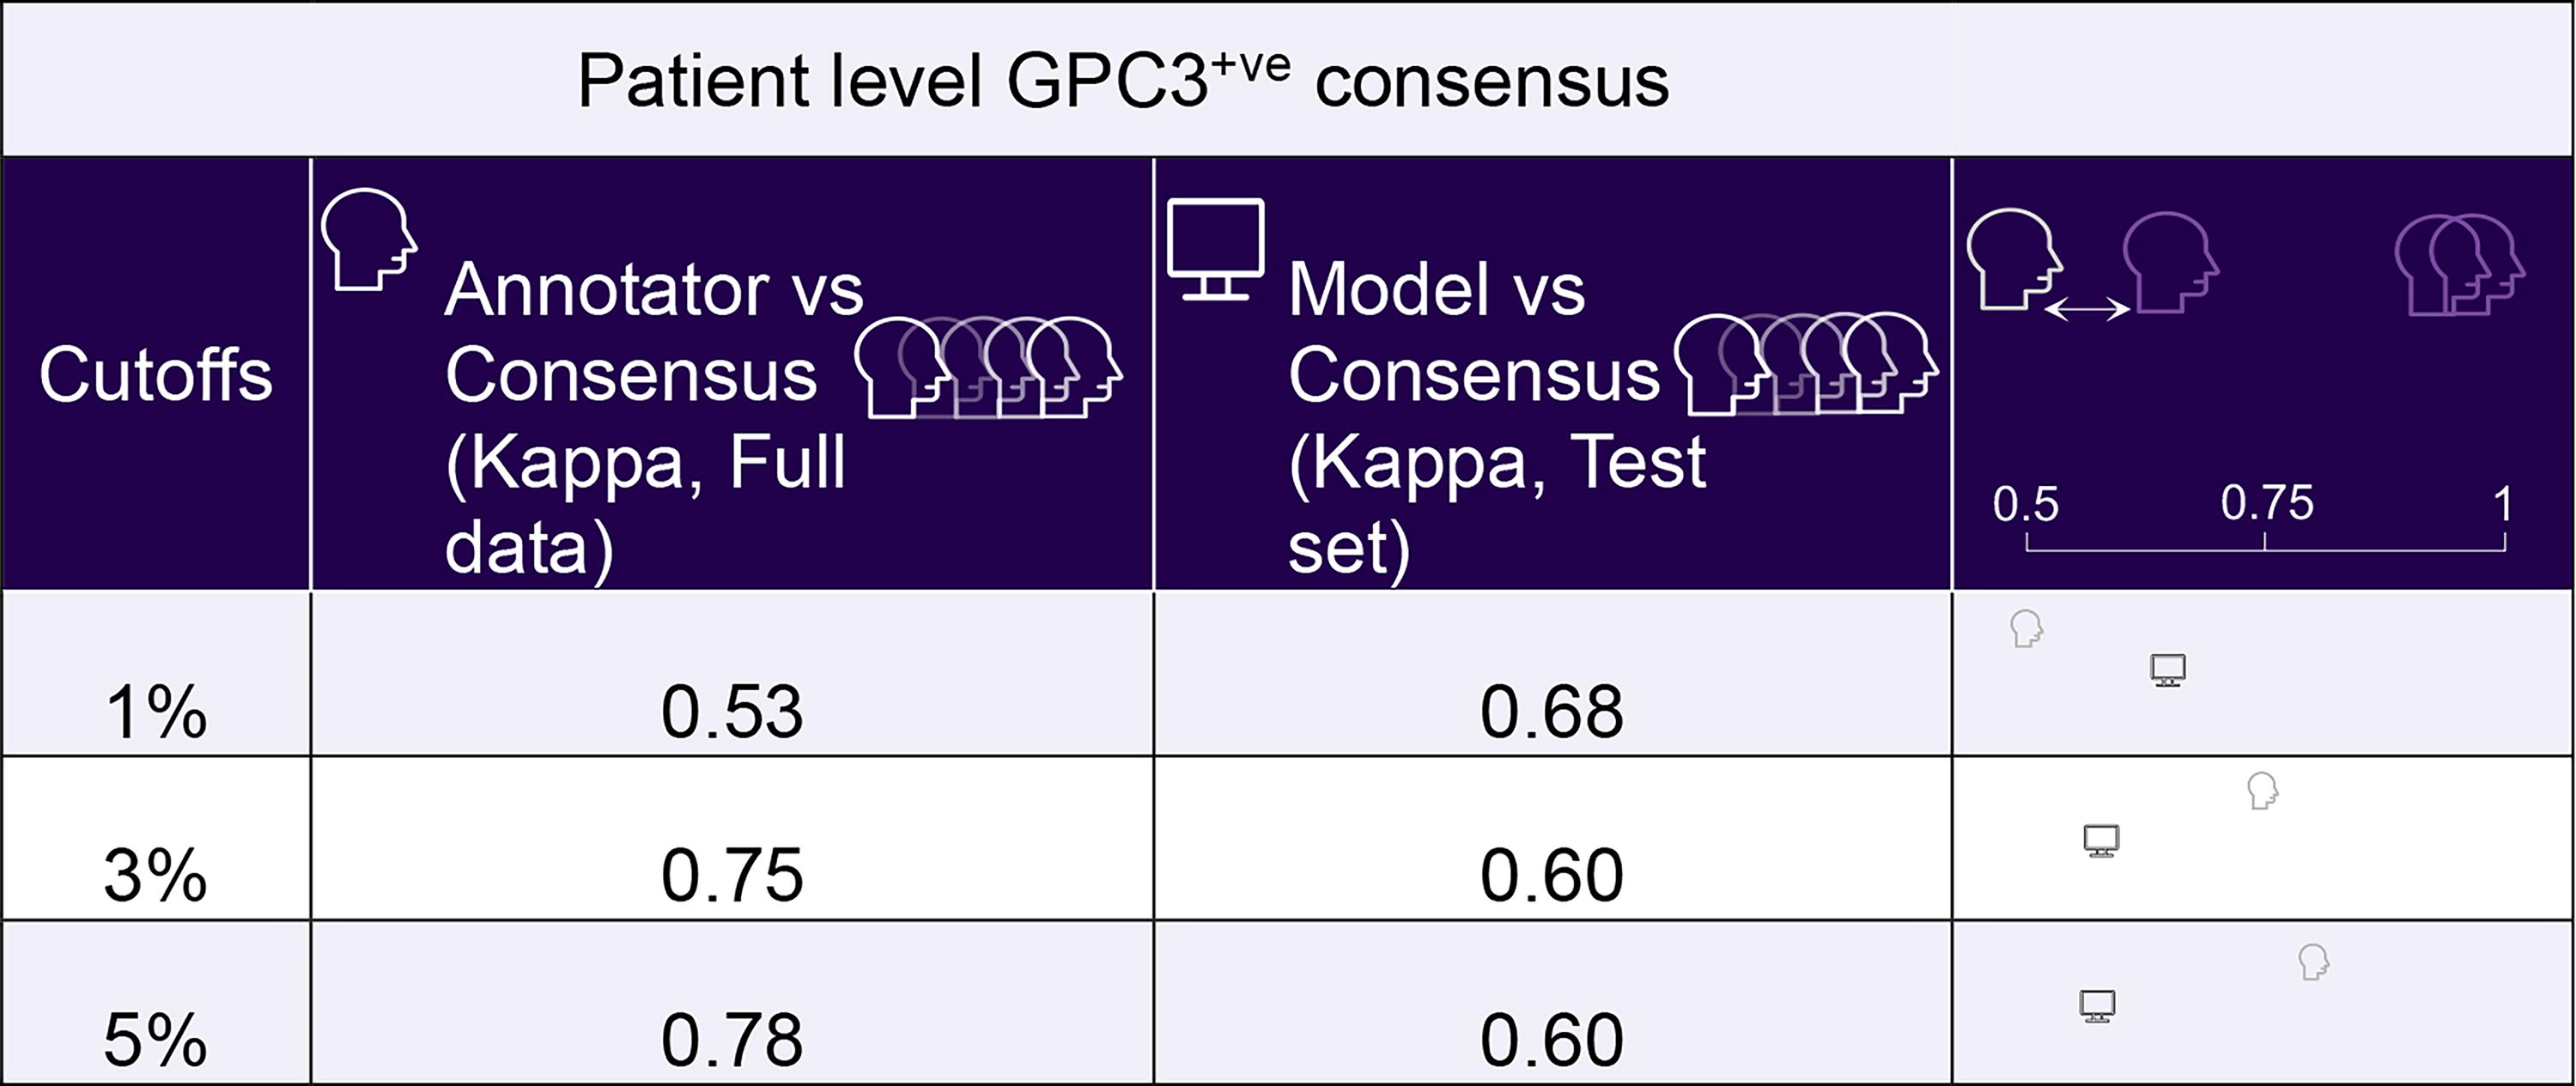
Note: Model predictions were compared with a consensus of annotations from two expert pathologists using the Cohen’s Kappa statistic. The average correlation of a single manual pathologist annotator with consensus was also calculated.
GPC3, glypican-3; H&E, hematoxylin and eosin.
Performance was assessed at the patient level by calculating the proportion of GPC3+ve areas within the tumor region. This involved dividing the GPC3+ve region’s area by the tumor region’s area, which is the union of the GPC3+ve and GPC3−ve regions. A positive/negative cutoff value determined patient-level positivity/negativity based on the proportion of the GPC3+ve region. Confusion matrices at different cutoff values are presented in Figure 6a, while Figure 6b shows accuracy, precision, recall, and area under the curve (AUC) at different cutoff values. These metrics indicate that the model’s classification capabilities at the patient level for evaluating GPC3 positivity/negativity.

Confusion matrices and performance metrics for evaluating patient-level GPC3 positivity/negativity at different cutoff values.
To determine whether the AI-based screening approach can achieve the current clinical screening level, we compared clinical screening with AI screening to explore changes in precision and recall under different cutoffs (Table 2). In clinical screening, recall was 100% as all positive patients could be confirmed through IHC staining slides. Precision was calculated as the number of true positives divided by the number of predicted positives under a 1% cutoff, determining physician’s precision in a clinical context. For the AI-based screening approach, we computed patient-level precision and recall based on H&E-stained slides and varying cutoff values. The comparison revealed that with a recall of 100% (at a 1% cutoff), the AI-based screening approach’s precision surpassed that of clinical pathologists by 10%, indicating the potential of AI-based methods to improve clinical screening precision.
Precision and Recall Comparison: Clinical (Immunohistochemistry) Versus Artificial Intelligence-Based (Hematoxylin and Eosin) Screening
Note: The data represented in the table were derived from 17 test set samples, of which 6 contain GPC3+ve regions. Among these, three cases have a GPC3+ve region to a tumor area ratio greater than 1%. As can be inferred from the table, at a cutoff of 1%, the AI-based screening approach slightly outperforms the clinical all comer screening approach.
AI, artificial intelligence; H&E, hematoxylin and eosin; IHC, immunohistochemistry.
Performance on independent clinical samples
The results of clinical all-comer versus AI-based screening approach experiment were consistent with previous experimental findings (Fig. 7). Notably, the screening precision was 57.14% as there were 8 positive cases out of the 14 new clinical test samples. Results at the 0.05% cutoff were added to demonstrate the higher precision rate (64.29%) at 100% recall (Table 3). The model’s performance on clinical samples was slightly decreased compared with the previous test set but maintained the general predictive power essentially on similar levels. This challenge might be attributed to the differences in sample quality between the training set and the clinical samples (smaller, more scattered tissues obtained from biopsy procedures).
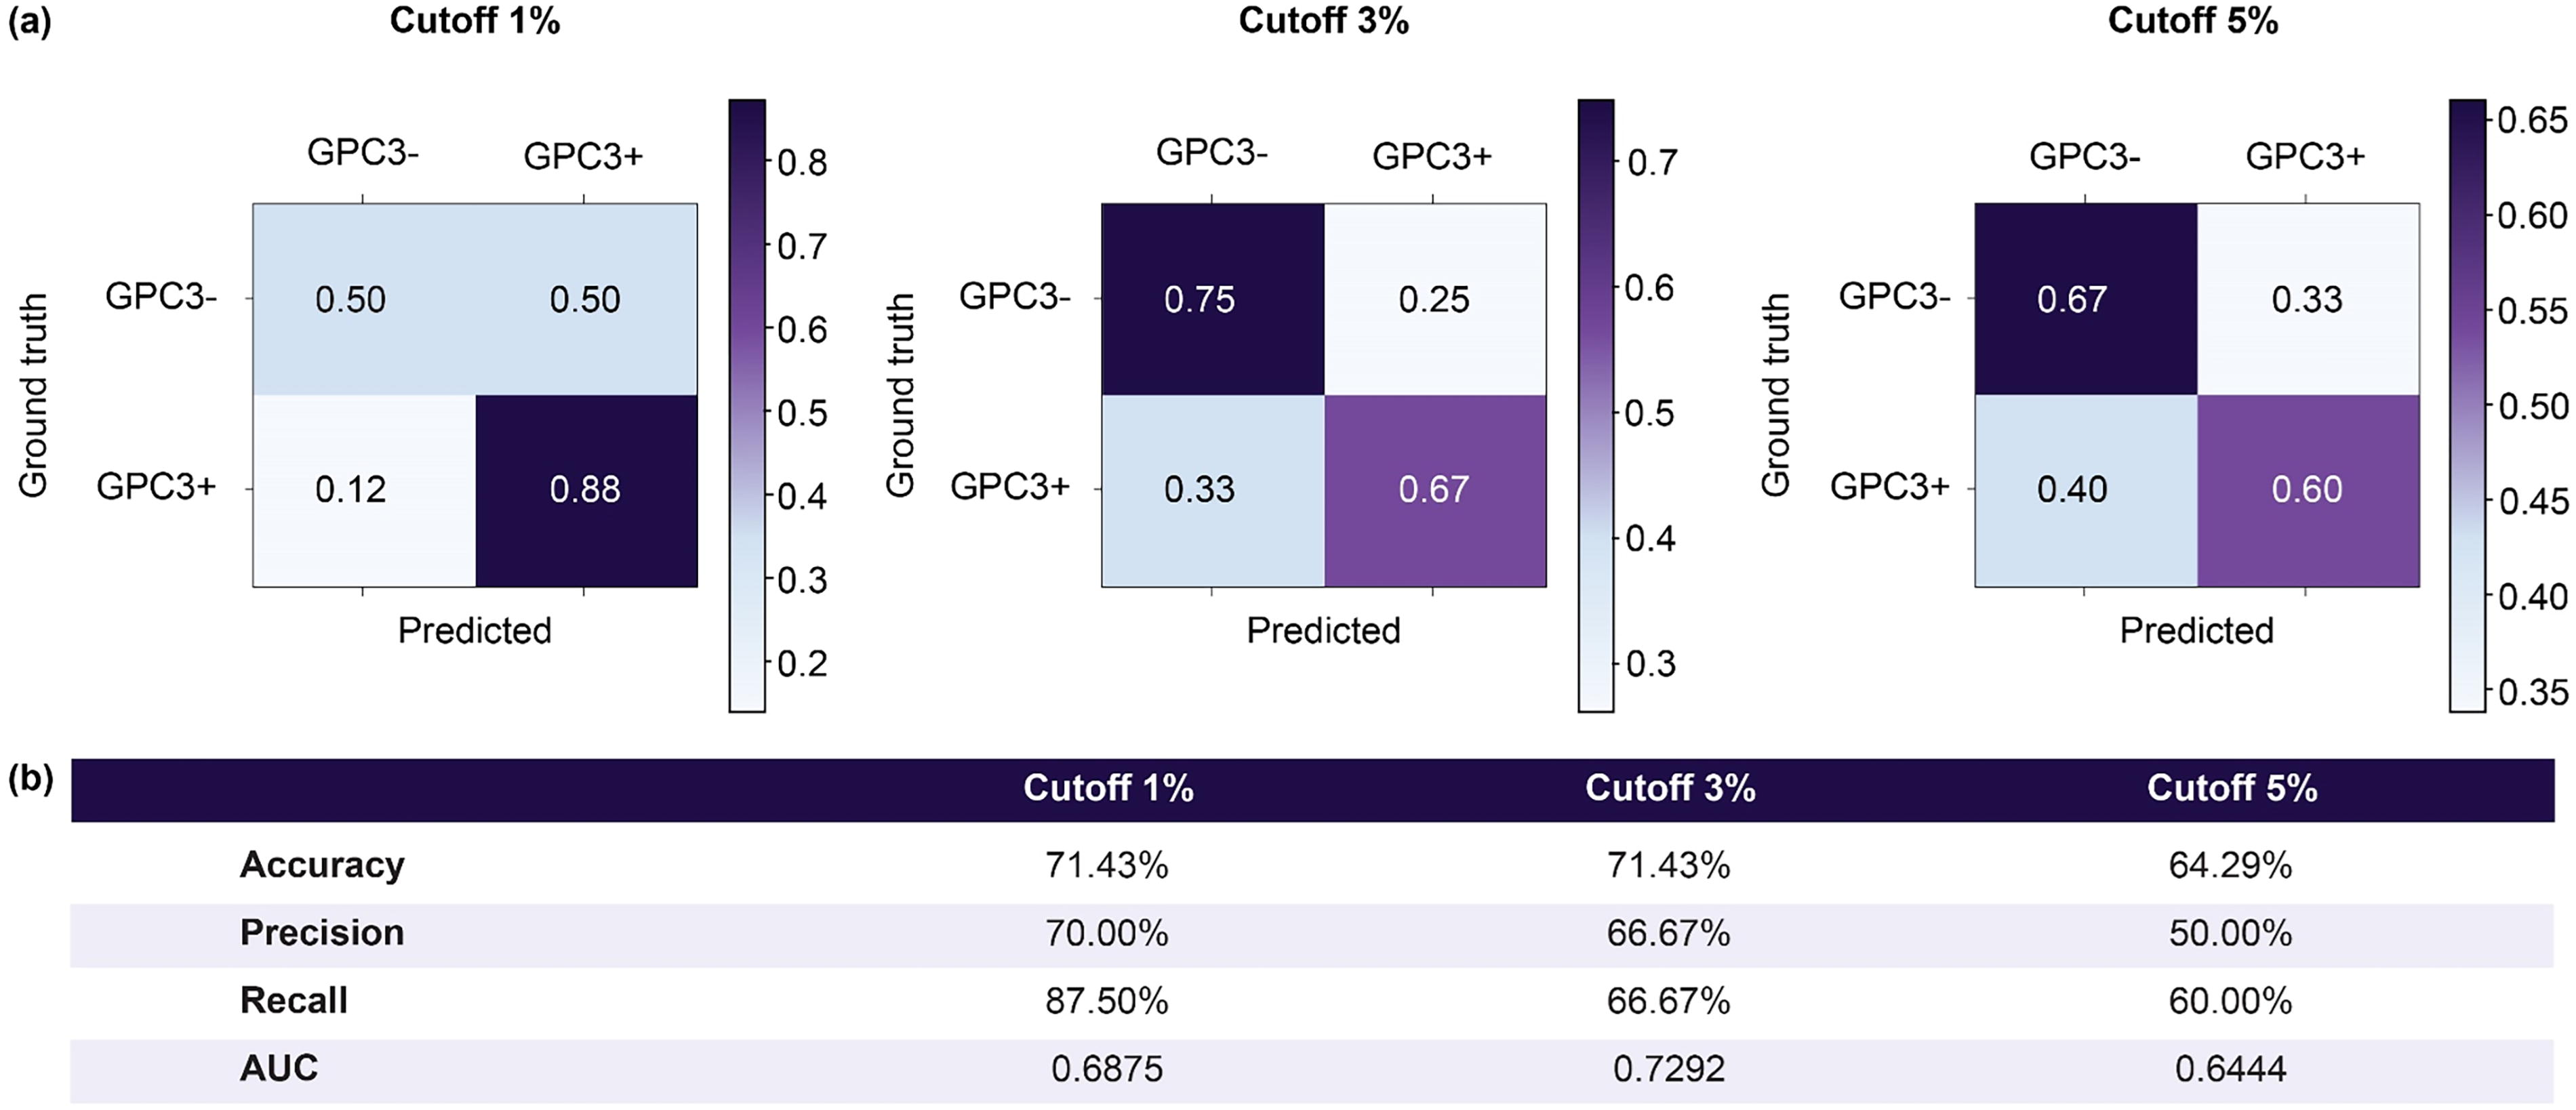
Confusion matrices and metrics for validating patient-level GPC3 positivity/negativity at different cutoff values.
Precision and Recall Comparison: Clinical (Immunohistochemistry) Versus AI-Based (Hematoxylin and Eosin) Screening in 14 Clinical Trial Samples
AI, artificial intelligence; H&E, hematoxylin and eosin; IHC, immunohistochemistry.
Discussion
GPC3, a novel tumor biomarker, serves as a potential diagnostic and therapeutic target for immunotherapy. Assessing target expression is crucial for patient screening in immunotherapy trials. Among different GPC3 expressing tumors, HCC represents the most prevalent form of liver cancer and ranks as the fifth most widespread malignant neoplasm globally. 41 Meanwhile, lung cancer is the second most prevalent cancer worldwide, with high morbidity and mortality, and NSCLC comprises nearly 85% of lung cancer cases. 42 Although there are several therapeutic options available for HCC and NSCLC, there remains a huge unmet need to improve therapy. This study, investigated the epidemiology of GPC3 expression by IHC in samples obtained from patients with HCC and NSCLC. Results suggest that among different tumor types, GPC3 expression is significantly higher in HCC than NSCLC, especially in the portion of membrane H score >50. Within NSCLC, SQ-NSCLC demonstrates elevated GPC3 expression, followed by adeno-NSCLC, both in H scores ranging from 1 to 50 and >50. As GPC3+ve patients with HCC exhibit a markedly diminished 5-year survival rate than GPC3−ve patients with HCC, GPC3 expression is associated with a poor prognosis in HCC. 43 The consistent expression of GPC3 across all the samples examined in this study provides robust evidence of its potential as a target.
We observed an excellent correlation between mRNA and GPC3 protein levels in both PDx models (r2 = 0.927) and human samples (Fig. 5), which could lead to various applications: for example, by utilizing real-world evidence databases to explore the distribution of GPC3 expression (containing mRNA data exclusively) in a broader patient population and investigate its correlation with clinical outcomes. Such results could offer development of a potential companion diagnostic using mRNA GPC3. Moreover, it could feed algorithms and ML-based AI platforms with mRNA data to advance for triaging, diagnostics, and treatment-related changes in GPC3+ve patients. Such approaches could guide patient selection/enrichment for future clinical studies by developing composite scores using multiple biomarker parameters.
Evaluating protein levels through GPC3 staining via IHC, the current conventional approach, is expensive, time-consuming, may deplete tissue samples, and is inaccessible in certain regions. Moreover, the result interpretation is complex, demanding specialized expertise, and frequently yields outcomes. Quantifying GPC3 expression can vary significantly with staining methods and antibodies. In contrast, H&E staining is a basic cost-effective technique routinely applied to biopsies, allowing visual examination of tissue and cells. Unlike IHC, H&E staining is robust, reliable, and independent of antibody choices. Pathologists use H&E to detect cancer and determine its subtype and grade. However, H&E visual examination is limited and not predictive of biomarker expression. 44
Our experiments revealed unique architectural signatures in NSCLC indicative of GPC3 expression. These signatures, detectable through basic H&E staining, were successfully predicted by a learning system trained on annotated examples. Our system demonstrated high accuracy in predicting GPC3 expression based on H&E staining, offering a cost-effective, efficient, and robust alternative to IHC.
A visual analysis showed that the pretrained encoder on training data could identify latent relationships within the tiles. For instance, it could map tiles containing similar features to proximate areas in a low-dimensional space, validating the effectiveness of our encoder structure. However, the pretrained encoder does not significantly distinguish between positive (regional, scattered) and negative data, indicating that a generic encoder trained on H&E slides cannot effectively distinguish between GPC3+ve and GPC3−ve samples, thus highlighting complexity for generic models. We applied t-SNE for visualizations related to the dimensionality reduction analysis of tiles (Fig. 3). The key benefits of the 3DP method include its utilization of dual sample slide information from IHC and H&E in AI modeling, enabling the detection of hidden patterns in H&E that predict IHC findings. Specifically, the AI model proposed in this study is tissue and cell recognition-based, designed to handle novel data of limited quantity. The quality of data annotation positively correlates with the effectiveness of model training for AI deep learning models. We employ the newly proposed 3DP method, enabling annotators to label GPC3+ve areas through IHC-stained slides with precise cell-level annotation. Despite cell offset caused by restaining in the 3DP method, high-quality annotations using H&E staining can be achieved after image alignment. This provides efficient training results on a small amount of data, yielding outstanding performance on the test dataset, as demonstrated in a small sample size from early phase clinical study with SAR444200.
The AI model consistently makes multiple predictions and applies identical criteria for each pixel, thereby mitigating discrepancies in manual annotations due to fatigue. Specifically, the AI model learns tissue and cell morphology, applying uniform standards to each pixel during prediction and accommodating different cell and tissue patterns. Clinical pathology images are vast, with each WSI containing between 5 and 10 billion pixels, leading to potential inconsistencies in annotations by pathologists due to fatigue and other factors. However, the AI model can equitably handle a large volume of pixels, ensuring a high level of consistency.
In this study, the positive GPC3 expression (defined by GPC3 IHC membranous H score ≥1) on tumor tissue was one of the inclusion criteria (Supplementary Fig. S2). Our system was trained to predict GPC3 expression by H&E images on the NSCLC cohort, while separating patients between training and testing folds. Results suggest successful application of 3DP technology in significantly enhancing the accuracy and precision of predicting GPC3 expression from H&E images, particularly with small sample size. This novel approach holds great promise for advancing the reliability and effectiveness of GPC3 expression prediction in clinical settings. Furthermore, using t-SNE for visualizations in dimensionality reduction analysis of tiles addresses the limitation of generic encoders trained on H&E slides, which struggle to effectively distinguish between GPC3+ve and GPC3−ve samples. Notably, our model has been applied to clinical samples of NSCLC, demonstrating consistent predictive performance as the test sample set. This study has a few limitations: while the model shows promise for supporting clinical enrolment, its limited dataset necessitates retraining to enhance robustness and reliability. The H&E variability may affect scoring leading to difficult clinical implementation. In addition, the AUC of ∼0.7 in the independent dataset indicates overfitting in the initial set and requires significant improvement before it can be used in diagnosis.
Despite small sample size, the study demonstrated the successful development of a pixel-level segmentation model to predict GPC3 expression in clinical samples. Furthermore, an enhanced recall rate compared with the traditional clinical pathology approach was observed, serving as a strong validation of our model. Further analyses will include deploying these models on larger real clinical cohorts, aiming to gain deeper insights into their potential clinical utility.
Conclusion
We profiled GPC3 expression across tumor types and showed a high level of expression in HCC followed by SQ-NSCLC. We have established an AI-powered digital pathology platform that leveraged a novel same-tissue restaining technology to improve the signal-to-noise ratio and dramatically reduce the number of slides needed for training AI models. The AI platform can provide a standardized, scalable, and reproducible method of characterizing GPC3 positivity based on H&E images to speed up clinical trial recruitment and support further patient selection in a clinical study.
Footnotes
Acknowledgments
Copy editing support for this article was provided by Shiv Hari from APCER Life Sciences, funded by Sanofi. Kaushik Kuche, PhD (Sanofi), assisted in formatting and editing the article.
Authors’ Contributions
E.S.M. and R.W.: Designed the concept and experiments. H.W. performed the statistical analysis. E.S.M. and R.W.: Supervised and managed the project, and they contributed to drafting the paper. All authors contributed for the critical review.
Data Availability
Qualified researchers can request access to patient-level data and related study documents, including the clinical study report, study protocol with any amendments, blank case report forms, statistical analysis plan, and dataset specifications. Patient-level data will be anonymized, and study documents will be redacted to protect the privacy of trial patients. Further details on
Author Disclosure Statement
D.W.-T.L. and J.S. have no competing interests to disclose. M.C.-P. received honorarium from Merck, Incyte, Pfizer, and BMS. Y.T. and Y.L. are employees of Wuxi AppTech. E.M., H.W., P.F., E.A., Q.T., A.K., C.C., L.T., B.P., and R.W. are employees of
Funding Information
This study was sponsored by Sanofi.

References
Supplementary Material
Please find the following supplemental material available below.
For Open Access articles published under a Creative Commons License, all supplemental material carries the same license as the article it is associated with.
For non-Open Access articles published, all supplemental material carries a non-exclusive license, and permission requests for re-use of supplemental material or any part of supplemental material shall be sent directly to the copyright owner as specified in the copyright notice associated with the article.
