
Abstract
Abstract
The use of electronic cigarettes (e-cigarettes) potentially offers a safer alternative to conventional tobacco products. The advance in molecular biology and computational sciences offers new perspective to assess adverse biological responses for product risk assessment by combining omics screens with knowledge-based biological pathways. Our aim was to compare transcriptomic perturbations in MucilAir™, a commercially available lung epithelial tissue, after short repeated exposure to cigarette smoke (3R4F) and e-cigarette (Vype ePen) aerosols. We performed deep RNA sequencing and secreted inflammatory cytokine profiling postexposure. One hundred twenty-three genes were differentially expressed at fold change (FC) >1.5 and p-false discovery rate (pFDR) <0.1 for 3R4F exposure and 0 genes for Vype ePen aerosol exposure. When a relaxed filter pFDR <0.5 and FC >1.5 was applied, 29 genes were identified with e-cigarette aerosol exposure and used for validation of potential candidates by quantitative reverse transcription polymerase chain reaction (qRT-PCR). Gene enrichment analysis was conducted and predicted a response to 3R4F smoke exposure in biological processes involving inflammation and oxidative stress pathways. No enrichment could be performed for Vype ePen aerosol exposure due to the lack of regulated gene candidates at those exposure conditions even after qRT-PCR validation. Of a panel of 33 cytokines screened, 8 were upregulated (FC >1.5 p < 0.05) following 3R4F smoke exposure, which was in agreement with our enrichment analysis. In conclusion, aerosol from the tested e-cigarette caused limited perturbations in gene and inflammatory cytokine expression compared to conventional cigarette smoke, as assessed using next-generation sequencing-based systems biology approaches in 3D commercially available reconstituted lung epithelial tissues.
Introduction
C
Public Health England recently reported that e-cigarettes were 95% less harmful than tobacco products and could be a means for smokers to quit or reduce their consumption of cigarettes. 8 This was recently supported by a report from the Royal College of Physicians, in which it was stated that “the hazard to health arising from long-term vapour inhalation from the e-cigarettes available today is unlikely to exceed 5% of the harm from smoking tobacco.” 9
Diseases and adverse biological effects caused by a toxic stress cannot be attributed to the failure/response of a single endpoint target, but can be viewed as a consequence of functional- and disease-perturbed networks. 10 The National Research Council's report, Toxicity Testing in the 21st Century: A Vision and a Strategy, suggests the use of systems biology approaches to help enhance knowledge of cellular response networks to help discern the processes and mechanisms of how environmental agents perturb pathways in ways that lead to toxicity. 11 Elements of systems biology approaches require quantification and analysis of relevant molecular networks, perturbed on exposure to toxic agents by integration of high-throughput in vitro screening (transcriptomics, proteomics, and metabolomics) with advanced computational tools. 12 The rapid development of knowledge-based bioinformatics tools modeling the cellular architecture, allows the downstream analysis of these integrated omics data sets to derive complex network views of biological systems and to infer the logic behind an observed biological response. 10
Microarray-based transcriptomics, coupled with pathway mapping, has been successfully applied to compare the perturbations in reconstituted airway epithelium exposed to cigarette smoke and novel tobacco and nicotine delivery products. 13 The introduction of RNA sequencing (RNA-seq) as a next-generation transcriptomic platform potentially offers greater granularity in our understanding of perturbed gene expression following exposure to tobacco product smoke. The benefits of RNA-seq include high sample throughput, delivery of a precise count of abundant and rare transcripts and their isoforms such as splice variants.14,15
Current toxicological evaluation of e-cigarettes has been limited and includes the aerosol chemistry profile, and application of e-liquids to cell lines and aerosol to primary airway epithelial cells with inclusion of simple endpoints such as cytotoxicity and transepithelial electrical resistance.16,17 We have recently reported the levels of emissions from a commercially available e-cigarette (Vype ePen, Nicoventures, United Kingdom) being 92%–99% lower on a per puff basis than those from a reference tobacco cigarette (3R4F; University of Kentucky, Lexington, KY). 18 Compounds quantified include major e-liquid constituents (nicotine, propylene glycol [PG], and vegetable glycerol [VG]), recognized impurities in pharmacopeia quality nicotine and thermal decomposition products of PG or VG.
To gain further understanding of potential biological adverse effects associated with e-cigarette use, we performed RNA-seq to compare the transcriptomic perturbations in a commercially available reconstituted airway epithelium (MucilAir™). MucilAir is a 3D human airway epithelia culture system that conserves key lung tissue morphological features and functions and therefore is well suited for in vitro air–liquid interface (ALI) cultures to aerosols across acute and repeated exposures. In this study, we used repeated dose exposure to mimic the smoking behavior of a moderate smoker in an attempt to reproduce as closely as possible the in vivo situation. MucilAir cultures were subjected to short repeated exposures to cigarette smoke from a reference tobacco product, 3R4F, or aerosol from a commercial e-cigarette, Vype ePen. Exposures were matched on a per puff basis and tested for mass deposition; understanding exposure dose is critical to support the comparison of biological responses. Differential mRNA expression, alternative splice variants, and secreted cytokines were assessed after exposure. To the best of our knowledge, this is the first study to investigate the relative responses between conventional tobacco smoke and e-cigarette aerosols in 3D reconstituted lung epithelial tissues with puff matching and deposition measurement combined with next-generation sequencing-based systems biology approaches.
Materials and Methods
A workflow summarizing the multiple steps involved in the study and the biological endpoints tested is presented in Figure 1.
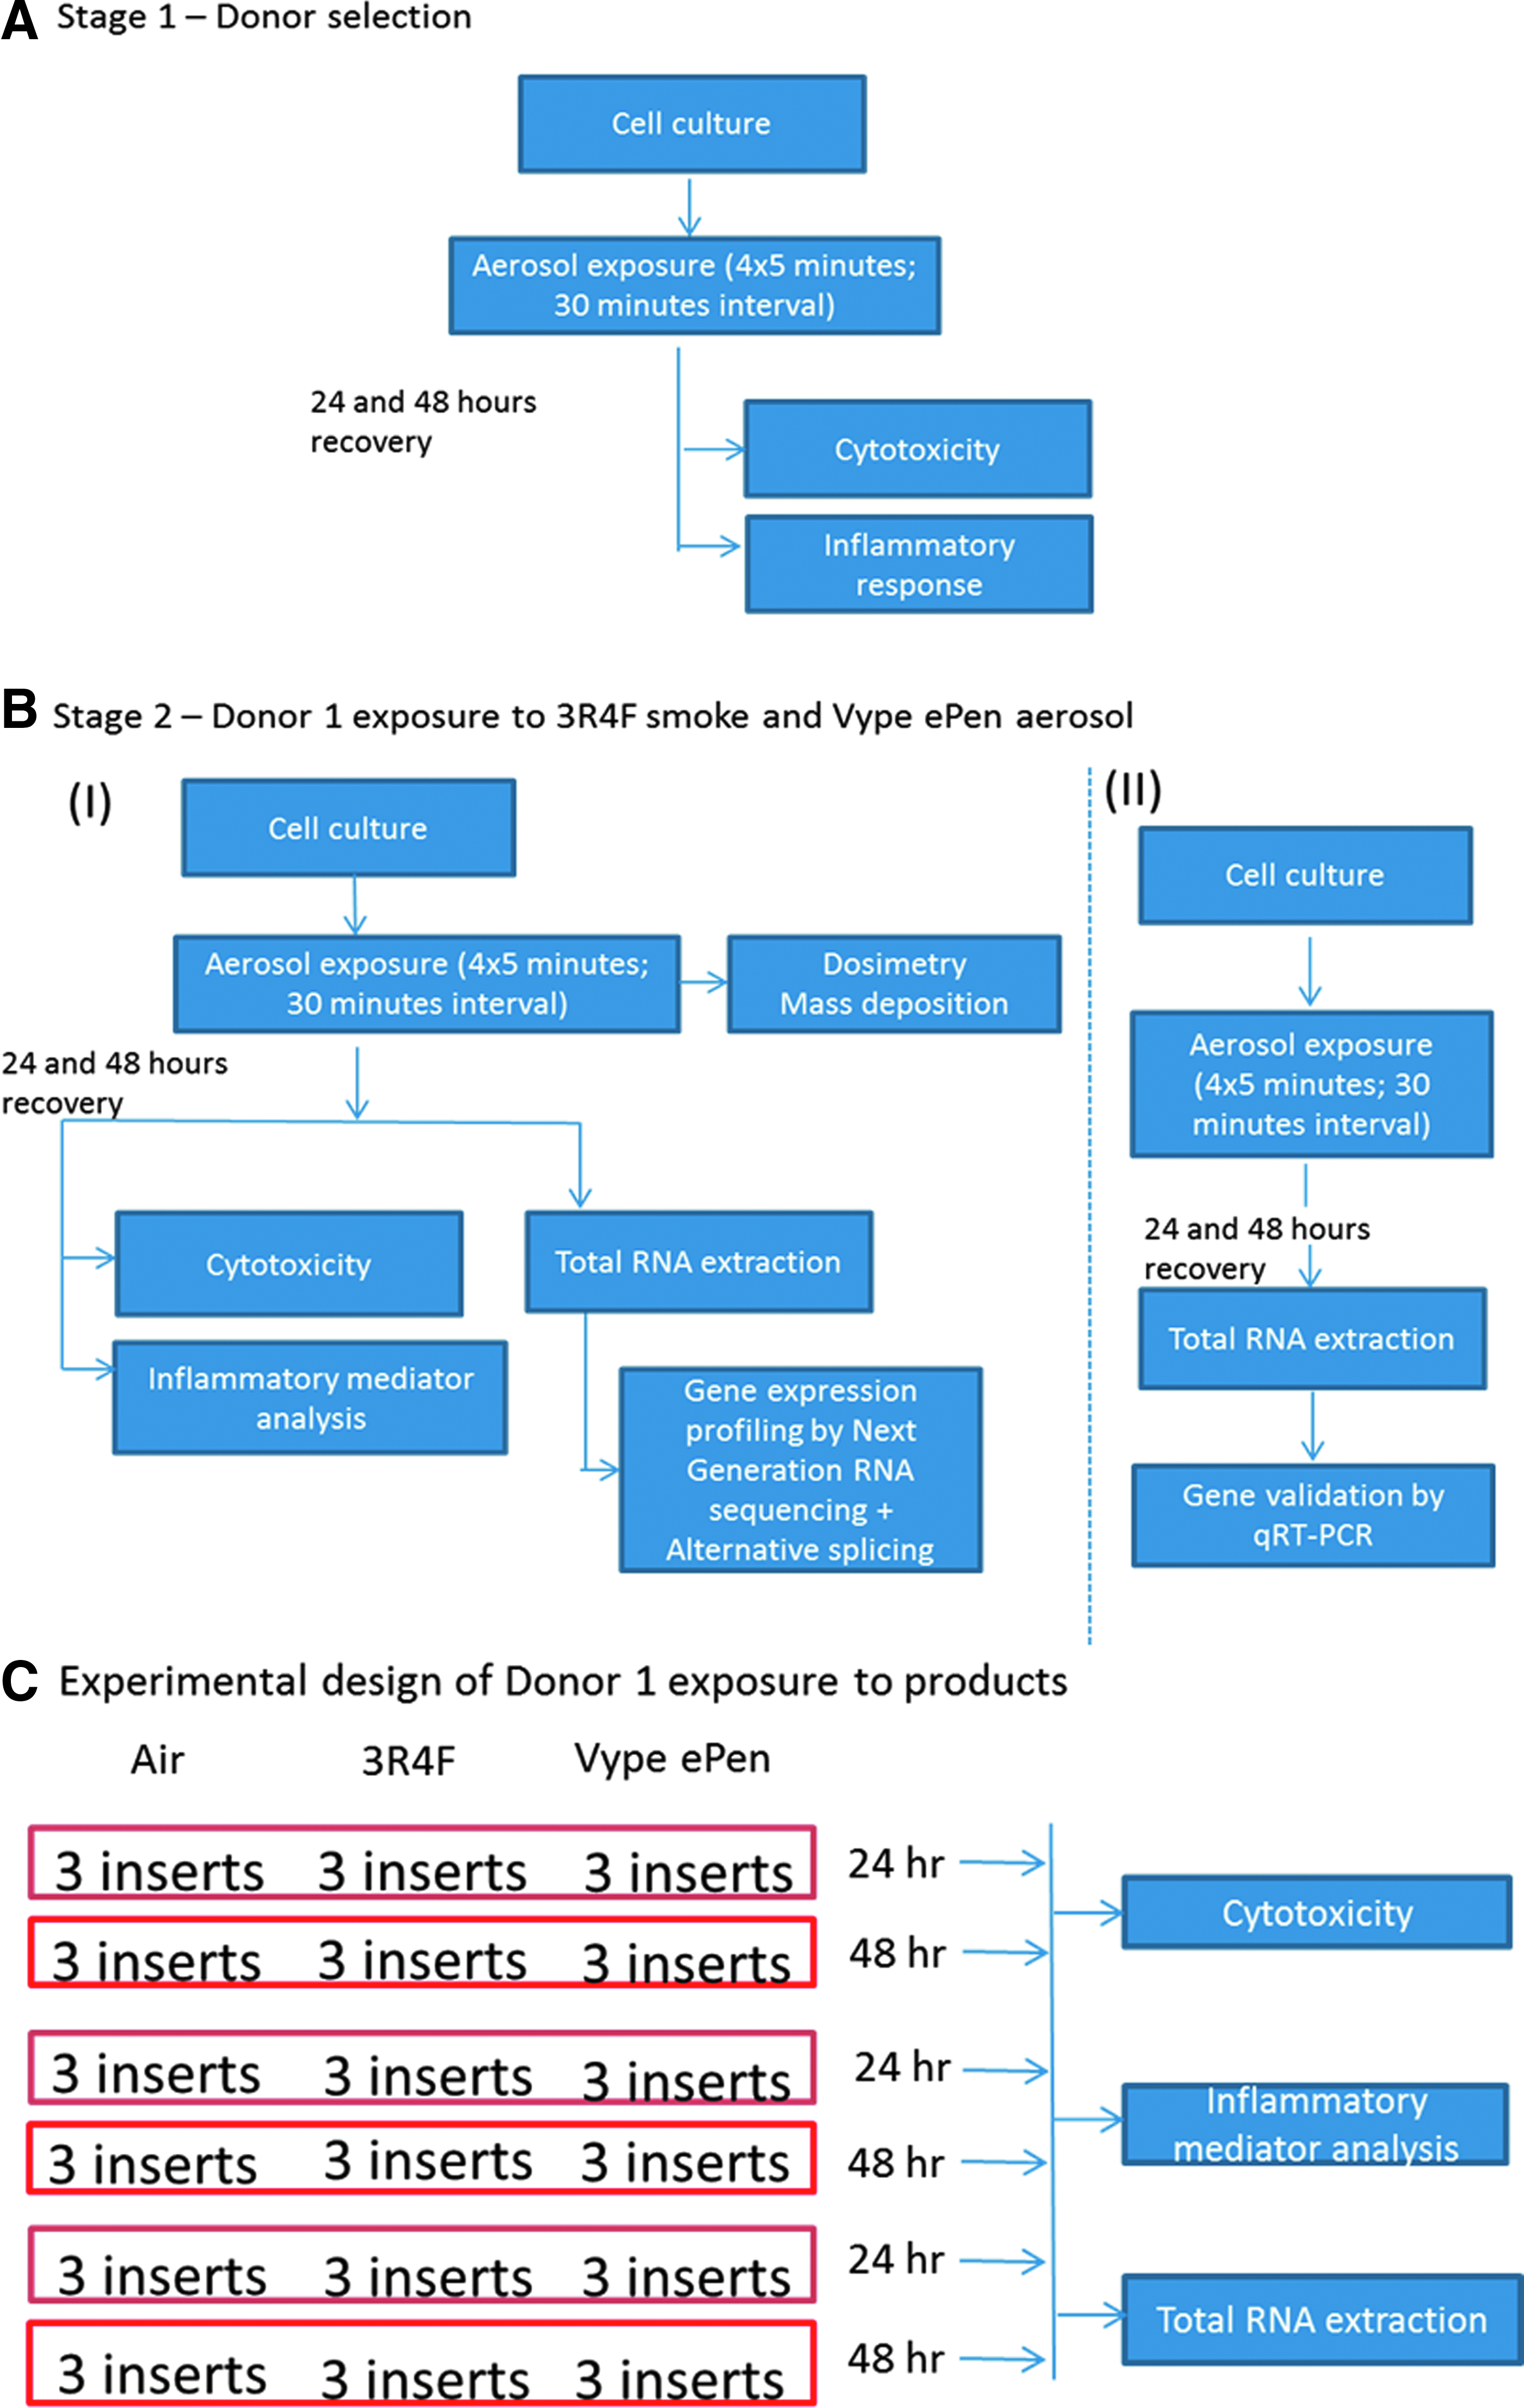
Workflow showing the major steps involved, the various endpoints tested
Test articles
The cigarette used in this study was the 3R4F Kentucky reference cigarette (University of Kentucky). It is a US-blended king-sized product with a cellulose acetate filter and an ISO tar yield of 9.4 mg. The composition, construction, and mainstream smoke chemistry yields from this product have been reported previously.19,20
The e-cigarette used was Vype ePen (www.govype.com). It is a “closed-modular” system (Fig. 2) consisting of two modules, a rechargeable battery section and a replaceable liquid (“e-liquid”) containing cartridge (“cartomizer”), with two voltage settings, 4 and 3.6 V (4 V used in our studies). The “Blended Tobacco” variant chosen for this study had 18 mg/mL nicotine. Previous studies have characterized the emissions from these products and show Vype ePen having 92%–99% reductions in constituents when compared to the reference 3R4F tobacco product. 18

Vype ePen component diagram.
Dosimetry
Machine puffing for dosimetry assessments was conducted on a Borgwaldt RM20S (Borgwaldt KC GmbH, Hamburg, Germany) with all products generating whole smoke/aerosols at a 1:20 dilution (aerosol/smoke:air, vol:vol) as previously described. 21 3R4F cigarettes were smoked under the Health Canada Intense (HCI) regimen (puff volume, duration, and frequency of 55 mL, 2 and 30 seconds [55/2/30]; Health Canada, 1999) to the butt mark (length of overwrap +3 mm), according to ISO 4387 (ISO, 2000), with filter ventilation blocked (typically 10 puffs). Vype ePen e-cigarettes were puffed at a modified (from a bell-shaped profile to a rectangular profile) HCI regimen (55/2/30) with no air hole blocking. The device was hand activated at high voltage (4.0 V, 2.85 Ω) 1 second before puffing. Three independent replicate experiments with triplicate measurements per experiment were conducted (n = 9/product). Aerosol was delivered to an exposure chamber housing three quartz crystal microbalances (QCMs). 20 The total mass postexposure was either recorded as micrograms per square centimeter (μg/cm2) or on a per puff basis (μg/cm2/puff).
Cell culture
Nasal MucilAir cell inserts from individual donors were purchased from Epithelix Sarl (Plan-Les-Ouates, Switzerland). Nasal epithelial cells have been shown to be effective proxies for bronchial epithelial cells and are suited to study the effect of smoke exposure. 22 Six donors were used in an initial donor response evaluation stage (D1—MD005501, D2—MD059401, D3—MD040001, D4—MD051501, D5—MD058501, D6—MD048401), and one donor was used for the subsequent steps of this study (D1—MD005501). The cells were maintained in a proprietary MucilAir culture medium for a week at 37°C and 5% CO2 in a humidified incubator for stability before exposure. Every other day media were removed and replaced with 700 μL of fresh Epithelix media. DMEM/F12 media (Thermo Fisher Scientific, Hemel Hempstead, United Kingdom) without phenol red or fetal bovine serum were used for the aerosol/smoke exposure.
Smoke and aerosol exposure
As with dosimetry studies, machine puffing for both 3R4F reference cigarettes and e-cigarettes (Vype ePen) was conducted on a Borgwaldt RM20S smoking machine delivering a 1:20 (aerosol:air, v:v) aerosol dilution to the cell cultures. This dilution was selected based on previous in-house dose range studies conducted to identify a noncytotoxic dose giving the best response (data not shown). 3R4F cigarettes were conditioned for 48 hours at 60% ± 3% relative humidity, 22°C ± 1°C according to ISO 3402:1999, and were smoked using the HCI regimen. Aerosols from Vype ePen were generated using a modified HCI regimen, as described above. Exposures were matched on a puff by puff basis and performed in a test atmosphere of 60% ± 5%, 22°C ± 2°C relative humidity (ISO 3402:1999). Tissue cultures were exposed to short repeated doses of both products; each individual exposure lasted for 5 minutes followed by 30-minute recovery, with a total of four consecutive exposures per experiment.
Air controls were included in each run, exposing cells to an intermittent flow of sterile air in an exposure chamber, at a frequency and volume identical to treated cells.
The experiment was repeated three times independently and each experiment included three intraexperimental replicates. After exposure to the products, cells were recovered in 700 μL fresh Epithelix culture media for 24 and 48 hours before the basal media were collected for assessment of cytotoxicity and inflammatory endpoints. The cells were lysed and stored at −80°C for total RNA extraction.
Cytotoxicity analysis
The CytoTox-ONE™ Homogeneous Membrane Integrity Assay (LDH assay, Promega UK Ltd, Southampton, United Kingdom) was carried out to assess cytotoxicity by measuring lactate dehydrogenase (LDH) release in the media of exposed cells, according to the manufacturer's instructions.
Measurement of inflammatory responses and tissue remodeling
The levels of secreted cytokines and matrix metalloproteinases (MMPs) were determined in the culture media at 24- and 48-hour time points with the Meso Scale Discovery V-plex 30 cytokines kit (Cat. No K151A0H-2; Meso Scale Diagnostics, Rockville, MD) and 3-plex MMPs kit (Cat. No K15034C-2). Multiplexed immunoassays were executed as per the manufacturer's instructions and analyzed using a Sector Imager 2400 (Meso Scale Diagnostics). Briefly, 50 μL of calibrator and of each sample was loaded on the plates and incubated for 2 hours at room temperature on a rocking platform. The plates were washed three times with 1 × phosphate-buffered saline (Thermo Fisher Scientific, Hemel Hempstead, United Kingdom) +0.05% Tween-20 (Sigma-Aldrich, Gillingham, United Kingdom) and 25 μL of detection antibody solution was then added for 2 hours. Further three washes were performed with PBS +0.05% Tween-20 followed immediately by reading of the plate on the Sector instrument.
Total RNA extraction
Total RNA was extracted from the exposed cells after 24- and 48-hour recovery using the miRNeasy Mini Kit (Qiagen, Manchester, United Kingdom). Briefly, the cells were lysed using 350 μL phenol/guanidine-based QIAzol Lysis Reagent. Lysis was followed by addition of chloroform (Sigma-Aldrich) to enable phase separation. The subsequent phenol extraction and filter cartridge elution steps were carried out according to the instructions of the manufacturer (Qiagen). Total RNA was purified from the aqueous phase using ethanol and eluted from the column with 50 μL RNAse free water (Qiagen).
Total RNA was quantified using a NanoDrop ND1000 spectrophotometer (NanoDrop Technologies, Wilmington, DE). The RNA integrity was assessed with an Agilent 2100 Bioanalyzer (Agilent, Cheadle, United Kingdom).
Massive parallel RNA-seq
The Stranded Total RNA libraries were prepared in accordance to the Illumina® TruSeq Stranded Total RNA Sample Preparation guide (Illumina, San Diego, CA) with Ribo-Zero Human/Mouse/Rat for Illumina Paired-End Multiplexed Sequencing. Briefly, after rRNA depletion, the remaining RNA was purified, fragmented, and primed for double-stranded cDNA synthesis. The adapters and indexes were ligated to the end of the ds cDNA to prepare the sample for hybridization onto a flow cell. The sample was polymerase chain reaction (PCR) amplified through 15 cycles of PCR to select samples having the adapter molecules present on both ends of the DNA. The libraries were validated on the Agilent Bioanalyzer using a DNA 1000 chip (Agilent, Wokingham, United Kingdom). The resulting library pools were diluted to 10 nM and validated using the Agilent 2100 Bioanalyzer on a High Sensitivity Chip to confirm the molarity and size distribution before sequencing (Agilent). The pools were loaded at a concentration of 8 pM onto 28 lanes of an Illumina® HiSeq2000 flow cell v3 (Illumina). Samples were sequenced at 100 bp paired-end runs at a target depth of 100 million reads per sample.
Reverse transcription and qRT-PCR
For detection of mRNA expression levels, cDNA synthesis was carried out using the high-capacity RNA-to-cDNA Reverse Transcription Kit (Life Technologies, Paisley, United Kingdom). The reverse transcription reaction was incubated for 60 minutes at 37°C, followed by 5 minutes at 95°C to inactivate the reverse transcriptase mix. Quantitative reverse transcription polymerase chain reaction (qRT-PCR) was performed using custom TaqMan array 96-well plates and TaqMan Fast Universal Master mix II with UNG (Life Technologies). Amplification was performed with the fast PCR 7500 (Life Technologies). The cycling conditions consisted of an initial activation step of the HotStarTaq DNA Polymerase for 15 minutes at 95°C, followed by 40 cycles of denaturation for 15 seconds at 94°C, annealing for 30 seconds at 55°C, and extension for 30 seconds at 70°C with fluorescence data collection being performed during the extension step. Ct-values were normalized to GAPDH, a frequently used reference gene,23,24 and relative quantification was analyzed using the 2-ΔΔCt method.
Statistical analysis of differential expression
FASTQ files were generated for RNA-seq differential expression analysis. The RNA-seq raw data were preprocessed using FASTQC (www.bioinformatics.babraham.ac.uk/projects/fastqc) to identify substandard sequences, aligned to the human genome (GRCh38) using STAR aligner, 25 and the number of mapped read pairs was counted using cufflinks 26 based on the GENCODE v23 (www.gencodegenes.org) annotation. The raw read counts were subsequently transformed using voom 27 and quantile normalized. The RNA data were imported and assessed for sample outliers using the array QualityMetrics Bioconductor package. Outliers were removed from subsequent analysis. A series of six group-wise comparisons were undertaken to identify differences (fold changes [FCs]) between the products relative to the air control, adjusted for either interexperimental replicates (exposure experiment) or for both interexperimental replicates and time points. The adjustment for exposure experiment was done within each time point; the two time points were then evaluated together by combining the two time points for each test condition while adjusting for time. To detect differential expression and splicing between the groups, linear modeling was applied with subsequent empirical Bayesian analysis p-value adjustment for multiple testing, which controls for p-false discovery rate (pFDR; Benjamini–Hochberg). The Bioconductor package Limma was used.
For qRT-PCR, the threshold cycle (Ct) values were visually inspected using the fast PCR 7500 software v.2.0.5. When required, the threshold setting default (0.2) was manually adjusted to ensure that optimal sensitivity was maintained. All Ct values >36, indicative of the plateau phase of qPCR, were considered nonexpressed genes. The Ct values were then normalized against the endogenous control genes GAPDH to generate delta Ct values (Ct gene of interest − Ct endogenous control gene). JMP_Genomics 6.0 (SAS Institute, Inc., Cary, NC) was used to perform the graphical representation of the gene expression and statistical analysis. Volcano plots, which summarize negative log10-transformed p-values against the log2 FC, were selected for representing genes with statistically significant differential expression.
Pathway analysis
Enrichment analysis of significant genes was performed using the Gene Ontology (GO; http://geneontology.org/) and Reactome (www.reactome.org/) databases. Significant enrichment (over- or underrepresentation) was evaluated using hypergeometric tests. In addition, IPA software was used to reveal the pathways that were the most perturbed by exposure to different products. A core analysis was conducted using the Ingenuity Gene only knowledge base, and activation Z-scores were obtained from the Diseases and Functions database.
Results
Dosimetry
To evaluate the dose of smoke/aerosol material deposited on the cells, we used a QCM to measure in real time, nanogram levels of particulate deposition. 20 The QCM chambers were used to detect mass differences between 3R4F smoke and Vype ePen aerosol produced with matching puffs and performed three times independently at a 1:20 smoke/aerosol:air dilution. Mean deposited mass obtained was 0.14 μg/cm2 per puff for 3R4F cigarettes and 0.18 μg/cm2 per puff for Vype ePen (Fig. 3). A one-way analysis of variance test showed there was a significant difference (p < 0.05) between the mean deposited mass values obtained for the two products, however, the difference was small.
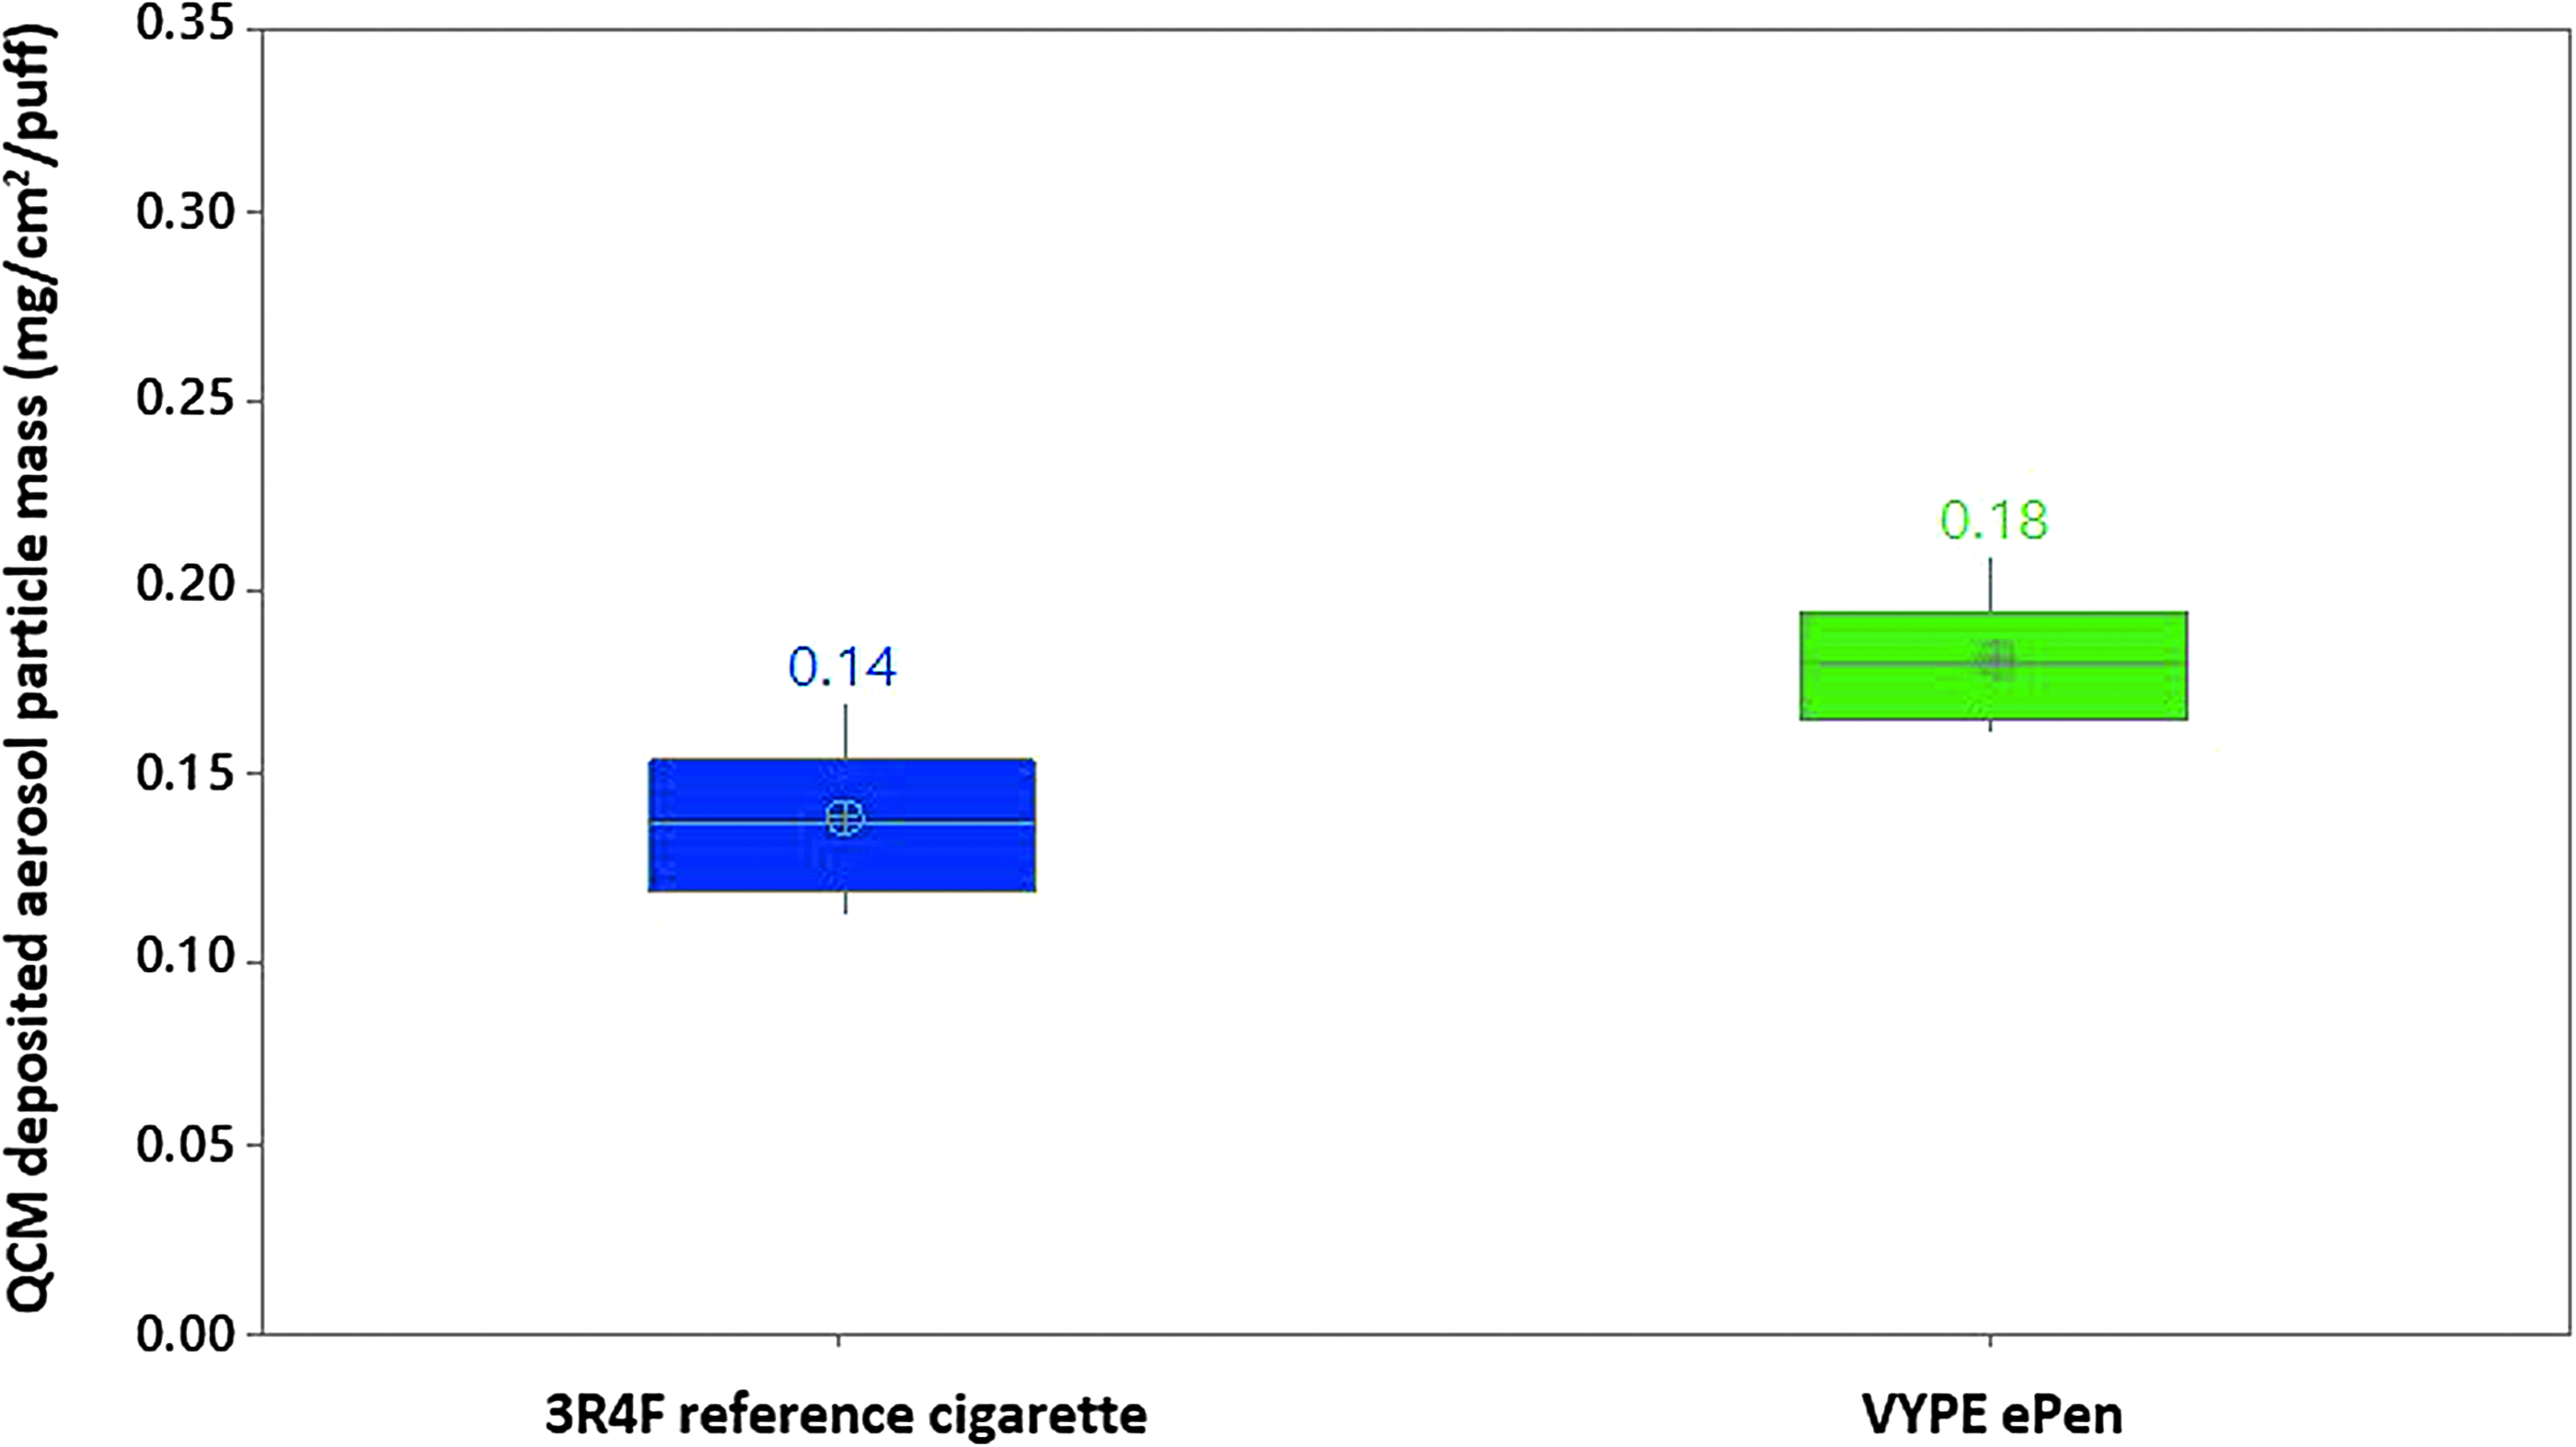
Per puff aerosol deposition in vitro at a 1:20 dilution on the RM20S. The products were smoked at a Health Canada Intense regimen, at 10 puffs/5 minutes. Three independent replicate experiments per product were conducted with 3 QCMs/chamber. Deposited particle mass obtained for 3R4F cigarette smoke and Vype ePen aerosol is indicated. QCM, quartz crystal microbalance.
Donor selection
In this study, we used a commercially available reconstituted primary airway epithelium differentiated at the ALI. Since this model is derived from single donors, interindividual variability could have a key impact on the response observed on exposure to smoke. To select a representative donor, we performed a prescreen of six donors and measured MMP-1, MMP-9, IL-8, and vascular endothelial growth factor (VEGF) secretion after cigarette smoke exposure compared to an air control. These two MMPs and two cytokines are well-documented responders to cigarette smoke in the airways. 28 A significant increase in MMP-1 expression was observed in three donors D1, D3, and D6 in response to whole smoke exposure (Fig. 4). For MMP-9, a significant release was noted in all six donors. Upregulation of VEGF secretion was observed in four donors D1, D2, D3, and D5, whereas none of the donors expressed IL-8 significantly. Interdonor variability was demonstrated across all inflammatory mediators tested (Fig. 4). Donor 1 was selected for subsequent exposure to 3R4F and Vype ePen based on a consistent MMP-1, MMP-9, and VEGF response that was in good agreement with the literature. 28 Cytotoxicity measured by LDH released on 3R4F exposure remained below 6% for all donors 24 hours postexposure.
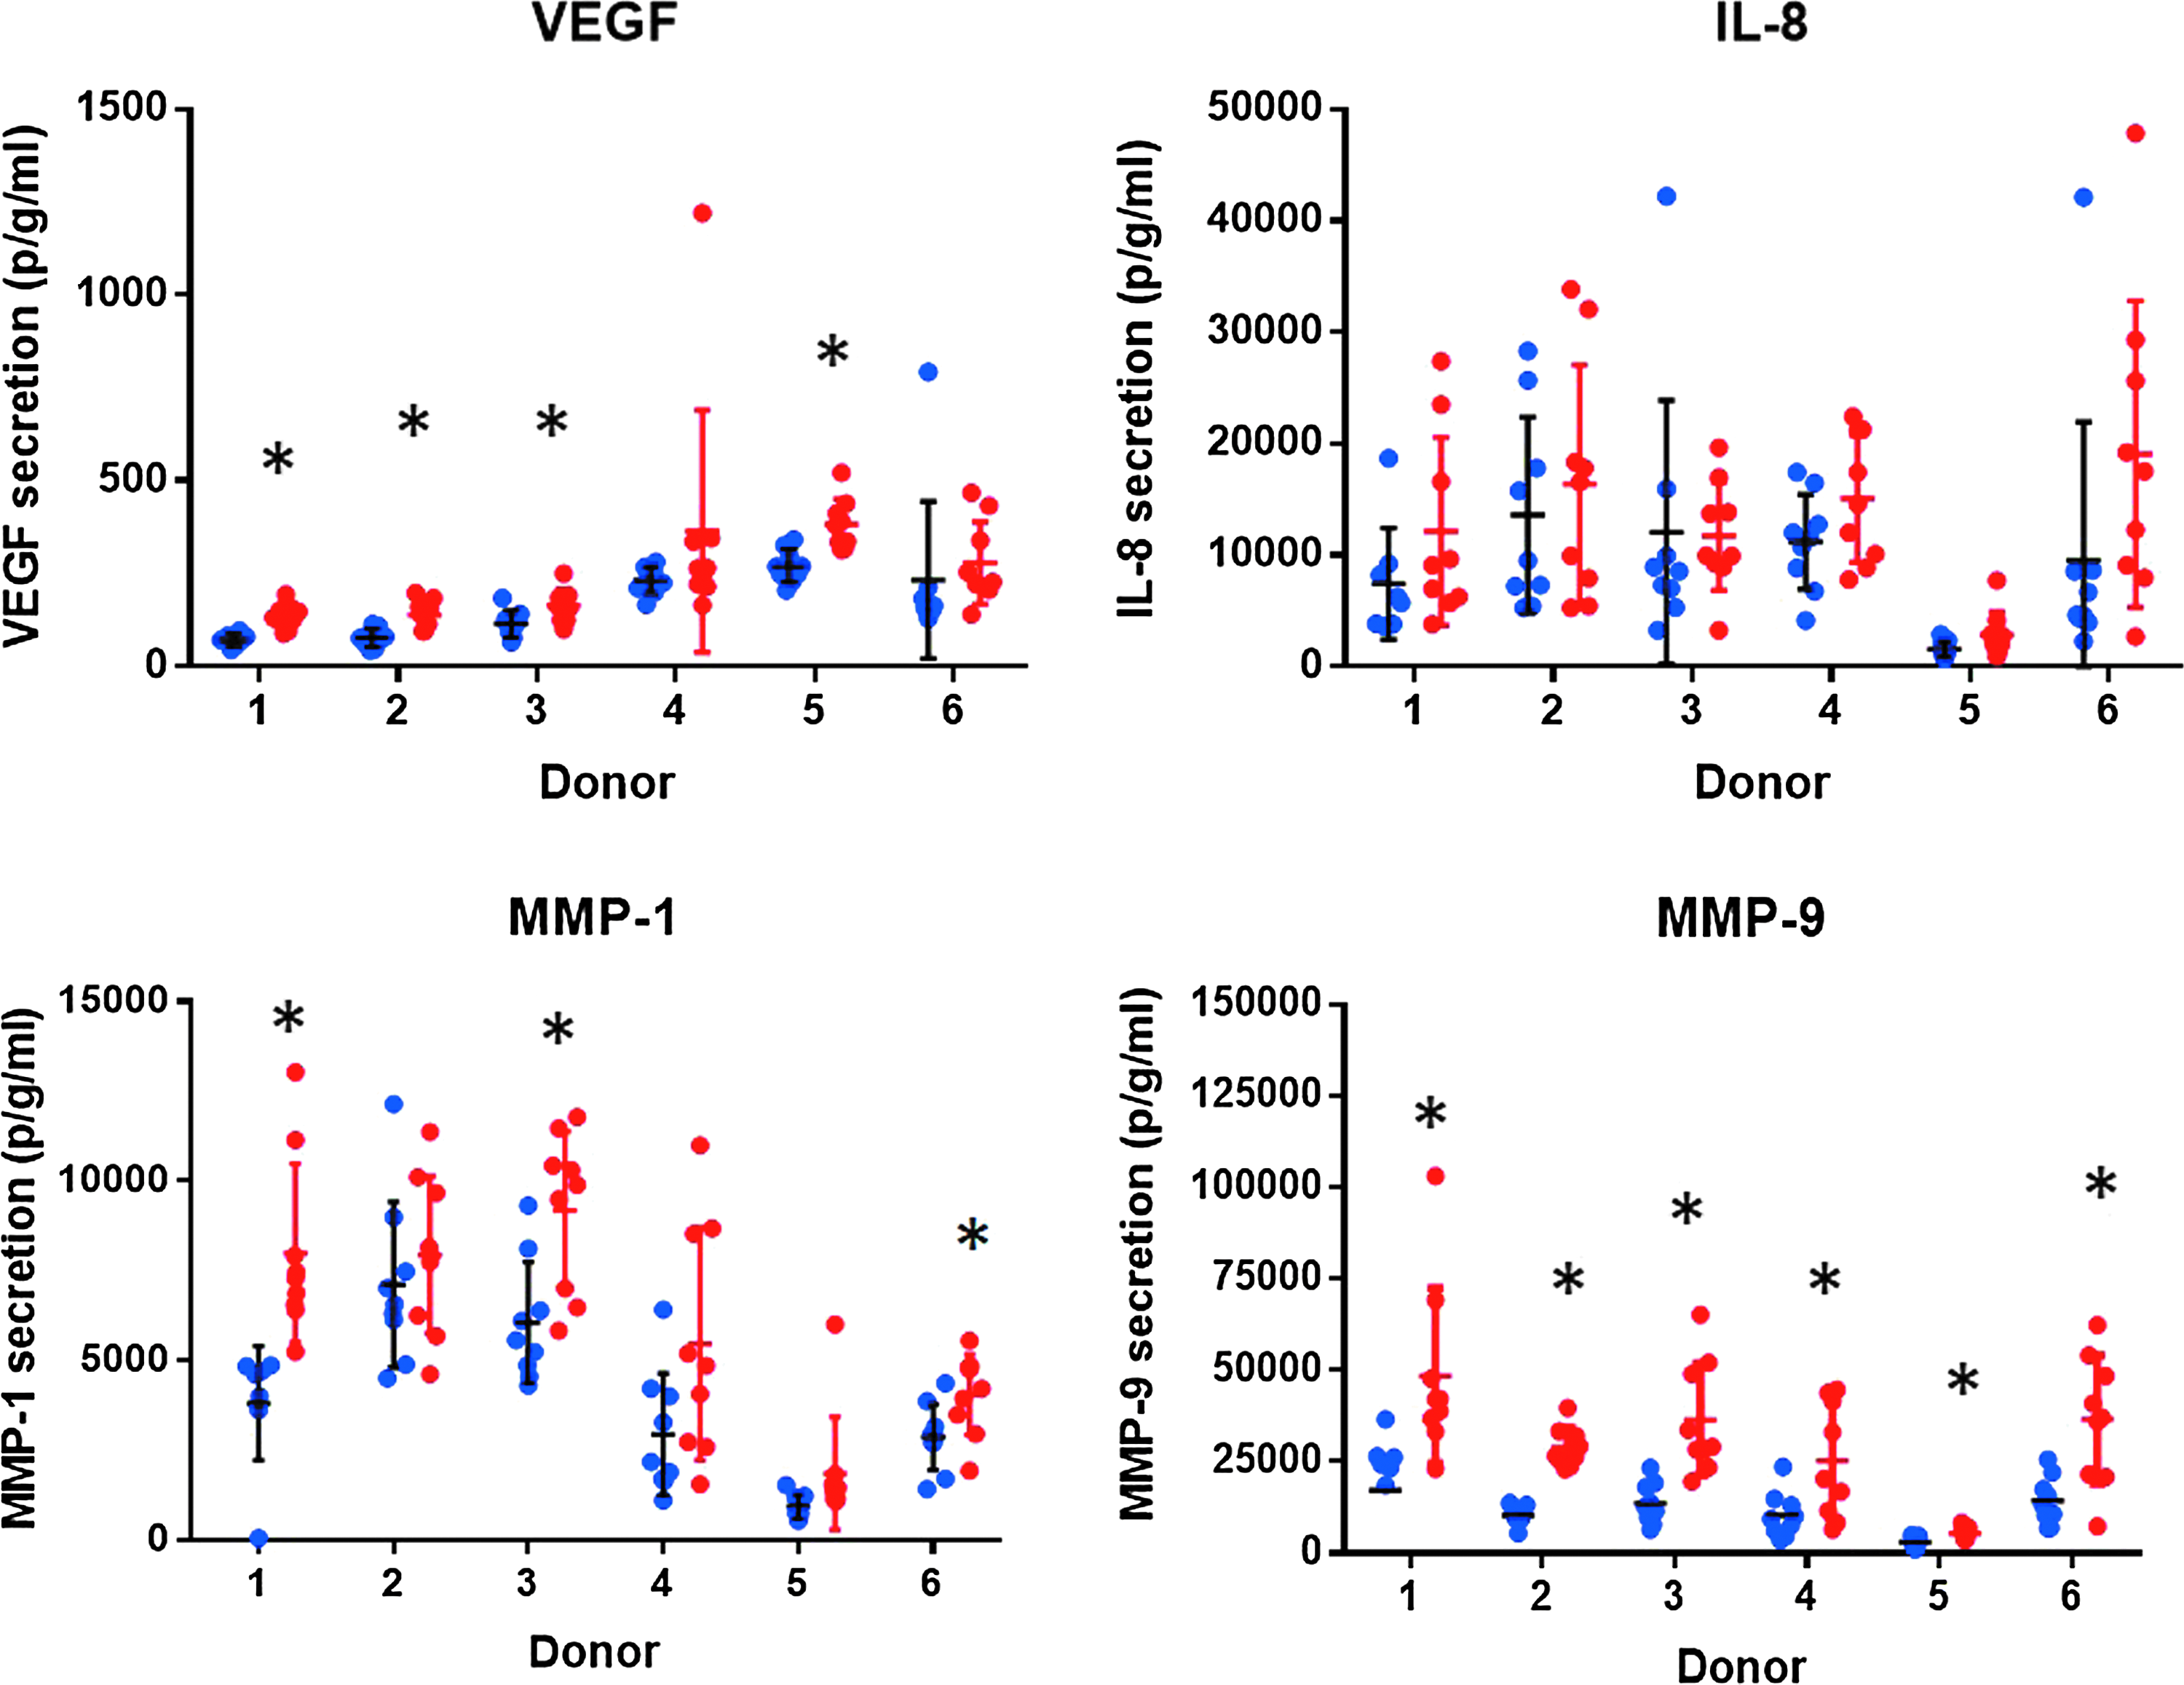
Individual value plots indicating the release of IL-8, VEGF, MMP-1, and MMP-9 measured in MucilAir™ from six individual donors 24 hours after exposure to air control and 1:20 dilution of 3R4F smoke (indicated by the blue and red dots, respectively). Each donor contains nine value points representing three individual exposure experiments and the mean of three technical replicates per experiment. Bars represent standard deviation of the mean. Statistical significance is indicated by asterisks (*p < 0.05). MMP, matrix metalloproteinase; VEGF, vascular endothelial growth factor.
Inflammatory mediator response with 3R4F and Vype ePen
The effect of smoking on inflammatory cytokines is well established, yet little is known regarding an inflammatory response caused by e-cigarettes. To compare the proinflammatory activity of the two products, we profiled the media secretion of 33 inflammatory cytokines and tissue remodeling mediators in donor 1 at 24 and 48 hours after short repeated exposure to 3R4F smoke and Vype ePen aerosol.
A strong inflammatory response was observed at 24 hours postexposure to 3R4F, with an FC of 1.5 and p < 0.05 for VEGF, IFN-gamma, IL-6, IL-8, IL-10, IL-4, IL-5, MMP-9, and IL12-p70, as shown on the volcano plot in Figure 5A. A recovery was observed at 48 hours postexposure with only MCP-1, IP-10, and MIP-1b showing a downregulation (Fig. 5C). No significant increase in mediator release was observed at 24-hour recovery to Vype ePen aerosol and only IL-12p40 was observed at 48-hour recovery at p < 0.05 and FC of 1.5 (Fig. 5B, D). Cytotoxicity measure by LDH released remained below 5% at 24 and 48 hours postexposure to both the products.
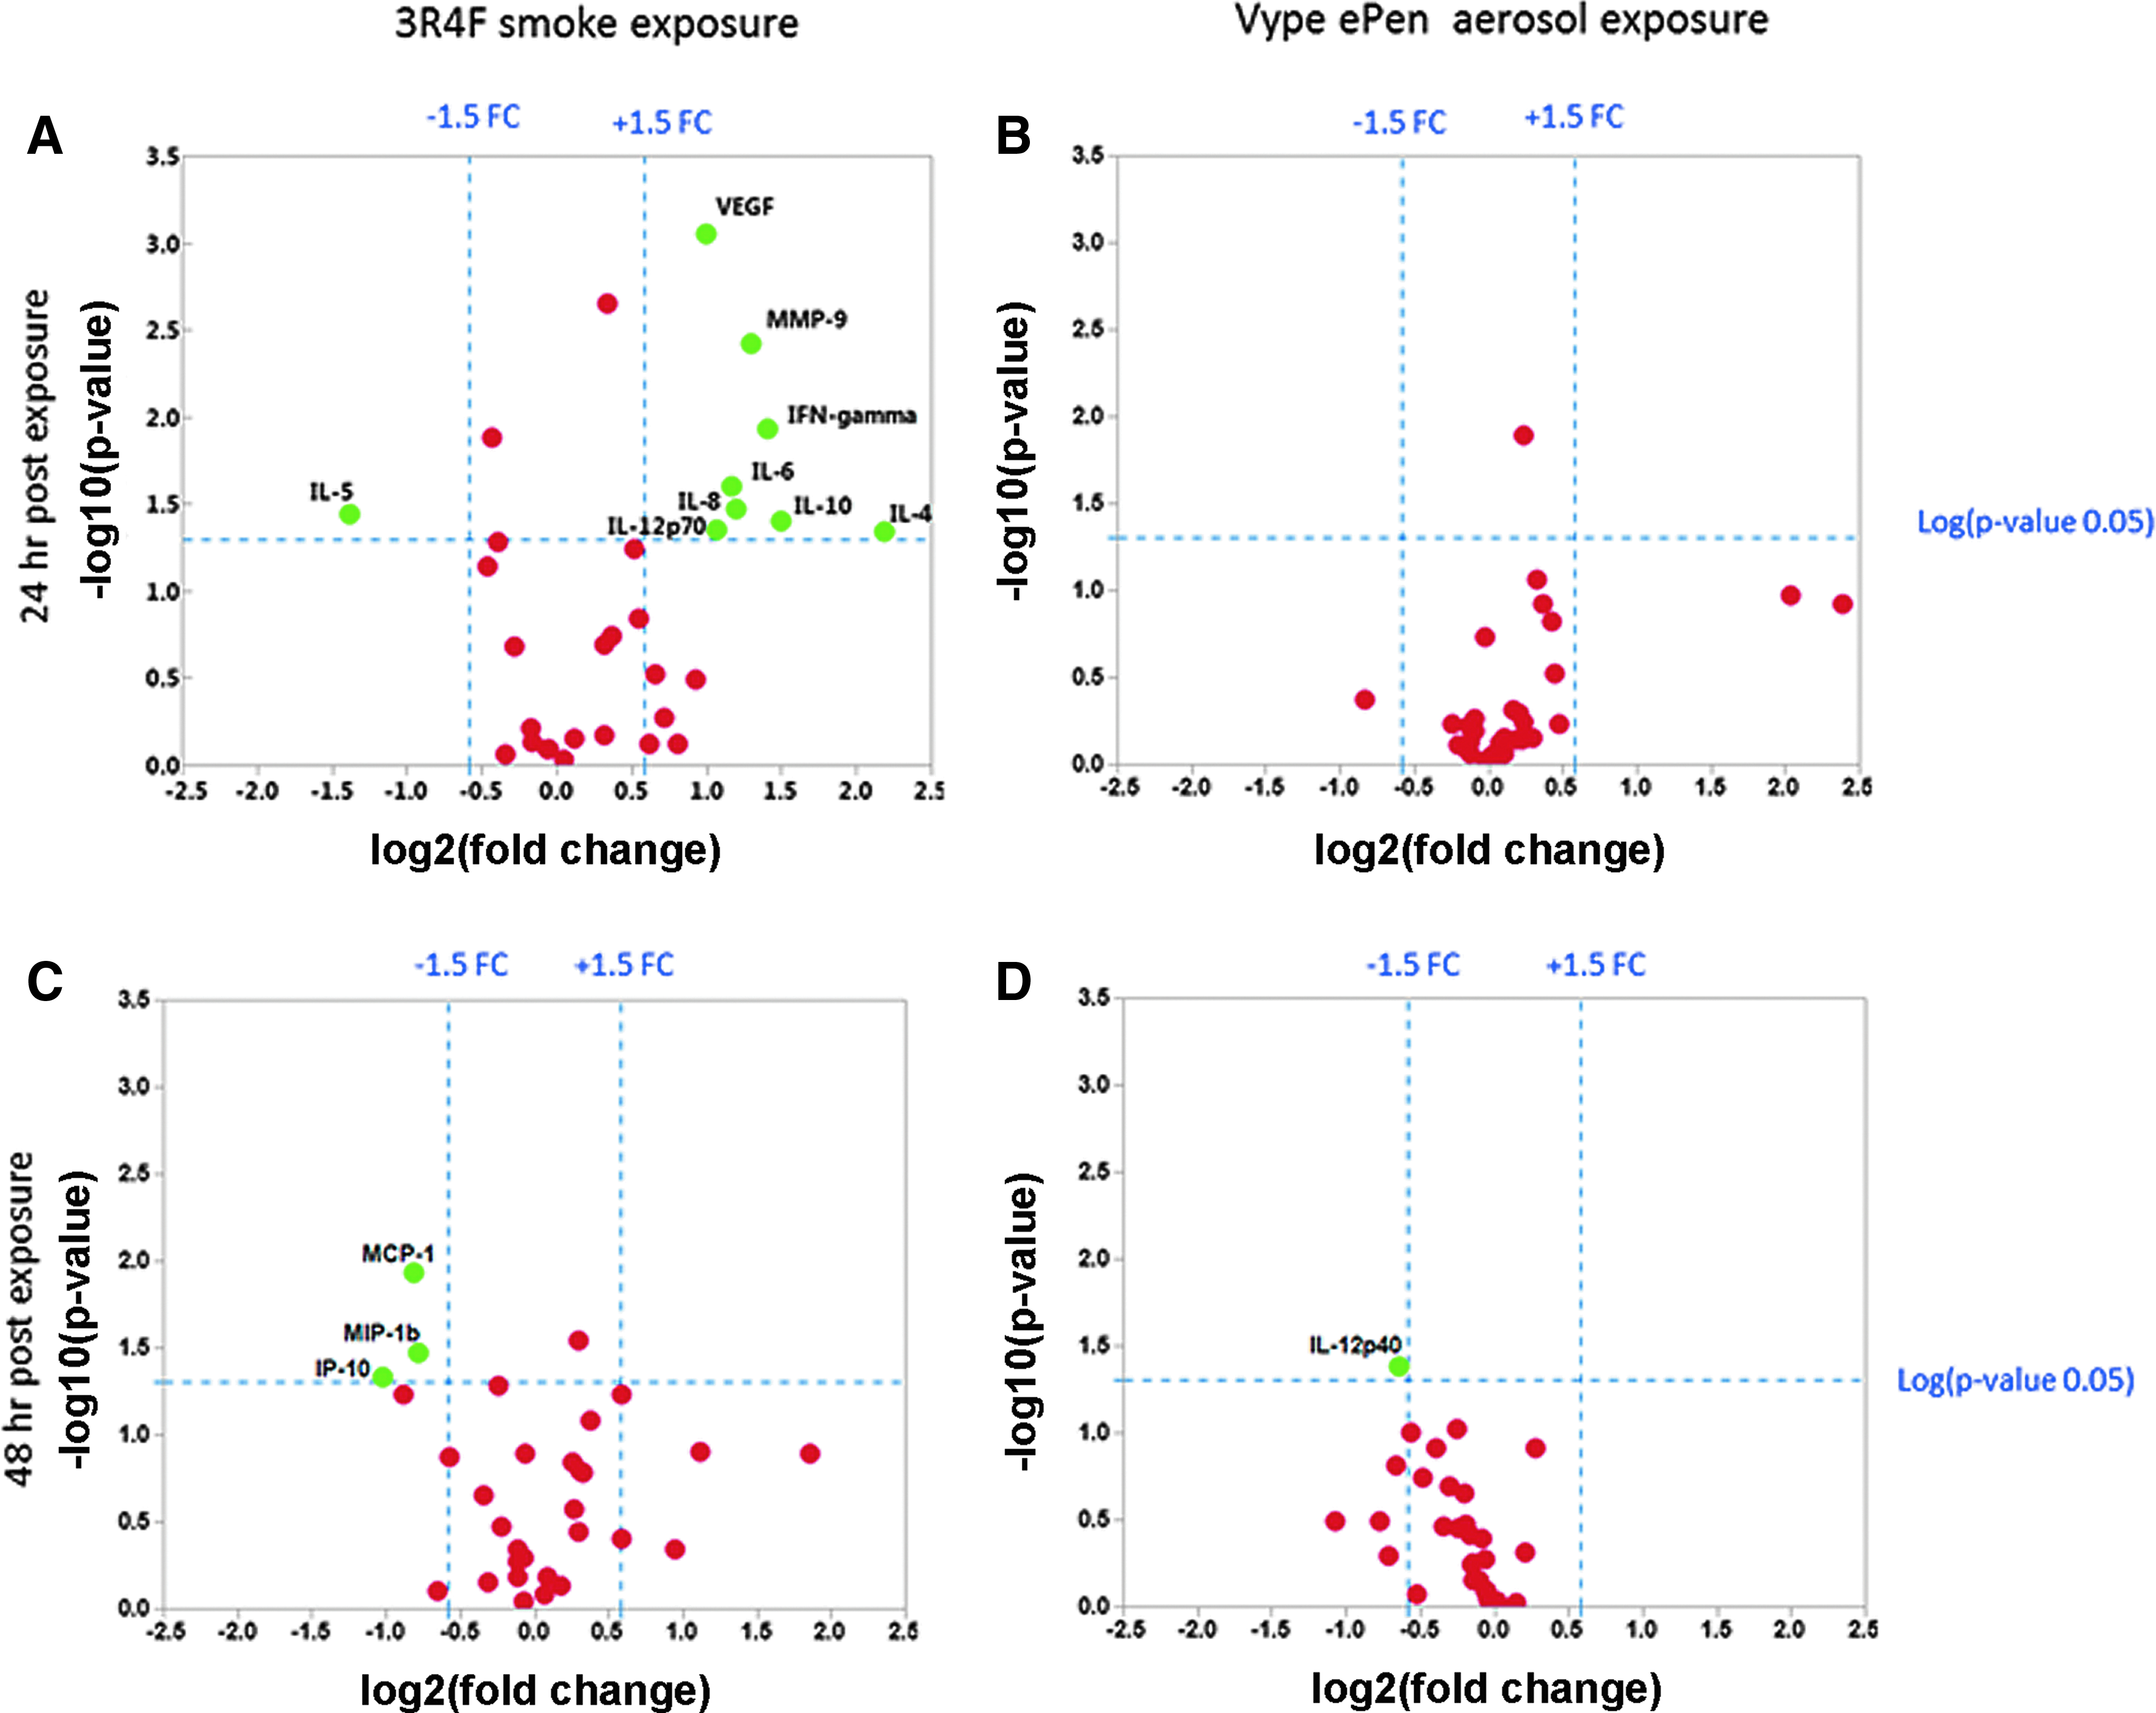
Volcano plots showing the estimated log2 (FC) against log10 (p-value) expression for a panel of 33 cytokines released from a single MucilAir donor. Left panel: Comparison of cytokine expression profiles between 3R4F smoke and air control after 24-hour recovery
Gene expression profiling
Toxicant exposure causes responses at the transcriptional level, which are informative of the type of damage or stress sustained by the cells. MucilAir inserts were exposed to 3R4F smoke, Vype ePen aerosol, and air. The exposure was conducted three times independently with three inserts for each condition for a total of 54 inserts. The RNA was extracted and expression profiling was performed using massive parallel RNA-seq. The 54 RNA sequencing files were processed and subsequently QCed. For RNA-seq, one Vype ePen sample at 48 hours postexposure was rejected due to substandard sequence quality. The RNA-seq data were aligned to the human genome (GRCh38) using STAR aligner and 44,184 RNA species, including mRNAs and noncoding RNAs were utilized for statistical analysis.
A series of six group-wise comparisons were undertaken to identify statistical differences (FCs and differential splicing) between the products exposure relative to air control. Comparison 1 to 4 included air versus 3R4F at 24 and 48 hours and Vype ePen versus air at 24 and 48 hours. Comparisons 5 to 6 were conducted for air versus 3R4F, and air versus Vype ePen adjusted for postexposure recovery time (24- and 48-hour results pooled). The number of differentially expressed RNAs and alternative splicing identified by linear modeling applying a p-value threshold p < 0.01 and an FC >1.5 are shown in Supplementary Table S1 (Supplementary Data are available at www.liebertpub.com/aivt). RNAs that were significant using the Benjamini–Hochberg false discovery rate (FDR) p-values were only observed when the data were adjusted for postrecovery incubation time (Supplementary Table S2 and Fig. 6A, C, E).
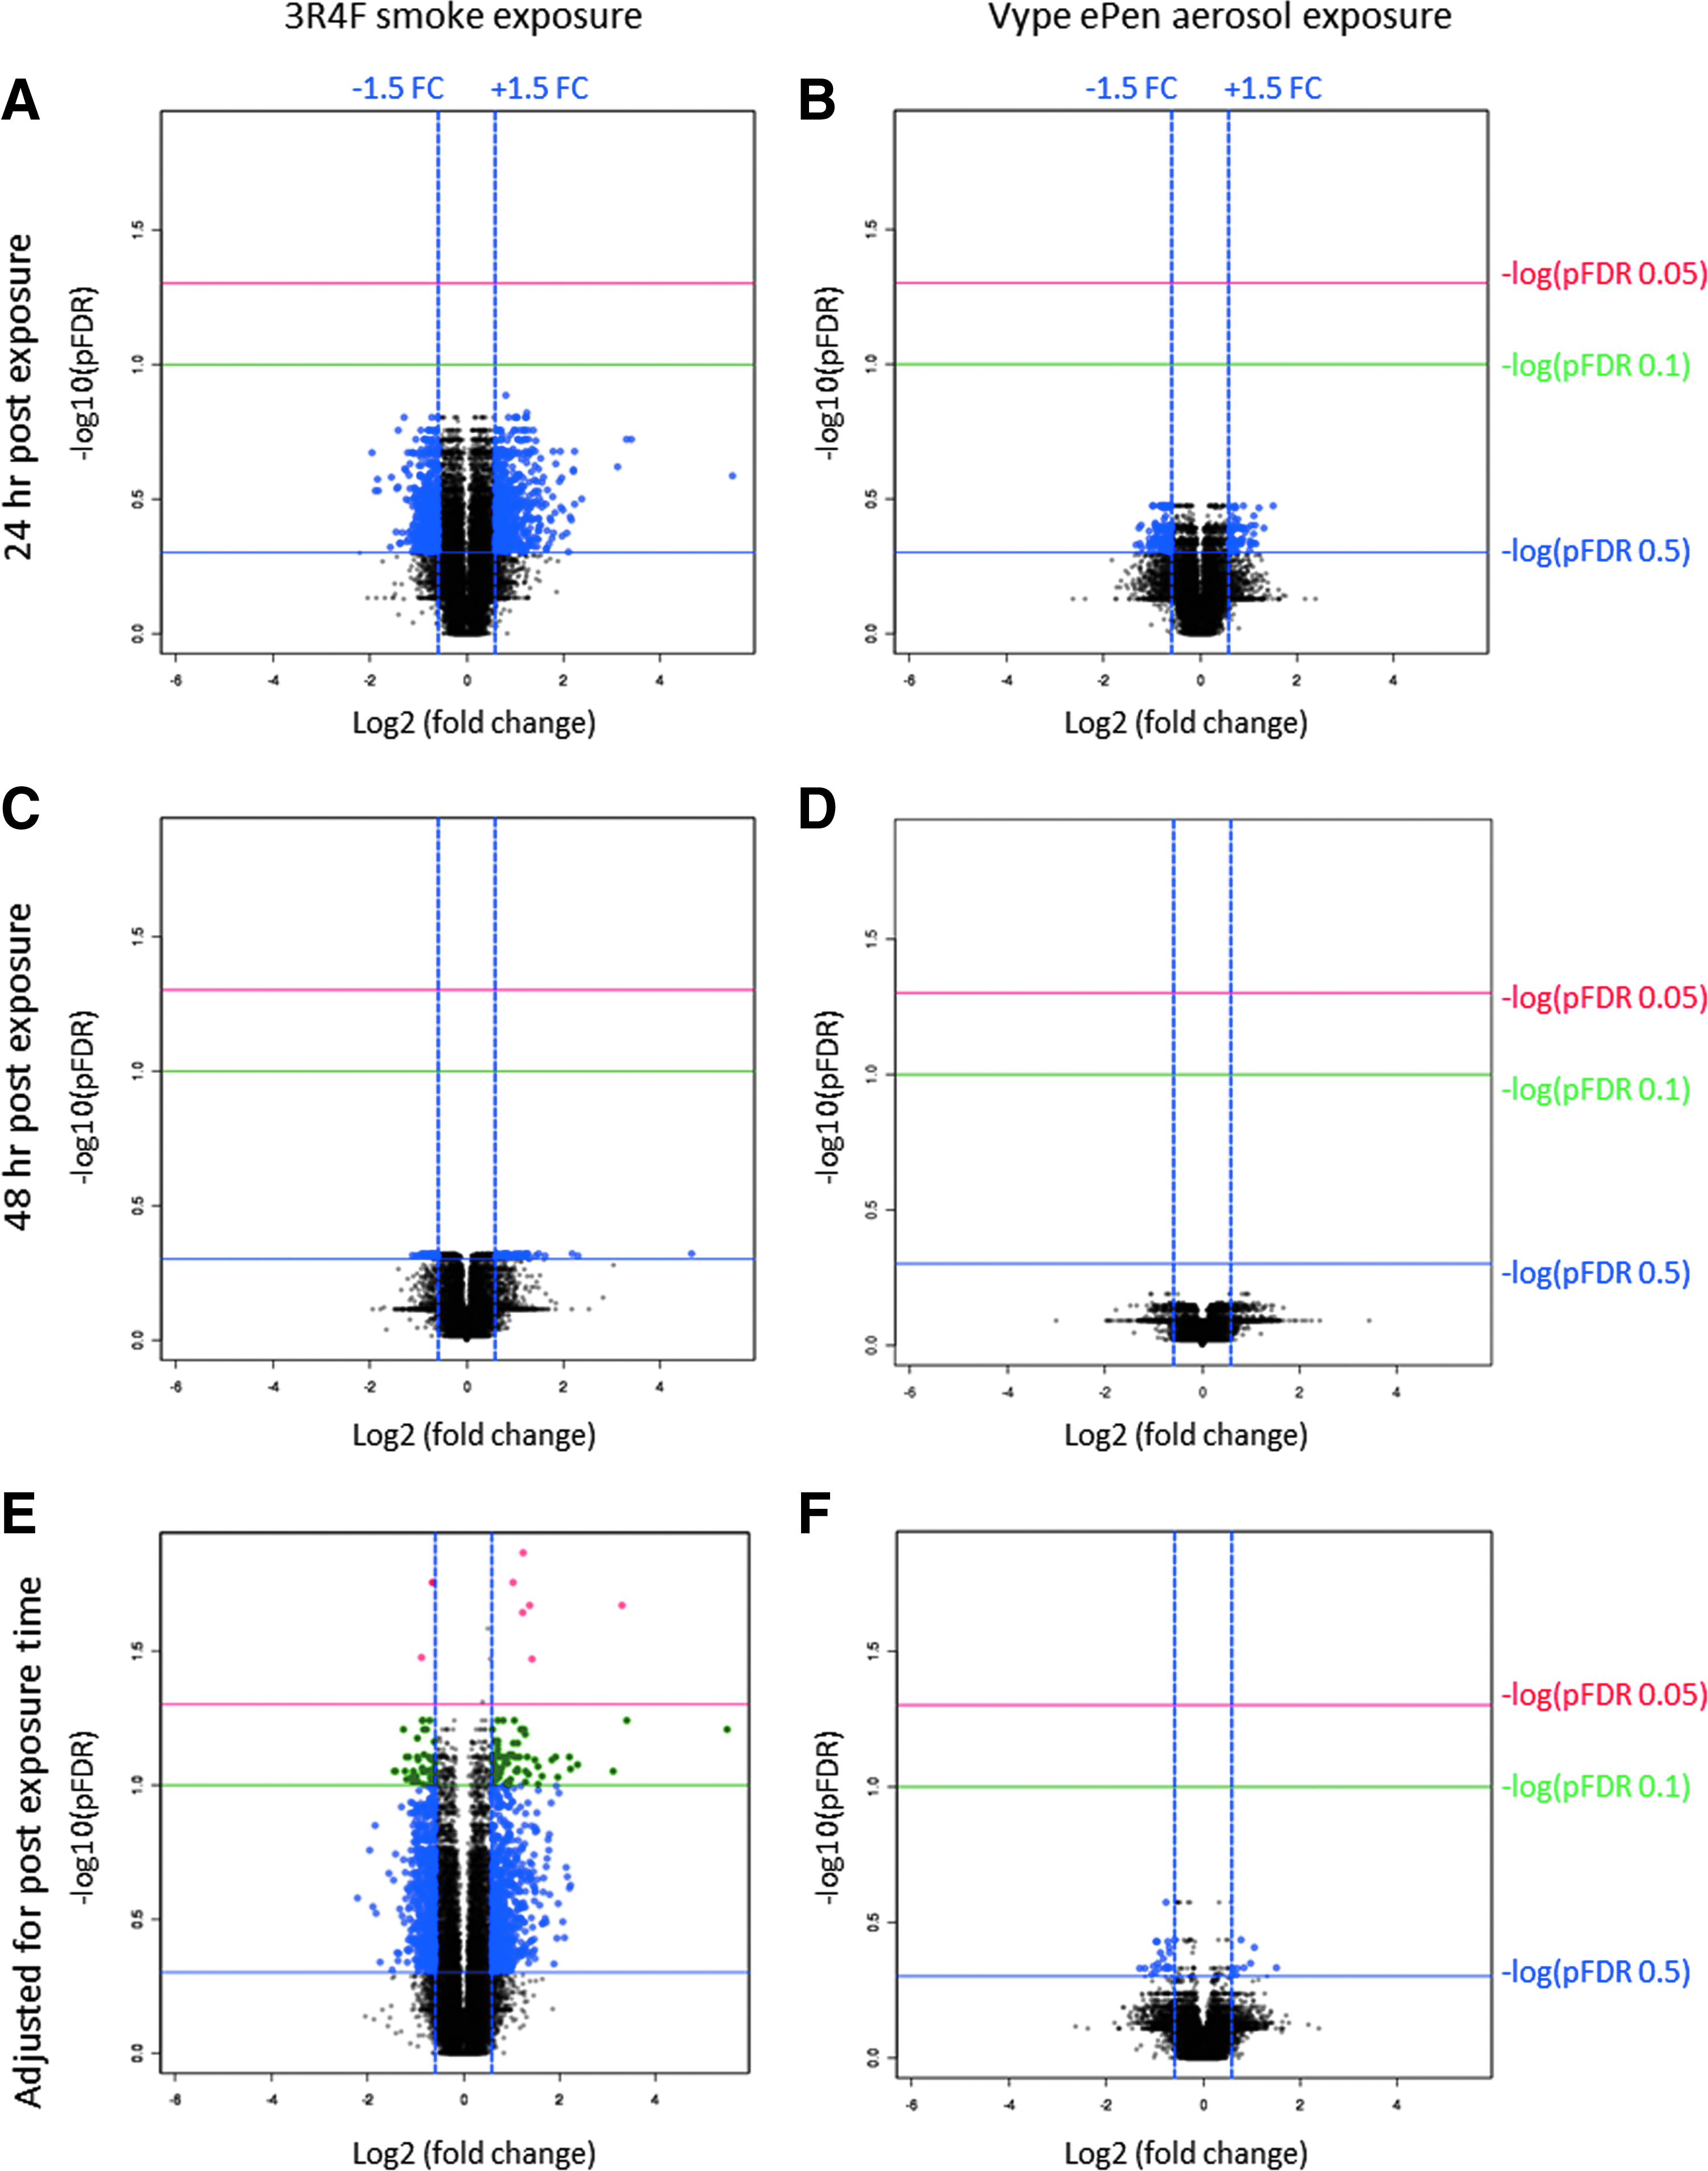
Volcano plots of -log10 (p-value) versus log2(FC) for genes exposed to 3R4F smoke (left panel) and Vype ePen aerosol (right panel) that are significant at adjusted pFDR <0.05 (red), pFDR <0.1 (green), or adjusted pFDR <0.5 (blue). The vertical parallel blue line indicates the FC in log2 scale equivalent to absolute 1.5 FC. The differential gene expression is represented for 24 hours
A total of 9 and 123 differentially expressed RNAs were identified for 3R4F exposure with an FC >1.5 and using the statistical cutoff pFDR <0.05 and <0.1 (Benjamini–Hochberg), respectively (Fig. 6E and Supplementary Table S2A). No differential RNA expression was identified for Vype ePen using a pFDR <0.1 (Fig. 6B, D, F). When the FDR was increased to 0.5, allowing up to 50% of hypothesis rejected incorrectly, 29 genes were differentially expressed with Vype ePen (Supplementary Table S2B and Fig. 6F). Out of those 123 genes identified with 3R4F and 29 genes identified with Vype ePen, a few were pseudogenes, antisense, uncharacterized, or noncoding RNAs (23 and 17, respectively, for 3R4F and Vype ePen (gene list provided in Supplementary Tables S2A, B). No differentially expressed splice variants were observed for either product at pFDR <0.1/FC >1.5 (Supplementary Table S1). These results were comparable to the less stringent Storey false discovery rate (qFDR) method at qFDR <0.1/FC >1.5.
Gene validation by qRT-PCR
Of the 123 RNAs differentially expressed after 3R4F smoke exposure (pFDR <0.1) (Supplementary Table S2A), 100 were coding mRNAs and 71 could be confirmed to be regulated by cigarette smoke by literature search, leaving 29 candidates for reconfirmation by qRT-PCR (Supplementary Table S3). Of those 29 genes, 18 were selected based on a ranking of the larger FCs reported by RNA-seq for further qRT-PCR validation performed, using samples from three new independent experimental replicates with triplicate samples. Another two genes (HMCN1, LFNG) reported as responsive to cigarette smoke exposure were also selected as controls for the qRT-PCR. The qRT-PCR results confirmed the up- or downregulation of 12 genes in the 24–48-hour period after MucilAir exposure to 3R4F smoke (p < 0.05, FC >1.5). Two genes were upregulated and 10 genes were downregulated (Fig. 7A, C and Supplementary Table S4). Ten genes, including the two control genes already confirmed by literature search, were in agreement with the response observed by RNA-seq. Two genes, TMEM182 and AS3MT, were downregulated in the qRT-PCR experiments (Supplementary Table S4) and were upregulated in the RNA-seq experiments (Supplementary Table S2A).
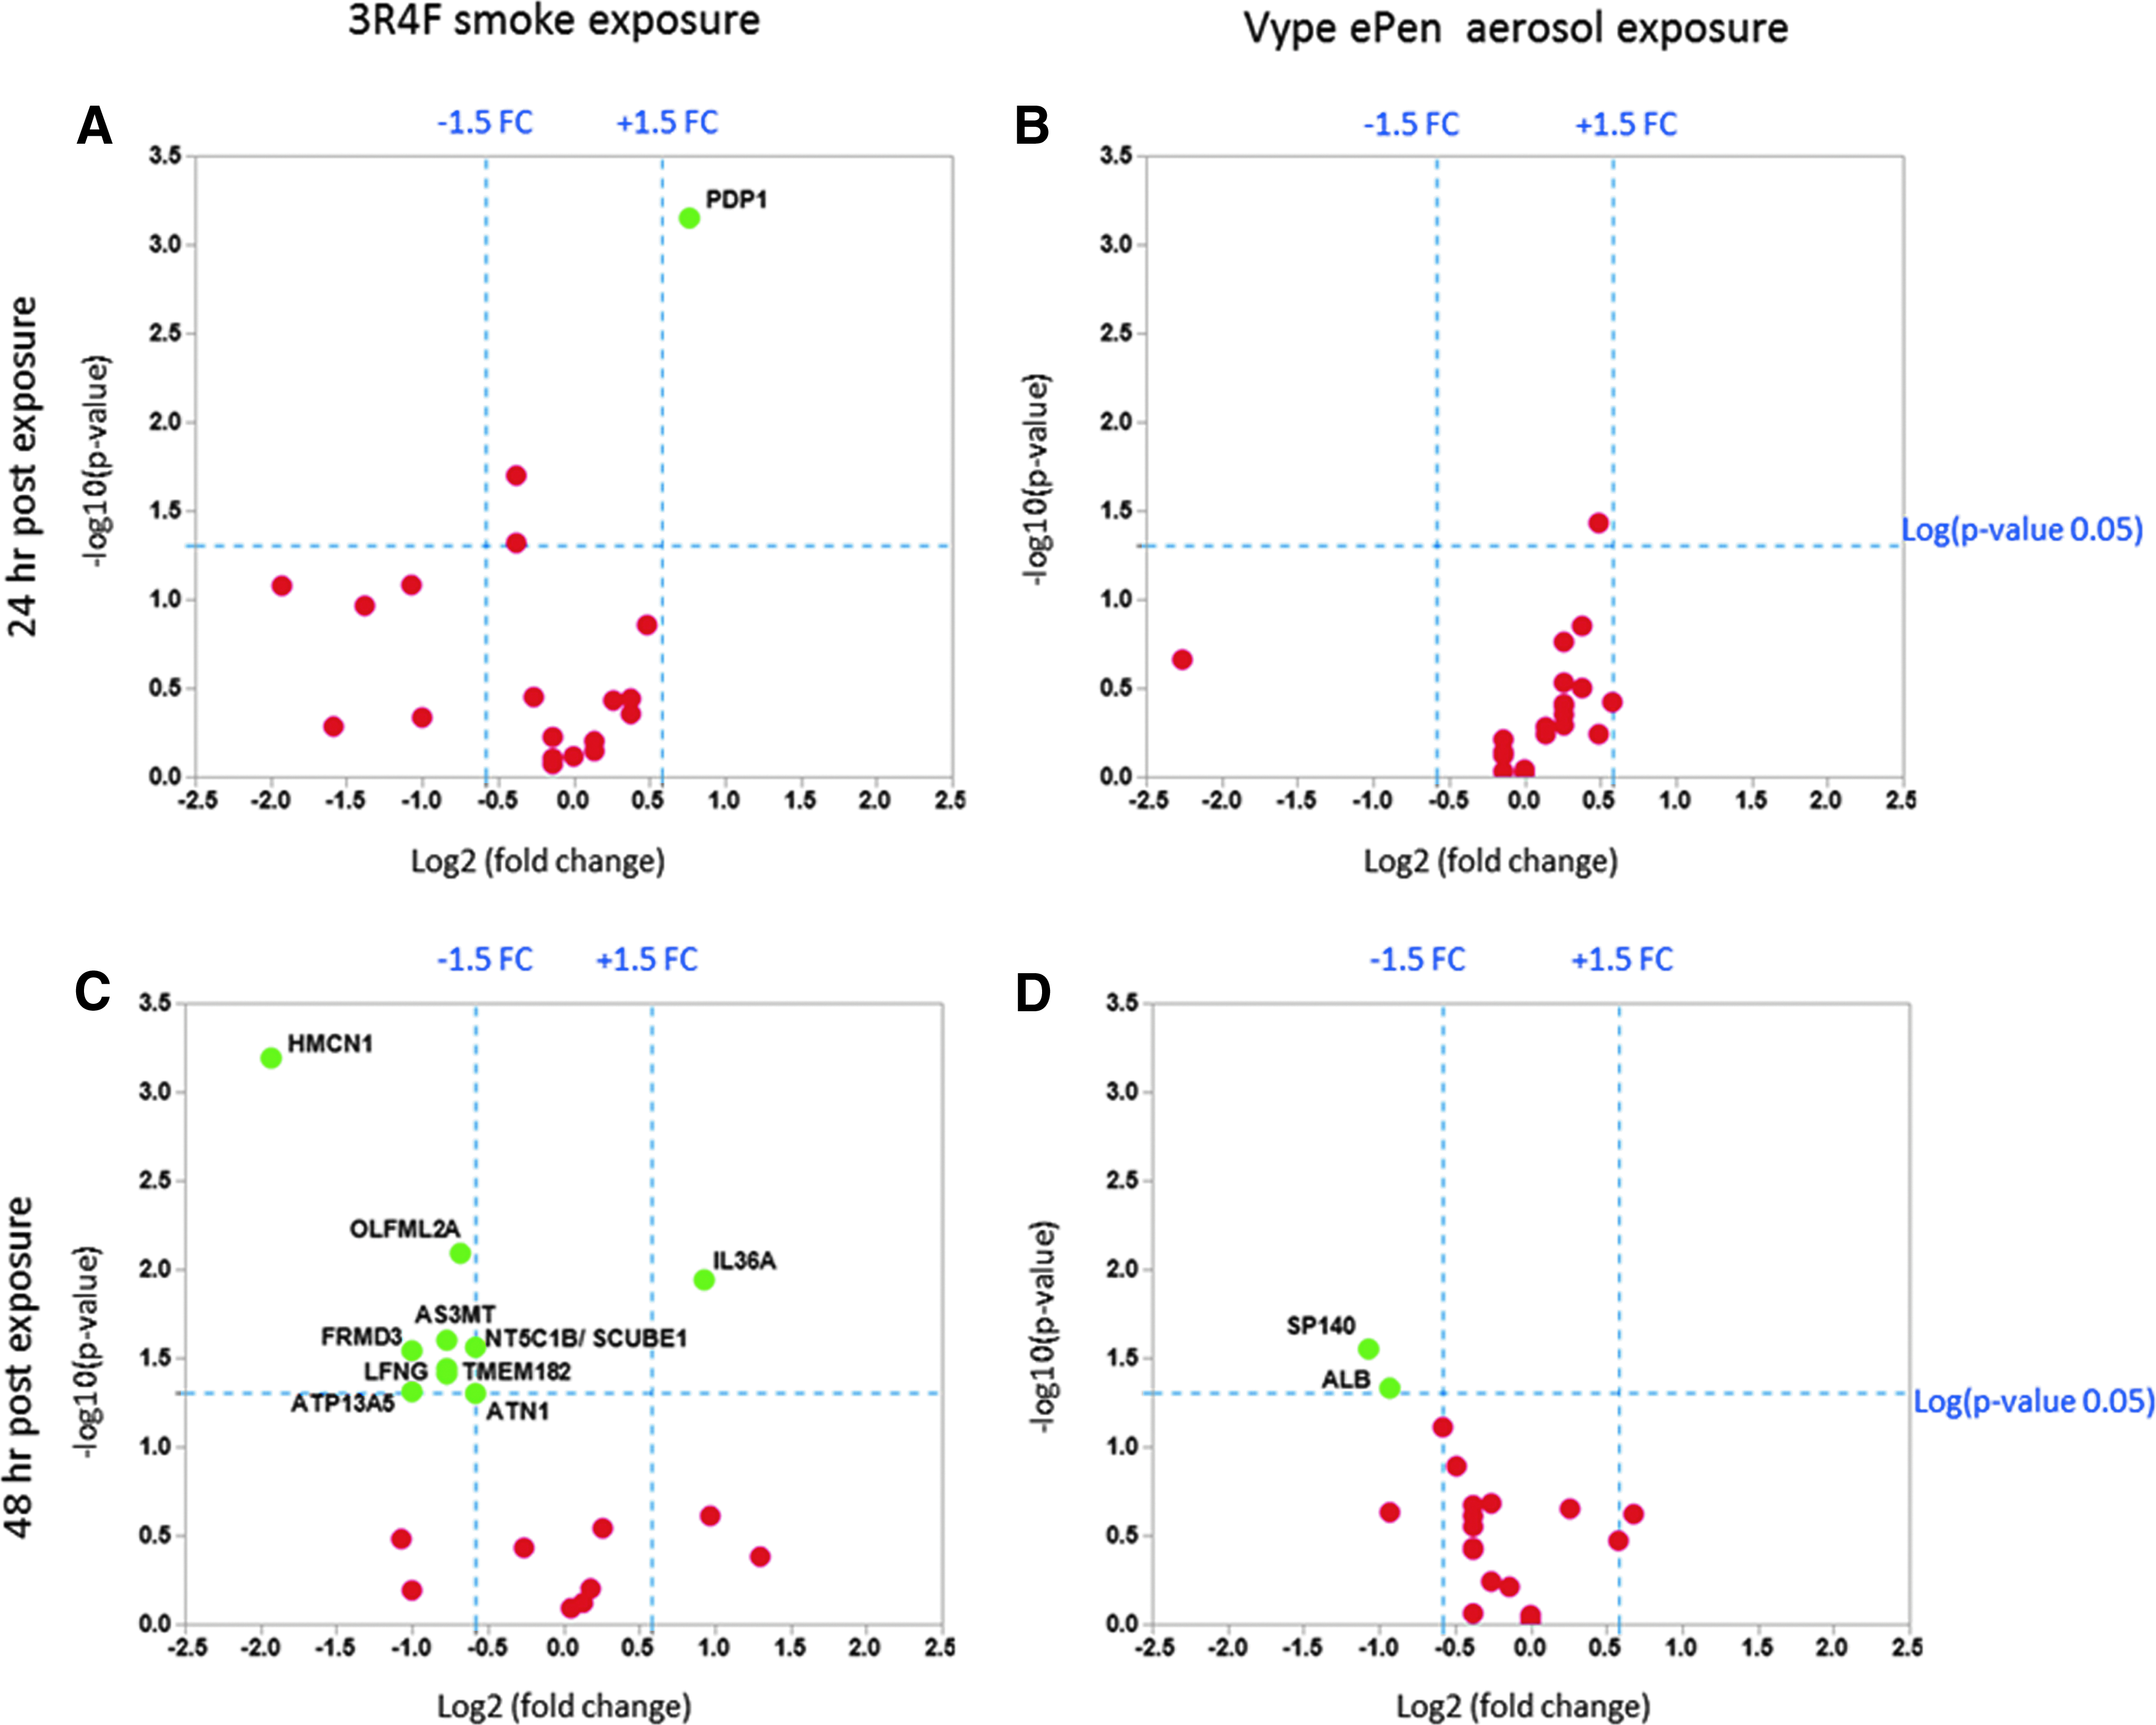
Volcano plots showing the estimated log2 (FC) against log10 (adjusted p-value) expression for a panel of genes selected for qRT-PCR validation. Twenty genes were selected from the 3R4F RNA-seq data set and another panel of 20 genes was shortlisted from the Vype ePen RNA-seq data set. Left panel: Comparison of gene expression profiles between 3R4F smoke and air control after 24 hours
qRT-PCR validation was also conducted on a set of 20 genes selected based on the Vype ePen RNA-seq data. Of the 29 RNAs potentially regulated by exposure to Vype ePen aerosols (at pFDR <0.5), 17 were noncoding RNAs and 12 were protein coding genes with insufficient literature to substantiate their regulation by e-cigarette exposure (Supplementary Table S2B). To obtain a larger set of coding mRNAs to test by qRT-PCR, we relaxed the pFDR threshold to <0.6 and selected eight more candidates that showed the largest FC differences compared to air controls (Supplementary Tables S2B and S4). Of these 20 selected Vype ePen candidates, 60% were estimated to be false positives based on the pFDR. ALB and SP140 could be confirmed as differentially expressed after exposure to Vype ePen from three experiments performed independently with triplicate samples (Fig. 7D). Both SP140 and ALB were downregulated (Supplementary Tables S2B and S4 and Fig. 7D), which overall support the limited response observed so far for Vype ePen aerosol exposure.
GO enrichment analysis and in vitro, in vivo comparison
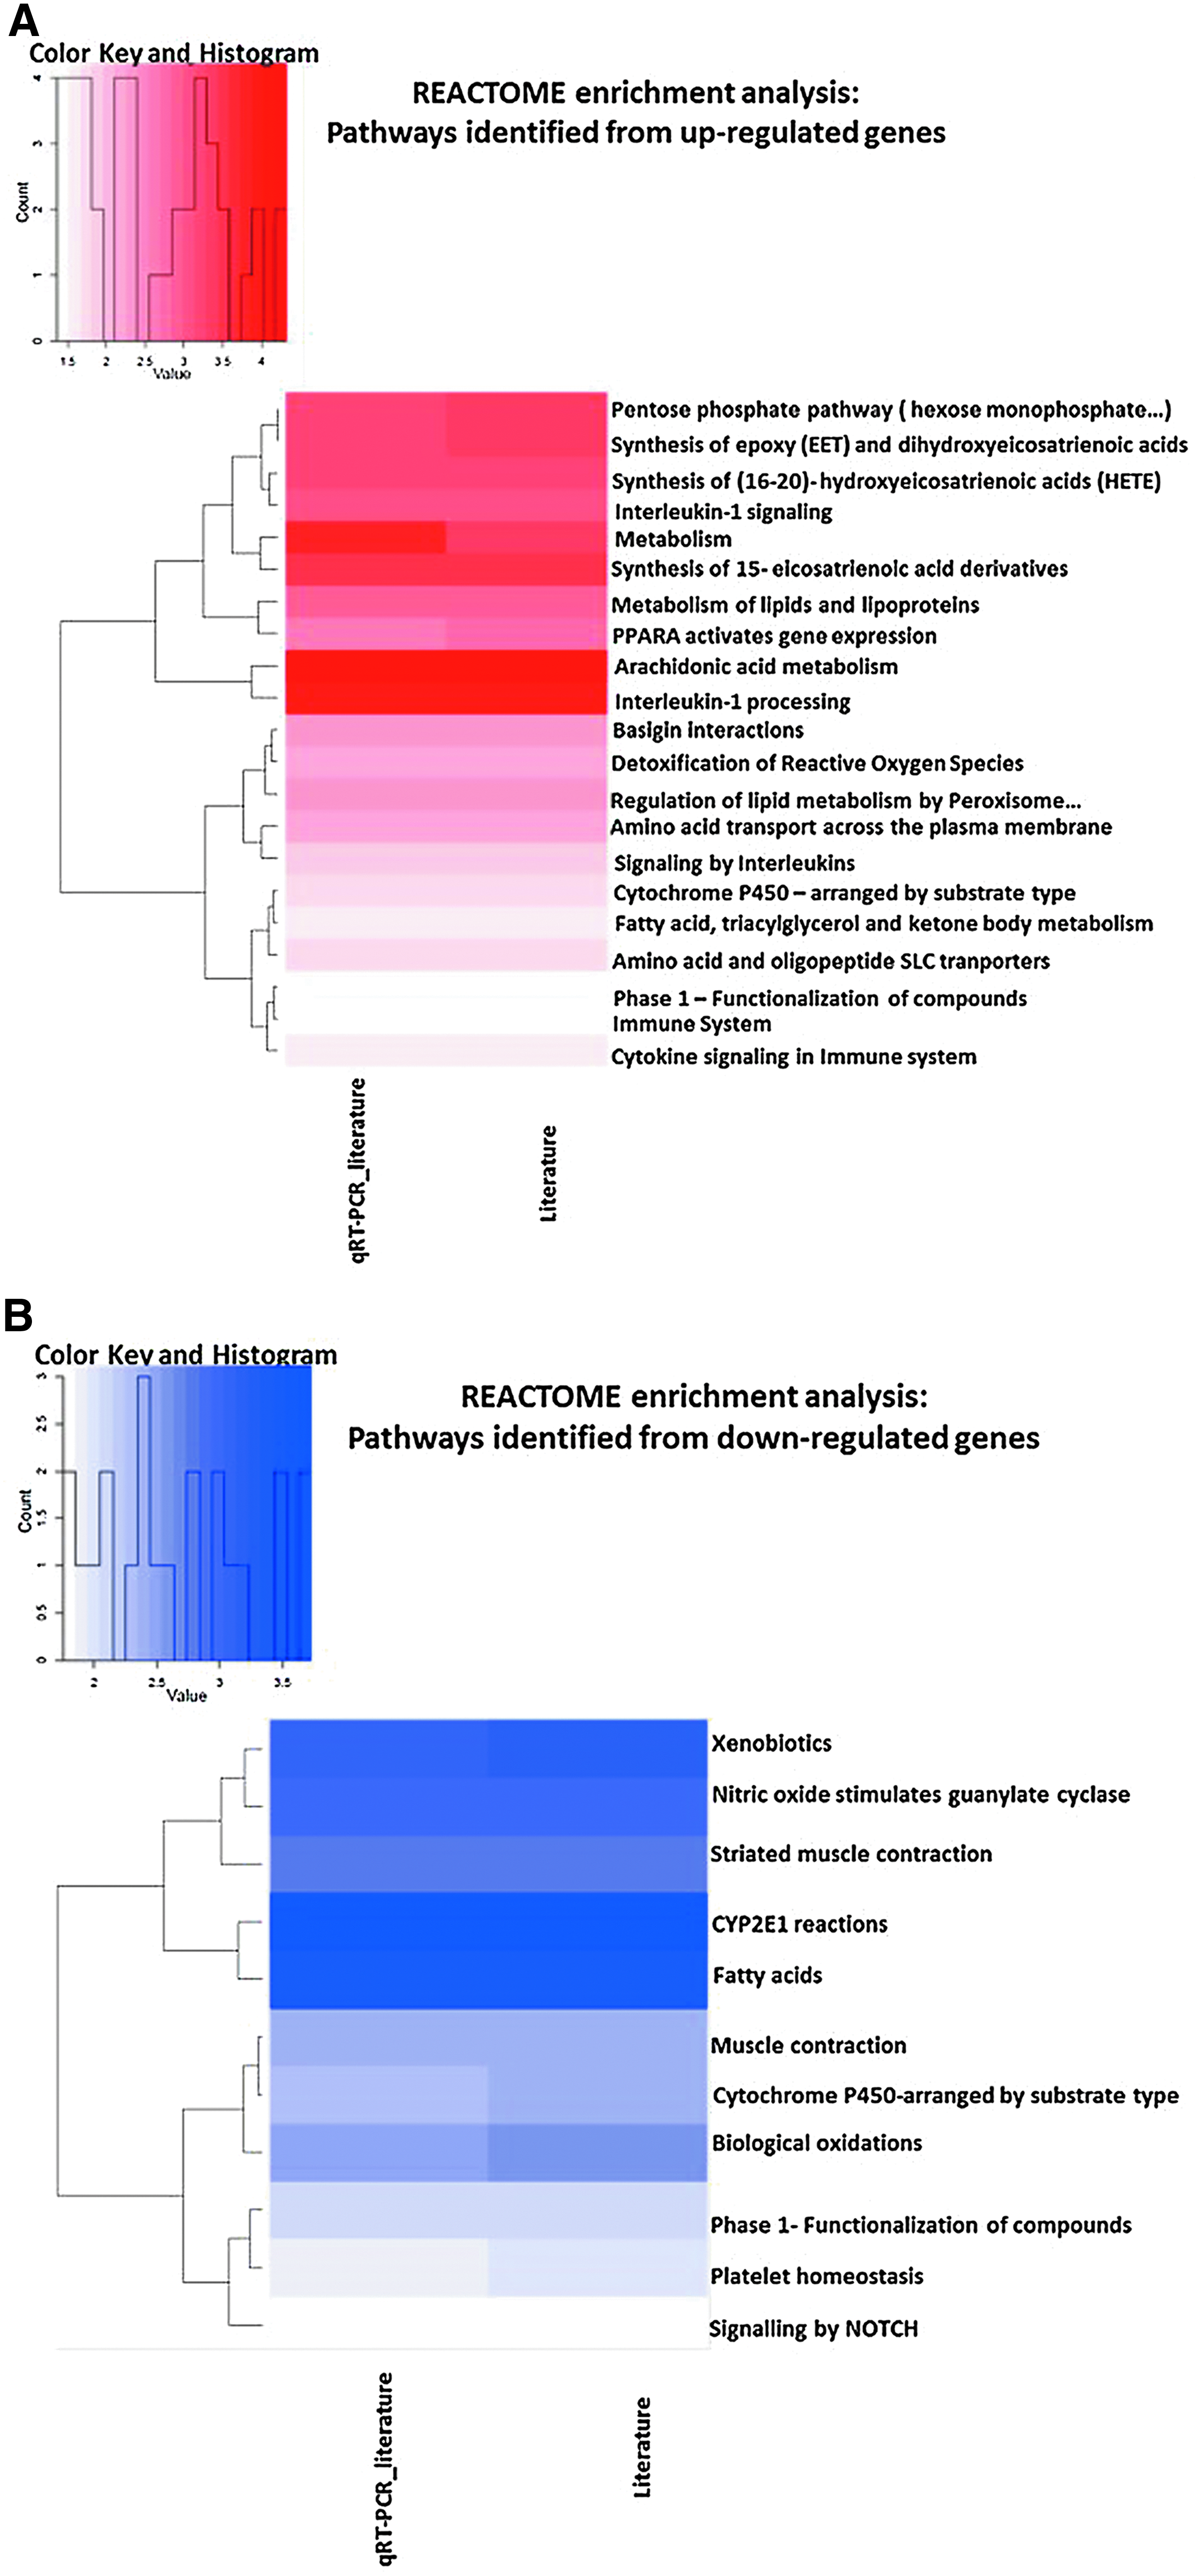
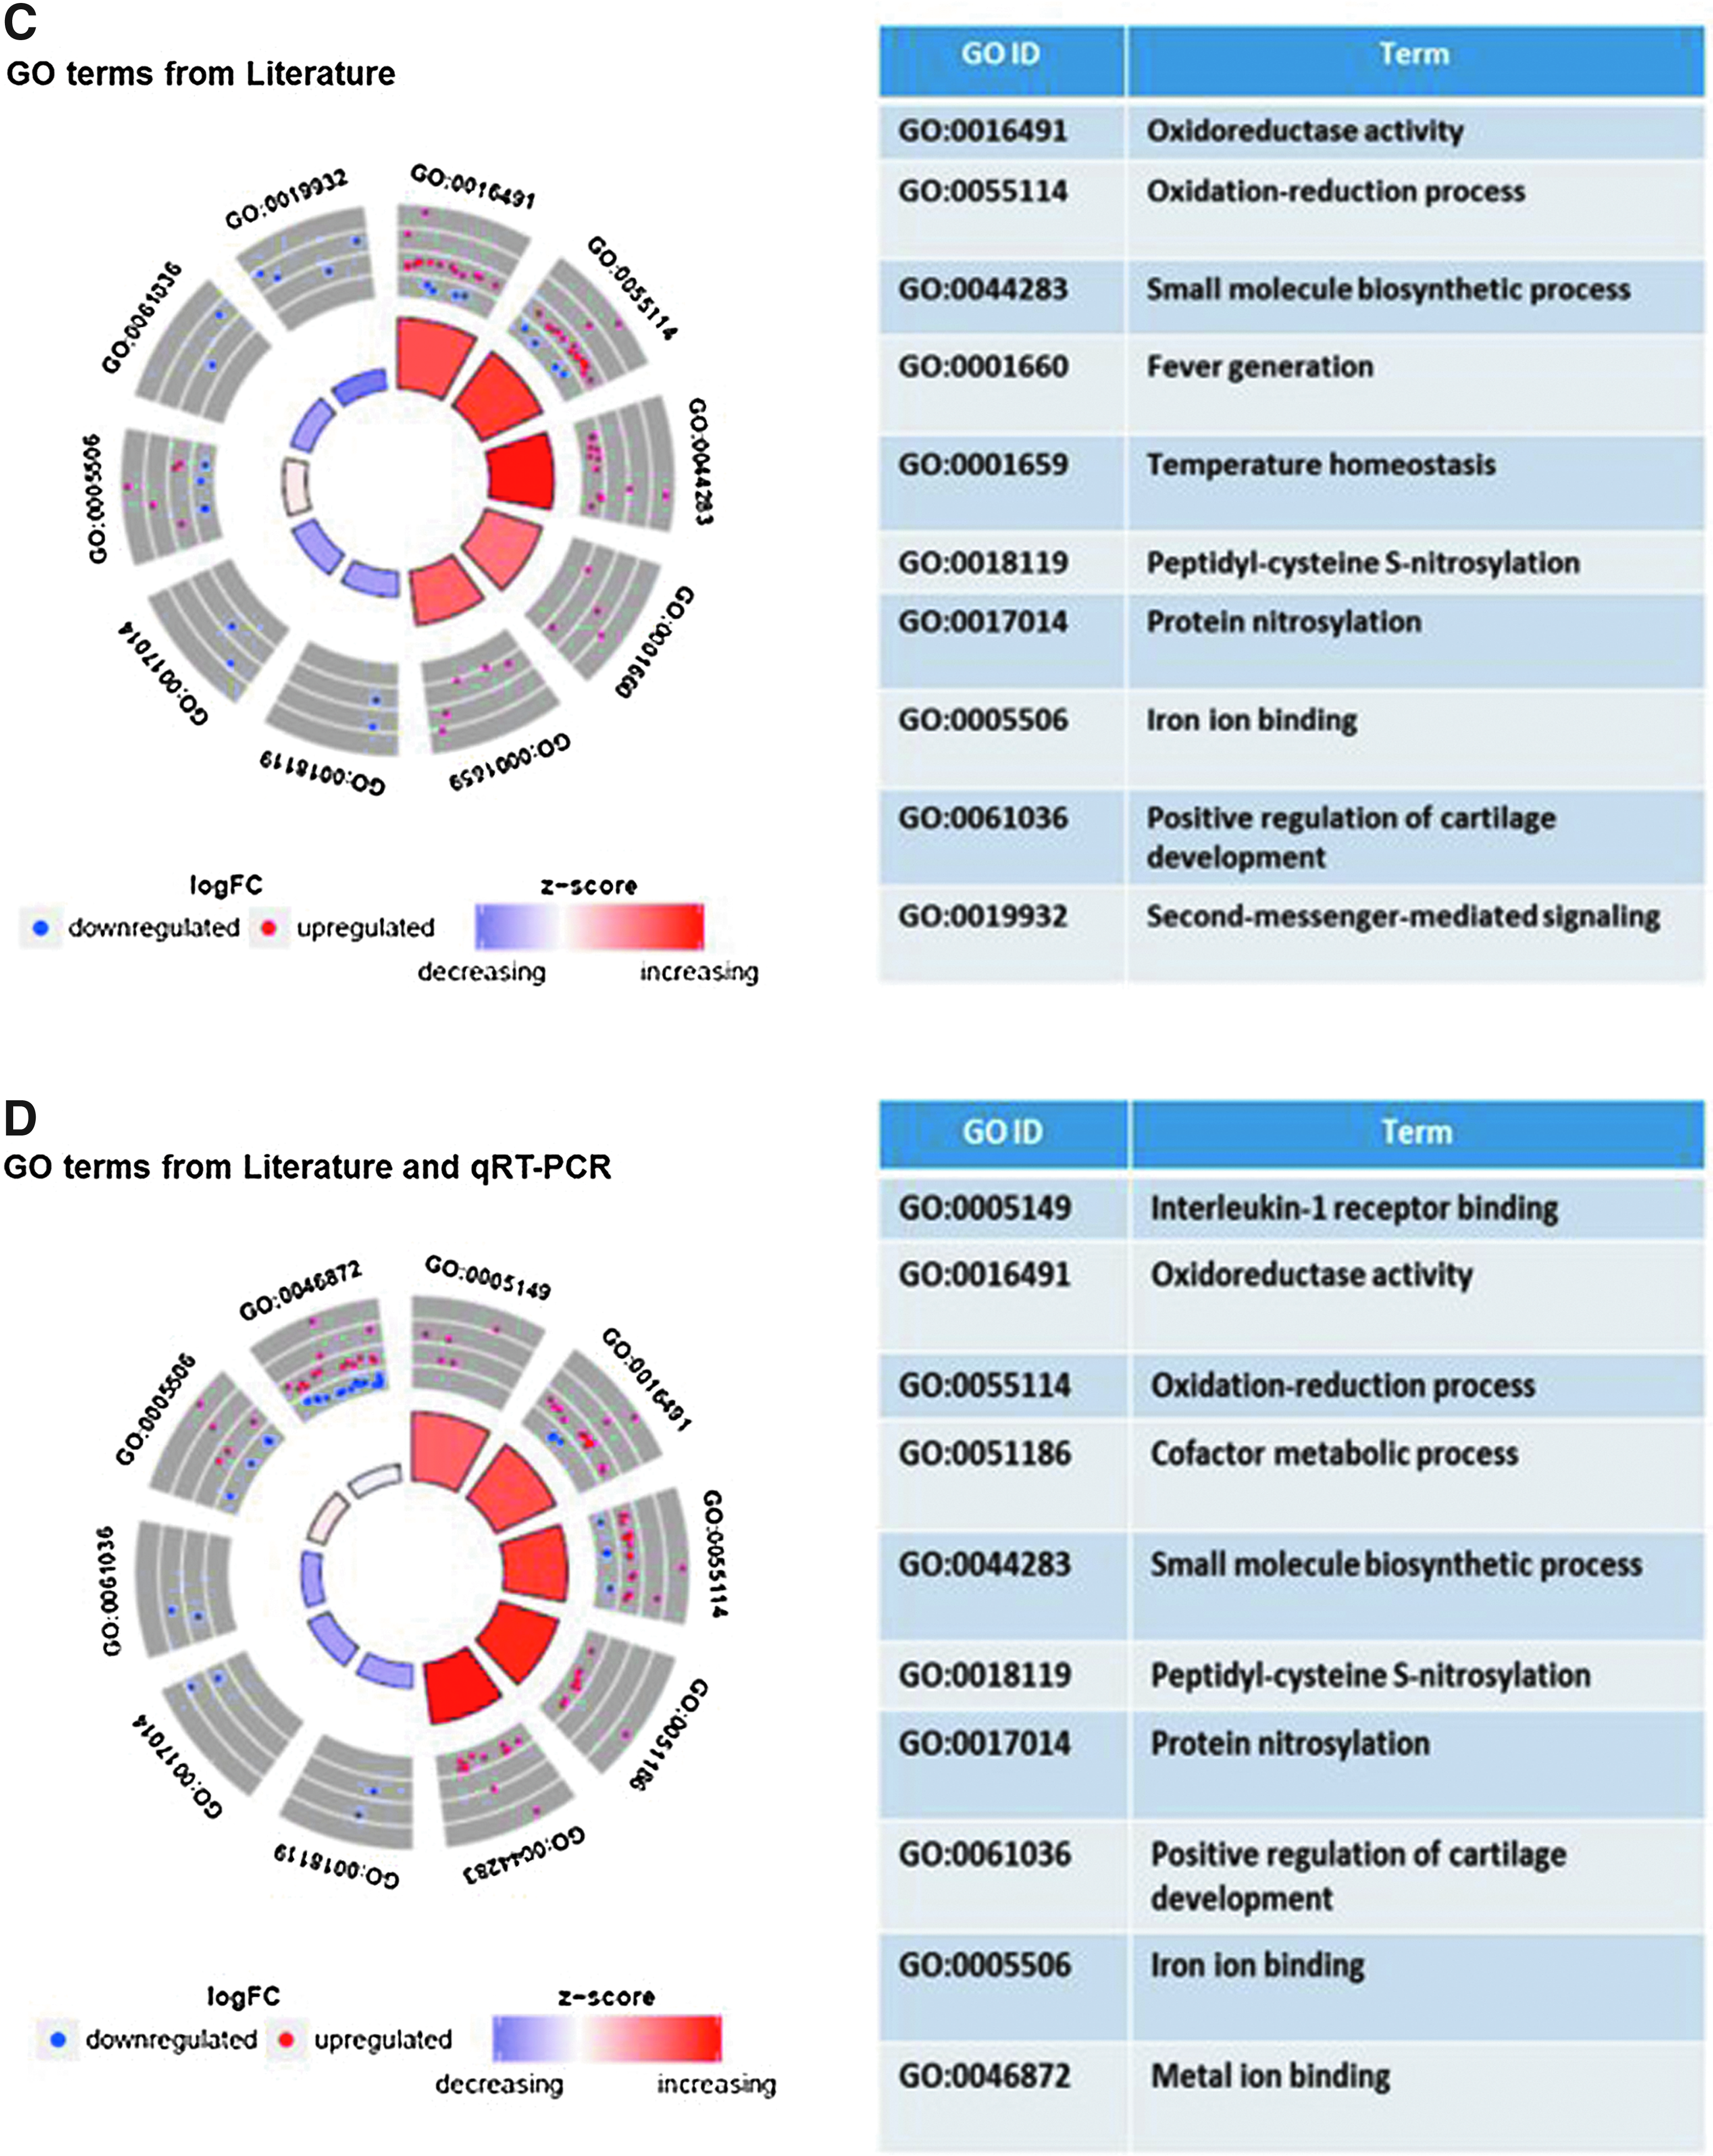
To investigate the biological functions potentially affected by short repeated exposure of MucilAir to 3R4F smoke, we performed an enrichment analysis for Reactome and GO terms using a hypergeometric test. One enrichment analysis was conducted with the responsive genes (pFDR <0.1, FC >1.5) that were confirmed based on literature search only (71 genes), and a second analysis was performed with the inclusion of the genes confirmed by qRT-PCR (71 literature genes +8 qRT-PCR genes). The cytokine data were not included in the enrichment analysis as it was considered that this focused panel of inflammatory mediators would bias the enrichment toward inflammation. Enrichment (p < 0.05) was assessed for up- and downregulated genes separately. No enrichment could be performed for Vype ePen due to the lack of candidate genes. The enrichment output is presented in Figure 8 with Figures 8A and B presenting a heat map with the enriched Reactome terms and Figures 8C and D presenting GO circle plots for the top (based on p-values) enriched GO terms. Enrichment p-values, % of pathway coverage, and number of contributing responsive genes are summarized in Supplementary Tables S5A–D. Enrichment for interleukin-1, oxidoreduction/response, oxidative stress, and xenobiotic metabolism pathways was recurring across the different reference databases. A causal analysis conducted using IPA ingenuity knowledge base 29 to determine possible downstream effects of the observed changes on biological functions (Z-score filter >2) predicted an increase in tumor cell proliferation and a decrease in cell death (apoptosis and necrosis) (Supplementary Tables S6A, B).
Heat maps of enriched Reactome pathways
Discussion
The purpose of this study was to compare the transcriptional perturbations and cytokine profile of a commercially available reconstituted 3D lung epithelial tissue (MucilAir) after short repeated exposure (5-minute exposures repeated four times) to cigarette smoke (3R4F) and e-cigarette (Vype ePen) aerosols. E-cigarettes potentially offer a safer alternative to conventional tobacco products.8,9
To understand dose interactions, it is very important to first understand the delivery of the smoke and aerosol exposure at the ALI and quantify its deposition. There is currently little agreement from the literature on the best method to conduct smoke/aerosol dose comparison between product categories in vitro. Dose matching could be established based on a variety of parameters, including number of puffs, deposited mass on the tissue, nicotine reaching the cells, or a panel of volatile chemicals common to the different test products.13,20,30 In this study, our primary dose criteria were to match the number of puffs between cigarette and Vype ePen exposures. Mass deposition measured using a QCM was performed as an exposure endpoint to (1) ensure that the generated smoke/aerosols were reaching the cells and (2) compare the mass of deposited material from each product. Based on a per puff delivery, a 25% increase of deposited material was recorded for Vype ePen when compared to the 3R4F reference product at an equivalent puffing regimen (Fig. 3). This experiment confirmed that the cells were exposed to the same order of mass of deposited material. It is important to note, however, that the chemistry of the two matrices is likely to be very different with the Vype ePen vapor mostly containing droplets of glycerol and propylene glycol and fewer chemicals than conventional tobacco products. 18
The selected puffing regimen for our experiment used the reference HCI puffing profile. None of the current reference machine smoking regimens reflects the smoking behavior of a human subject, 31 however, the HCI smoking regimen produces higher yields of smoke toxicants 32 and therefore potentially represents a “worst case scenario” in terms of toxicant exposure. The products were puffed four times over a period of 5 minutes interspaced with 30-minute recovery for which we used the terminology “short repeated exposure.” Similar puffing sequences have been reported previously and have been used to represent the intermittent nature of the smoking ritual.28,33 Furthermore, similar puffing regimens have been applied in vitro to induce markers of respiratory epithelium remodeling observed in the onset of goblet cell hyperplasia and chronic obstructive pulmonary disease (COPD). Those markers include MMPs, VEGF, and IL-8 of which MMP-1, MMP-9, and VEGF gave a relatively consistent response when we exposed MucilAir cells obtained from six donors to 3R4F smoke using the short repeated exposure regimen (Fig. 4). 28
Since smoking is a cause of chronic inflammation of the respiratory epithelium, we extended the panel of proinflammatory mediators screened to 30 cytokines and 3 MMPs (full list of 33 markers given in Supplementary Table S7) quantified in the culture media of MucilAir cells exposed to 3R4F smoke and Vype ePen aerosol. We reported a significant increase for VEGF, MMP-9, IL-4, IL-6, IL-8, IL-12 p70, IFN gamma, and IL-5 (p < 0.05, FC >1.5), 24 hours after a short repeated exposure to 3R4F smoke (Fig. 5A). A recovery was observed 48 hours postexposure to 3R4F with only three cytokines, MCP-1, MIP-1b, and IP-10, showing a downregulation (Fig. 5B). The observed VEGF and IL-8 response at 24 hours postexposure and MCP-1 reduction at 48 hours were in agreement with previous work conducted using the same cell type and a similar short repeated exposure smoking regimen of a 3R4F reference cigarette.28,34 Furthermore, studies using sample sources such as primary and immortal human bronchial epithelial cells, peripheral blood mononuclear cells, and sputum have shown that cigarette smoke exposure stimulates the expression of MMP-9, IL-8, VEGF, 35 IL-4, 36 and IL-637 in the pathogenesis of COPD, which is in agreement with our results.
Short repeated exposure to the Vype ePen on a puff-matched basis did not lead to a significant alteration of the secreted cytokine profile except for IL-12p40, which showed a downregulation at 48-hour recovery (Fig. 5B, D). Current studies using e-cigarette aerosol exposure have reported inconsistent evidence of proinflammatory activity. For instance, following a 15-minute exposure of H292 cells to the aerosol of a marketed e- cigarette, Lerner et al. reported an increase medium secretion of IL-6 and IL-8. 38 The puffing regimen was based on a review of vapor behavior observed in a collection of 64 YouTube videos. 39 In contrast, an acute 50-minute e-cigarette aerosol exposure study performed by Cervellati and colleagues on A549 cells reported no cytotoxicity, a reduction of IL-6 secretion, and an increase of IL-8 but below a 1.5-FC threshold. 40 Both studies did not provide a direct comparison with conventional 3R4F reference cigarette, used cell lines derived from tumors, and had applied different smoking regimens. Iskandar et al. identified a greater number of secreted mediators, including IL-6, IL-8, and eotaxin in the basolateral media of the monoculture than in the coculture models exposed to whole cigarette smoke. In comparison, in our study, the IL-6-FC indicated a reduction of up to 30% with aerosol but was not significant based on our statistical analysis of data obtained from triplicates of three independent interexperimental replicates. 41 We cannot exclude at this stage, however, that an acute exposure regimen could elicit a proinflammatory response in our test model.
Our sequencing experiments resulted in a total of 123 genes differentially expressed in response to 3R4F smoke exposure only, with an FC >1.5 and pFDR <0.1 after adjustment for postexposure recovery time (Fig. 6E and Supplementary Table S2A). No splice variants satisfied the FC and pFDR values filter criteria. When the data are analyzed on a 24- and 48-hour postexposure recovery time basis, no significant genes could be identified at pFDR <0.1 (Fig. 6A, C). Differential expression based on uncorrected p < 0.01 is provided in Supplementary Table S1 for the two time points and showed overall a greater response from 3R4F smoke exposure compared to Vype ePen aerosol. We had to apply a linear model, where the two time points were combined to conduct the p-value FDR adjustment to identify a list of candidate responder genes significant at pFDR <0.1. This indicated a certain degree of variability in the response of our cell model, which is why we pooled the time point data sets to increase statistical power. A principal component analysis of our data indicated that the source of variability other than treatment and time points included the smoking runs/interexperimental replicates, operator, day of RNA extraction, and the Illumina sequencing flow cells where the samples were randomized (data not shown). Nevertheless, the number of gene candidates that we obtained is in the same order that was reported from other studies performed with human bronchial tissue.42,43 One example includes a transcriptomic study conducted with bronchial epithelial cells obtained from bronchoscopies of smokers and nonsmokers, which identified a panel of 175 genes discriminating the two categories (FC > 1.5, qFDR < 0.05). 42 Fourteen of those genes were found in our data set. In a second example, seventy genes were found differentially expressed in smokers in a comparison of gene expression arrays and exon arrays using a pFDR <0.05 and no FC filter. 44
A further review of the literature using search terms such as “cigarette,” “smoke,” “gene expression,” “transcriptomics” and searches in the Comparative Toxicogenomics Database confirmed that 71 protein coding genes highlighted in our screen have been reported as regulated by cigarette smoke or extract exposure (Supplementary Table S3). More than a dozen of those genes appear to form a core group of cigarette smoke responders as they are the most frequently reported in the literature and include aldo-keto reductases, aldehyde dehydrogenases, cytochrome P450s, and solute carrier transporters. Many of those induced and repressed genes have been described as highly reversible from studies using samples obtained from former smokers. The expression of two genes (GPX2, PIR) identified in our study has been described as irreversibly altered by smoking when samples of smokers and former smokers were compared. 42 GPX2 codes for a xenobiotics metabolizing enzyme involved in oxidative stress response and PIR are involved in DNA replication, both have been associated with oncogenesis.45,46
qRT-PCR validation of 20 genes selected from the output of our 3R4F RNA-seq screen and including 18 genes with no literature information showed an overall agreement with the RNA-seq data for 10 of the selected genes (Fig. 7C and Supplementary Table S4). It is important to note that the qRT-PCR validation was performed on a completely independent set of exposure experiments and cell inserts and performed in triplicate. This did bring the total of genes regulated by 3R4F cigarette smoke with two supporting evidence (RNA-seq + literature or RNA-seq + qRT-PCR) to 79 (71 unique genes from literature search +8 unique genes from qRT-PCR).
Only albumin (ALB) and SP140 could be confirmed as differentially expressed after exposure to Vype ePen aerosol (Fig. 7D and Supplementary Table S4), and ALB gene is in agreement with the RNA-seq screen results. SP140 is abundantly present in the spleen and peripheral blood leukocytes and involved in the pathogenesis of acute promyelocytic leukemia and viral infection. 47 Although present in the lung epithelium, the expression levels are very low. 47 ALB is primarily secreted by the liver and play a key role in regulating the osmotic pressure. 48 ALB mRNA was also detected in other tissues, including the lung, but there is no evidence this led to the synthesis of the protein. 49 Due to the absence of information regarding the expression of these genes in the context of lung toxicology, no conclusion can be inferred from the observed differential expression due to Vype ePen aerosol exposure.
Even if the pFDR filter applied to the RNA-seq data did not exactly predict the rate of false positives in our qRT-PCR experiment, the overall result still highlights a stronger response following 3R4F smoke exposure compared to Vype ePen aerosol exposure. Again, it could be speculated that the exposure time or the concentration of e-cigarette aerosol used was not enough to elicit a strong gene expression response and it is of value to further investigate a range of puffing regimens and doses.
A gene set enrichment analysis was conducted as part of a qualitative assessment of the biological functions affected by 3R4F smoke exposure (Fig. 8). Two different tools and databases were used, namely GO and the Reactome, which give a score (p-value or Z-score) based on the number of genes up- and downregulated found to participate to a set of defined cellular functions. In addition, a qualitative causal analysis was performed using IPA Ingenuity to infer the directional downstream effect of the change of gene expression on canonical biological functions. The genes confirmed by literature search (71) and those confirmed by both literature search and qRT-PCR (71 + 8 = 79) were used for the enrichment analysis. No enrichment could be performed for the Vype ePen aerosol due to the lack of candidate genes. The enrichment results were consistent with the reported adverse effects of cigarette smoke exposure. Notably, the GO and the Reactome analyses both highlighted overrepresentation in the IL-1 pathway, xenobiotics metabolism, and oxidative stress response, while the IPA Ingenuity analysis inferred a decrease response leading to cell death and an increase in cell proliferation and survival.
Functional enrichment analyses from two previously reported studies performed on a reconstituted bronchial epithelial tissue culture exposed to whole smoke highlighted the following overrepresented processes: metabolism of xenobiotics, redox balance, glutathione metabolism, pentose phosphate pathways, and Notch pathway.34,50 Oxidoreductase activity and metal ion binding were also among the top enriched GO categories in two transcriptomic studies conducted on bronchoscopy samples of smokers and nonsmokers. 42 All those enriched functional categories were also found in our analysis (Fig. 8C, D) and are mostly associated with the regulation of genes coding for enzymes involved in the detoxification of free radicals and disposition of chemicals. Those enzymes typically harbor an iron or metal ion heme cofactor, which explains the overrepresentation of the GO term related to metal ion binding.
Our analysis also identified an overrepresented set of five genes participating to the IL-1 response pathway (IL1A, IL1B, IL1RN, IL36A, and IL36RN) (Supplementary Table S5D). Interestingly, the increased mRNA expression of IL1A, IL1B, and IL36A, together with the observed increased secretion of IL-8 and IL-6 proteins, is indicative of a proinflammatory response supporting a neutrophil chemotactic activity observed in diseases such as COPD. 51
Conclusion
In conclusion, using a short repeated exposure, we observed a limited impact of Vype ePen e-cigarette aerosol on the transcriptomic and inflammatory cytokine profile of a reconstituted airway epithelium. In contrast, perturbations in xenobiotic metabolism, oxidative stress response, and inflammation pathways were observed at the transcriptional and secreted cytokine level when the cells were exposed to the same number of puffs from reference 3R4F cigarettes. Our results demonstrate the suitability of MucilAir for assessing the effect of repeated exposure to tobacco smoke and nicotine product aerosols and can be used in similar future product assessment studies to evaluate the relative risks. However, acute puffing regimens and puffing regimens matched for nicotine and other chemicals should be performed to comprehensively assess the differential response of the airway epithelium exposed to cigarette smoke and Vype ePen aerosols. Data generated using a systems biology approach can potentially support an adverse outcome pathway-based in vitro testing framework to support future toxicological and regulatory risk assessment of next-generation tobacco and nicotine products.
Footnotes
Acknowledgments
We thank Oscar M. Camacho from British American Tobacco for providing statistical support. The study was funded by British American Tobacco (Investments) Ltd.
Author Disclosure Statement
All of the authors are currently employed by British American Tobacco (Investments) Ltd, and the study was funded by British American Tobacco (Investments) Ltd. Elements of this work were conducted at Fios Genomics Ltd. as part of a commercial contract.
References
Supplementary Material
Please find the following supplemental material available below.
For Open Access articles published under a Creative Commons License, all supplemental material carries the same license as the article it is associated with.
For non-Open Access articles published, all supplemental material carries a non-exclusive license, and permission requests for re-use of supplemental material or any part of supplemental material shall be sent directly to the copyright owner as specified in the copyright notice associated with the article.