
Abstract
Abstract
The e-cigarette category is evolving rapidly, providing consumers with a variety of formats, ranging from cig-a-like products to larger, high-powered modular devices. When generating an in vitro assessment approach across such diverse products, dosimetry considerations are paramount. In this article, we have compared nicotine quantification techniques in two studies using a Vitrocell VC 10 Smoking Robot to generate aerosols from different e-cigarettes. In Study 1, a 3R4F reference cigarette and four different commercially available e-cigarettes were compared: puff-by-puff nicotine concentration was quantified at the same e-cigarette puffing regime (CRM No81) or with different puff durations, (2 or 3 seconds), comparing 3R4F puff-by-puff yields following ISO and HCI smoking regimes. In Study 2, 3R4F and one e-cigarette were assessed for puff-by-puff nicotine concentration in different locations (China and United Kingdom) comparing different nicotine quantification methods with gas chromatography–mass spectrometry and UPLC-MS/MS used in the two laboratories. Study 1 showed that 3R4F cigarette delivers different nicotine concentrations across the different regimes and puff number, supporting the nicotine methodology; e-cigarettes tested generated different amounts of nicotine across the devices tested, but showed consistent puff-by-puff delivery per device. Study 2 showed positive agreement between results across two different laboratories utilizing different methods for nicotine quantification; statistical analysis, combining all interlaboratory variables, indicated that laboratory differences and the interaction of laboratory and puff number were not significant (p = 0.067 and 0.960, respectively). These studies will add further knowledge to support the in vitro assessment of novel nicotine products, providing reliability and assurance in the area of in vitro dosimetry.
Introduction
T
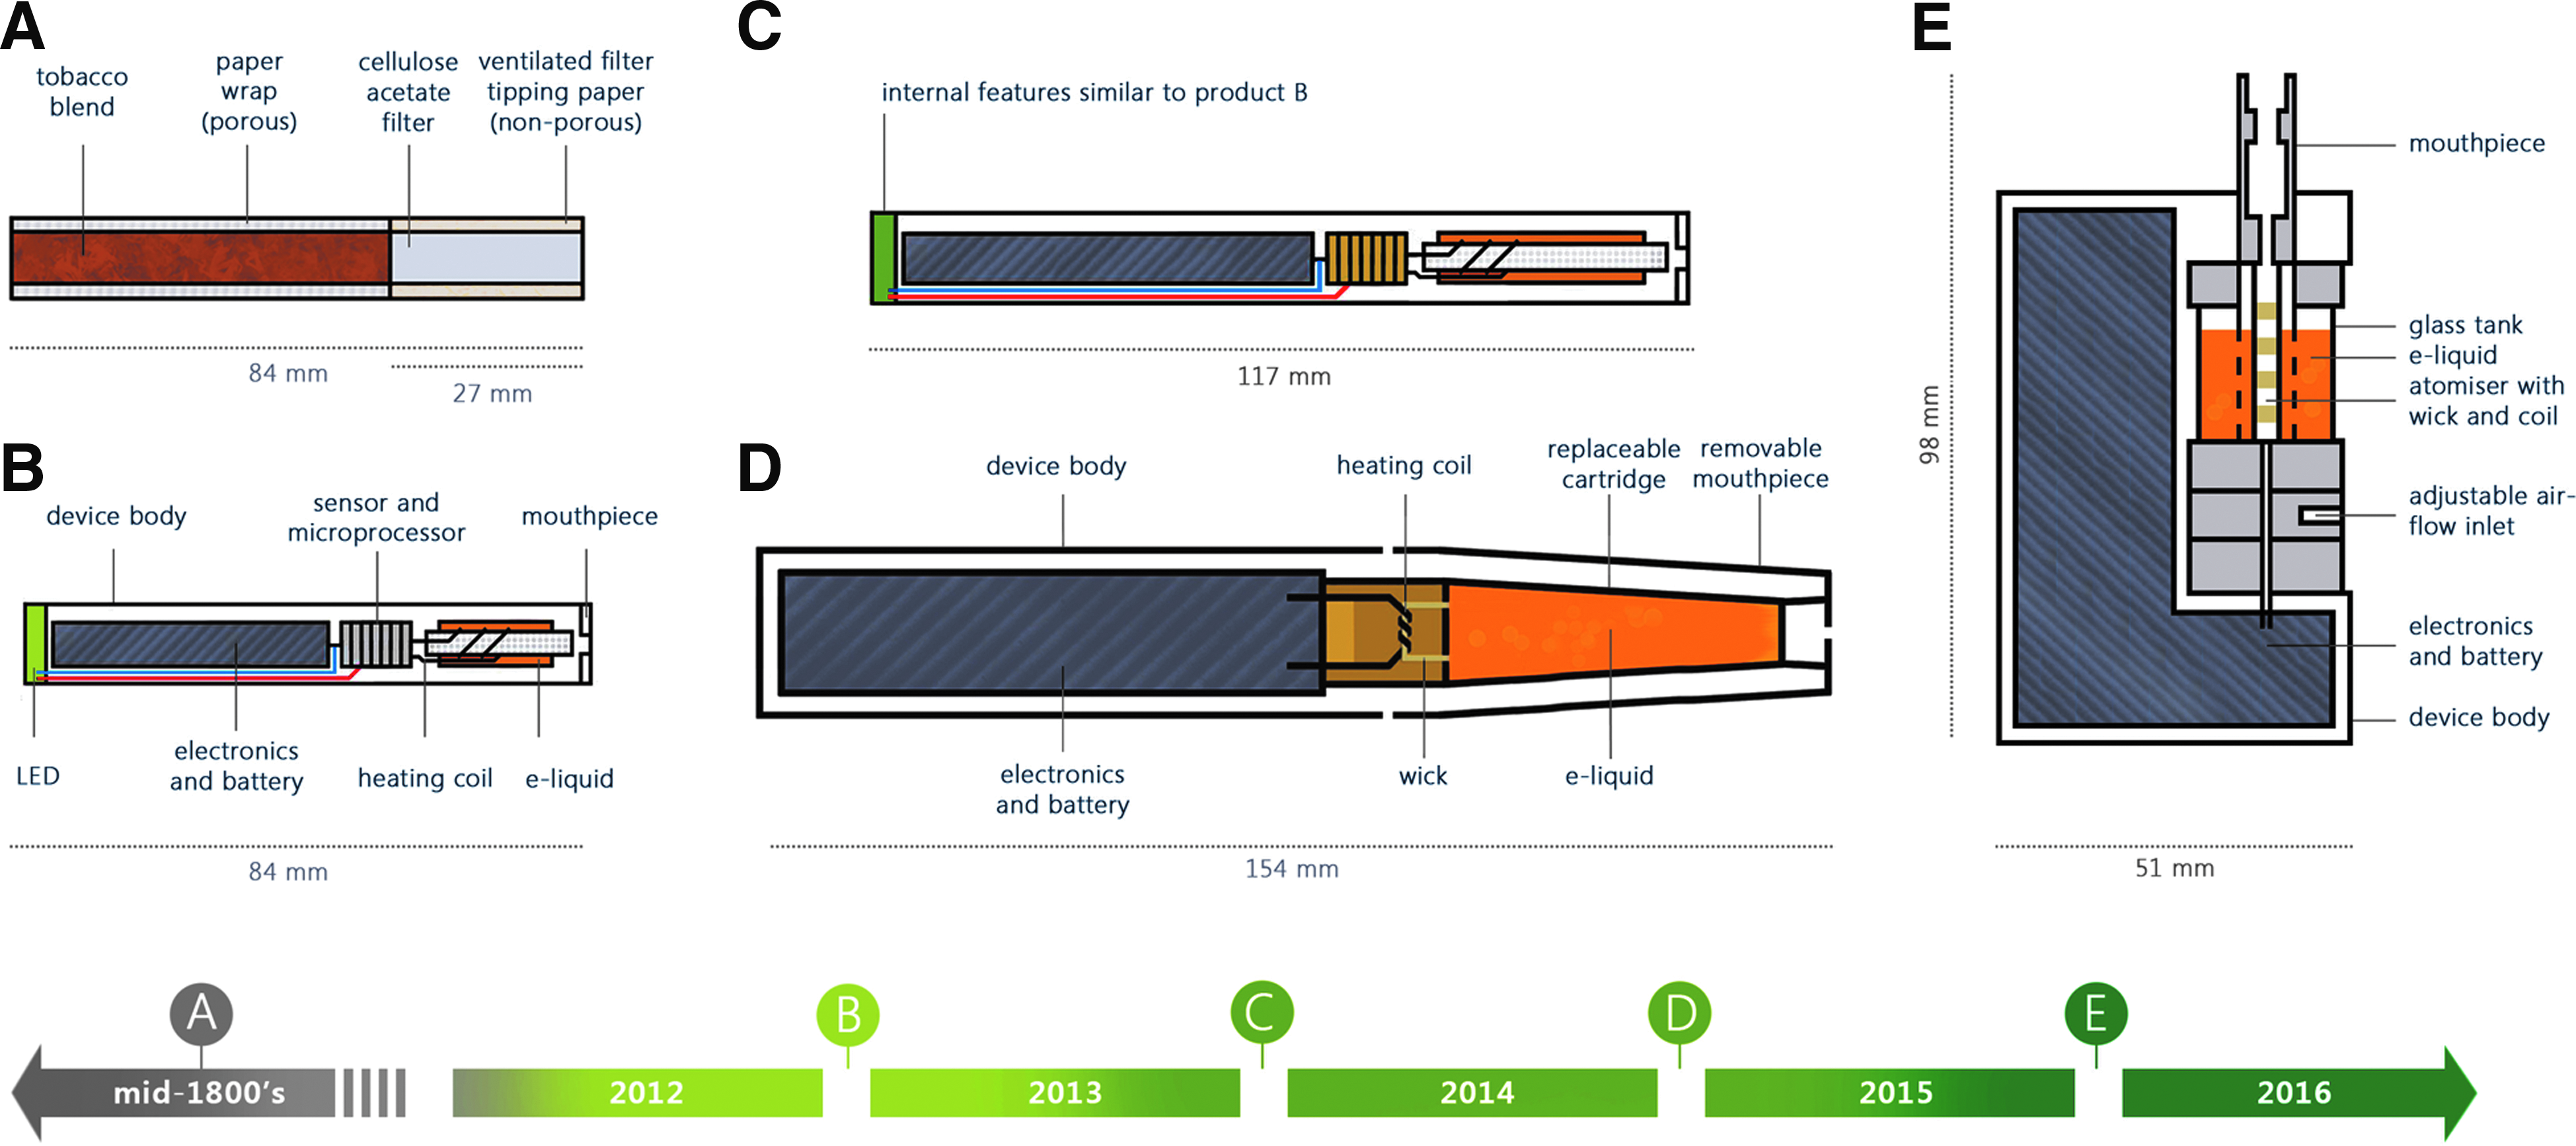
The test articles in this study and their evolution timeline: cigarette (reference)
The NGP category is growing fast and awareness and usage of e-cigarettes in particular have increased exponentially to the point of near-universal awareness. 2 Recent scientific data have demonstrated the comparative simplicity of the e-cigarette aerosol in comparison with tobacco cigarette smoke, with substantial (88%–99%) differences between the levels of e-cigarette and cigarette emissions. 3 However, toxicological evaluation must follow, including the use of current and future in vitro test systems that can be exposed by aerosols from these new and diverse devices. The basic requirement is that the test method should be able to generate and deliver the cigarette smoke or aerosol from different vapor products effectively and repeatedly to enable robust and reliable in vitro toxicological and biological evaluation.
E-cigarettes in particular have changed in their external appearance, functional design, and e-liquid formulations; between 2012 and 2016, there have already been 4 or 5 major iterations of product evolution (Fig. 1). The first modern e-cigarette was invented in China in 2003, but only started to become popular with consumers some years later.
The first generation of e-cigarette was a cig-a-like disposable device (looking like a traditional cigarette) with many companies entering the U.S. and U.K. markets around 2012 (Fig. 1B). Soon thereafter, rechargeable cig-a-like-devices emerged; some devices were the same size as a cigarette, but some devices were growing in size to accommodate higher powered batteries and variable power settings to drive the generation and delivery of larger amounts of aerosol (Fig. 1C). In the last few years, the vapor category has diversified further from pen-like devices (Fig. 1D) on to modular, open system tank devices (Fig. 1E). With such diversity in product designs and consumer's choice in different e-liquids, this poses a significant challenge to those involved in toxicological in vitro testing, risk assessment, and regulation of these products.
The U.S. Food and Drug Administration published its draft guidance on the scientific studies required to evaluate and demonstrate significantly reduced harm and risk of NGPs, including the use of in vitro assessment tools. 4 With traditional combustible tobacco products, we and others have established a foundation of testing approaches where air–liquid interface (ALI) in vitro exposure systems have been used and their results published. More recently, the same approaches have been employed to evaluate NGPs.5–8
There are many different in vitro systems available with different modes of dilution, delivery, and aerosol losses between the point of smoke/aerosol generation and the exposure interface. 9 These systems are largely dissimilar in function and appearance, but aim to achieve the same outcome by exposing a biological system (in vitro model or regulatory toxicology assay) at the ALI. Therefore, understanding each exposure system thoroughly and the test article being assessed becomes an essential and first investigation. Understanding the aerosol source (Fig. 2) and being able to show consistent and robust aerosol generation help to give confidence in the dose determination later at the exposure interface and biological responses downstream.
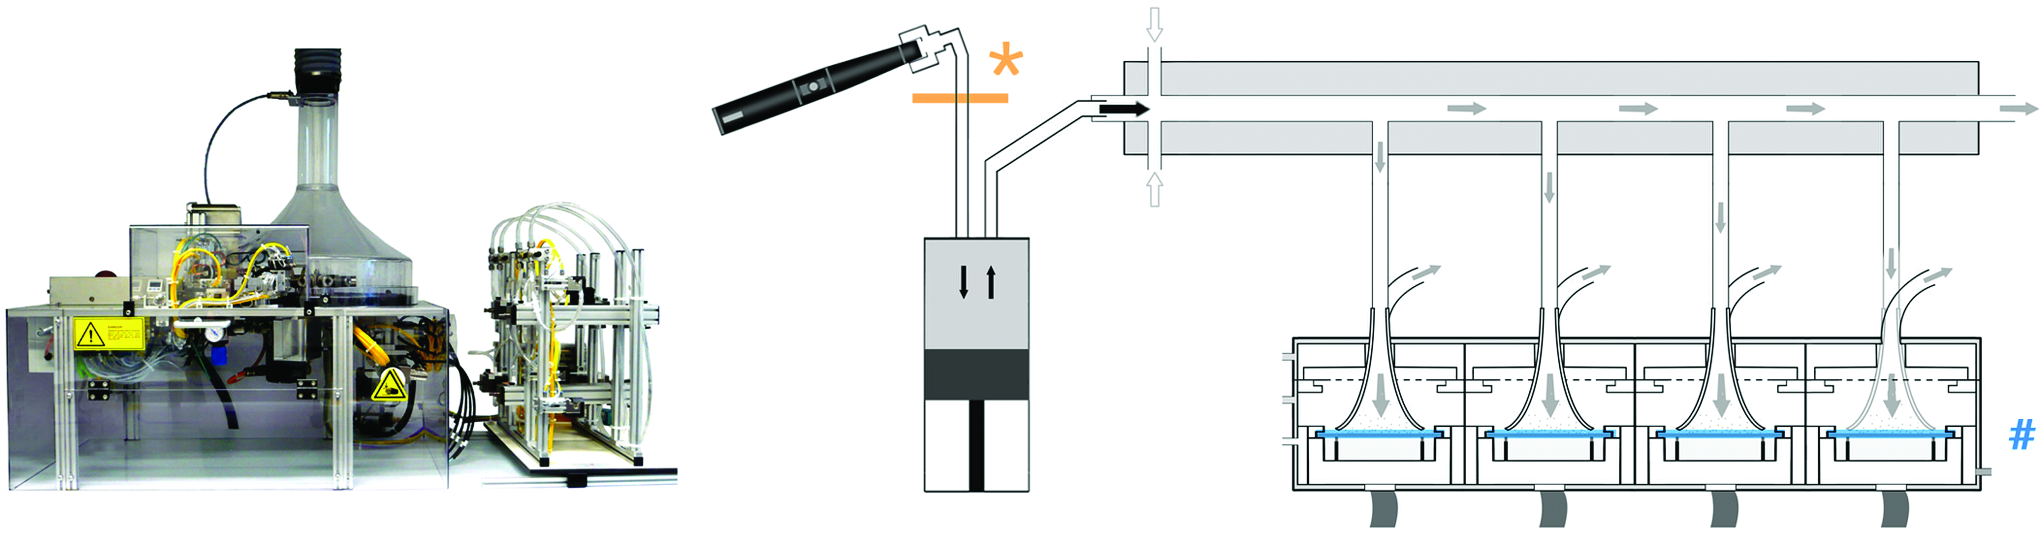
The Vitrocell VC 10 Smoking Machine: nicotine measurements were made at source with a Cambridge filter pad (indicated*), undiluted at the point of generation; product D is shown in this case. Dose measurements can also be made at the air–liquid interface (indicated#) with real-time quartz crystal microbalance monitoring or with other analytical quantification methods postexposure. Figure adapted from Adamson et al. 5
Two reviews have described a number of exposure systems available, including smoking machines/robots and in vitro exposure chambers, 9 and more recently, the in vitro endpoints that have been published from such tobacco smoke ALI systems. 10
As commercially available exposure systems and their use are becoming more advanced, there is a need to harmonize approaches and standardize methods. For example, a comprehensive interlaboratory study using the Vitrocell VC 10 Smoking Robot (Fig. 2) was undertaken involving six independent VC 10s in four laboratories in three countries. 11 In this study, quartz crystal microbalances (QCMs) were employed as a gravimetric dosimetry tool installed into the exposure modules, enabling assessment of tobacco smoke particle deposition in real time.
QCMs enable a greater understanding of tobacco smoke particle dose and delivery, presenting data as quantifiable deposited mass per surface area, rather than an arbitrary dilution factor/ratio/percentage. 11 Regional deposition was compared across exposure module positions in the six VC 10s: it was reported that the dose–responses obtained from the six machines across four different locations demonstrated excellent agreement with gauge R&r at 7.7%. 11 Gauge R&r (reproducibility [R] and repeatability [r]) is an analysis of variance (ANOVA) test employed to assess multiples of the same measurement system in different locations/with different operators (R) and also within the same measurement system in one location (r). Gauge R&r is the sum of intra- (r) and interlaboratory (R) variability, and measurement system values less than 10% overall are considered statistically fit for purpose. 11
In this article, we have compared VC 10 aerosol generation at source by nicotine quantification. The research was divided into two studies. In Study 1, a single laboratory assessed methodology and a range of products before moving into Study 2, where we repeated aspects of Study 1 by adding a second laboratory at a different geographical location. As both laboratories/machines had been involved in the previous larger interlaboratory study, 11 their unique anonymized codes were retained herein for continuity purposes: Lab A and Lab D.
In Study 1, we investigated a 3R4F reference cigarette (product A, Fig. 1) and a selection of different vapor products ranging from first-generation e-cigarette to one of the most recent e-cigarette device types available (products B–E, Fig. 1); for Study 2, only two products were selected to be tested in Lab A and Lab D—a cigarette (product A) and one e-cigarette (product B). Product selection was driven by the availability of the products in both countries. As the two VC 10s in Lab A and Lab D were previously demonstrated to be delivering the same cigarette smoke at the exposure interface, 11 this study was designed to compare the generation of cigarette and e-cigarette aerosols, quantifying nicotine level per puff, and crucially with each laboratory's independent nicotine quantification method.
An additional nicotine extract stability shelf life investigation was included in Lab A to assess that the nicotine in e-cigarette samples (solvent extracted) would not degrade over the time of the study for future studies where samples may be exchanged and analyzed by different laboratories. Results of these current studies suggest that assessment of nicotine extract samples may provide a more reproducible and reliable range of diluted effluents for toxicology testing, rather than using QCMs (which are not compatible for real-time, e-cigarette aerosol measurements longer than a few minutes—discussed in more detail later). This approach will also likely provide useful supplementary data in characterizing the dosimetry of in vitro exposure systems.
Materials and Methods
Our research was conducted in two linked studies to enable a more thorough assessment of the generation and stability of e-cigarette aerosols in one laboratory (Study 1 in Lab A), followed by the interlaboratory assessment of a reference cigarette and e-cigarette in two locations (Study 2 in Lab A and Lab D) (Fig. 3).The VC 10s in Lab A (Serial# VC 10/141209) and Lab D (Serial# VC 10/200410) have been part of a previously published interlaboratory in vitro assessment study 11 and hence have retained their code letters; this is to be able to link back to previous studies and for inclusion and traceability in this and future comparative studies, where the systems will be employed for evaluating NGPs in vitro.

Experimental design summary: test articles and smoking/puffing regimes for Study 1 and Study 2.
Test article selection and smoking/puffing regimes
One ISO-conditioned reference 3R4F cigarette (University of Kentucky) was selected and four e-cigarettes spanning the evolution of the vapor product category, including simple first-generation disposable cig-a-like device, to rechargeable cig-a-like device, closed modular device, and open modular device (Fig. 1 and Table 1). The lower delivery ISO 12 and higher delivery HCI 13 cigarette smoking regimes were employed for the reference product A (Table 1), with one cigarette smoked per run and three replicate experiments. Puffing regimes are described by three numbers that are paramount in determining and controlling aerosol generation–puff volume in milliliters, followed by puff duration in seconds, and finishing with puffing interval also in seconds.
Reference cigarette 3R4F [A]; commercially available first-generation disposable e-cigarette (cig-a-like) [B]; commercially available first-generation rechargeable e-cigarette (cig-a-like) [C]; commercially available second-generation modular e-cigarette (with own cartridge) [D]; commercially available open tank device [E].
Dependent on smoking regime used (ISO or HCI).
As stated on pack.
Regimes assessed are detailed: ISO = 35 mL puff volume: 2-s duration: 60-s intervals. Filter vents open; HCI = 55 mL puff volume: 2-s duration: 30-s intervals. Filter vents blocked; HCIm = 55 mL puff volume: 2-s duration: 30-s intervals. For NGPs, thus no filter vents; CRM 81 = 55 mL puff volume: 3-s duration: 30-s intervals.
NGPs, nicotine products.
Thus, the Health Canada Intense 55:2:30 regime stipulates that a 55 mL puff of smoke is taken over 2 s, and this occurs every 30 s after cigarette lighting and taking of the first puff. A smaller puff volume (35 mL) at the same duration (2 s), but with a longer puffing interval (of 60 s), would be termed 35:2:60 and this is the ISO smoking regime. Both ISO and HCI cigarette regimes puff with a bell profile, where the flow rate steadily increases to the specified volume and then decreases for the duration of the puff (Fig. 3). Square puff profiles (Fig. 3) are employed for e-cigarettes as the continuous puff flow ensures that aerosol is being generated from the first moment the puff activates. 5
In this study, all e-cigarette products were machine puffed following the CRM No81 regime 55:3:30 (55 mL puff over 3 s every 30 s) and with a square puff profile 14 . In an additional experiment, one e-cigarette (product D) was puffed at the modified HCI regime of 55:2:30 (termed HCIm, where m = modified as there were no filter vents to block, and the square puff profile is used instead of the bell profile) and this was to show the effect of varying puff duration on aerosol delivery. Products B and C were puff activated at their default voltage (not specified on the pack), and products D and E were button activated 1 second before puffing to warm the coil; both of the latter were operated at their highest voltage setting of 4 V and 5 V, respectively (Table 1).
Each e-cigarette was vaped for 10 puffs per run, three replicate experiments with the same device. Cig-a-like products B and C were held in the VC 10 mouthpiece perpendicular to the smoking carousel (as a cigarette would be held). For the larger devices, which were unable to be held in the VC 10 like a cigarette (products D and E), a mouthpiece attached to the VC 10 syringe was clamped to allow the devices to be connected at 45° (this was important to avoid dry wicking in these types of devices).
Aerosol generation on the VC 10 and collection of aerosol at source
The operation of the VC 10 and method employed for capturing puff-by-puff aerosol generation at source are based on those previously discussed. 5 Whole aerosol from each product was trapped by in-line Cambridge filter pad (CFP) (44 mm diameter) pre-syringe, thus no airflow dilution was required. CFPs have been used for decades to determine total particulate matter (TPM) yields for cigarettes, and recently a study has indicated that nicotine and humectants, largely residing in the condensed particulate fraction of e-cigarette aerosols, are also captured with an efficiency of >98%. 15
A fresh CFP was sealed into a clean holder and installed into the aerosol transit line as close to the point of generation as possible (Fig. 2). Between puffs, the exposed CFP was removed and placed in a clean flask and stoppered; the in-line pad holder was reinstalled with a fresh unexposed CFP and sealed. Thus, we collected emissions on a per puff basis for the duration of 10 puffs (8 for ISO cigarette). Each product was smoked/vaped in three independent replicate experiments (n = 3/product). Quantification of nicotine from the stoppered flasks containing CFPs was conducted by each laboratory's standard method; each method is described next, with the main differences in nicotine quantification between laboratories listed in Table 2. Differences between nicotine per puff for each product and mean puff nicotine concentration for the same product between laboratories were analyzed using one-way ANOVA.
CFP, Cambridge filter pad; GC-MS, gas chromatography–mass spectrometry; HPLC, high-performance liquid chromatography; UPLC-MS/MS, ultra high-performance liquid chromatography–triple quad mass spectrometry.
Quantification of nicotine in Lab A by ultrahigh-performance liquid chromatography–triple quad mass spectrometry
Nicotine quantification by ultrahigh-performance liquid chromatography–triple quad mass spectrometry (UPLC-MS/MS) was based on published methods.5,16,17 All CFP samples in individual stoppered flasks were extracted in 20 mL HPLC methanol. Flask samples were spiked with d4-nicotine at a final concentration of 10 ng/mL as internal standard. Flasks were shaken for 30 min at 180 rpm to extract the trapped aerosol from the pad. Thereafter, 1 mL extracts (1 mL from each sample flask) were condensed in an Eppendorf concentrator for 80 min at 30°C until only a visible meniscus at the bottom was visible. The condensed samples were resuspended in 1 mL of 5% acetonitrile in water, pipetted into gas chromatography (GC) vials, and crimped with foil caps before quantification.
Quantification of nicotine in Lab D by gas chromatography–mass spectrometry
Nicotine was quantified by GC-mass spectrometry (GC-MS). All CFP samples were placed in individual stoppered flasks and were extracted in 10 mL HPLC methanol solution. Samples were spiked with n-heptadecane at a final concentration of 50 ng/mL as the internal standard. Flasks were shaken for 30 min at 180 rpm to extract the trapped aerosol from the pad. Thereafter, 1.5 mL extracts were syringe filtered through a 0.22-μm membrane directly into an autosampler vial and sealed and then analyzed by GC-MS, with a DB-5MS (30 m × 250 μm × 0.25 μm) capillary column. The following conditions of GC-MS were set: injector temperature 250°C; injection volume 2 μL; split ratio of 10:1; flow rate of 1.0 mL/min; and transfer line temperature 280°C. The capillary column temperatures were as follows: initial temperature 100°C, hold for 3 min, 8°C/min to 260°C, and hold for 5 min. Electron impact ionization (70 eV) was used with a 4-min solvent delay. The selected ion monitoring mode was used for determining nicotine (m/z 84) and n-heptadecane (m/z 57).
Nicotine (sample extract) stability shelf life
Solvent extract aliquots (from product D puffed at the CRM No81 regime) produced from Study 1 were taken from numerous flasks at random and stored in 1 mL Eppendorfs at room temperature and out of direct sunlight. Samples were taken at random as it was already proven that there was no difference between nicotine concentration at any puff number from this sample (p = 0.162, see results later). At regular intervals, five samples were taken at random from the stock of aliquots and analyzed for nicotine using the UPLC-MS/MS method previously described (n = 5). Measurements were taken at days 1, 5, 12, 20, 26, 34, 54, 76, and 85 and comparisons made.
Graphics, analysis, and statistics
All raw data were processed in Excel 2016 (Microsoft). Excel was used for all tables, bar charts, and line graphs (Figs. 4A–C, 5, 6, Tables 1 and 2, Appendix Table 1). Boxplots were produced in Minitab® 17.1.0 (Minitab, Inc.) (Figs. 4D, 7, and 8). Differences between puff numbers for the same product (Figs. 4A–C, 5, and 6) and all product means (Fig. 4D) were compared in Minitab with a general linear model (GLM) ANOVA, non-nested with experimental repeat as a random effect. A GLM was also used to make cross-comparisons between all combined variables in Study 2 (interlaboratory comparisons [Fig. 7]).

Product and smoking/puffing regime comparisons: nicotine generation at source on one VC 10 Smoking Robot. Puff-by-puff analysis of reference cigarette nicotine concentration at the ISO and HCI regime
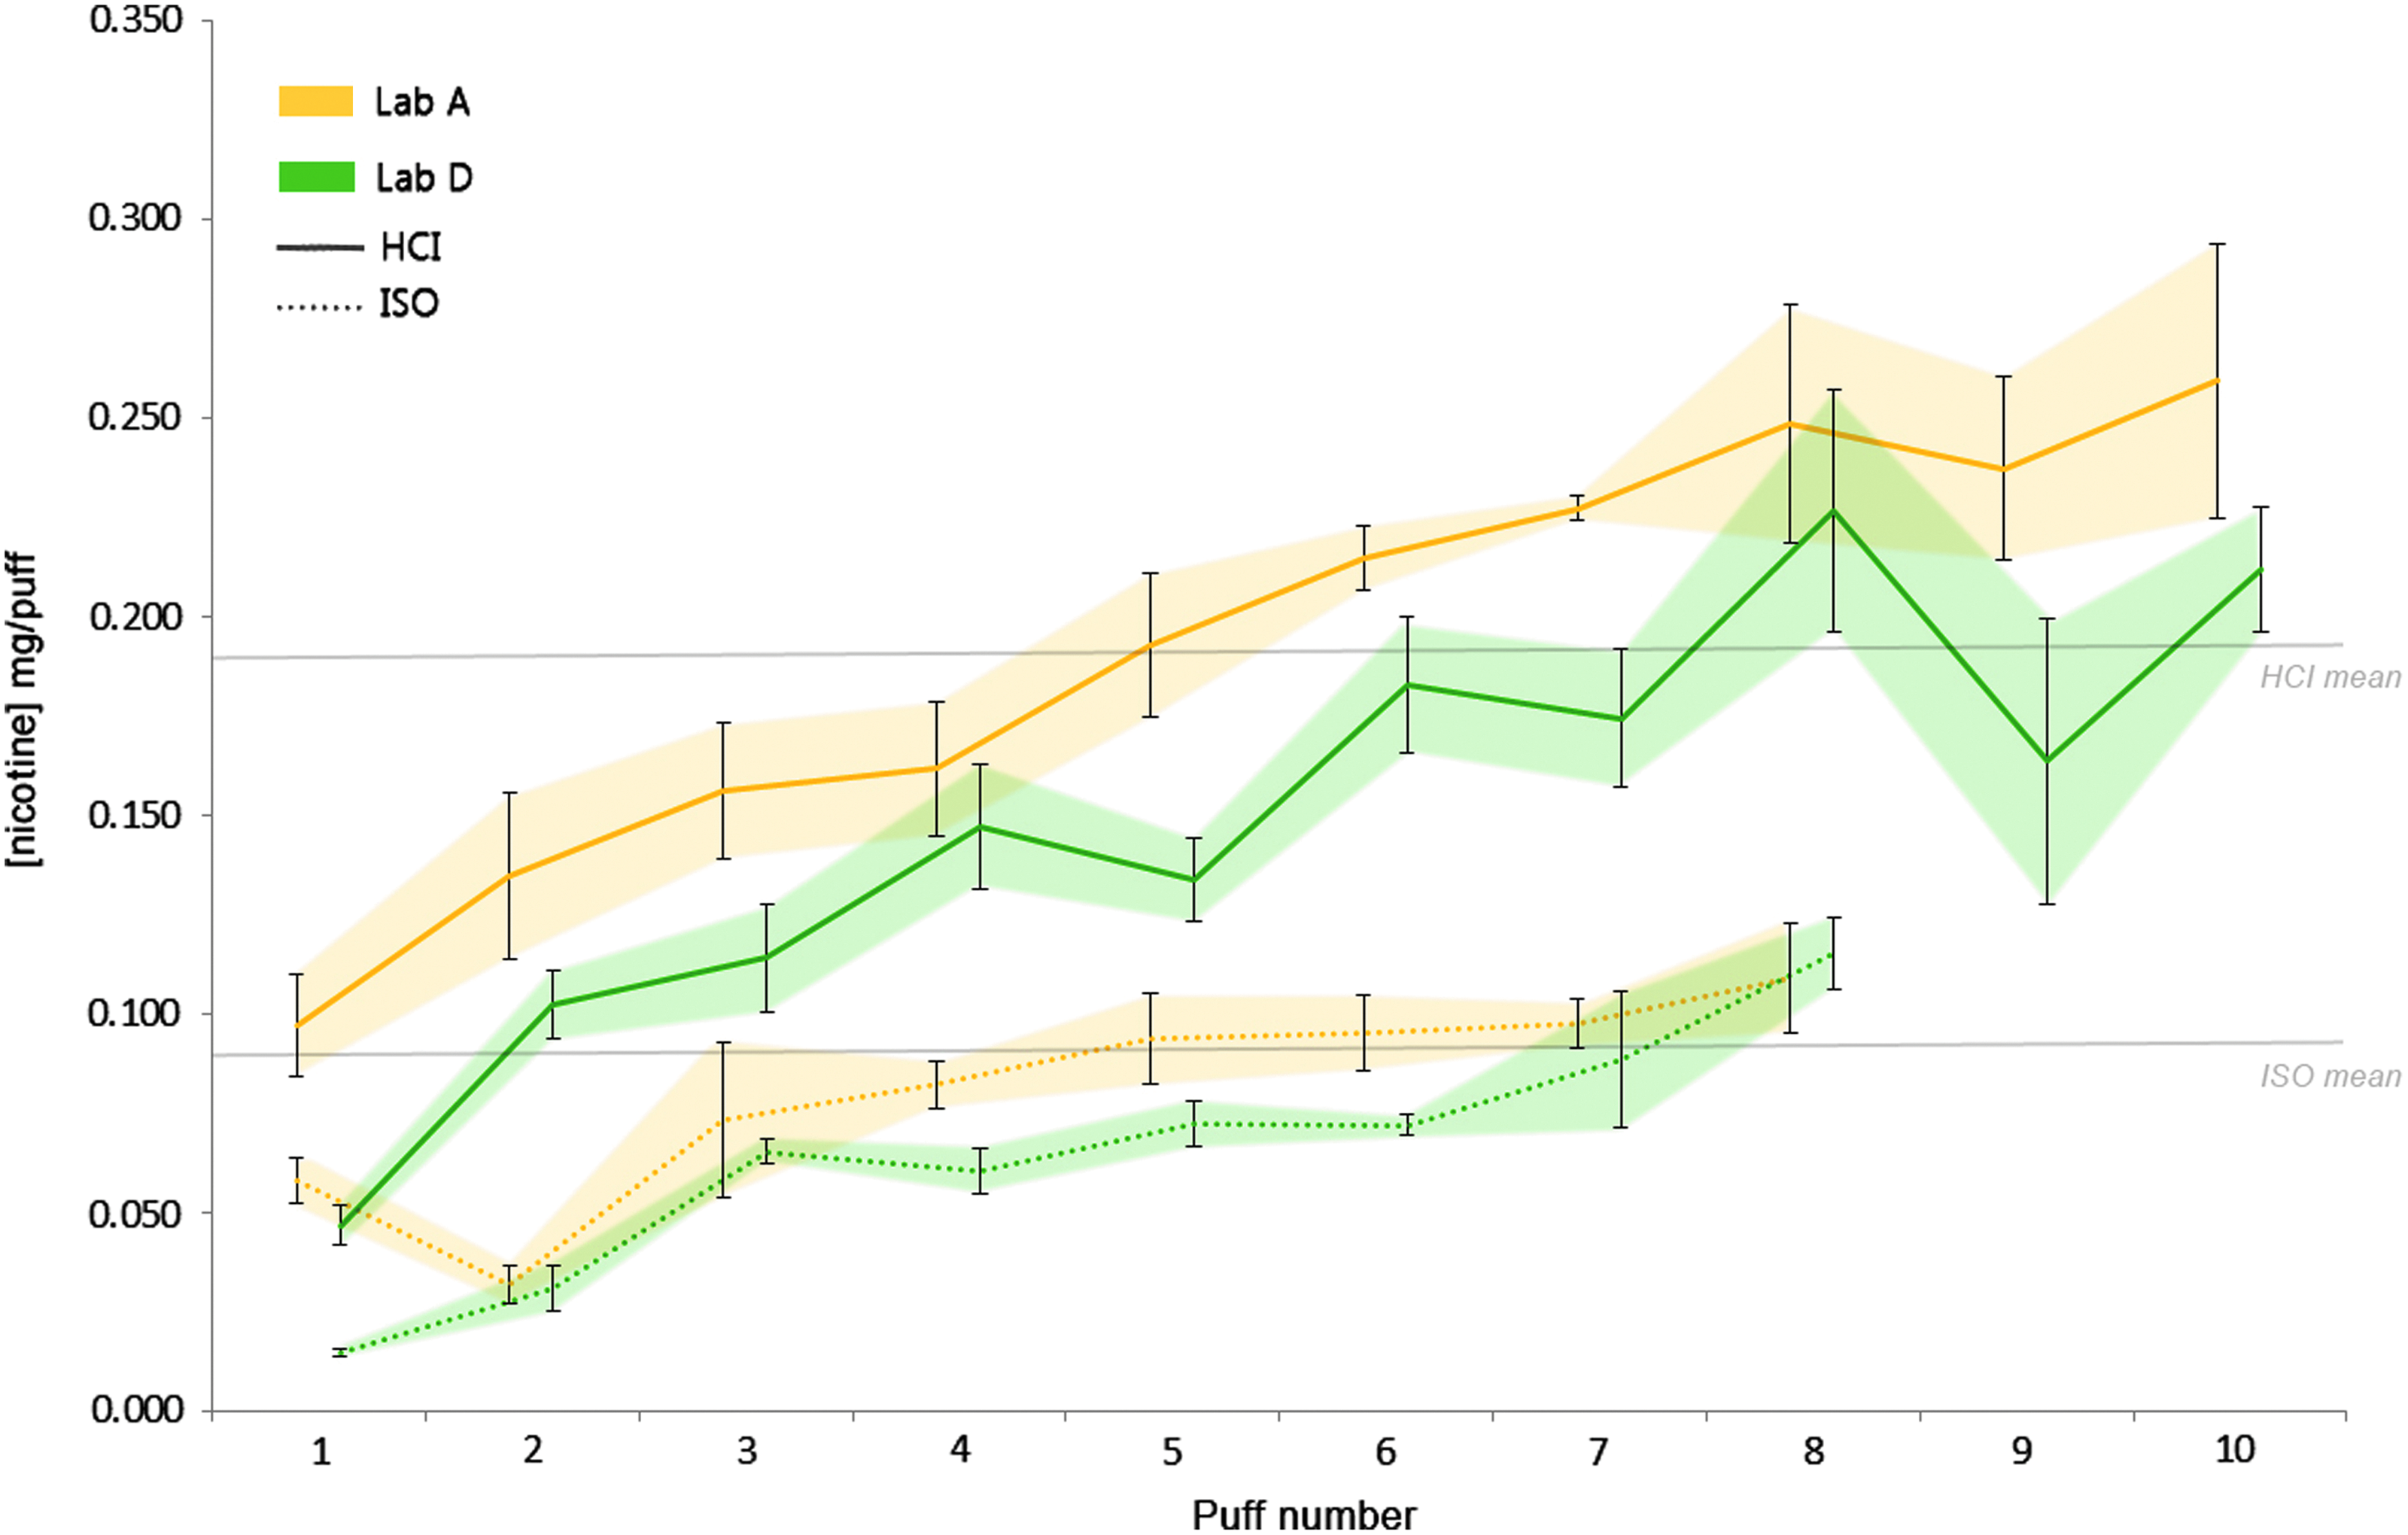
Interlaboratory nicotine at source from a cigarette (product A): puff-by-puff analysis of nicotine concentration at the ISO and HCI regime in Lab A and Lab D (n = 3).
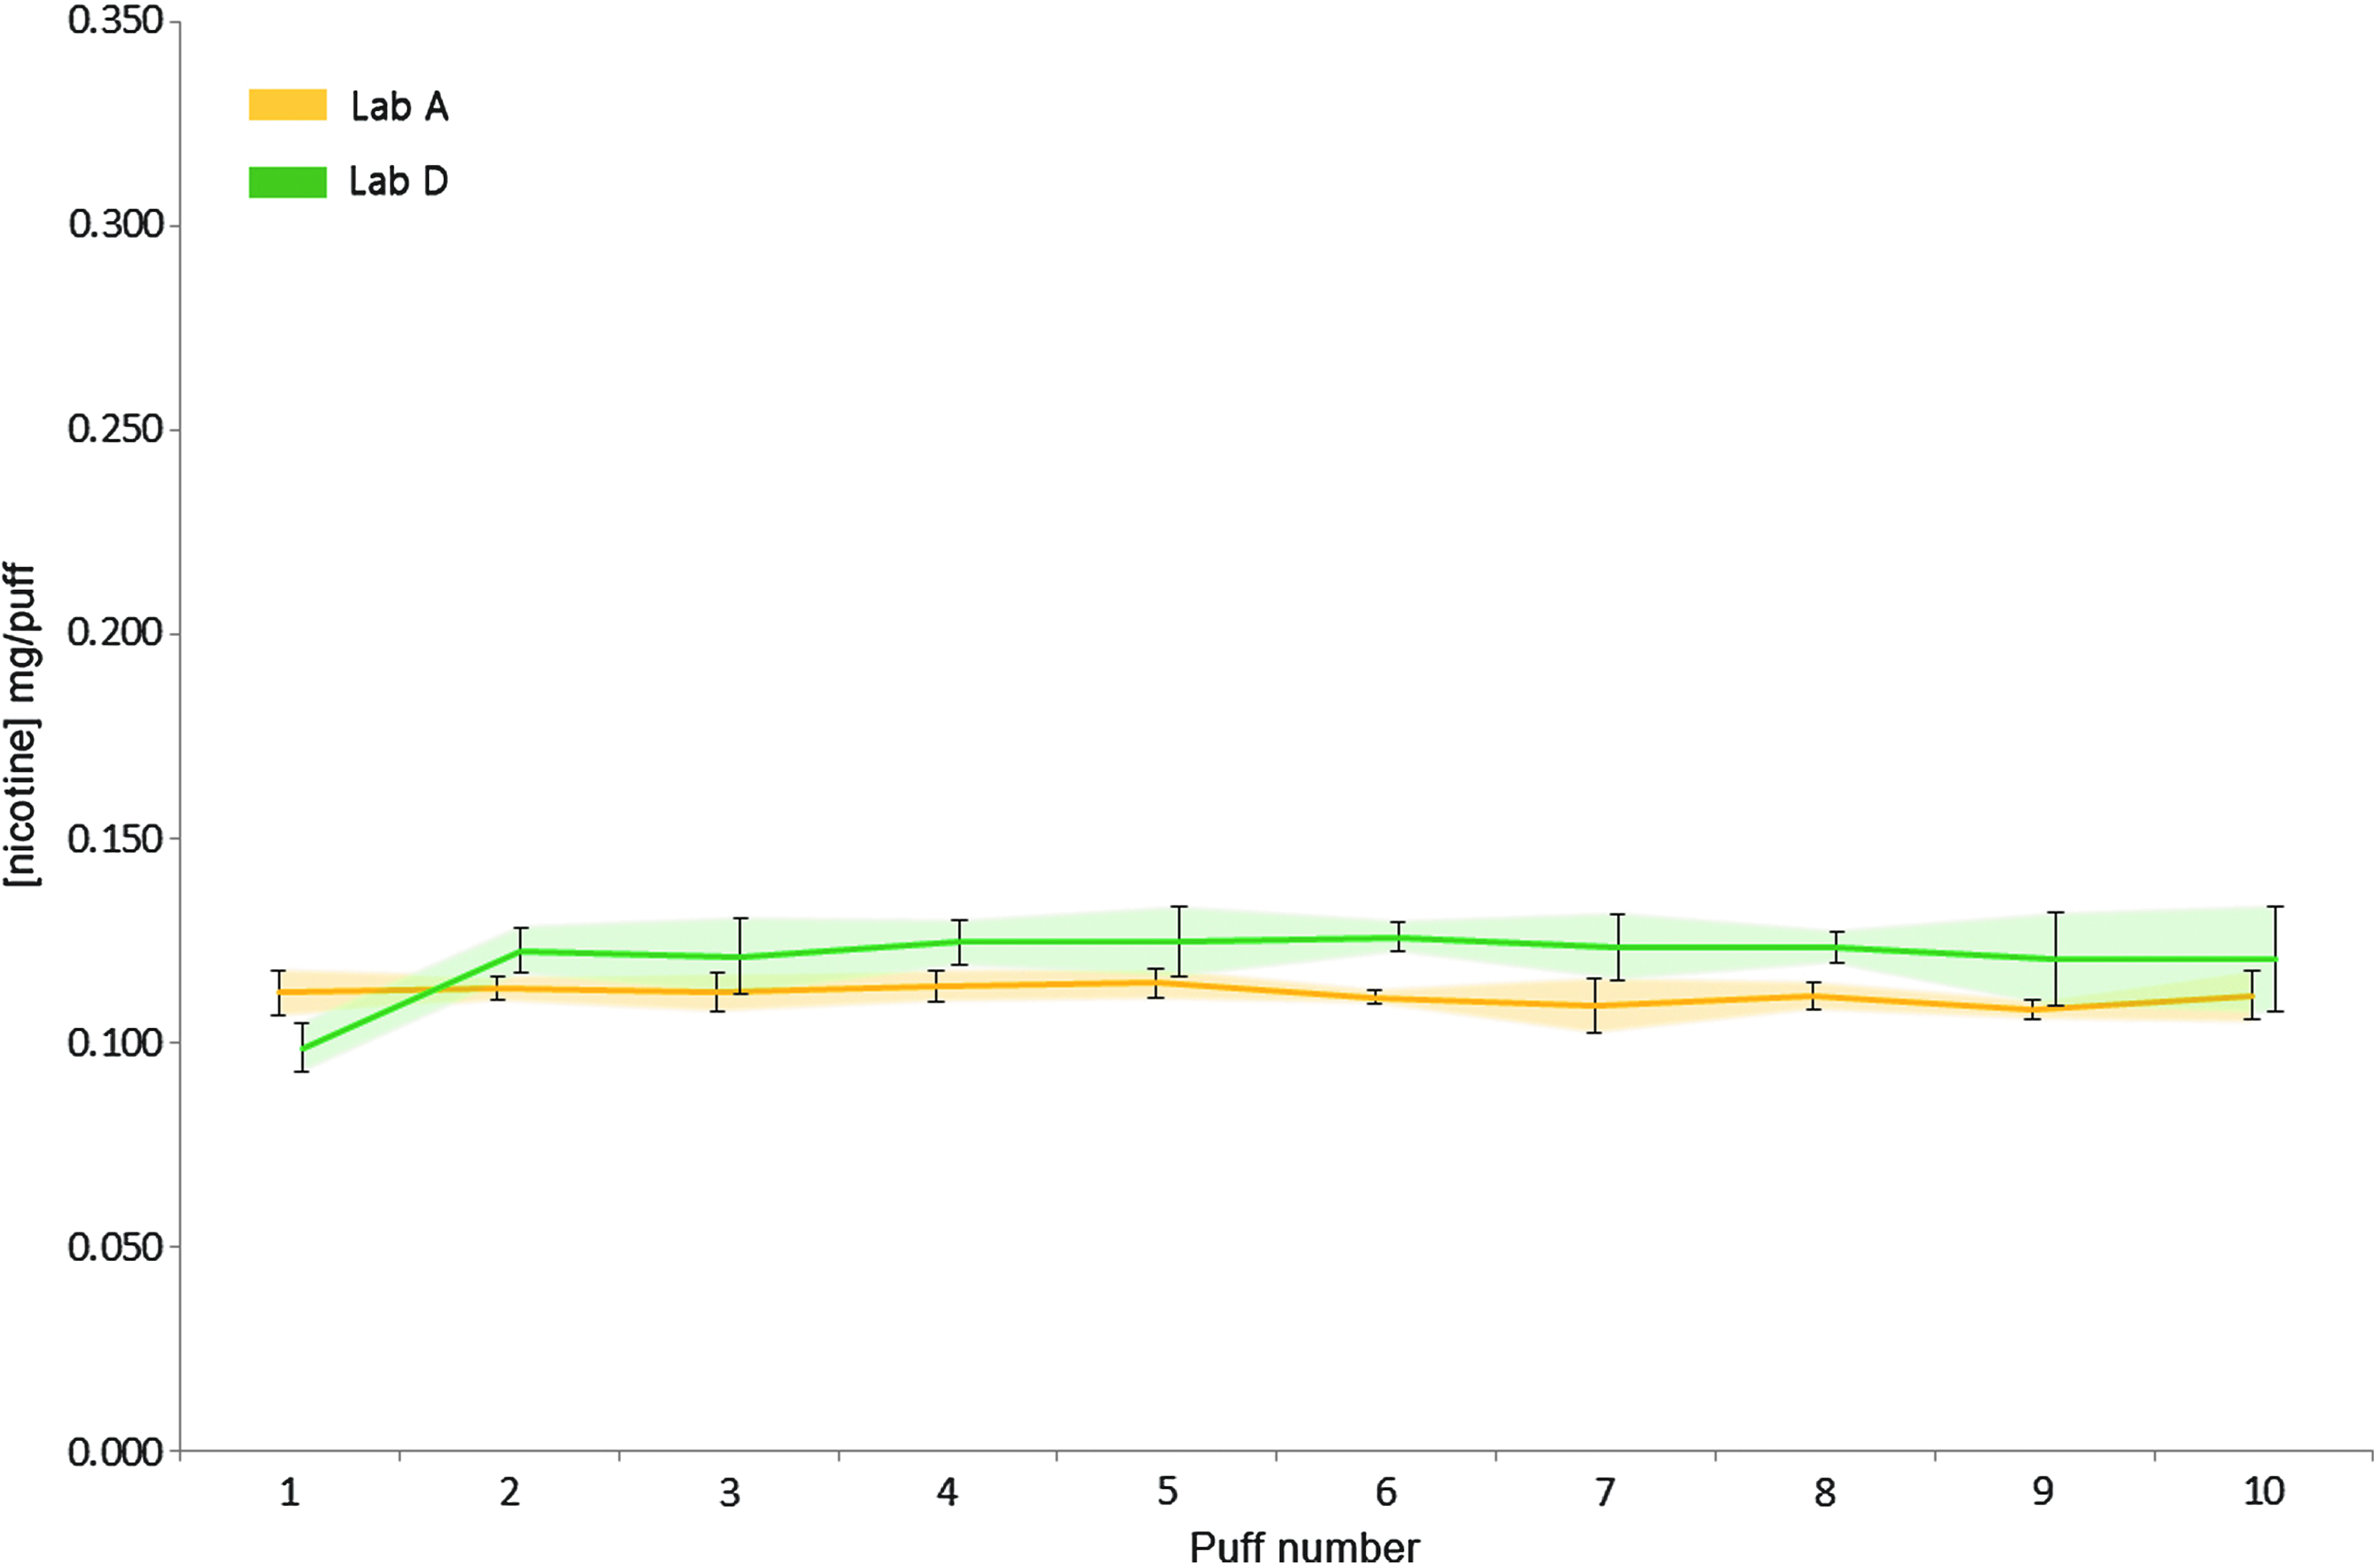
Interlaboratory nicotine at source from an e-cigarette (product B): puff-by-puff analysis of nicotine concentration in Lab A and Lab D (n = 3).
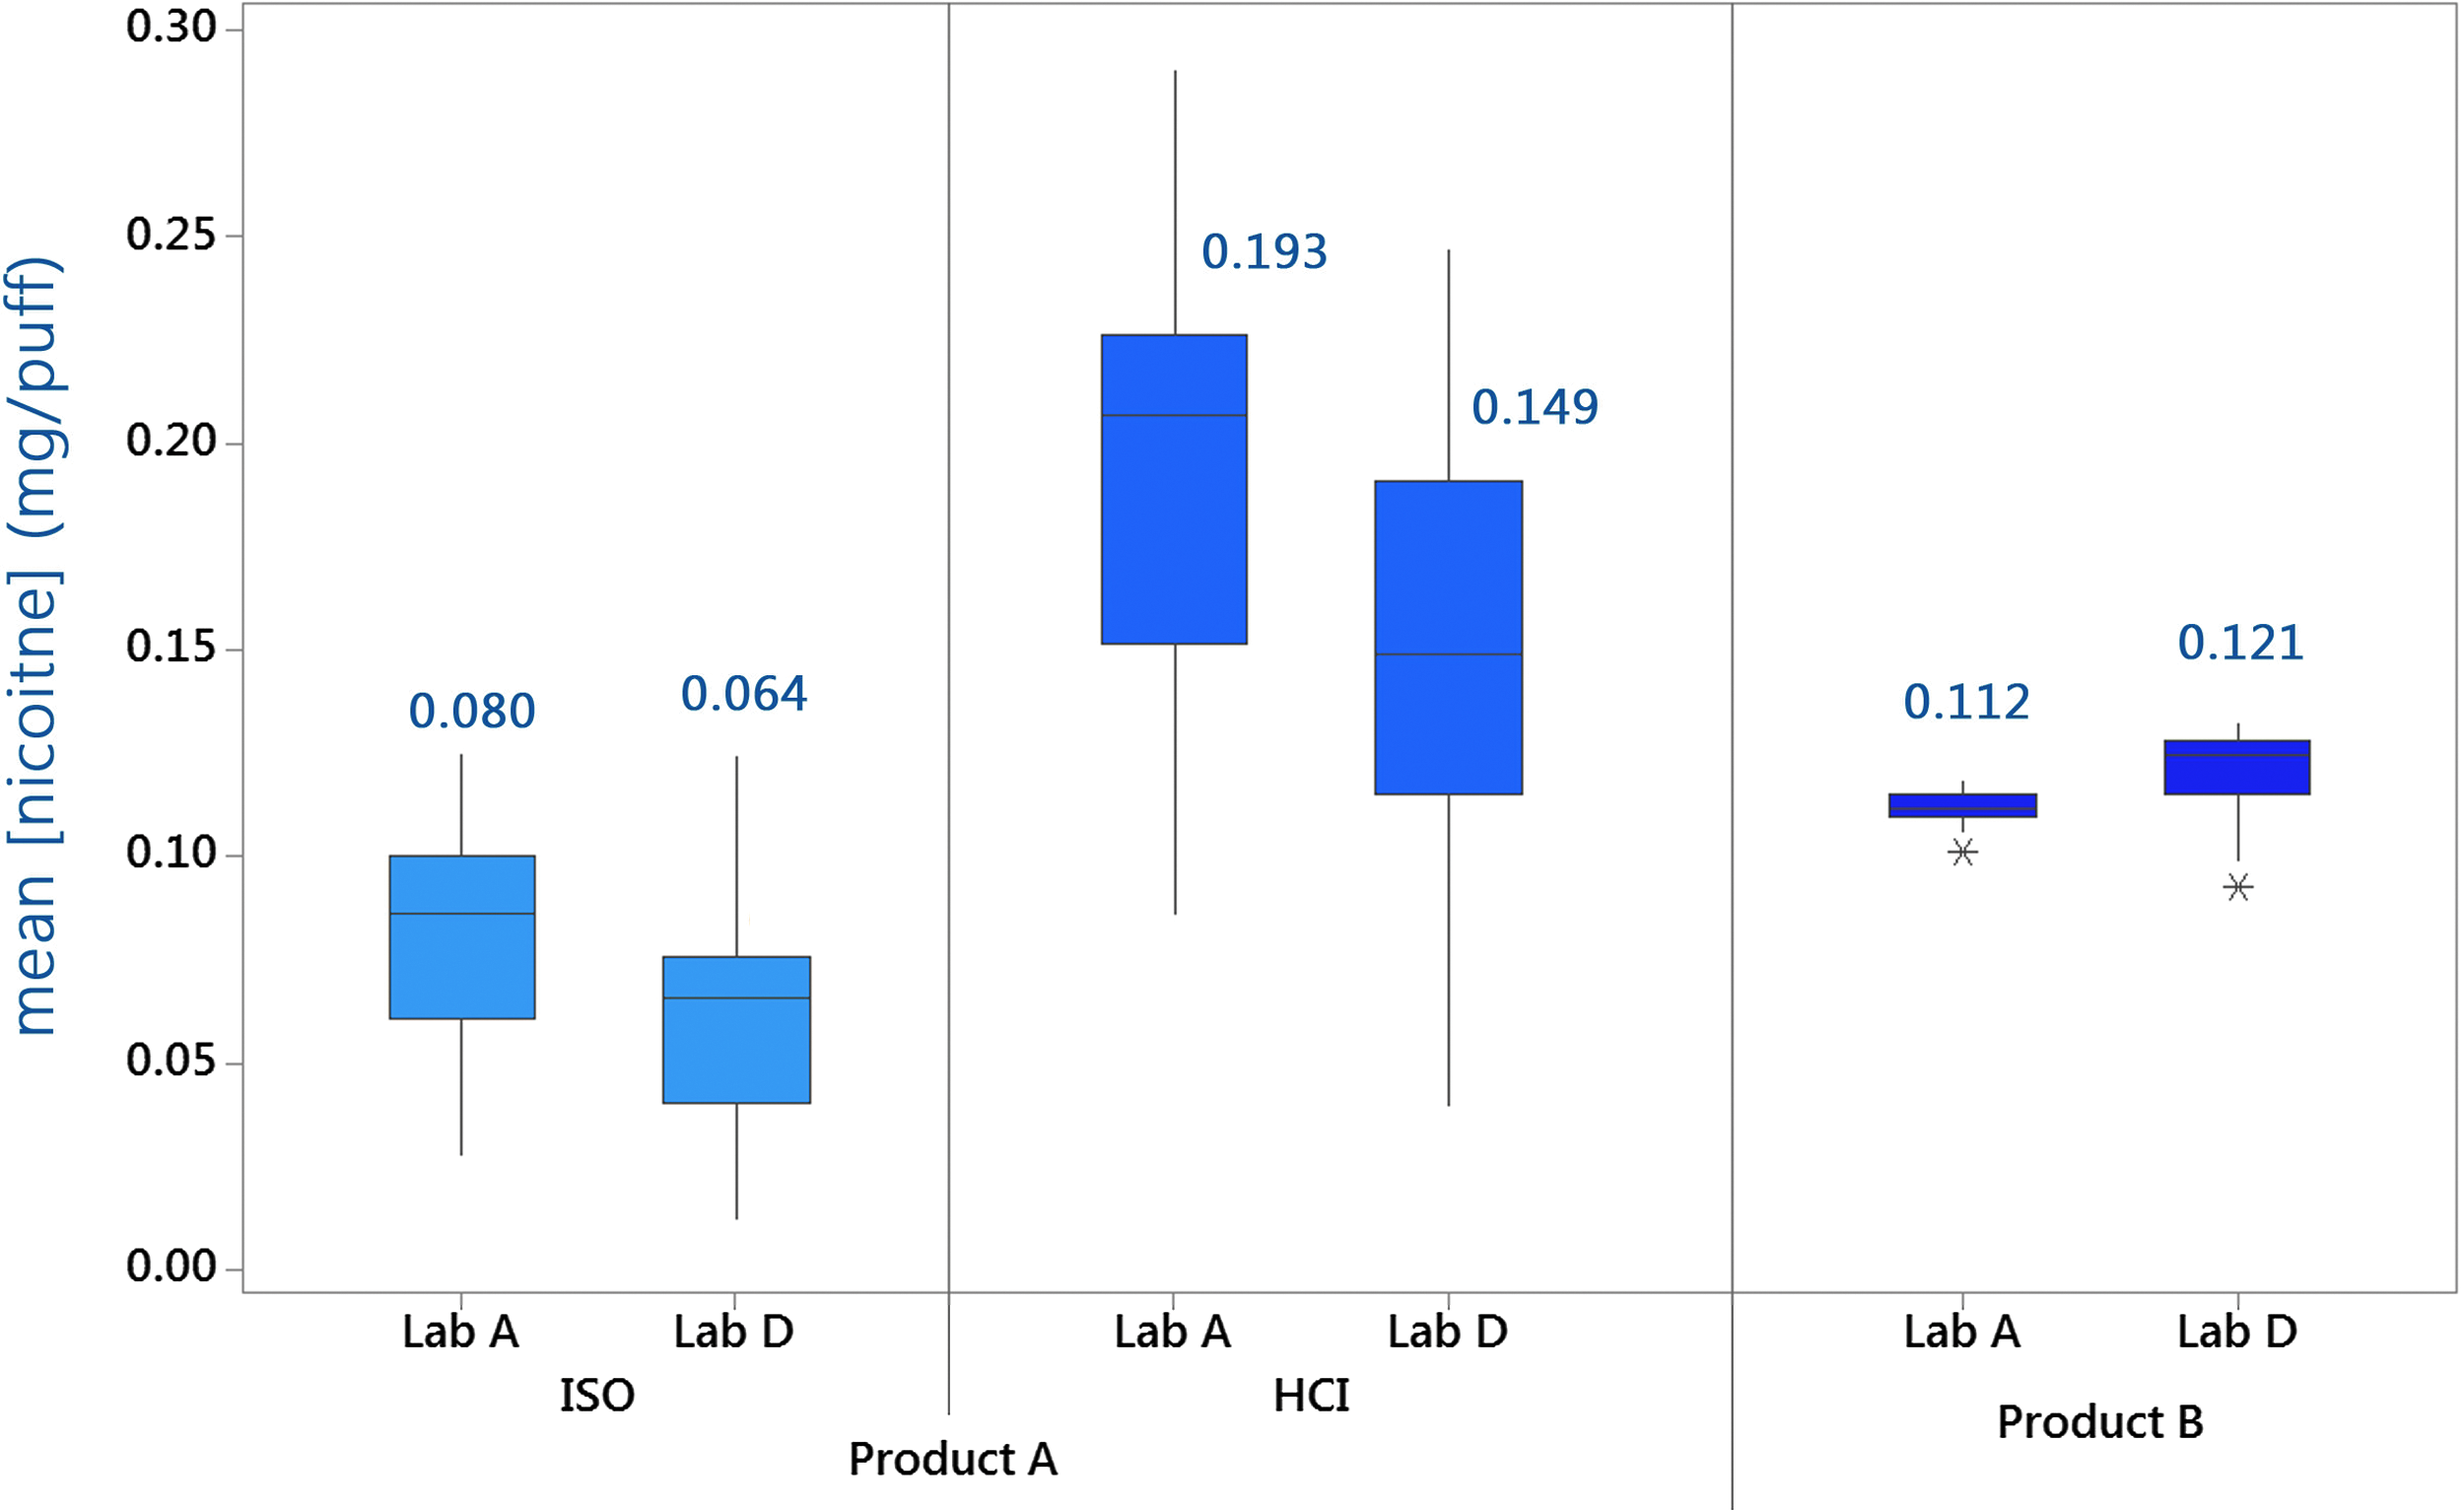
Interlaboratory nicotine at source: boxplots showing mean nicotine concentration per puff from the products tested (A, B) in the two laboratories (A and D). Boxplots display the mean (central line), the 25th and 75th percentiles (bottom and top lines of box, respectively), and the 5th and 95th percentiles (bottom and top whiskers, respectively). Outliers were calculated as data points falling outside 1.5 × 25th–75th percentile range; numbers above boxes are the mean values.
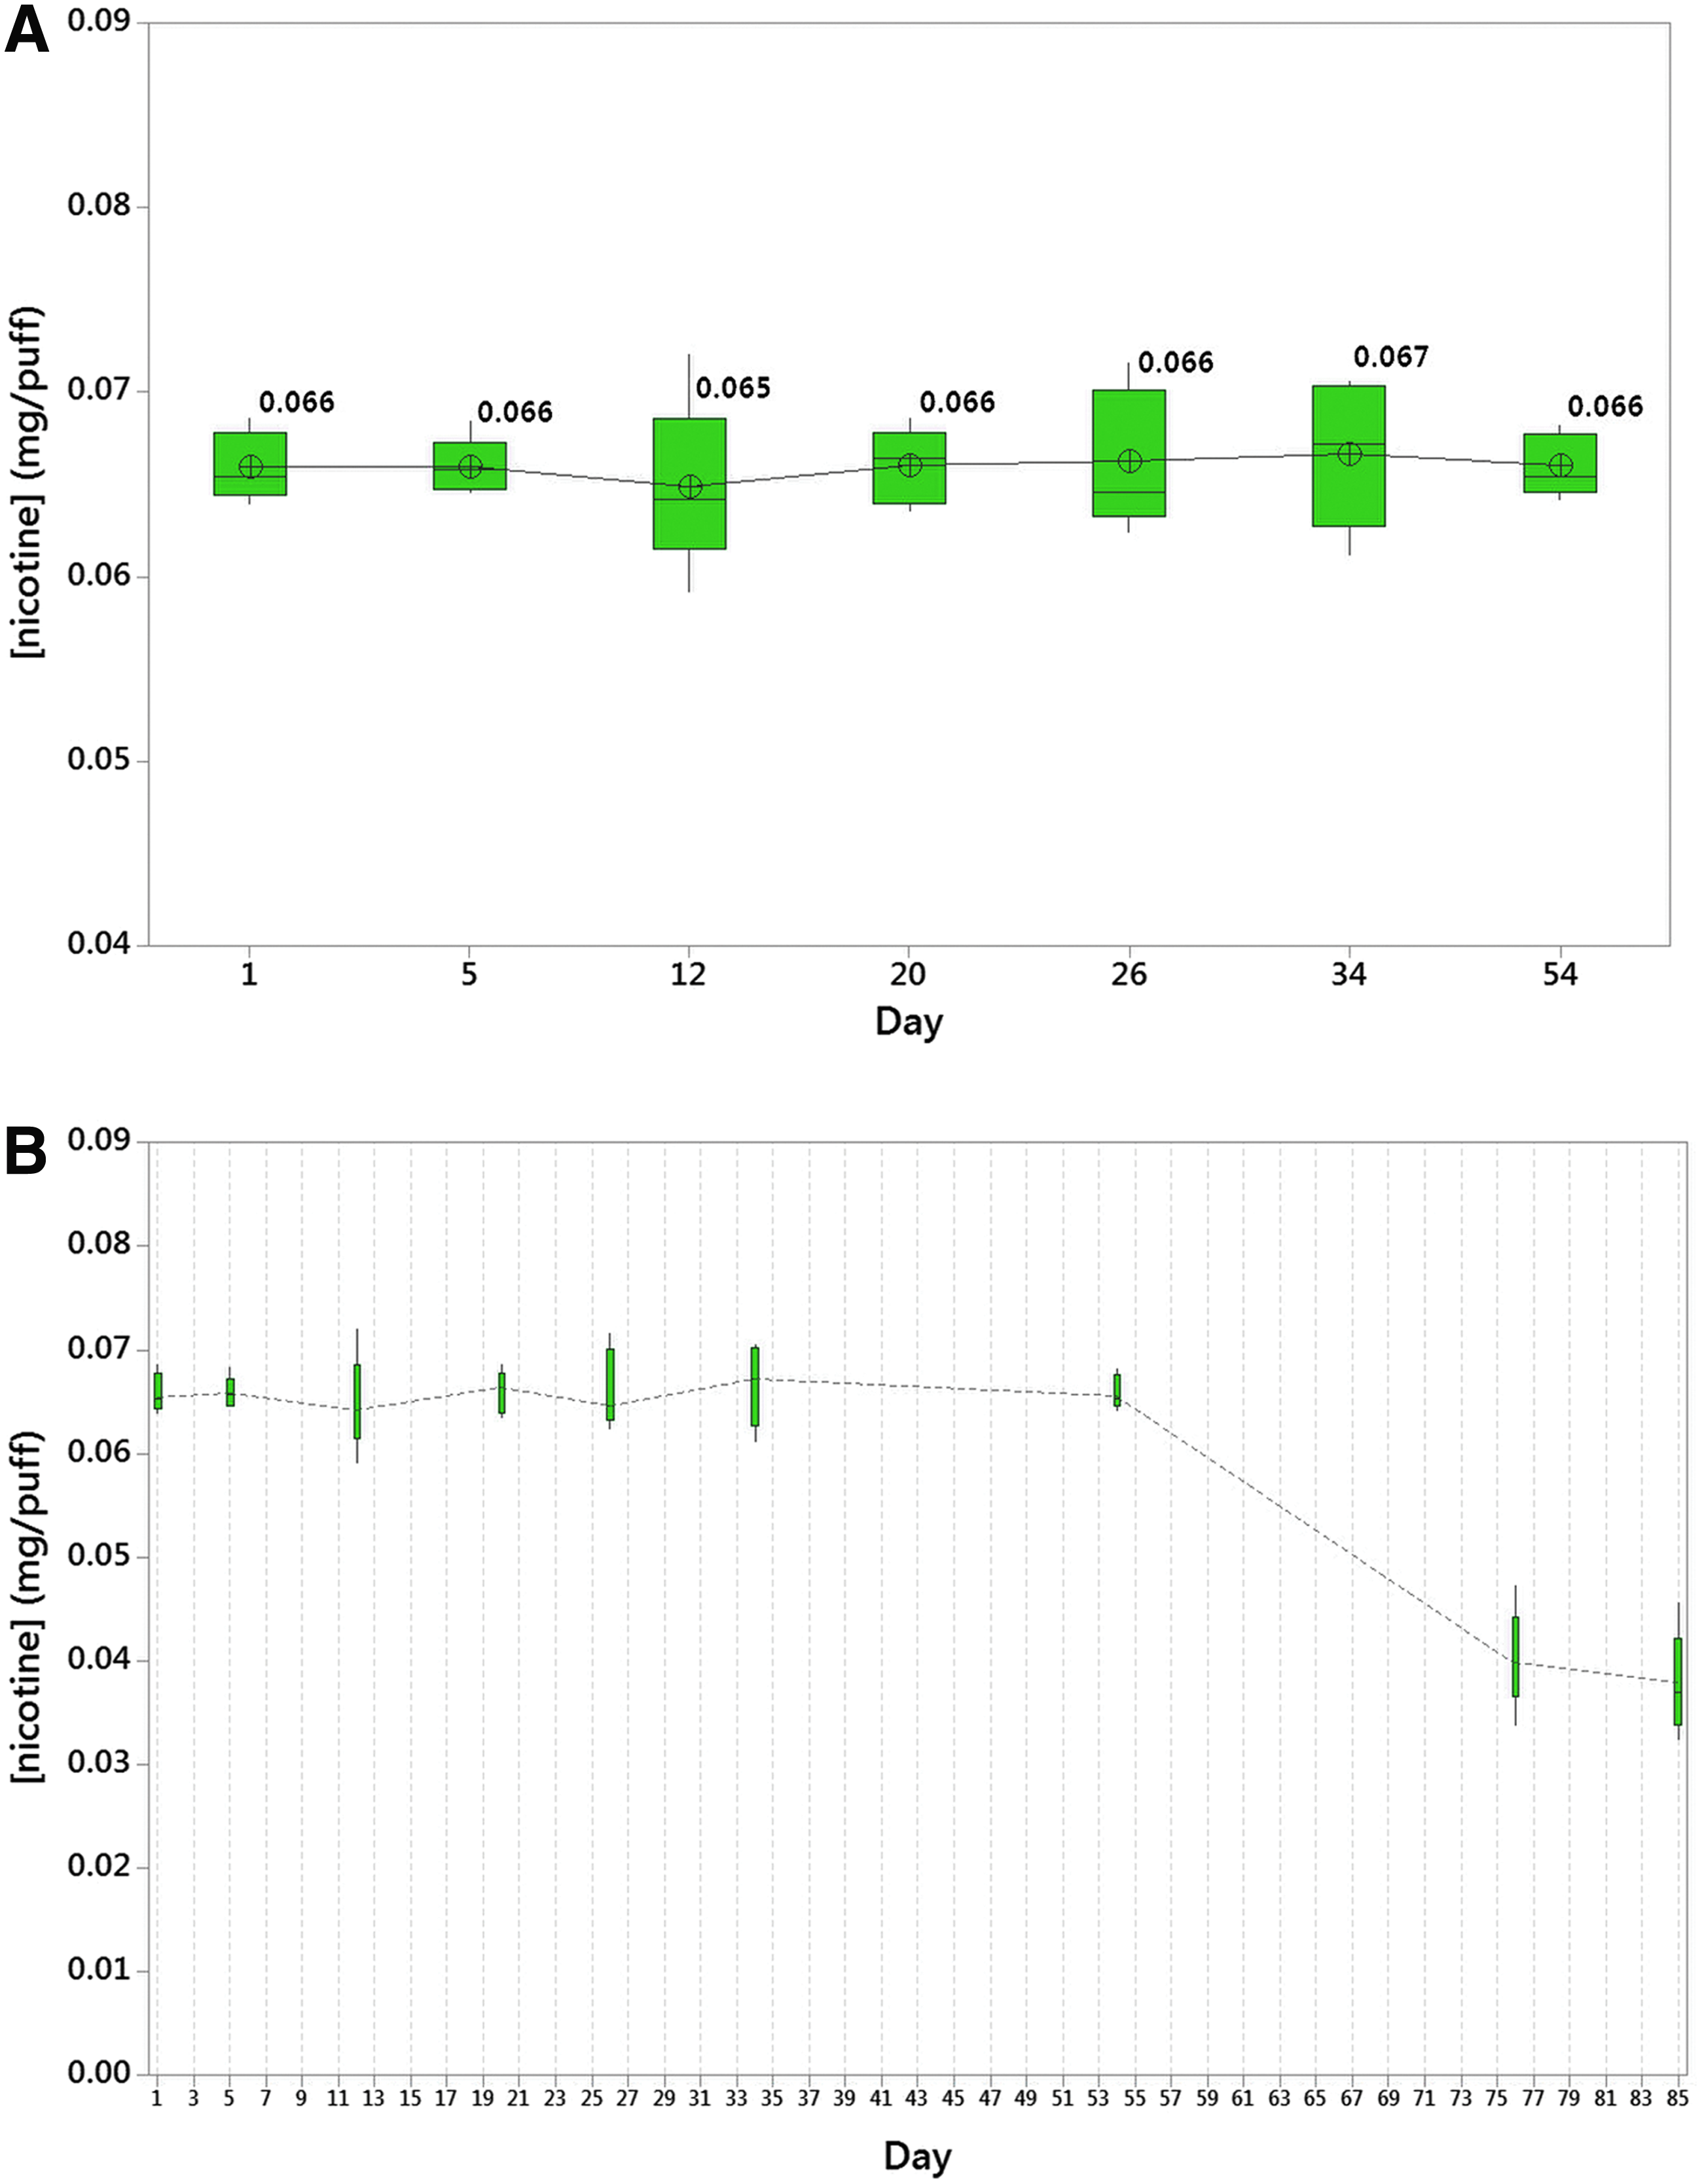
Nicotine extracts stability over time. Nicotine extracts from product D at 3-second puff duration show no degradation in nicotine days 1–54
Bias was calculated as the percentage difference at all puff numbers between one laboratory (the reference) and the other laboratory. For nicotine stability shelf life (Fig. 8), repeat measurements up to day 85 were compared using one-way ANOVA of nicotine concentration versus day, with the null hypothesis that all means were equal, and a significance level α = 0.05. One-way ANOVA was selected over GLM as there was only one variable being measured: the day. Outliers (shown in Figs. 4D and 7 as asterisks) were calculated by Minitab as any data point 1.5 × the interquartile (25th–75th) range (Tukey's method). No outliers were excluded from the analyses as there was no recorded justification (such as experimental error) to do so.
Results
Study 1: e-cigarette comparisons
One VC 10 Smoking Robot (Lab A) was designated to look at the generated aerosol nicotine concentration at source from a selection of e-cigarettes (products B–E) compared with the 3R4F reference cigarette (product A) (Fig. 4 and Appendix Table 1). Mean nicotine concentration for the cigarette (product A) following the ISO and HCI smoking regime was 0.080 ± 0.026 mg/puff and 0.193 ± 0.055 mg/puff, respectively. As shown in Figure 4A, the mean nicotine delivery (mg/puff) increased with each successive puff for the reference cigarettes, and this increase was statistically significant for both the ISO and HCI smoking regimes (GLM, p < 0.001 for both regimes). In addition, Figure 4D shows that the overall cigarette means (mg/puff) were significantly higher for the HCI regime compared with the ISO regime (GLM, p < 0.001), but were both consistent with published values per stick for ISO and HCI. 18
We then investigated the delivery and assessment of nicotine from a range of e-cigarettes (products B–E). Mean nicotine concentration for product B was 0.112 ± 0.004 mg/puff and there were no significant differences between puffs 1–10 (GLM, p = 0.708). Mean nicotine concentration for product C was 0.048 ± 0.003 mg/puff and there were no significant differences between puffs 1–10 (GLM, p = 0.204). Mean nicotine concentration for product E was 0.097 ± 0.015 mg/puff and there were statistically significant differences between puffs 1–10 (GLM, p = 0.007), but no differences when puff #1 was omitted (GLM, p = 0.112) (Fig. 4B).
As expected, the per puff nicotine concentration means of all products tested were significantly different from each other as they all vary in source nicotine concentration and have different modes of delivery (GLM, p < 0.001) (Fig. 4D). To assess the impact of puffing duration on e-cigarette aerosol nicotine concentration at source, product D was selected and puffed at 55 mL for 2 s (HCIm) and in another experiment at 3 s (CRM No81) at a 30-s puffing interval. Mean nicotine concentration was 0.053 ± 0.012 mg/puff and 0.069 ± 0.006 mg/puff for the 2- and 3-s puff duration, respectively. There were no significant differences between puffs 1 and 10 for 2-s puffing (GLM, p = 0.530) or the 3-s puffing regimes (GLM, p = 0.101) (Fig. 4C); however, the mean of 2-second and the mean of 3-second regimes were significantly different from each other (GLM, p < 0.001) (Fig. 4D).
Study 2: interlaboratory comparisons
The reference cigarette (product A) was assessed following the ISO and HCI smoking regimes in Lab A and Lab D (Fig. 5). In Lab A, the puff-by-puff range of the cigarette at ISO (puff 1–8, n = 3) was 0.032 ± 0.005–0.109 ± 0.014 mg/puff (lowest and highest recorded values, not the first and last puffs); in Lab D, the puff-by-puff range of the cigarette at ISO (lowest and highest recorded values between puffs 1 and 8, n = 3) was 0.014 ± 0.001–0.114 ± 0.009 mg/puff (Appendix Table 1). At the ISO regime, there was good agreement between the two laboratories, particularly at puff 2 (0.032 and 0.030 mg/puff), puff 3 (0.073 and 0.064 mg/puff), puff 7 (0.098 and 0.097 mg/puff), and puff 8 (0.109 and 0.114 mg/puff); only puff 1 at ISO showed substantial disagreement between Lab A and Lab D (0.058 and 0.014 mg/puff) (Fig. 5, dotted lines).
Bias was calculated by constructing a scatter plot of the value differences between Lab A and Lab D against puff number with a zero reference line (figure not shown); ISO Lab D showed a negative bias of 21% (lower than Lab A). Following the HCI smoking regime, the difference between Lab A and Lab D was a 21% negative bias again; so, although lower at both regimes, it was consistently so. In Lab A, the puff-by-puff range of the cigarette at HCI (lowest and highest recorded values between puffs 1 and 10, n = 3) was 0.097 ± 0.013–0.259 ± 0.034 mg/puff; in Lab D, the puff-by-puff range of the cigarette at HCI (lowest and highest recorded values between puffs 1 and 10, n = 3) was 0.045 ± 0.005–0.225 ± 0.031 mg/puff (Appendix Table 1). At the HCI regime, there was still some similarity between laboratories, with the greatest agreement between the two being at puff 4 (0.162 and 0.146 mg/puff) and puff 8 (0.249 and 0.225 mg/puff) (Fig. 5, solid lines). Independently, the regimes were compared between laboratories: the ISO regime in Lab A was compared with the ISO regime in Lab D and there were statistically significant differences between the two (GLM, p < 0.001); a significant difference was also observed at the HCI regime (GLM, p < 0.001).
A disposable cig-a-like e-cigarette (product B) was also assessed in Lab A and Lab D following the CRM No81 regime (55:3:30 square) (Fig. 6). The puff-by-puff range of the e-cigarette was much more conserved compared with the cigarette. In Lab A, the range (lowest and highest recorded values between puffs 1 and 10, n = 3) was 0.108 ± 0.002–0.115 ± 0.004 mg/puff; in Lab D, the puff-by-puff range of the e-cigarette (lowest and highest recorded values between puffs 1 and 10, n = 3) was 0.099 ± 0.006–0.126 ± 0.004 mg/puff (Appendix Table 1). In Lab A, there were no significant differences between puffs 1 and 10 (GLM, p = 0.708).
As observed in Figure 6, in Lab D, there was a significant difference between all puffs due primarily to a lower value at puff one, which was consistent across the three replicate experiments (GLM, p < 0.001). There was no difference, however, between puffs 2 and 10 (GLM, p = 0.848). As observed, there was large agreement between the two laboratories for the e-cigarette, particularly at puff 3, 5, 7, 9, and 10 where they had overlapping standard deviations. Bias was calculated as before: for the e-cigarette, Lab A showed a negative bias of 7% (lower than Lab D).
The mean nicotine concentrations per puff (mean of all puffs 1–8 or 1–10) for both products in both laboratories were compared; product A following the ISO regime was 0.080 ± 0.026 mg/puff and 0.064 ± 0.031 mg/puff for Lab A and Lab D, respectively; product A following the HCI regime was 0.193 ± 0.055 mg/puff and 0.149 ± 0.054 mg/puff for Lab A and Lab D, respectively; and product B was 0.112 ± 0.004 mg/puff and 0.121 ± 0.010 mg/puff for Lab A and Lab D, respectively (Fig. 7 and Appendix Table 1). After single regime/product comparisons between laboratories, a GLM test was applied to assess all interlaboratory variables from Study 2 together. When the three test observations were combined from both locations (product A following ISO, product A following HCI, and product B [Fig. 7]), laboratory differences were not significant (p = 0.067). Test article and puff number differences were significantly different from each other, as expected. Finally, the interaction of laboratory and puff number was also not significant (p < 0.960) (Fig. 7).
Nicotine extract stability was assessed in a shelf life investigation to determine whether nicotine in the samples would degrade over time and, if so, how long this would take. The same e-cigarette nicotine extracts in methanol were stored in the dark at room temperature and assessed over a period of 85 days. This investigation was intended to support a future sample cross-check between laboratory methods, thus we needed to ensure e-cigarette nicotine stability at room temperature for as long as it might take to dispatch products between United Kingdom and China (days to weeks).
Five randomized extract samples from the same experimental batch of extracts were analyzed at a time in Lab A (product D at 3 seconds) at first at regular weekly intervals, progressing to longer intervals when no difference was first observed. Between days 1 and 54, there was no observed statistical difference in nicotine concentration from the same batch of samples (one-way ANOVA nicotine versus day, p = 0.985); mean nicotine concentration fluctuated between 0.065 and 0.069 mg/puff, with the standard deviation ranging 0.002–0.005 mg/puff (Fig. 8A). When five more samples were selected for analysis thereafter, on day 76, the nicotine concentration had dropped significantly to 0.040 ± 0.005 mg/puff and confirmed once again on day 85 at 0.038 ± 0.005 mg/puff (Fig. 8B).
Discussion
Dosimetry plays an important role in understanding the dose delivery of test article aerosols to in vitro cultures during exposure. There is a key requirement to understand fully how the exposure system works to generate, dilute, and deliver aerosols to in vitro systems. It is, however, paramount to understand fully what the exposure system is generating at source and delivery to the cells. Use of QCMs can help to assess the particulate mass deposited as shown in previous studies.5,11,19,20 Nevertheless, currently, this is an expensive add-on for most of the in vitro exposure systems and requires dedicated software and user training. There is the additional challenge of using QCMs with some NGPs, especially e-cigarettes, where the crystal can be overloaded in a very short time because of the composition of the aerosol being generated by these products and their high humectant (glycerol and propylene glycol) content.
Observations in the laboratory (not shown) generally indicate that with e-cigarette aerosols, the crystal will overload and not read an increase in mass above ∼80 μg/cm2, which can be achieved in only a matter of minutes (device power, e-liquid composition, and aerosol dilution dependent). By contrast, with tobacco smoke particle deposition, QCMs can reliably record mass increases for up to 3 hours, where at a diluting airflow of 1 L/min, a final mass of 23 μg/cm2 was achieved in 184 minutes. 21 QCMs can still add value, but they should be used in shorter exposure times for product comparisons or for exposure system quality control purposes in conjunction with the use of reference cigarettes. A more facile method that can be used across many laboratories has been investigated in this study and involves the assessment of source-generated nicotine extracted from a CFP.
An in vitro aerosol exposure system will generate, dilute, and deliver smoke from cigarettes and aerosols from e-cigarettes (or other NGPs) to cell cultures at the ALI, mimicking a physiological exposure condition (for lung models in particular). Due to the diversity and complexity in typical exposure systems, the diversity of NGPs, and their aerosols being tested, one important aspect is to understand the dosimetry of the test article at source before dilution and delivery to the cells. As well as understanding the dose delivered to the cultures in vitro, understanding repeatability and variability at source and at ALI will help with interpreting biological response data and maintaining confidence in exposure systems and their results.
Furthermore, cigarettes and various NGPs cannot be assumed to result in comparable aerosol delivery and transfer within the exposure system due to differences in chemical composition, unless this was confirmed by quantification or by detailed exposure system characterization. 22 In other words, with differing product characteristics, the results obtained from a given e-cigarette might not read across to other NGPs. 23
Interlaboratory studies are another means to gain confidence in systems/methods before the method can gain wider acceptance and validation. Such studies are not without their own challenges: product variability, operator and environmental variability, analytical method differences, and of course the logistics of such tasks across large geographical distances and possible impact on product stability. In this study, we kept the in vitro exposure system (the VC 10) and products (one cigarette and one e-cigarette) the same, but purposefully wanted to investigate the differences between analytical methods for nicotine quantification once the test article had been trapped on a CFP.
Study 1: e-cigarette comparisons
The first part of our research examined different NGP comparisons in one laboratory. The puff-by-puff profile of nicotine concentration was assessed from one reference cigarette and four e-cigarettes (Figs. 1, 3, and Table 1). The results demonstrated different profiles between the cigarette and e-cigarette, as well as different deliveries between e-cigarettes [three e-cigarettes were matched for nicotine concentration in the e-liquid (products C–E were 1.8%) and one was higher (product B at 4.5%)] (Table 1 and Fig. 4).
The cigarette showed a distinct profile where the concentration of nicotine increased per puff and where HCI delivered higher nicotine than ISO (Fig. 4A). This increase typically occurs because the tobacco acts as a filter when smoked, where nicotine will deposit downstream of the cigarette as the rod is consumed per puff, thus enriching the distillable material, including nicotine, in the latter puffs. 5
After the reference cigarette, a range of e-cigarettes were tested, each a major progression in product design evolution (Fig. 1). Product B had the highest concentration of e-liquid nicotine and thus delivered the most nicotine per puff, despite being the first-generation cig-a-like device type (Fig. 4B, D). The profiles for products C–E showed increased nicotine delivery with each product despite the same nicotine concentration of 1.8%; this may be caused by the difference in their aerosol formation efficiency, rendered by different coil and power configurations from the rechargeable cig-a-like product (product C), through to the pen-like device (product D) and then the box-like device (product E).
A final comparison was made looking at nicotine concentration for the mean of all puffs per product (Fig. 4D). Clearly, the standard deviation was greater for the cigarette than the e-cigarette in all cases. The cigarette had a distinct and statistically significant difference between the first and last puff as the rod shortens. Reference cigarettes are usually made in a single batch (this is the case for the 3R4F) and that is why they can act as a reference, thus the parallel trend shown in Figure 5 between the two laboratories suggests a systematic bias, which requires further investigation. The e-cigarettes investigated in this study on the other hand comprised four main ingredients (nicotine, flavor, humectant, and water) and therefore appear to give a more repeatable delivery between puffs when the device is charged and operated correctly.
Delivery from the same e-cigarette (product D) at different puffing durations (2 or 3 seconds) showed a statistically significant difference in nicotine delivery (Fig. 4C). With an increase of just 1 second longer in the puff, the mean nicotine delivery increased by 0.016 mg/puff (from 0.053 to 0.069). This information is useful when different regimes are employed in different studies. The 55:3:30 puffing regime is recommended for e-cigarette testing (CRM No81), but sometimes the 55:2:30 square regime (HCIm) may be employed to make closer comparison with the HCI smoking regime with combustible cigarettes (as seen in previous studies5,6,8).
Study 2: interlaboratory comparisons
The second part of the study was the interlaboratory comparison of nicotine quantification results from a reference cigarette (product A) and a single e-cigarette (product B) on the VC 10 in two laboratories (Lab A and Lab D) (Fig. 3). These laboratories were part of a previous interlaboratory dosimetry study 11 and hence retained their code letters. This previous study demonstrated that in terms of tobacco smoke particle gravimetric deposition, determined by QCMs, there was strong agreement between six independent VC 10 smoking machines: gauge R&r (a statistical measure of the error between VC 10s in different laboratories and the error within the same VC 10 in a single laboratory) was 7.7%, less than 10% overall being considered statistically fit for purpose. 11
Therefore, before even commencing this latest investigation with e-cigarette nicotine concentration at source, we had confidence that the systems were performing equivalently, and perhaps any differences seen would be method or operator derived. Two different nicotine quantification methods were employed, each laboratory using their preferred/approved approach. Lab A utilized UPLC-MS/MS and Lab D utilized GC-MS; all other experimental variables were the same between laboratories unless described in Table 2.
The interlaboratory results from the cigarette showed the expected trend in both sets of results, where nicotine delivery increased per puff, and where following HCI delivered more than following ISO (Fig. 5). There was variability even within runs, demonstrated by some large standard deviations; this was likely due to the puff-by-puff method employed, which is a more challenging test to run, hence introducing a larger variability than just smoking the whole cigarette and reporting data on a per stick basis. The cigarette results between laboratories were different and showed that Lab D was consistently 21% lower than Lab A for the mean mg/puff values when following the ISO and HCI regimes. However, the overall trend between laboratories was the same. The laboratories' differing nicotine quantification methods may also be a contributing factor to the observed bias; the CFP extraction in 10 mL instead of 20 mL could have contributed to the different values obtained. An interlaboratory cross-check on the same samples (sample exchange) would help to identify such causes and is the subject of a future study.
Likely, there are numerous contributing factors (time, operator, product, method) and an additional level of variability in results would be expected in an interlaboratory study, especially when diverse methods are employed. That said, the data ranges overlap for both laboratories at both regimes for the cigarette (Fig. 7).
For the e-cigarette (product B), the inverse relationship between laboratories was observed: Lab A was 7% lower than Lab D (Fig. 6), but as discussed before, there was a repeatable puff profile between runs in the same laboratory and between the laboratories. One noteworthy observation was the repeatedly lower delivery from puff one in Lab D (Fig. 6). This is likely due to some unknown factors that affected the performance of the e-liquid cartridge (often referred to as the cartomizer) (Fig. 1).
To deliver efficiently on activation, the device must have wicked sufficient e-liquid and the cartomizer must increase from room temperature up to atomization temperature (coil heater temperatures reported as ranging 40–180°C under correct operation 24 ). Wicking will also be dependent on liquid viscosity: viscosity will be lower and therefore wicking slower at room temperature versus mid run when the cartomizer is up to temperature because the e-liquid will be more viscous and thus wicking will be quicker. These combined factors likely resulted in the relatively lower concentration of aerosol at first puff, but during subsequent puffs, the heating temperature of the device would be sustained as the interval of 30 seconds would not be enough for cooling back to room temperature.
This observation would be especially prominent when the device was allowed to cool between subsequent runs of 10 puffs (as was the case in Lab D, but not Lab A). On this note, some studies may define a priming of the electronic device, where the first few puffs are wasted to warm the device up and allow appropriate wicking. However, if the product is being assessed/evaluated in vitro, it might be argued that the test article be generated in the same way a consumer would interact with the product—without priming and including the first puff. On the other hand, slightly lower delivery on the first puff for a biological exposure is likely insignificant for the in vitro model to discriminate. Comparing just the e-cigarette results from both laboratories, statistically they were deemed different to each other, and this is partially due to such tight standard deviations observed in each laboratory.
When the laboratories were compared on a single product/regime, statistical differences were highlighted (all ≤0.05). However, when the three test observations were combined from Study 2 (Fig. 7), laboratory differences and the interaction of laboratory * puff number were not significant (p = 0.067 and 0.960, respectively).Thus, we concluded that these data show positive agreement despite geographical, operator, and method differences. The main purpose here was to compare different methods employed at the two laboratories, and considering the differences mentioned (Table 2), we believe the disparity seen between the laboratories is reasonable for a first comparison of this nature and points out useful areas for further improvements.
There are associated logistical challenges with interlaboratory studies, especially with great distance between the two, and thinking about these challenges can help for future studies. Study 2 was designed such that each laboratory would analyze their own generated samples with their own nicotine quantification method; and in future studies such as this, we would propose a double crossover whereby each laboratory would analyze and cross-check the other's samples. In this way, it would become easier to identify if the observed differences between laboratories were due to product and product operation variability (same values obtained from the same sample analyzed between laboratories) or originated in method differences (different values obtained in each laboratory from the same sample).
This was the main purpose of the shelf life investigation: to provide data to support a future investigation where transit times between laboratories may take up to one month (Fig. 8). As mentioned earlier, product selection for this study was limited by the availability of the e-cigarette to both laboratories within the time frame of the study. Considering the logistical challenges with multisite studies, the e-cigarette shelf life data will support and help the planning of future studies such as these. With the learning identified, the authors recommend sample exchange and cross-check studies in the future, along with testing of different NGPs.
The NGP spectrum will continue to evolve and so we should not always assume that what is known about a previously tested product will apply to the next category; most likely, as demonstrated herein, their aerosols will be formed differently and will be compositionally/chemically different (even if only slightly) depending on device power and delivery, e-liquid formulation and nicotine content, and how the product is consumed (its puffing regime). Exposure systems are complex and thorough characterization of new systems can take some time. More rapid dosimetric assessment of the test article composition at generation and then once again at the cellular interface once diluted and delivered to the exposure chamber (planned for future studies) can give confidence in a later observed biological response.
For those new to the environment or daunted by system characterization, these small investigations may enable the users to largely bypass the complexities between generation and exposure (associated with dilution mechanisms, transit, and aerosol loss, for example).
Ultimately, the most important aspects are (in ranking order) to show what the in vitro culture actually received during exposure (in terms of a measured marker); demonstrate the test article was generated in a consistent manner at source (as shown in this study); determine what mix of chemicals is being generated at source (nicotine and others); demonstrate that the analytical methods used for chemical characterization are fit for purpose; and then establish a quantitative measurement of the most critical markers (e.g., nicotine and other chemical substances at the ALI, depending on the known toxicological properties of the components). This latest interlaboratory study, along with the previously published work investigating dosimetry and characterizing exposure systems,11,19–22 will add another level of knowledge, reliability, and assurance in this area.
Conclusions
The in vitro dosimetry results obtained from this study demonstrated the following:
• Reference 3R4F cigarette delivers different nicotine concentrations across the two regulatory standard smoking regimes and across puff numbers in accordance with known smoke formation and delivery mechanisms. • Nicotine assessment across the tested e-cigarette categories showed consistent delivery of nicotine per puff within products and that the method was sensitive enough to detect different levels of nicotine across products. • Puffing regime affects e-cigarette nicotine delivery particularly puff duration and puff flow profile. • Interlaboratory assessment of nicotine generated at source from an e-cigarette and a cigarette in two locations with different analytical quantification methods showed the following mean values were obtained: ○ Cigarette at ISO = 0.080 ± 0.026 (Lab A) and 0.064 ± 0.031 mg/puff (Lab D). ○ Cigarette at HCI = 0.193 ± 0.055 (Lab A) and 0.149 ± 0.054 mg/puff (Lab D). ○ E-cigarette at CRM No81 = 0.112 ± 0.004 (Lab A) and 0.121 ± 0.010 mg/puff (Lab D). • Good overlap in nicotine results obtained in two laboratories utilizing different methods for nicotine quantification when all interlaboratory variables were combined in a GLM, and the laboratory differences and the interaction of laboratory * puff number were not statistically significant (p = 0.067 and 0.960, respectively). • Nicotine extracted in methanol solvent (from the e-cigarette used in this study) was stable at room temperature up to 54 days; but after 76 days, measured concentrations were ∼40% lower than the original value. This will aid experimental design for future interlaboratory studies.
Footnotes
Acknowledgments
The authors would like to acknowledge and thank Oscar Camacho, Graham Errington, Chuan Liu, Jessica Mushonganono, Andrew Baxter, Carl Vas, and Martin Mullin for their contributions at BAT; and M&J for procuring a U.S. market place e-cigarette for testing in Southampton, United Kingdom.
Author Contributions
J.A., D.T., and X.L. conceived the study. J.A. performed the experimental work at BAT, analyzed all of the data, and drafted the manuscript; X.L. and H.C. conducted the experimental work at ZTRI. F.X. and M.G. reviewed the collected data, the data analysis, and the drafted manuscript. All authors read and approved the final manuscript.
Author Disclosure Statement
J.A., D.T. and M.G. are full-time employees of British American Tobacco. X.L., H.C., and F.X. are full-time employees of the Zhengzhou Tobacco Research Institute of CNTC.
| Product A (ISO) | Product A (HCI) | Product B | Product C | Product D (2 s) | Product D (3 s) | Product E | ||||||||
|---|---|---|---|---|---|---|---|---|---|---|---|---|---|---|
| Puff | Nicotine (mg/puff) | SD | Nicotine (mg/puff) | SD | Nicotine (mg/puff) | SD | Nicotine (mg/puff) | SD | Nicotine (mg/puff) | SD | Nicotine (mg/puff) | SD | Nicotine (mg/puff) | SD |
| Lab A | ||||||||||||||
| 1 | 0.058 | 0.006 | 0.097 | 0.013 | 0.112 | 0.006 | 0.05 | 0.003 | 0.055 | 0.006 | 0.057 | 0.009 | 0.121 | 0.006 |
| 2 | 0.032 | 0.005 | 0.135 | 0.021 | 0.113 | 0.003 | 0.049 | 0.001 | 0.056 | 0.019 | 0.069 | 0.006 | 0.095 | 0.004 |
| 3 | 0.073 | 0.019 | 0.156 | 0.017 | 0.112 | 0.005 | 0.048 | 0.002 | 0.052 | 0.012 | 0.071 | 0.008 | 0.108 | 0.013 |
| 4 | 0.082 | 0.006 | 0.162 | 0.017 | 0.114 | 0.004 | 0.046 | 0.002 | 0.048 | 0.013 | 0.071 | 0.002 | 0.088 | 0.019 |
| 5 | 0.094 | 0.012 | 0.193 | 0.018 | 0.115 | 0.004 | 0.046 | 0.002 | 0.054 | 0.017 | 0.069 | 0.004 | 0.093 | 0.008 |
| 6 | 0.095 | 0.009 | 0.215 | 0.008 | 0.111 | 0.002 | 0.047 | 0.004 | 0.054 | 0.017 | 0.069 | 0.002 | 0.092 | 0.021 |
| 7 | 0.098 | 0.006 | 0.227 | 0.003 | 0.109 | 0.007 | 0.047 | 0.002 | 0.053 | 0.015 | 0.07 | 0.007 | 0.096 | 0.016 |
| 8 | 0.109 | 0.014 | 0.249 | 0.03 | 0.112 | 0.003 | 0.05 | 0.003 | 0.056 | 0.014 | 0.068 | 0.007 | 0.094 | 0.008 |
| 9 | — | — | 0.237 | 0.023 | 0.108 | 0.002 | 0.049 | 0.005 | 0.056 | 0.013 | 0.073 | 0.003 | 0.099 | 0.006 |
| 10 | — | — | 0.259 | 0.034 | 0.112 | 0.006 | 0.045 | 0.002 | 0.048 | 0.014 | 0.071 | 0.006 | 0.083 | 0.01 |
| Mean | 0.08 | 0.026 | 0.193 | 0.055 | 0.112 | 0.004 | 0.048 | 0.003 | 0.053 | 0.012 | 0.069 | 0.006 | 0.097 | 0.015 |
| Lab D | ||||||||||||||
| 1 | 0.014 | 0.001 | 0.045 | 0.005 | 0.099 | 0.006 | ||||||||
| 2 | 0.03 | 0.006 | 0.101 | 0.009 | 0.123 | 0.006 | ||||||||
| 3 | 0.064 | 0.003 | 0.113 | 0.014 | 0.121 | 0.009 | ||||||||
| 4 | 0.059 | 0.006 | 0.146 | 0.016 | 0.125 | 0.005 | ||||||||
| 5 | 0.071 | 0.006 | 0.132 | 0.01 | 0.125 | 0.009 | ||||||||
| 6 | 0.071 | 0.003 | 0.181 | 0.017 | 0.126 | 0.004 | ||||||||
| 7 | 0.087 | 0.017 | 0.173 | 0.017 | 0.124 | 0.008 | ||||||||
| 8 | 0.114 | 0.009 | 0.225 | 0.031 | 0.124 | 0.004 | ||||||||
| 9 | — | — | 0.162 | 0.036 | 0.121 | 0.011 | ||||||||
| 10 | — | — | 0.21 | 0.016 | 0.121 | 0.013 | ||||||||
| Mean | 0.064 | 0.031 | 0.149 | 0.054 | 0.121 | 0.01 | ||||||||