




Abstract
Abstract
Introduction:
In vitro substrate depletion methods developed by the pharmaceutical industry are being used with increasing frequency to support chemical bioaccumulation assessments for fish. However, the application of these methods to high log Kow chemicals poses special challenges.
Materials and Methods:
Biotransformation of three polycyclic aromatic hydrocarbons (PAHs) was measured using trout liver S9 fractions. Studies were performed to evaluate the working lifetime of the S9 preparation, assess effects of chemical spiking solvents, and characterize the concentration-dependence of activity.
Results:
Derived kinetic constants (KM and Vmax) suggested that the three PAHs (phenanthrene, pyrene and benzo[a]pyrene) are transformed by the same reaction pathway and indicated an inverse correlation between KM and chemical log Kow. Reaction rates were proportional to unbound chemical concentrations except when these concentrations approached saturating levels, providing a direct demonstration of the free chemical hypothesis.
Discussion:
These findings suggest that previous in vitro work with high log Kow compounds has been conducted at inappropriately high substrate concentrations, resulting in underestimation of true in vivo activity. Preliminary calculations also indicate that PAH metabolism in fish may approach saturation during standardized in vivo testing efforts, potentially resulting in steady-state levels of accumulation greater than those that occur in a natural setting.
Conclusion:
The use of in vitro methods to predict metabolism impacts on chemical bioaccumulation in fish requires careful consideration of study conditions to ensure that measured rates of activity can be extrapolated with confidence to the intact animal.
Introduction
I
Alternatively, in vitro studies may be performed by monitoring the disappearance of parent compound. This substrate depletion approach, which does not require knowledge of metabolic pathways or products, was pioneered by the pharmaceutical industry to predict hepatic clearance of drug candidates.1–3 When employed for this purpose, the assay is typically run at a starting substrate concentration known (or assumed) to be well below KM. These conditions generally result in log-linear depletion kinetics and yield a first-order depletion rate constant (kdep; 1/min). Dividing kdep by the protein (S9 or microsomal fraction) or hepatocyte concentration gives the in vitro intrinsic clearance (CLin vitro,int; mL/min · mg protein or 106 cells), which may be interpreted as the ratio Vmax/KM. The substrate depletion approach may also be used to estimate KM and Vmax by measuring initial reaction rates across a range of substrate concentrations. 4 In this case, the derived parameters reflect the net result of all pathways operating on the compound of interest.
Substrate depletion methods have been adopted by ecotoxicologists to predict hepatic clearance of hydrophobic environmental contaminants by fish.5,6 Chemical accumulation in fish may be substantially reduced by biotransformation,7–9 but the rate of this activity is not easily predicted from chemical structure or simple physicochemical properties. In vitro assays are therefore used to obtain this information, which is then extrapolated to the whole animal and employed as an input to predictive models for chemical accumulation. In such cases, the principal concern is for elimination of the parent compound and not production of any specific metabolite. The use of a substrate depletion approach is therefore appropriate. Because they represent complete metabolizing systems, most of this research has been performed using liver S9 fractions or isolated hepatocytes.
To date, these studies have shown that incorporating in vitro metabolism data into predictive models for chemical accumulation substantially improves model performance; thus, predicted bioconcentration factors (BCFs; defined as the steady-state chemical concentration in a fish divided by that in water, assuming a water-only exposure) tend to be much closer to measured BCFs than are modeled predictions that assume no metabolism.10–14 Generally, however, there is a trend toward underprediction of apparent in vivo activity, which results in overprediction of observed bioaccumulation. This is particularly true when hepatic clearance is assumed to be controlled by unbound (free) chemical concentrations in vitro and in vivo.
Several explanations have been offered for these findings, including kinetic considerations that make bound chemicals available to metabolizing enzymes in the liver, 15 and the possible contribution of extrahepatic metabolism. 16 Active uptake into the hepatocyte may result in an unbound chemical concentration within the cell that is substantially higher than that in plasma. 17 However, this process is unlikely to be important for most neutral chemicals, including those of concern for the majority of bioaccumulation assessments. Finally, it is possible that in vitro assays simply do not reflect true levels of in vivo intrinsic clearance.
The purpose of this study was to rigorously evaluate an in vitro assay (trout liver S9 fraction) that has been used by a number of research groups to predict in vivo hepatic clearance in fish.6,12–14 The questions evaluated in this study are relevant, however, to the use of other in vitro metabolizing systems (e.g., microsomes and suspended or plated hepatocytes). An optimized method was then employed to estimate KM and Vmax values for biotransformation of three polycyclic aromatic hydrocarbons (PAHs). To support this effort, we determined unbound chemical concentrations using a vial equilibration method. These findings yield a direct test of the free chemical hypothesis as it pertains to in vitro measurement of PAH metabolism and provide an improved basis for relating this information to chemical exposures experienced by fish in the wild and in standardized in vivo testing efforts.
Materials and Methods
Chemicals
Benzo[a]pyrene (BAP), phenanthrene (PHEN), pyrene (PYR), ethoxyresorufin, p-nitrophenol (p-NP), and 1-chloro-2,4-dinitrobenzene (CDNB) were purchased from Sigma-Aldrich. The reported purity for these chemicals was >95%. β-Nicotinamide adenine dinucleotide phosphate (β-NADPH; >95% pure) was purchased from Oriental Yeast Co. Adenosine 3′-phosphate 5′-phosphosulfate (PAPS; 80% pure) was obtained from EMD Millipore (Calbiochem). All other chemicals and solvents were purchased from Sigma-Aldrich and were reagent grade or higher in quality.
Animals
Rainbow trout (Oncorhynchus mykiss) weighing ∼100 g were obtained from the USGS Upper Midwest Environmental Sciences Center and grown up to the size used in these studies. The fish were fed commercial trout chow (Classic Trout; Skretting) and maintained on a 16-hour light–8-h dark cycle at 11 ± 1°C. Water employed for fish holding was obtained directly from Lake Superior (single pass, sand filtered, and UV treated) and had the following characteristics: alkalinity, 41–44 mg/L as CaCO3; pH, 7.6–7.8; total ammonia, <1 mg/L; and dissolved oxygen, 85%–100% of saturation.
The fish used in this study were ∼1.5 years old at the time of sacrifice and had not previously undergone a spawning cycle. Their sexual maturity was evaluated by calculating the gonadosomatic index (GSI) for each animal (equal to the mass of gonads/mass of body × 100). GSI values ranged from 0.03 to 0.05 for males and 0.16 to 0.22 for females. A comparison of these values with published information for trout18,19 indicates that the fish were in very early stages of sexual maturation (stage I/II for males and II/III for females). Previous work has shown that hepatic biotransformation rates in sexually immature trout vary little if at all with gender.20,21
Preparation and characterization of liver S9 fractions
Liver S9 fractions were prepared using procedures given by Johanning et al. 22 Briefly, fish were killed with an overdose of 3-aminobenzoate methanesulfonate (MS 222; 300 mg/L) buffered with NaHCO3 (900 mg/L). Previous work has shown that MS 222 used in this manner does not impact cytochrome P450 (CYP) protein levels or measured levels of CYP activity.23,24 The body cavity was opened, exposing the liver, and the hepatic vein was severed to permit a free flow of blood. The liver was then cleared of blood by perfusion with Hanks' balanced salt solution (CaCl2−, MgSO4−, and phenol red-free) supplemented with 2.3 mM ethylenediaminetetraacetic acid (EDTA) and 10 mM HEPES.
Livers were individually homogenized in two volumes of homogenization buffer using 4–5 strokes of a Potter-Elvehjem mortar and pestle. The homogenization buffer (pH 7.80 ± 0.05) consisted of 150 mM KCl, 50 mM Tris, 1 mM dithiothreitol, 2 mM EDTA, and 250 mM sucrose. Pooled homogenates, representing 5–6 fish of mixed sex, were centrifuged at 13,000 g for 20 minutes at 4°C. Aliquots (0.5 mL) of the S9 fraction were then flash-frozen in liquid N2 and stored at −80°C. Detailed information pertaining to each pool of test material is shown in Table 1.
Characterization of Pooled Trout Liver S9 Fractions Used in Various Experiments
Values given in parentheses indicate the number of replicated determinations.
HSI, hepatosomatic index; GSI, gonadosomatic index; EROD, 7-ethoxyresorufin-O-deethylase; UGT, UDP-glucuronosyltransferase; GST, glutathione-S-transferase; CYP, cytochrome P450; N/P, not performed.
The metabolic activity of S9 fractions was evaluated by performing a set of assays using model substrates for CYP1A, UDP-glucuronosyltransferase (UGT), and glutathione-S-transferase (GST). CYP1A activity was characterized by measuring the rate of 7-ethoxyresorufin O-dealkylation (EROD assay). 25 UGT activity was characterized by measuring glucuronidation of p-NP. 26 GST activity was assessed by measuring glutathione conjugation of CDNB. 27 All assays were performed using saturating substrate concentrations at the physiological temperature (11 ± 1°C) and pH (7.80 ± 0.05) for trout. Additional details pertaining to these assays are given elsewhere. 28 The protein content of each pooled sample was measured using Peterson's modification of the Lowry method (Sigma technical bulletin TP0300). Total CYP content was determined using a dithionite difference spectroscopy method 29 modified for use with fish. 30
Method optimization
Substrate depletion experiments were performed at 11 ± 1°C by spiking PHEN, PYR, or BAP into 1-mL reaction mixtures containing 100 mM potassium phosphate buffer (pH 7.80 ± 0.05), 2 mM β-NADPH, 2 mM uridine 5′-diphosphoglucuronic acid (UDPGA), 0.1 mM PAPS, and 5 mM reduced
The kinetics of substrate depletion may be impacted by a loss of enzyme activity over time. This is a special concern when dealing with fish because measured rates of activity are often much lower than those in mammals for the same biotransformation reaction. Thus, longer periods of time may be required to obtain measurable depletion of a parent substance. To investigate the effect of time on clearance of the three test compounds, we prepared incubation mixtures and then held them in a water bath at 11°C for varying lengths of time (referred to here as the holding time) before starting the reaction. The amount of alamethicin added to these reactions was 25 μg/mL. Duplicate reactions were initiated immediately (0 hours) after placing the vessels in the water bath (after thermal equilibration) and again after 0.5, 1, 2, and 3 hours.
To facilitate their introduction and promote rapid distribution and dissolution, hydrophobic compounds are often spiked into in vitro assays using an organic solvent. However, the solvent itself may impact the measured activity of the system. Preliminary studies were conducted by spiking PHEN into the S9 system using 0.5% or 2% (v/v) ACN or acetone. Depletion rates obtained using acetone were consistently faster than those measured using ACN (data not shown). In each case, however, the dataset suggested a solvent concentration effect. To evaluate this question further, we performed triplicate depletion assays with PHEN, introduced using different amounts of acetone. These assays were again performed using 25 μg/mL alamethicin. The final concentration of acetone was varied from 0.25% to 5% (v/v).
The introduction of alamethicin to the S9 system requires the use of a small amount of solvent (typically methanol). This solvent, like that used to spike in test chemicals, may have negative effects on enzyme activity. Alternatively, alamethicin itself may impact some nonglucuronidation reactions. Triplicate depletion assays with PHEN were therefore run at alamethicin concentrations ranging from 10 to 50 μg/mL, which is the concentration range typically employed for research on mammalian microsomal fractions.31,32 To limit the confounding influence of methanol addition, all of these assays were performed using 0.25% methanol (final concentration [v/v]). Additional assays were then performed without added methanol or alamethicin or with 0.25% methanol only. The results suggested that 25 or 50 μg/mL alamethicin may impact PAH metabolism (see below). Thus, all subsequent assays were run at a constant ratio of 10 μg alamethicin/mg S9 protein, with a final methanol concentration of 0.1%.
Determination of kinetic parameters, KM and Vmax
Michaelis–Menten constants (KM and Vmax) for the disappearance of PHEN, PYR, and BAP were determined by performing triplicate depletion experiments at six or seven substrate concentrations. Taking into account the dilution factor associated with sampling (fourfold) as well as the need to measure substrate depletion over time, the lowest tested concentrations were designed to be ∼30 times greater than analytical detection limits. Under these conditions, substrate concentrations in sample extracts from later sampling times were 3–5 times higher than the limit of detection. Preliminary experiments were performed to develop sampling protocols for each of the tested concentrations. The goal was to develop a protocol in which 10%–50% of substrate was depleted across 5–8 sampling intervals. The outcome was a unique set of sampling times for each of the tested concentrations.
Effect of S9 protein concentration on in vitro clearance
The effect of S9 protein concentration on in vitro clearance was evaluated by measuring depletion rates for all three PAHs at protein concentrations ranging from 0.1 to 2.0 mg/mL. These experiments were performed at fixed substrate concentrations of 0.02, 0.006, and 0.002 μM for PHEN, PYR, and BAP, respectively. In each case, this starting concentration was at least 10-fold lower than the KM value determined at 1 mg/mL S9 protein (see Determination of KM, Vmax, and CLin vitro,int section). Binding effects on clearance were then investigated by measuring unbound chemical fractions at the same tested protein concentrations.
Measurement of unbound chemical fractions using a vial equilibration method
Bound and unbound (free) chemical fractions in buffer solutions containing 0.1–2.0 mg/mL S9 protein were determined using a vial equilibration method.33,34 The freely dissolved chemical concentration was controlled by equilibrium partitioning from silicone, while the total concentration in solution was measured as the dependent variable. Silicone polymer (500 mg; MED-4210, Factor II) was cast into 10-mL glass vials and allowed to cure. The silicone was then loaded with PHEN and PYR (tested together), or BAP, using methanol as the carrier solvent. 34 Binding of PHEN and PYR was determined using five vials, sampled in triplicate, for each of the five S9 protein concentrations tested (25 vials total). Anticipating that BAP would present a special challenge due to its high log Kow value, seven vials sampled in triplicate were used to measure binding (35 vials total).
Vials containing 2 mL of potassium phosphate buffer (100 mM) or S9 suspension were incubated at 11°C on an orbital shaker (350 rpm; IKA Vibrax VXR; IKA Works). Preliminary studies were conducted to determine the length of time needed to achieve equilibrium and the amount of rinsing required to obtain stable buffer values after the introduction of S9 protein. For PHEN and PYR, buffer samples were equilibrated for 4 hours, while samples containing S9 protein were equilibrated for 24 hours. Following the introduction of S9 protein, these vials were rinsed 20 times with 2 mL of deionized water (Milli-Q; Millipore), accompanied each time by vigorous shaking. For BAP, buffer samples were equilibrated for 24 hours, while samples containing S9 protein were equilibrated for 72 hours. Following the introduction of S9 protein, these vials were rinsed 35 times with 2 mL of deionized water. The S9 fractions were inactivated before the binding studies by withholding cofactors and allowing the samples to stand at ∼25°C for 24 hours before use. 30
Following equilibration, subsamples containing buffer or S9 suspension were pipetted into ACN (twofold dilution for buffer samples, fivefold dilution for S9). Precipitated protein in the S9 samples was pelleted by centrifugation at 3000 g for 5 minutes. The resulting supernatant was then diluted as needed with 75% ACN/25% water (v/v), depending on the test compound and S9 concentration. The freely dissolved chemical fraction (fu) in samples containing S9 protein was calculated as Cbuffer/Ctot, where Ctot refers to the measured PAH concentration for an individual vial containing S9 protein and Cbuffer is the average of buffer values determined for the same vial before and after the introduction of S9 protein. The bound fraction of chemical was calculated as 1 − fu.
Analytical methods
A high-performance liquid chromatography (HPLC) method was used to measure PHEN, PYR, and BAP. Samples were injected onto an Agilent 1260 HPLC system equipped with a fluorescence detector. Chromatography was performed with a reverse-phase Hypersil Green PAH column (3 μm, 100 × 2.1 mm; Thermo Fisher Scientific). Solvent A consisted of 90% water (Milli-Q; Millipore) and 10% ACN. Solvent B consisted of 5% water and 95% ACN. The solvents were run isocratically at a flow rate of 0.7 mL/min, but the proportions of solvents A and B were changed for each PAH to optimize run time and peak symmetry. The excitation/emission wavelengths (nm) were 260/350 (PHEN), 237/390 (PYR), and 255/420 (BAP). The limits of detection for PHEN, PYR, and BAP were about 0.5, 0.2, and 0.1 nM, respectively. The PAH content in the S9 extracts was quantified by comparing peak areas with those of known standards.
Data analysis
A linear equation was fitted to log10-transformed data from each substrate depletion experiment to calculate a first-order depletion rate constant (kdep; 1/h, equal to −2.3 × slope). This equation was fitted to all data points if the data exhibited log-linear kinetics. If the data exhibited a nonlinear pattern, kdep was calculated only from the initial log-linear phase of the depletion curve.
The Michaelis–Menten kinetic parameters, KM and Vmax, were estimated using the method given by Obach and Reed-Hagen.
4
This procedure involves measuring the rate of substrate depletion across a range of substrate concentrations. The kdep values determined at each substrate concentration ([S]; μM) are then fitted to an equation of the form
where KM is the [S] at which kdep is half-maximal and kdep([S] → 0) is the first-order depletion rate constant expected at very low substrate concentrations. Although initially developed as an empirical relationship, subsequent work has shown that Equation (1) is theoretically sound. 35 Once the value of KM has been estimated, Vmax for the reaction may be calculated by rearrangement of Equation (1). Ideally, KM and Vmax are determined from experiments where the total extent of substrate depletion (% of starting value) is <10%. However, errors in their estimation are small (<15%) if <50% of substrate has been consumed. 35 Estimated rates of CLin vitro,int were calculated as kdep([S] → 0) divided by the S9 protein concentration in the reaction vessel. Identical CLin vitro,int values may be calculated from the ratio Vmax/KM after unit conversion.
Results
Characterization of pooled trout liver S9 fraction
Pooled S9 fractions were characterized to determine their protein and CYP content, as well as their activity toward a set of standard substrates (Table 1). Measured EROD and UGT activities ranged from 4.5 to 6.1 pmol/min · mg protein and 678–1074 pmol/min · mg protein, respectively. The range of measured GST activities was 466–698 nmol/min · mg protein. Given the genetic diversity of the sampled fish population, these modest differences in activity among S9 pools are expected. Similar EROD, UGT, and GST values have been reported for the same strain of trout, 28 suggesting that the pooled S9 fractions possessed representative levels of activity.
Method optimization
To investigate the time dependence of in vitro activity, freshly thawed liver S9 fractions were held for varying lengths of time at 11°C before starting a depletion experiment. Figure 1A shows the complete set of results for PYR. In this and other figures showing substrate depletion data, concentrations depicted at each time point represent the mean ± standard deviation (SD) of individual values from replicate assays run in parallel. The plotted curves were then developed using these mean values and do not represent the results of any single assay. The means ± SDs of fitted kdep values for each set of assays are given in Table 2.

Effect of storage time on biotransformation of PHEN, PYR, and BAP by trout liver S9 fractions.
Fitted Depletion Rate Constants (kdep; 1/h) From S9 Optimization Studies
The nominal starting concentrations of phenanthrene, pyrene, and benzo[a]pyrene were 0.045, 0.03, and 0.005 μM, respectively.
The nominal starting concentration of phenanthrene was 0.035 μM.
Denotes sample means that differ statistically from one another, p < 0.01.
Significantly different from the control mean (0 μg/mL alamethicin/0% methanol), p < 0.01.
Mean kdep values for all three compounds after 0.5, 1, 2, and 3 hours of holding time were divided by the initial (0 hours) reaction rate to express activity as a % of initial (Fig. 1B). The results show that in vitro activity declined markedly with holding time. For BAP, this decrease was nearly linear with holding time and resulted in 15%–20% loss of starting activity per hour. The observed decrease in activity was even greater for PHEN and PYR, but was somewhat nonlinear with holding time. In either case, >60% of initial activity was lost after 3 hours of holding time. However, the rate of decrease in activity was greatest during the first hour of sample holding, declining thereafter.
The effect of acetone on depletion of PHEN is shown in Figure 2. Mean kdep values differed significantly among the treatment groups (one-way analysis of variance [ANOVA], p < 0.05). Using the Newman–Keuls multiple range test, reaction rates measured using 0.25% and 0.5% acetone were shown to be statistically indistinguishable, while those generated using higher concentrations of acetone were significantly lower (Table 2).
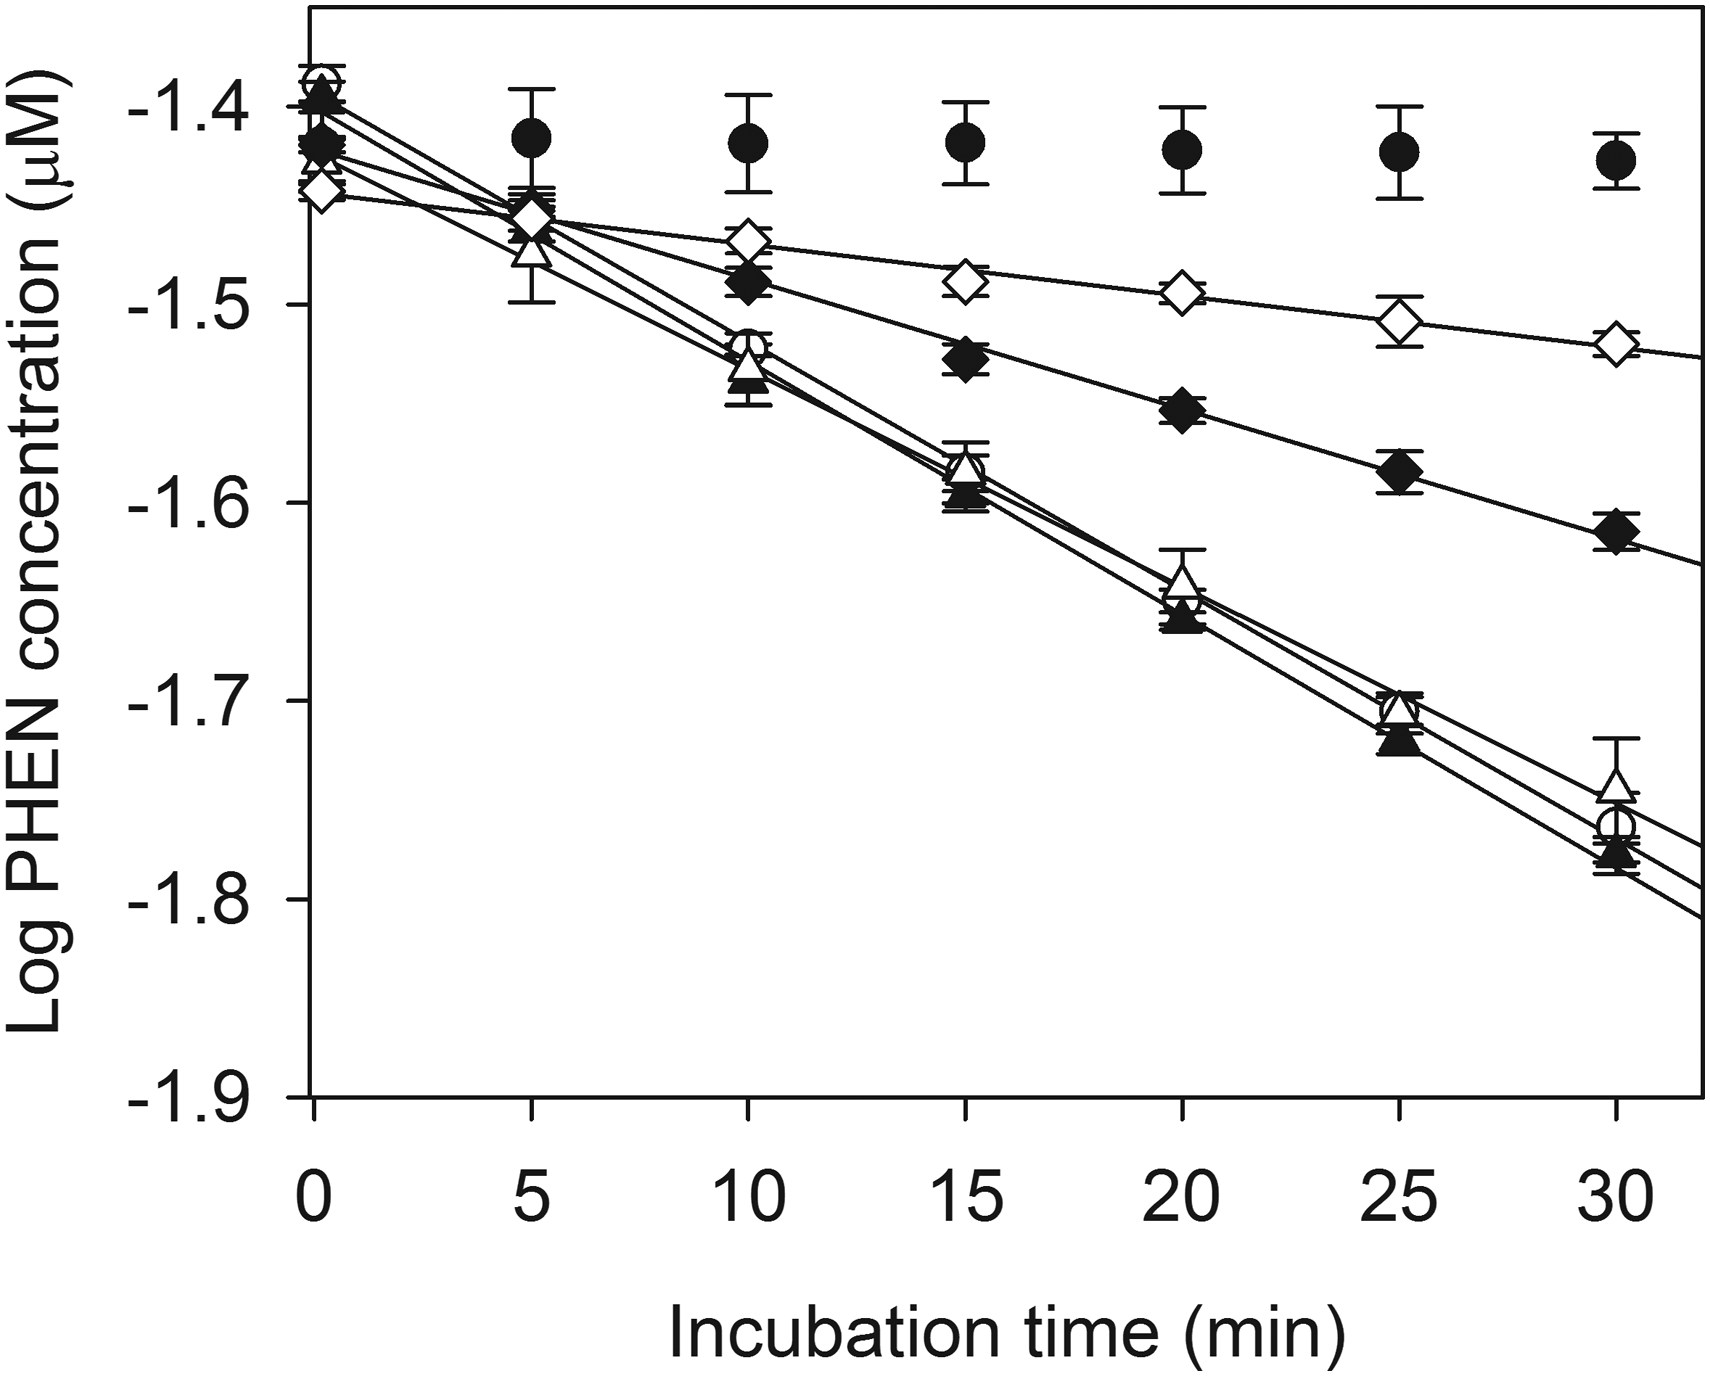
Effect of acetone, used as a spiking solvent, on biotransformation of PHEN by trout liver S9 fractions. Each point represents the mean ± SD of data from triplicate depletion assays. Open circles—0.25% acetone; solid triangles—0.5% acetone; open triangles—1.0% acetone; solid diamonds—2.0% acetone; open diamonds—5.0% acetone; solid dots—inactivated controls.
Alamethicin had a concentration-dependent effect on PHEN metabolism (Fig. 3). The highest average rate of activity was obtained at 0 μg/mL alamethicin and 0% methanol and was considered to be a control value. Significant reductions in activity were determined for assays performed using 10, 25, or 50 mg/mL alamethicin (one-way ANOVA, followed by Dunnett's test, p < 0.05; Table 2). Addition of 0.25% methanol alone also had a significant negative impact on measured activity.
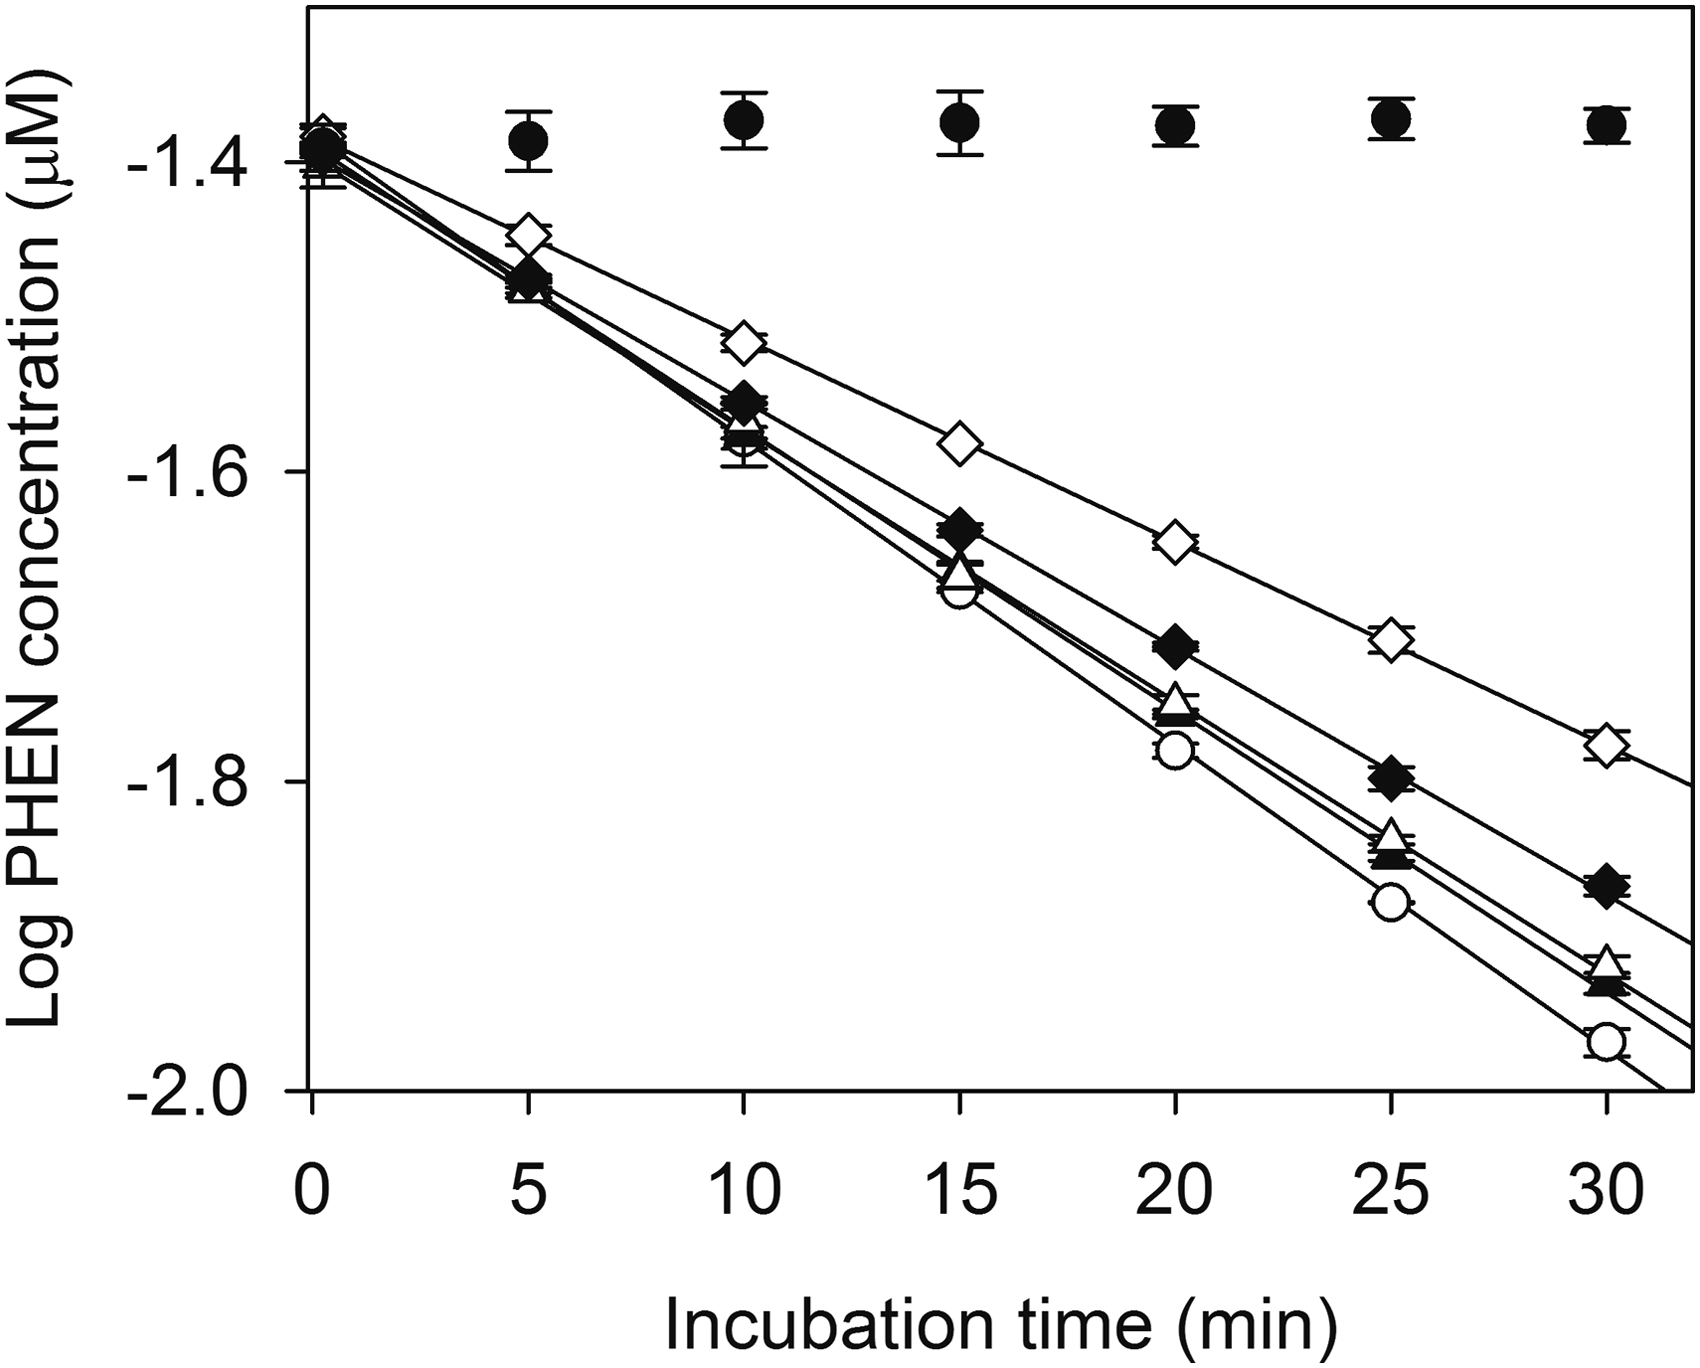
Effect of alamethicin and methanol on biotransformation of PHEN by trout liver S9 fractions. Each point represents the mean ± SD of data from triplicate depletion assays. Open circles—0 μg/mL alamethicin/0% methanol; solid triangles—0 μg/mL alamethicin/0.25% methanol; open triangles—10 μg/mL alamethicin/0.25% methanol; solid diamonds—25 μg/mL alamethicin/0.25% methanol; open diamonds—50 μg/mL alamethicin/0.25% methanol; solid dots—inactivated controls.
Effect of substrate concentration on the shape of substrate depletion curves
Initial rates of depletion for PHEN, PYR, and BAP depended strongly on starting substrate concentration (Fig. 4). For PYR and BAP, the kinetics of depletion appeared to be log-linear at both high and low starting concentrations, while depletion curves generated for intermediate concentrations tended to curve downward, indicating an increase in enzyme turnover. Log-linear depletion curves were observed for PHEN at all tested substrate concentrations.
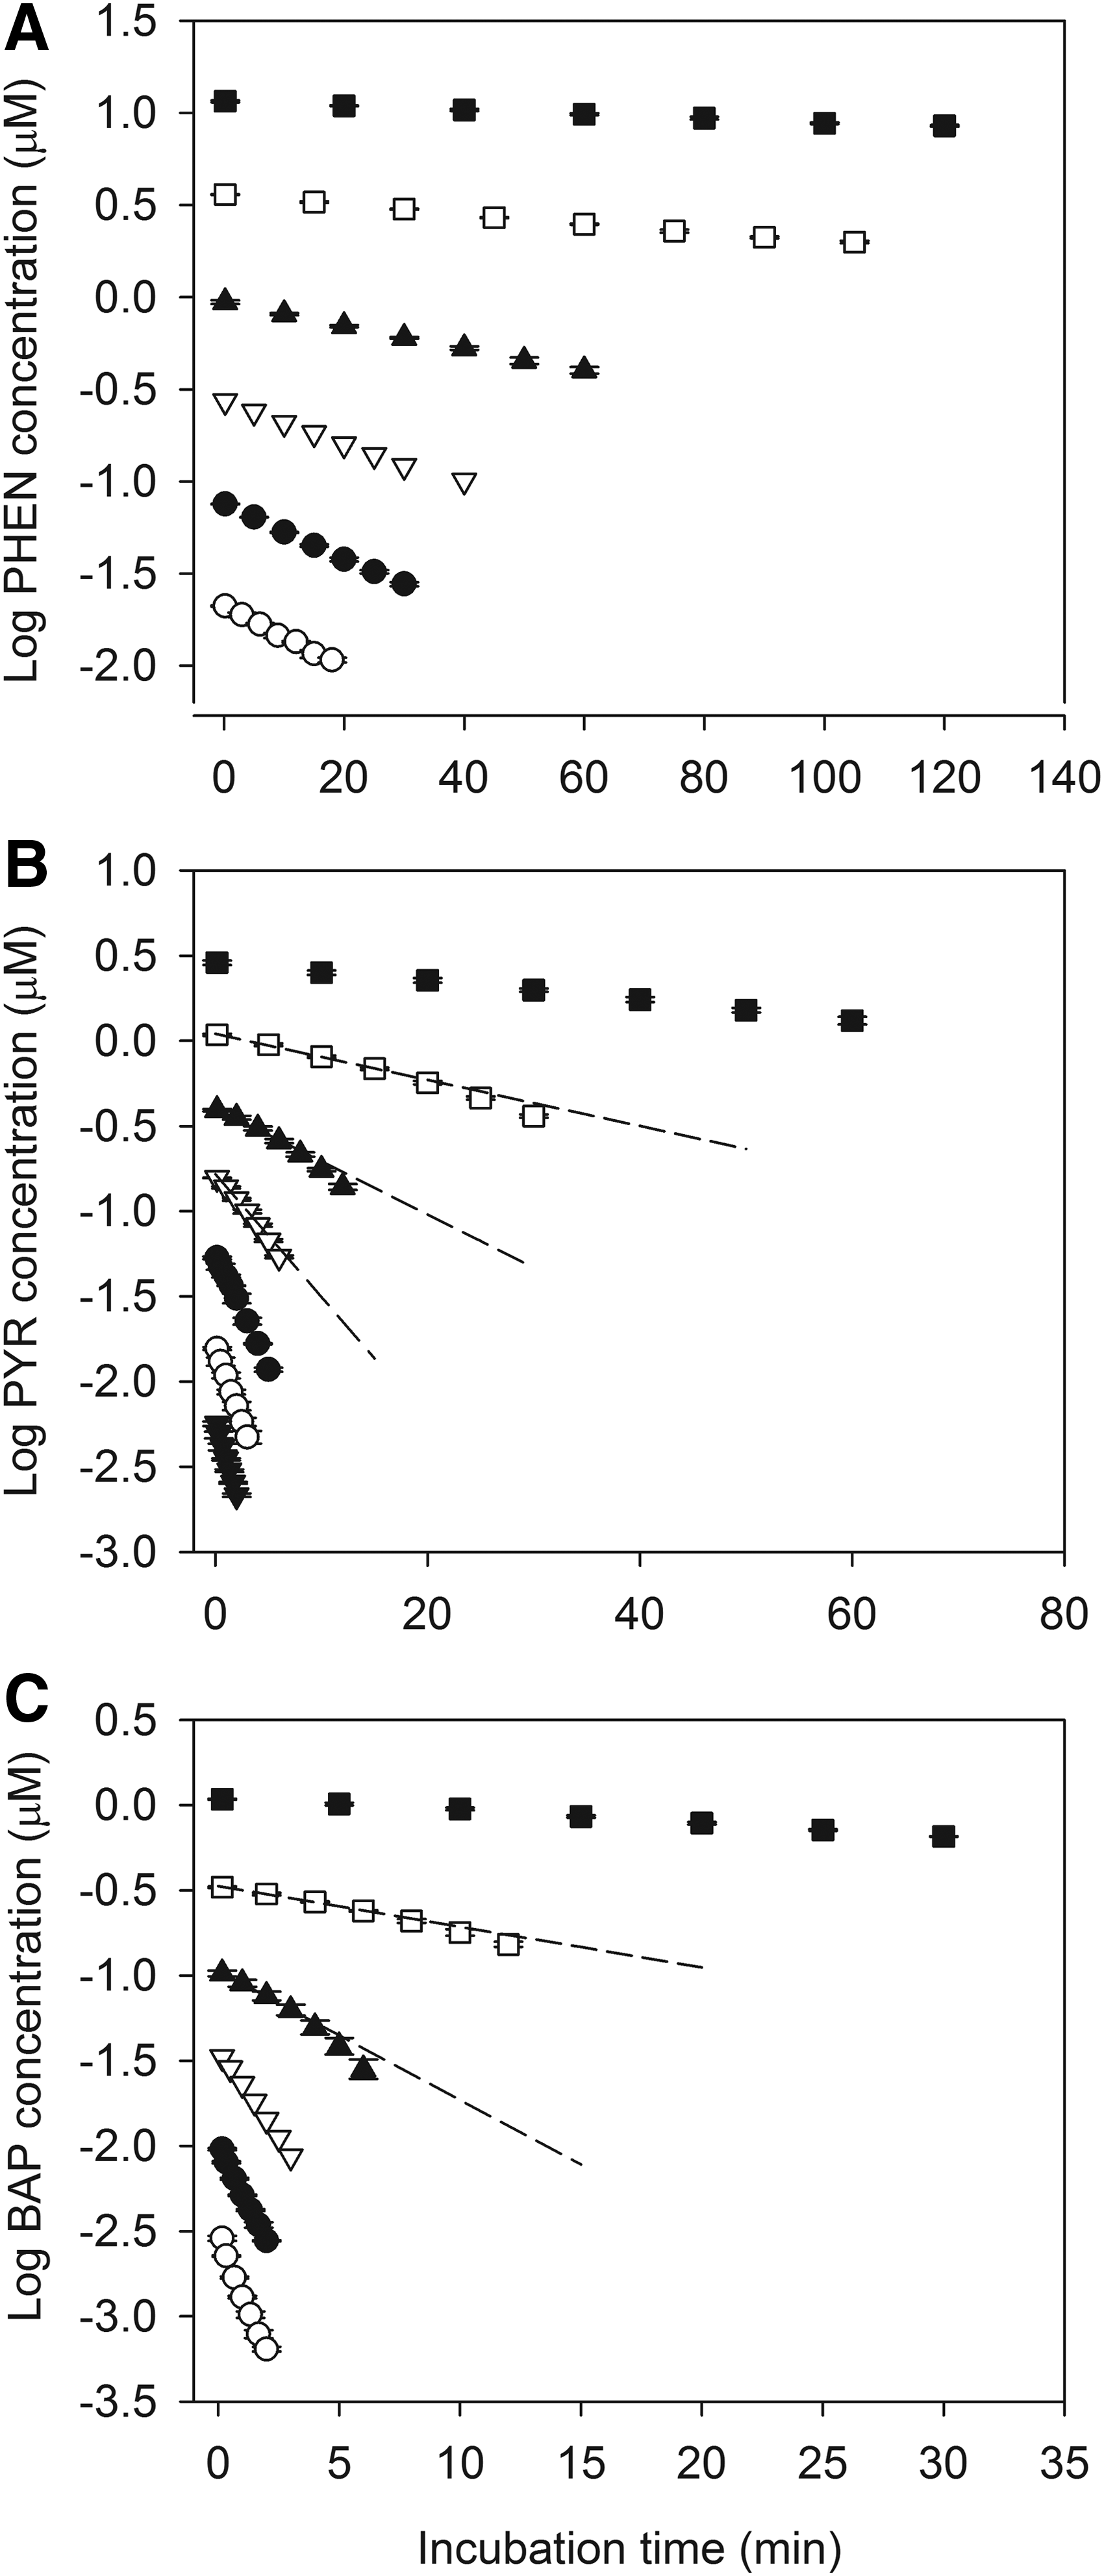
Effect of starting substrate concentration on biotransformation of PHEN
Determination of KM, Vmax, and CL in vitro ,int
Fitted kdep values for PHEN, PYR, and BAP exhibited the sigmoid relationship with [S] predicted by Equation (1) (Fig. 5). The kinetic parameters KM, Vmax, and CLin vitro,int, determined by fitting Equation (1) to these datasets, are given in Table 3. Estimated KM values for the three test compounds varied by a factor of 17 and tended to decrease with increasing chemical log Kow. In contrast, estimated Vmax values were quite similar, varying by less than a factor of 2. Measured CLin vitro,int values varied by a factor of 22 and tended to increase with chemical log Kow.
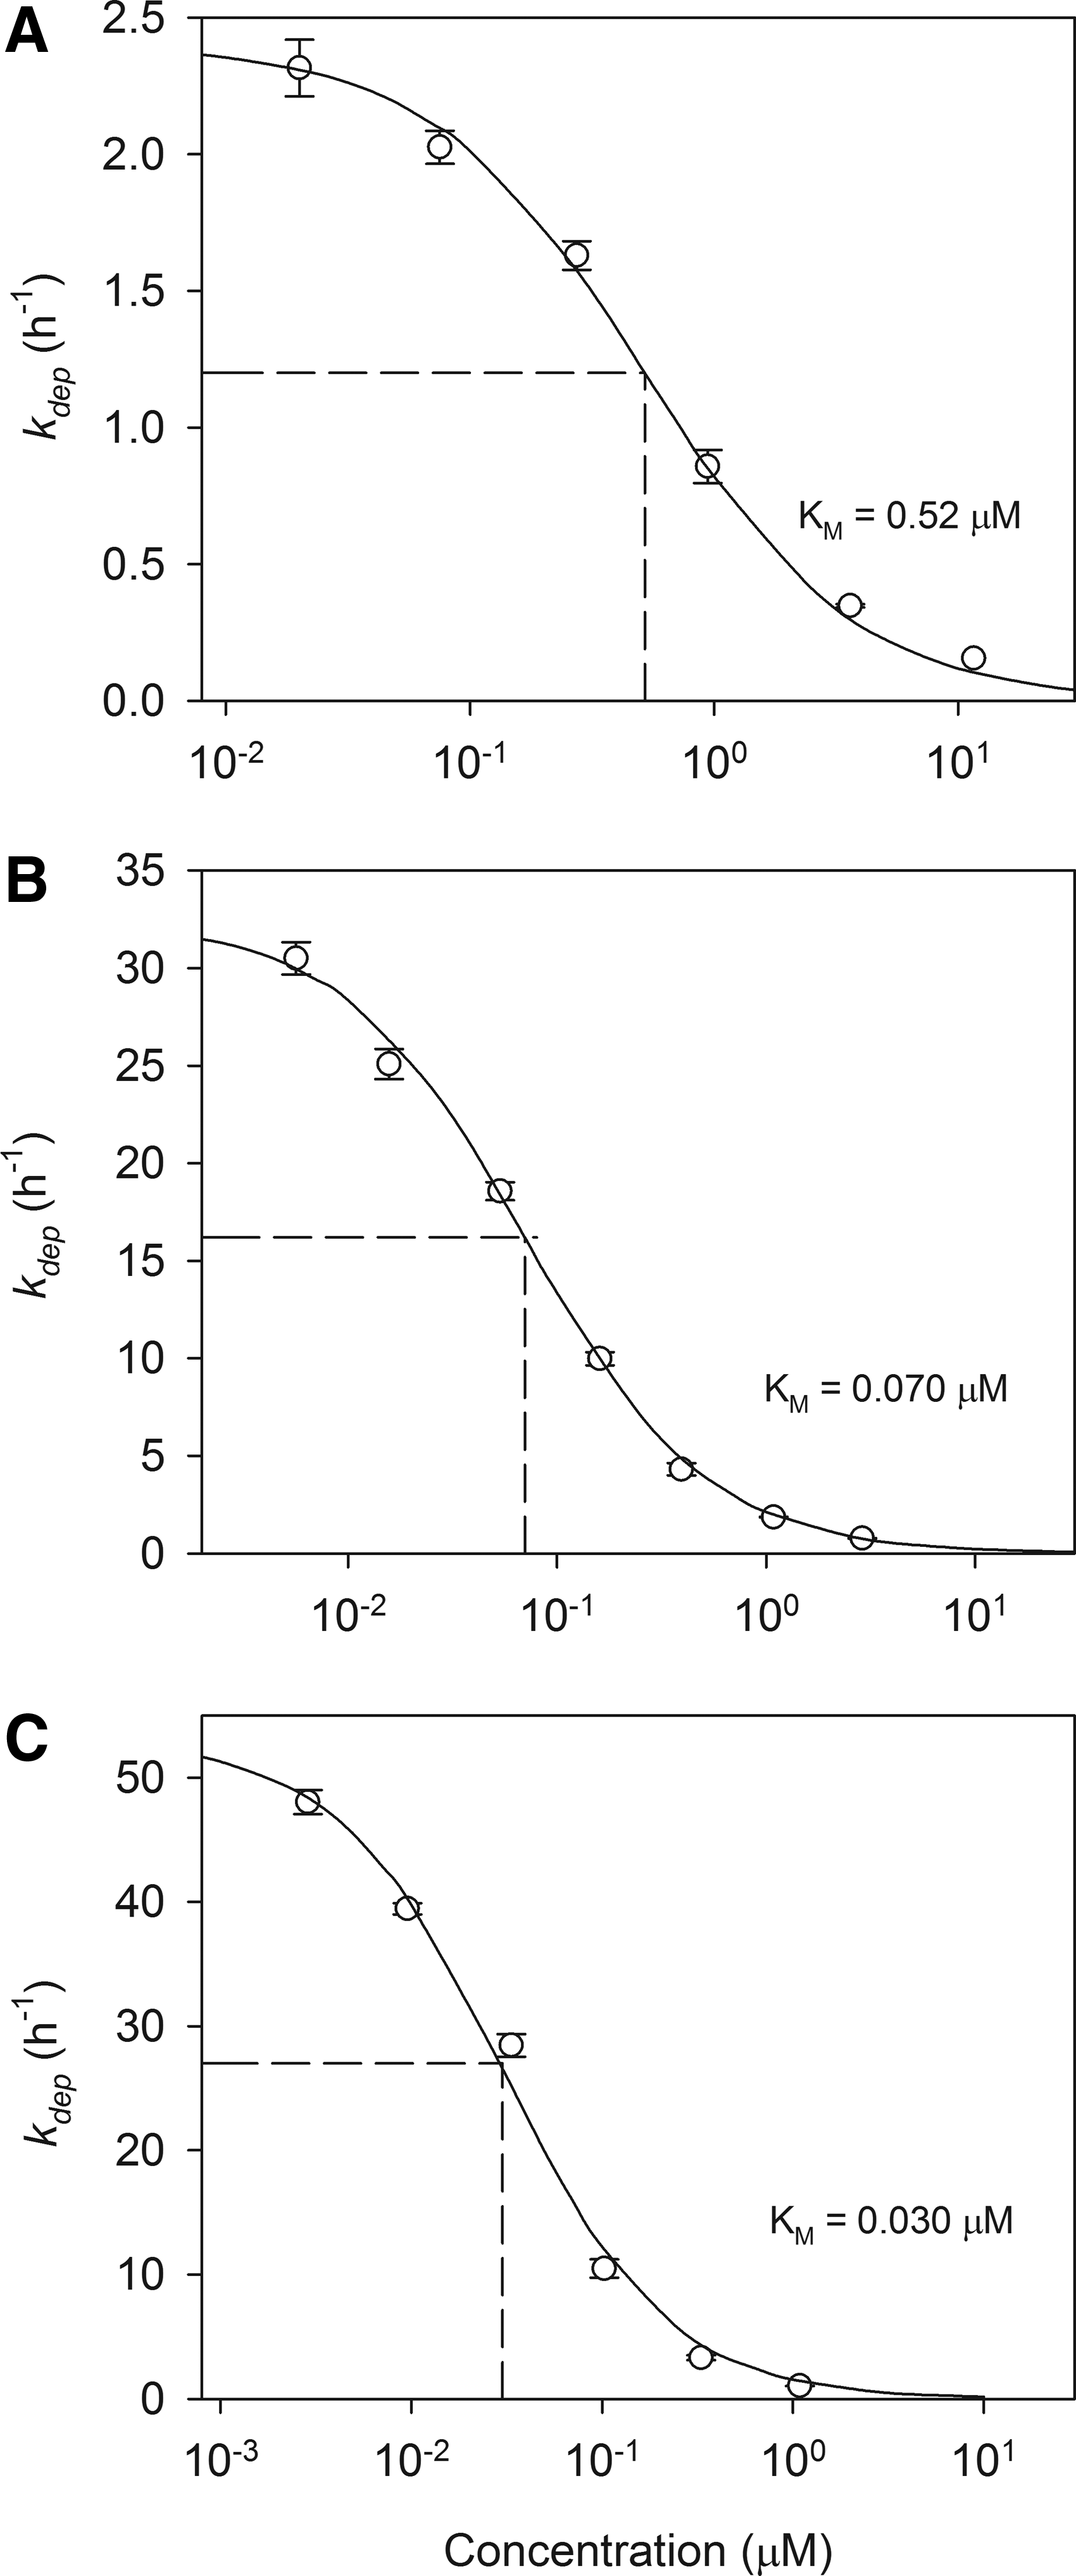
Determination of Michaelis–Menten affinity constants (KM) for biotransformation of PHEN
Kinetic Parameters for In Vitro Biotransformation of Phenanthrene, Pyrene, and Benzo[a]pyrene by Trout Liver S9 Fractions
Based on MLogP estimates (with preference given to measured values) in Bio-Loom for Windows. 57
CLin vitro,int, in vitro intrinsic clearance.
In vitro binding of PHEN, PYR, and BAP
Chemical binding in the S9 system was highly dependent on protein concentration (Fig. 6A–C). When the data were plotted as the bound/free ratio (1 − fu/fu) versus S9 protein, a linear binding relationship was obtained for each compound suggesting that binding was nonspecific and nonsaturable. The measured unbound fractions at the highest tested protein concentration (2 mg/mL) were 2.6 ± 0.04%, 0.4 ± 0.004%, and 0.012 ± 0.0004% for PHEN, PYR, and BAP, respectively.
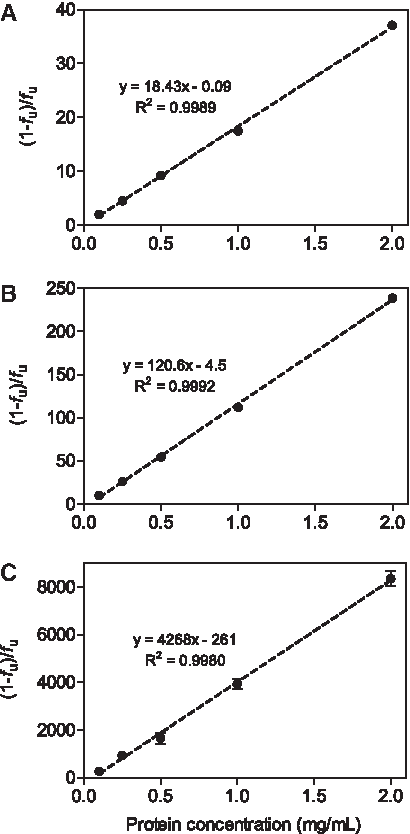
Binding of PHEN
Effect of S9 protein concentration on in vitro clearance
The effects of S9 protein concentration on PAH metabolism are shown in Figure 7A–L. Depletion rates (kdep) measured for each compound increased with increasing protein concentration and then tended to level off. For any given compound, fitted kdep values at the three highest protein concentrations (0.5, 1.0, and 2.0 mg/mL) were essentially the same (Fig. 7A–C). Each kdep value was divided by the corresponding S9 protein concentration to calculate an in vitro clearance rate (CL in vitro ; mL/min · mg protein) normalized for protein content (Fig. 7D–F). These CL in vitro values were then divided by the fu value corresponding to each experiment to calculate a set of unbound in vitro clearance rates (CLin vitro,u; mL/min · mg protein; Fig. 7G–I).
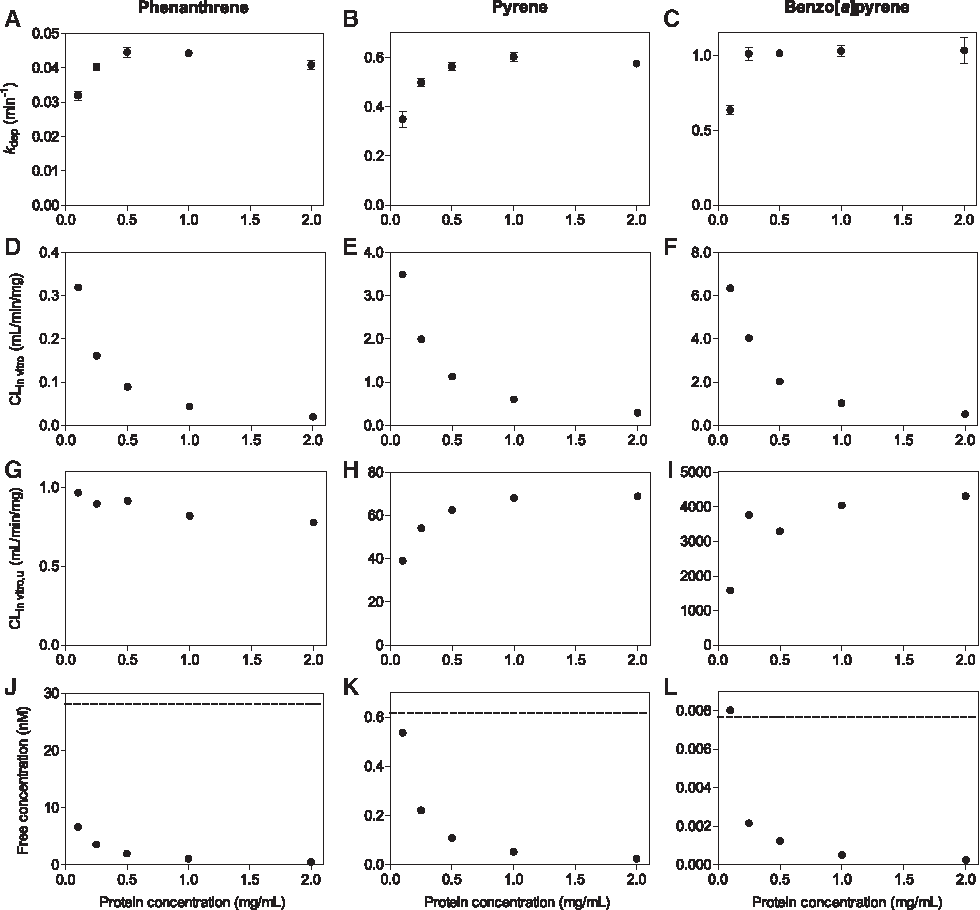
Effect of trout liver S9 protein concentration on biotransformation of PHEN, PYR, and BAP. Data from substrate depletion studies are expressed in terms of fitted depletion rate constants
Finally, to provide a basis for interpreting these CLin vitro,u values, the unbound chemical concentration (Cu) at the start of each assay was calculated by multiplying the starting total concentration by the fu value corresponding to the tested protein concentration (Fig. 7J–L). The dashed line in each of these panels is equal to the fu value for this compound at 1.0 mg/mL protein multiplied by the affinity constant (KM) determined in earlier concentration dependence studies (Fig. 4). This product term may be viewed as the Cu associated with half-maximal activity for each of the studied reactions.
Observed declines in CL in vitro with increasing S9 protein concentration were due largely to corresponding decreases in fu and by extension Cu. By expressing activity in terms of the unbound clearance, it was possible to correct for these changes. Calculated CLin vitro,u values for PHEN declined slightly with increasing S9 protein, but varied only 20% overall. In contrast, there were clear reductions in CLin vitro,u values for PYR and BAP at the lowest tested protein concentrations. An examination of Figure 7J–L suggests that these reduced levels of turnover can be explained by the fact that Cu values at these lower protein levels were approaching the Cu associated with half-maximal enzyme activity (dashed lines). Free concentrations of PHEN at all tested protein concentrations were well below this level.
Discussion
Hydrophobic environmental contaminants tend to partition out of water and into the tissues of fish and other aquatic organisms. Absent biotransformation, this behavior results in chemical accumulation that may exceed thresholds established by various regulatory authorities, triggering restrictions on chemical production and use. 36 Standardized in vivo testing procedures are available to directly assess chemical accumulation in fish 37 ; however, these methods are expensive, time-consuming, and utilize a substantial number of organisms. The majority of bioaccumulation assessments are therefore performed using predictive mass-balance models.38,39 Most of the inputs to these models can be predicted reasonably well from a compound's relative hydrophobicity, typically represented by its log Kow value. Unfortunately, biotransformation prediction does not lend itself to this simple approach. It is of interest, therefore, to develop in vitro and in silico methods to estimate whole-body rates of chemical biotransformation as a means of refining modeled bioaccumulation predictions.
Because metabolism rates in fish tend to be lower than those of mammals, we began this study by assessing the working lifetime of the trout S9 preparation. This was done by storing samples for fixed periods of time before starting incubation. These experiments showed that depletion rates were strongly influenced by holding time and suggest that data collected in depletion experiments lasting longer than 30 minutes may be impacted by a progressive loss of enzyme activity. The cause of this decline is not known. Although cofactor depletion is possible, this would not explain why similar changes in activity were observed for chemicals metabolized at very different rates (e.g., PHEN and BAP). Given the crude nature of the S9 preparation, a more likely explanation is autolytic degradation of metabolizing enzymes. In the present study, EDTA was added to the homogenization buffer to inhibit calcium-dependent proteases and phospholipases. Several authors have added phenylmethylsulfonyl fluoride, a serine protease inhibitor, when isolating liver subcellular fractions from fish.40,41 To our knowledge, however, its effectiveness (when used for this application) has not been evaluated. Presently, these findings underscore the need to characterize biotransformation based on initial rates of activity and suggest that the S9 assay is best suited for chemicals that undergo relatively rapid metabolism.
Previous in vitro studies with mammals have shown that spiking solvents used to introduce test compounds can reduce measured levels of CYP activity.42,43 These effects are difficult to generalize, however, because different CYPs are impacted to varying degrees by different solvents. In the present study, acetone had less impact on PAH metabolism than ACN; however, acetone levels >0.5% had a clear effect on activity. Passive dosing methods have been developed to introduce hydrophobic test chemicals to in vitro biotransformation assays without the use of organic solvents.44,45 When these methods were used to investigate PAH metabolism in trout S9 fractions, derived intrinsic clearance rates were close to those obtained by conventional solvent dosing. 46 Implementation of these passive dosing methods may be complicated, however, by rate limitations imposed by chemical desorption from the partitioning phase, particularly when metabolism rates are rapid, 44 and requires a validated mathematical model of the dosing system itself.
Researchers who study microsomal UGTs in mammals routinely incorporate a membrane-disrupting agent to remove latency (reduced activity) associated with restricted diffusion of UDPGA across the endoplasmic reticulum. 47 Alamethicin is preferred for this application, in part, because it is thought to have no impact on microsomal CYP activity.31,32,48 In the present study, we evaluated the effect of alamethicin on metabolism of PHEN, which is a likely substrate for trout CYP1A (see below). Alamethicin had a concentration-dependent effect on PHEN depletion, which was evident at alamethicin concentrations commonly employed in research with mammalian microsomal fractions. We retained alamethicin as a component of the assay to preserve its utility for a broad range of substrates, but reduced the amount to 10 μg/mg S9 protein, as this had only a small impact on PHEN metabolism and is still five times greater than the concentration needed to yield maximal UGT activity. 26
Theory indicates that a biotransformation reaction exhibiting Michaelis–Menten kinetics will yield a log-linear depletion curve when the starting substrate concentration is substantially less than KM. When the starting concentration approaches or exceeds KM, the depletion curve will deviate from linearity if, during the course of the reaction, a decrease in substrate concentration results in a progressive increase in reaction rate. Under such circumstances, a plot of log-transformed depletion data is expected to curve downward.
Depletion curves for PYR and BAP were highly linear at low starting substrate concentrations, but trended downward at several of the higher tested substrate concentrations (Fig. 4). In contrast, log-linear depletion curves were observed for all tested concentrations of PHEN, several of which approached or exceeded the KM for the reaction (see below). Because PHEN is metabolized at a slower rate than PYR or BAP, these experiments were run for longer periods of time (up to 2 hours). During these longer studies, it is likely that the activity of the system was declining. For a reaction that is run under first-order conditions (i.e., [S] << KM), this loss of activity might be expected to result in a log-transformed dataset that is linear to start, but flattens out at later time points. At higher substrate concentrations, however, this loss of activity would be counteracted by the increase in depletion rate that occurs as a consequence of declining substrate concentration. Under these circumstances, it would be possible to obtain a linear depletion curve when the starting concentration is well above that which should, in theory, yield this result. These considerations are important because they suggest that the appearance of a log-linear depletion curve does not, by itself, provide clear evidence that a reaction is being performed at a substrate concentration below KM.
When plotted against [S], kdep values for PHEN, PYR, and BAP described a set of sigmoidal relationships. By fitting Equation (1) to these datasets, we obtained the Michaelis–Menten parameters, KM and Vmax, for each reaction as well as an estimate of CLin vitro,int (i.e., the intrinsic clearance when kdep([S] → 0)). An examination of these derived kinetic parameters indicates that Vmax values for all three compounds agreed within a factor of 2. The primary pathway for biotransformation of PAHs by fish involves hydroxylation of one or more aromatic rings, followed by sulfation and glucuronidation. 49 These hydroxylation reactions are thought to be catalyzed by CYP1A, although other CYPs (e.g., CYP3A) may contribute. 50 The observed agreement among Vmax values for the three test compounds is consistent with the suggestion that all are metabolized by the same reaction pathway.
In contrast to fitted Vmax values, KM values determined for the three compounds differed by a factor of 17 and varied inversely with chemical log Kow. Previously, Nichols et al. 28 found that in vitro clearance rates for six PAHs in trout S9 fractions correlated positively with chemical log Kow. Additional studies cited by these authors indicate that this pattern is generalizable to PAH metabolism by fish. The data collected by Nichols et al. 28 were insufficient to determine whether log Kow-dependent differences in clearance were due to differences in Vmax, KM, or both. Based on the present work, it appears that these differences are due largely to differences in KM and not Vmax. As such, the results suggest that chemical hydrophobicity is an important determinant of PAH binding to the enzyme(s) responsible for their metabolism in trout. The importance of hydrophobicity as a determinant of chemical binding to mammalian CYPs has been noted by several authors, particularly for CYPs that have evolved to metabolize hydrophobic substrates (e.g., CYP3A4). 51
An important consideration when extrapolating in vitro biotransformation data to the intact tissue is the extent of chemical binding in vitro and in vivo. Under first-order conditions (i.e., when [S] << KM), the rate of metabolism is generally assumed to be proportional to the unbound chemical concentration. While some have questioned whether this free chemical hypothesis adequately represents the dynamic environment that exists in liver tissue, this assumption is central to current in vitro–in vivo extrapolation methodologies.
To investigate binding effects on in vitro metabolism, we measured PAH binding across a range of S9 protein concentrations. When the data were plotted as the bound/free ratio versus protein concentration, we obtained a set of linear binding relationships (Fig. 6). The proportional nature of this binding can be shown by dividing the bound/free ratio for each compound by the S9 protein concentration, which results in a set of characteristic binding relationships. For PHEN, PYR, and BAP, these normalized binding ratios (mean ± SD, n = 5) are 18.65 ± 1.01, 109.4 ± 6.9, and 3556.7 ± 604.3, respectively. Furthermore, when these normalized binding ratios are log-transformed and regressed against chemical log Kow, a linear equation is obtained, which relates S9 binding to chemical hydrophobicity: log (1 − fu/fu) = 1.33 log Kow − 4.6 (r
2
= 0.99). From this relationship, we can derive a general equation, which predicts S9 binding as a function of chemical log Kow and S9 protein concentration (CS9; mg/mL):
Substrate depletion data collected across a range of S9 protein concentrations clearly illustrate the importance of in vitro chemical binding. At higher protein concentrations, CLin vitro,u values for each compound were essentially unchanged, indicating that the rate of biotransformation was controlled by the unbound chemical concentration. Similar observations have been made previously for metabolism of highly bound drugs by rat microsomal fractions. 52 Lower rates of CLin vitro,u were obtained for PYR and BAP at low S9 protein concentrations. However, these observations may be explained by the fact that unbound chemical concentrations were approaching those associated with saturation of enzyme activity (dashed lines in Fig. 7J–L).
For a hydrophilic substrate dissolved in the aqueous phase of an in vitro metabolizing system, an increase in protein concentration (S9 or microsomal assay) or cell number (hepatocyte assay) would be expected to result in a proportional increase in kdep and little or no change in CL in vitro and Cin vitro,u. This would increase the sensitivity of the assay, defined as its ability to detect biotransformation (i.e., a depletion rate significantly different from that of negative controls) within a fixed period of time. For a hydrophobic compound, increasing the protein concentration or cell number does not increase the assay's sensitivity because the increase in the amount of enzyme present is offset by a decrease in unbound substrate concentration. A decrease in protein concentration or cell number may, however, drive the assay into a range where kdep is impacted by unbound substrate concentrations that approach or exceed KM. For such compounds, we may expect an optimal protein or cell concentration, which results in maximal activity while limiting the required amount of biological material. In the present study, the optimal amount of S9 protein for all three PAHs was 1 mg/mL.
Implications for use of S9 assay data in bioaccumulation assessments for fish
The results of this study have important implications for use of S9 assay data in bioaccumulation assessments for fish. Proponents of this approach have pointed out that liver S9 fractions are easier to prepare and use than microsomes or isolated hepatocytes. 28 This is an important consideration if the goal is to develop methods that can be adapted to a large number of different fish species. On the other hand, the short working lifetime of this preparation may impose a lower limit on the rate of activity that can be accurately quantified. Previously, Nichols et al. 28 estimated this lower limit on kdep to be about 0.05/h based on historical data for several slowly metabolized substances. A somewhat higher limit value (0.14/h) was estimated by Chen et al. 53 based on modeled simulations of hypothetical substrate depletion data. The actual limit will depend on the quality of the dataset (e.g., the precision of replicated measurements at each time point) and the behavior of negative controls, as well as the stability of the preparation.
Substrate depletion experiments conducted with the goal of measuring intrinsic hepatic clearance should be performed under first-order reaction conditions (concentration << KM). With respect to bioaccumulation assessments, such a study would provide a conservative basis for assessing metabolism impacts on chemical accumulation in fish; that is, if the highest measured rate of activity does not reduce the predicted level of accumulation below a threshold level for regulatory action, lower levels of activity could only result in higher predicted values. The present study shows, however, that log-linear depletion curves can be obtained across a wide range of substrate concentrations, including those well above KM. The existence of a well-behaved log-linear curve may be insufficient, therefore, to establish the existence of true first-order conditions. Instead, the results of this study underscore the need to evaluate the concentration dependence of activity, particularly for high log Kow compounds.
Several studies have shown that in vitro metabolism data can be used to refine modeled predictions of chemical accumulation in fish. In general, however, there is a trend toward overestimation of measured accumulation (e.g., steady-state BCFs) even when these in vitro findings are taken into account. Examples include studies performed by Cowan-Ellsberry et al. 6 and Han et al. 10 The results of the present effort suggest that one reason for these discrepancies has been the past use of inappropriately high starting substrate concentrations. The KM value determined here for BAP metabolism was 0.03 μM. For comparison, Han et al. 10 used starting substrate concentrations of 2 or 5 μM (2 μM for BAP), while Cowan-Ellsberry et al. 6 evaluated four compounds at a starting concentration of 10 μM (S9 studies). The likely overestimation of measured BCFs by previous authors due to the use of high starting substrate concentrations was also noted in a recent study by Lo et al. 46
Ultimately, the choice of an appropriate starting concentration for in vitro metabolism studies may be best informed by exposures that fish experience in the wild. Measured concentrations of PHEN, PYR, and BAP in surface water may approach 500 ng/L; however, most reported values are <50 ng/L,54–56 even for relatively contaminated sites. In a prolonged exposure, the unbound chemical concentration in a fish will approach the total concentration in water, assuming that the fish is exposed to the chemical in water only, there is little binding in the water (e.g., to dissolved organic carbon), and the rate of biotransformation is negligible. To relate this unbound concentration to a total concentration employed in an in vitro assay, it is necessary to correct for binding in the assay itself. For example, binding data for PYR suggest that the unbound chemical fraction at 1 mg/mL S9 protein is ∼0.009. Dividing this figure into 0.247 nM PYR (equivalent to an aqueous concentration of 50 ng/L) gives a value of 0.027 μM. Thus, under the assumed circumstances, an environmental exposure to 50 ng/L PYR would equate to a total PYR concentration in the S9 assay of 0.027 μM, which is less than the measured KM for PYR (0.07 μM), although not markedly so.
Additional insight may be gained by considering standardized in vivo laboratory exposures used to measure chemical bioconcentration in fish. In the absence of more specific modes of action, neutral organic compounds will exert a lethal effect due to acute narcosis. 57 This baseline toxicity can be associated with a critical body residue (CBR), which tends to be remarkably constant across a wide range of chemical structures. For PAHs, the average CBR associated with acute narcosis in fish is about 2 mmol/kg wet wt. 57 Absent biotransformation, the BCF may be estimated as the product of a fish's fractional lipid content and a compound's Kow value. For example, the reported log Kow value for PYR is 4.88. 58 Based on this value, the estimated BCF for a fish that contains 5% lipid is 3792 (i.e., 0.05 × 104.88). Dividing this BCF into the CBR for acute narcosis of PAHs, the aqueous concentration of PYR expected to elicit toxicity is 0.53 μM.
Because the goal of an in vivo bioconcentration test is to measure chemical accumulation under conditions that do not result in toxicity, tested aqueous concentrations will be lower than this value. However, given the need to control and characterize these exposures, experiments conducted at concentrations 1/100th the lethal level are not unexpected. In the hypothetical case described here, this would result in a PYR test concentration of 5.3 nM, which is 20 times greater than PAH concentrations associated with high environmental exposures (i.e., 5.3 nM/0.247 nM).
These comparisons do not account for the impact of metabolism on PYR accumulation by fish. This activity will reduce PYR concentrations throughout the animal and may have a profound impact within the liver tissue itself. As such, it will tend to drive the system toward a condition that is less likely to saturate. Similar calculations for BAP and other higher log Kow compounds are complicated by the greater likelihood of chemical uptake from dietary sources as well as binding in the exposure water. Nevertheless, these comparisons suggest that enzymes responsible for PAH metabolism in fish may approach saturation at some highly contaminated sites and are even more likely to saturate in standardized in vivo BCF testing efforts. This second outcome is of special interest because it suggests the possibility that in vivo test results could exhibit concentration dependence and/or reflect a greater degree of accumulation than actually occurs in a natural setting.
Research is needed to determine whether the present study findings can be generalized to other chemical classes and reaction pathways. A need also exists for computational models that can be used to relate in vitro clearance observations to measured or predicted in vivo exposures. Because they describe the chemical concentration–time course in specific tissues, physiologically toxicokinetic models for fish may be well suited for this purpose. To date, however, most of the research conducted to support the development of such models has been performed using poorly metabolized compounds.59–61 Additional studies involving in vivo exposures to compounds that undergo substantial metabolism are required. Ideally, such efforts would be accompanied by tissue-specific analysis of chemical residues as well as in vitro measurement of biotransformation using biological material collected from the same group of animals.
Footnotes
Acknowledgment
The authors gratefully acknowledge Philipp Mayer and Dorothea Gilbert for instruction on use of the vial equilibration method to measure free and bound chemical concentrations, and for supplying vials used to make the S9 binding measurements.
Author Disclosure Statement
No competing financial interests exist.