




Abstract
Abstract
The U.S. Food and Drug Administration has regulatory authority over tobacco products, including conventional cigarettes and next generation products (NGPs) such as e-cigarettes and tobacco heating products (THPs). There is a desire by the industry, regulator and animal, protection organizations to incorporate non-animal test methods for tobacco product and NGP assessment. When assessing respiratory effects in vitro, reliable exposure systems that deliver aerosols to cellular/tissue cultures (such as human reconstructed airways or lung slices) at the air–liquid interface are needed. Using nicotine dosimetry, we report the characterization of a Vitrocell VC1 in our laboratories (IIVS, USA). Nicotine, generated from a 3R4F reference cigarette or NGP (e-cigarette and THP) aerosols at source and the exposure interface (culture media), was assessed using ultra-high-performance liquid chromatography–tandem mass spectrometry. These data were compared to published dosimetry data for the same products, generated at a different laboratory (BAT R&D, Southampton, UK), on different exposure systems (VC10 and Borgwaldt RM20S) to confirm repeatability. The nicotine content of 3R4F and NGP aerosols at VC1 source generation was established. Results demonstrated no statistical difference between laboratories (IIVS and BAT; p = 0.903) when comparing puff-by-puff nicotine concentrations from the three products. Culture media nicotine assessment demonstrated no significant difference between replicate wells in the exposure module (p = 0.855), indicating uniform delivery. This study demonstrates successful Vitrocell VC1 aerosol generation and delivery across multiple nicotine product categories, as characterized using nicotine as a dosimetry marker. The data suggest the VC1 established in our laboratory can reproducibly generate and deliver tobacco product and NGP aerosols for future in vitro assessment and matches the performance of reported exposure systems.
Introduction
T
A variety of instruments have been developed to generate aerosols from cigarettes and NGPs for in vitro inhalation toxicology.8,9 Using exposure systems following standardized puffing regimes (e.g., Health Canada Intense [HCI]), 10 CORESTA Recommended Method #81 (CRM81), 11 aerosols can be applied to in vitro or ex vivo cellular and tissue systems that model the respiratory tract, such as reconstructed human airways (RHuA), which are grown at the air–liquid interface (ALI). The Vitrocell VC1 (VC1) Smoking Robot is an example of an exposure system. The VC1 exposure chamber accommodates multiple positions for biological tissues of different diameters, provided they are retained within a compatible culture insert such as those used for RHuA growth or that precision-cut lung slices can be grown or placed in. A more thorough description of the exposure chamber and compatible culture inserts has previously been described. 8 The VC1 works by generating aerosols and delivering a subsample of the aerosol to an exposure chamber where the biological material (cells or tissues) to be exposed is housed. Both the sample volume (puff volume/regime) and exposure concentration (dilution and sample flow rates) can be predetermined before the exposure begins (Fig. 1).
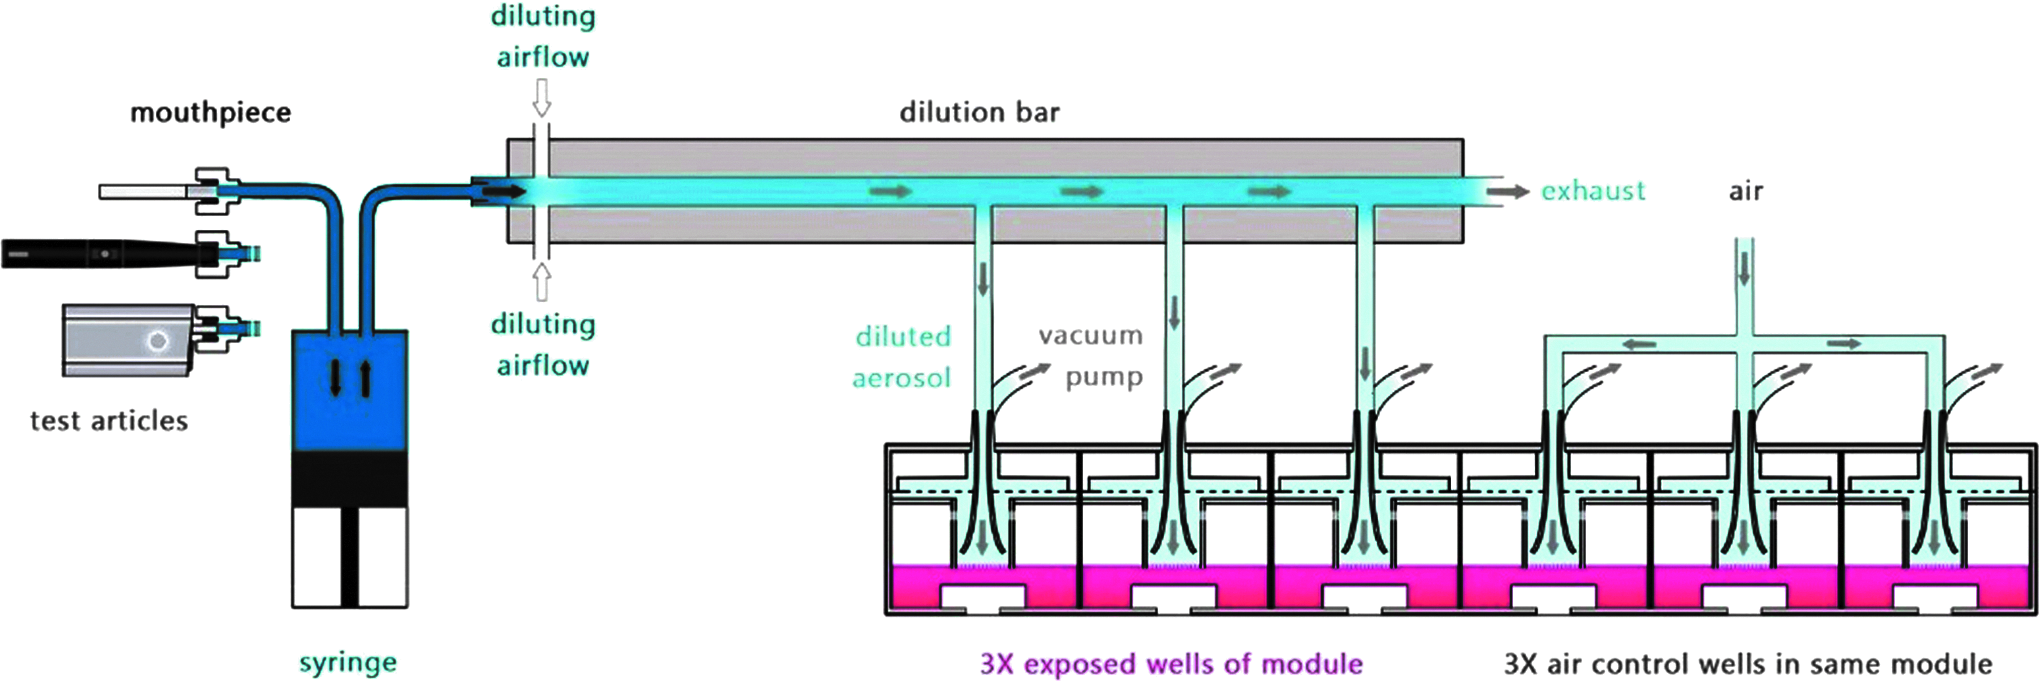
A schematic cross-section of the Vitrocell VC1 exposure system and 12/6 exposure module. Products tested included the following: 3R4F reference cigarette at ISO and HCI regimes (attached to the mouthpiece in this image), a commercially available e-cigarette (Vype ePen) at the CRM81 regime (middle), and a commercially available tobacco heating product (glo™) at the HCIm regime (bottom). HCI, Health Canada Intense.
It is essential to characterize the exposure system for each product type and regime used to have confidence in the aerosol delivery systems and to quantify and ensure appropriate delivery of aerosols to cell and tissue systems. However, while numerous studies have analyzed the aerosol constituents generated by tobacco products and NGPs,12–14 the exposure dosimetry at the ALI and the consistency of in vitro puff-to-puff aerosol production have only recently been realised.15–17 Reproducible aerosol generation is crucial to developing standardized dosimetry measurements. In addition, measuring appropriate markers, for example, nicotine, at the cellular/tissue target is essential to understanding subsequent biological responses. A number of dosimetry tools can be used to support the assessment of aerosols generated using in vitro exposure systems and include particle size and number evaluation, analytical chemical quantitation of exposure constituents, and mass deposition either by gravimetric means or analytical quantification.15–19 For example, Neilson et al., 20 as part of an in vitro assessment of e-cigarettes in RhuA using a VC1 Smoking Robot, employed the use of quartz crystal microbalances (QCMs) to measure deposited mass and confirm aerosol delivery to the tissues. In another example, using a VC1 smoking robot, Fields et al., 21 assessed aerosols from reference 3R4F cigarette smoke and e-cigarettes by fluorometric analysis of aerosols collected at generation source and cellular exposure. In a previously reported interlaboratory study in four independent laboratories and six different Vitrocell VC10 (VC10) Smoking Robots, the QCMs enabled the robust assessment and characterization of 3R4F whole aerosol generation. 22
Using in vitro dosimetry techniques, we report the characterization of a newly installed VC1 machine in our laboratories (IIVS, USA). In this study, we have assessed 3R4F reference cigarette and NGP (e-cigarette and THP) aerosols in the VC1 at the generation source and at the exposure interface in the cellular media. Nicotine was quantified using ultra-high-performance liquid chromatography-tandem mass spectrometry (UPLC-MS/MS), as described in Adamson et al. (2016). The use of nicotine as a surrogate marker of aerosol exposure allows for a direct comparison across the different products. These data were then compared to previously published dosimetry data for the same products, generated at a different laboratory (BAT R&D, Southampton, UK) and on different exposure systems to confirm repeatability.16,17
Materials and Methods
The Vitrocell VC1 (Waldkirch, Germany, serial VC 1/051517) was used in this study and data presented from this machine are newly generated (IIVS). These new data were compared to previously published data for the same products at the same experimental regimes but on different in vitro exposure systems from another laboratory (BAT R&D). Cigarette and e-cigarette comparisons were made with data generated on a Vitrocell VC10 (serial VC 10/141209). 17 THP comparisons were made with data generated on the Borgwaldt RM20S (serial number 0508432), 6 which has been shown to generate aerosol nicotine concentrations within the same analytical limits as the VC10, under the same exposure parameters. 17 See Table 1 for the technical specifications and comparisons between the Vitrocell VC1 and the VC10 in this study. All samples generated and collected in the United States were transported (flown under ambient passenger conditions) to the United Kingdom for analysis within 4 days.
Measurements were made by authors or obtained from supplier specifications.
Test articles and puffing regimes
Scientific reference cigarettes (3R4F; University of Kentucky, USA) were tested at two smoking regimes, ISO (35 mL puff over 2 seconds, every 60 seconds with no filter vents blocked) and HCI (55 mL puff over 2 seconds, every 30 seconds with filter vents blocked). A commercially available e-cigarette (Vype ePen; British American Tobacco) using Blended Tobacco flavor e-liquid (18 mg/mL nicotine) was vaped at the high voltage button setting (4.0 V, 2.8 Ω, 5.7 W) at the CRM81 regime (55 mL puff over 3 seconds, every 30 seconds). A commercially available THP (glo™ and Kent Neostiks; British American Tobacco) was tested at a modified HCI (HCIm) regime in which filter vents were not blocked as previously described. 16 See Table 2 for further details.
CRM81, CORESTA Recommended Method #81; HCI, Health Canada Intense; HCIm, modified HCI; N/A, not applicable; THP, tobacco heating product.
Aerosol generation assessment at source
To characterize VC1 performance, repeatability of aerosol generation was assessed by quantifying nicotine at the aerosol source on a puff-by-puff basis, across all products. Forty-four millimeter diameter Cambridge filter pads (CFP; Borgwaldt, Germany) were installed into the CFP holder at the aerosol transit line directly behind the device mouthpiece. The CFP was changed every puff, for 8 puffs [3R4F (ISO) and THP (HCIm)] or 10 puffs [3R4F (HCI) and e-cigarette (CRM81); replicate number n = 3/product]. The method for puff-by-puff nicotine quantification has been previously published,16,17 with the exception of extracting exposed CFPs in 20 mL methanol in plastic centrifuge tubes with screw caps, instead of glass flasks. Extraction tubes were placed on a plate rocker for 20 minutes and thereafter 1 mL of each extract was transferred to glass GC vials and spiked with 10 μL d4-nicotine standard. Solvent was evaporated in a concentrator for ∼2 hours and the samples resuspended in 5% acetonitrile in water. Nicotine was quantified by UPLC-MS/MS as previously described. 17 Raw data were in ng/mL and converted to mg/puff by multiplying by the total extraction volume of solvent per pad (20 mL) and dividing by 1,000,000 to convert ng to mg.
Aerosol delivery to the exposure module
To characterize repeatability of aerosol delivery to the exposure module and uniformity of delivery across replicate exposure wells under different exposure conditions, nicotine was quantified in the exposed culture media from 3R4F reference cigarette and the e-cigarette, using HCI and CRM81 exposure regimens, respectively. Within the exposure modules, 6.5 mL diameter blank culture inserts were installed into the six module wells. Three milliliters of M199 culture media (Quality Biological, USA) was added in the base of the chamber to contact the basal membrane of the culture insert. Aerosols were both diluted at 1.0 L/min and sampled into the first three module wells (1–3) at 5.0 mL/min/well; the latter three module wells (4–6) were exposed to laboratory air at a rate of 2.0 L/min/well (n = 3/exposure; Fig. 1). An additional e-cigarette comparison was made with undiluted aerosol, by blocking the two diluting airflows and the exhaust, pushing the 55 mL undiluted aerosol into the exposure module (n = 3). This was tested to demonstrate the system could deliver aerosol in different forms (diluted and undiluted) and that the dosimetry method could discriminate these differences in exposure. In all cases, following exposures, the module was left for 5 minutes to allow the aerosol to deposit before removing media into plastic sample tubes. One milliliter of the exposed media was transferred to glass GC vials and spiked with 10 μL d4-nicotine standard. Extracts were evaporated in a concentrator for 6 hours, resuspended in 5% acetonitrile in water, and quantified for nicotine by UPLC-MS/MS.
Data analyses
Results were tabulated and analyzed using Microsoft Excel (Supplementary Tables S1 and S2; Supplementary Data are available online at www.liebertpub.com/aivt). Line charts (Figs. 2 and 3) were produced in Microsoft Excel. Boxplots (Figs. 4 and 5) were produced in Minitab 17. Statistical analyses with one-way analysis of variance (ANOVA) general linear model (GML; Figs. 4 and 5) were conducted in Minitab, p < 0.05 was considered significant.
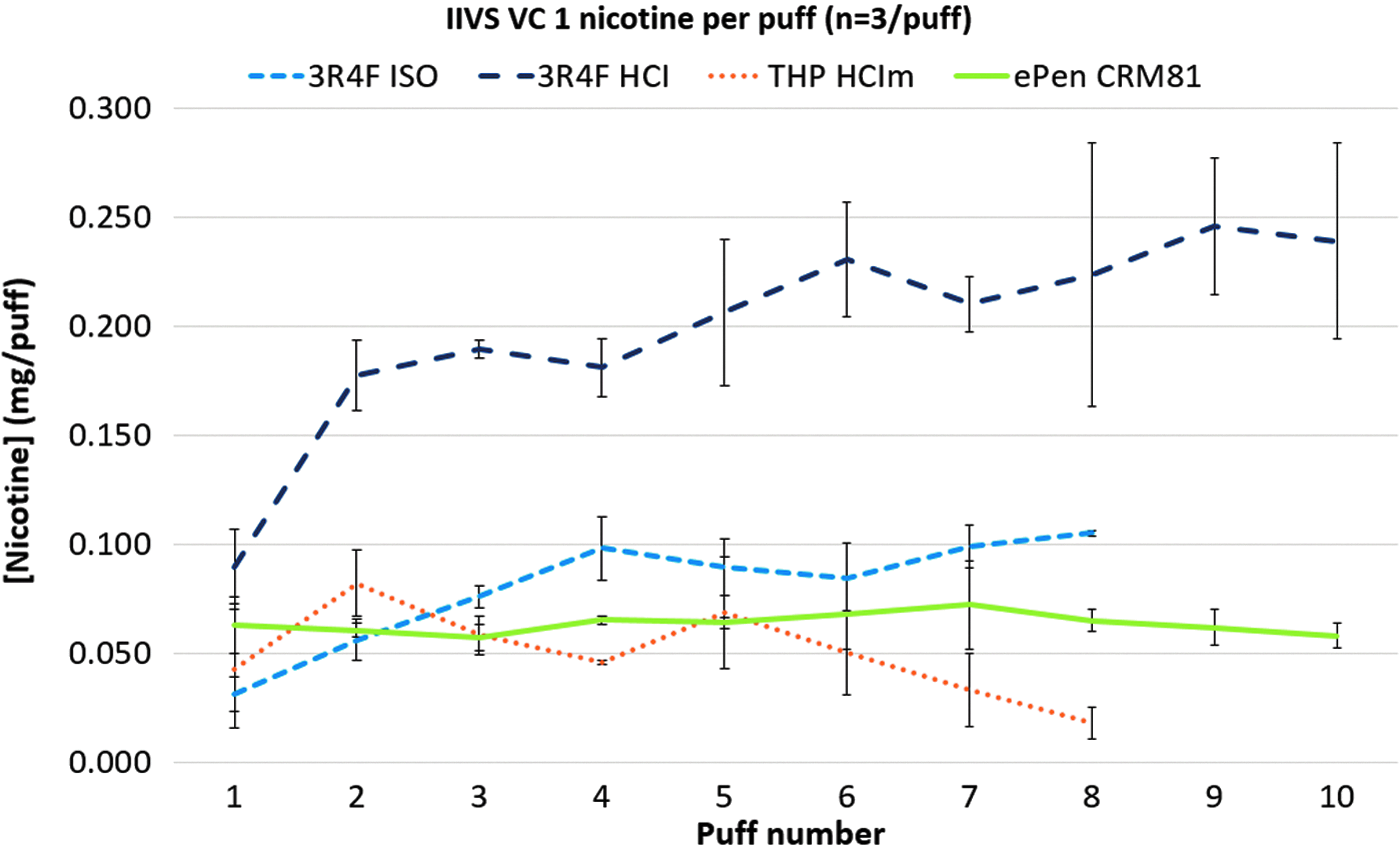
Puff-by-puff nicotine concentration profiles of the four products and specific smoking regimes on the VC1 (n = 3). CRM81, CORESTA Recommended Method #81; HCIm, modified HCI; IIVS, Institute for In Vitro Sciences.


Mean puff nicotine concentration interlaboratory comparisons of the four product/regimes between the U.S. laboratory (IIVS) and UK laboratory (BAT R&D). Boxplots display the mean (central line, and values above boxplots), the 25th and 75th percentiles (bottom and top lines of box, respectively), and the 5th and 95th percentiles (bottom and top whiskers, respectively). Asterisks denote single outliers calculated as data points falling outside 1.5 × 25th–75th percentile range (3R4F ISO and THP n = 24; 3R4F HCI and ePen e-cigarette n = 30). A GML ANOVA demonstrated there was a significant difference between all products (p = 0.000), but there was no statistically significant difference between the laboratories (p = 0.903). ANOVA, analysis of variance; GML, general linear model; THP, tobacco heating product.
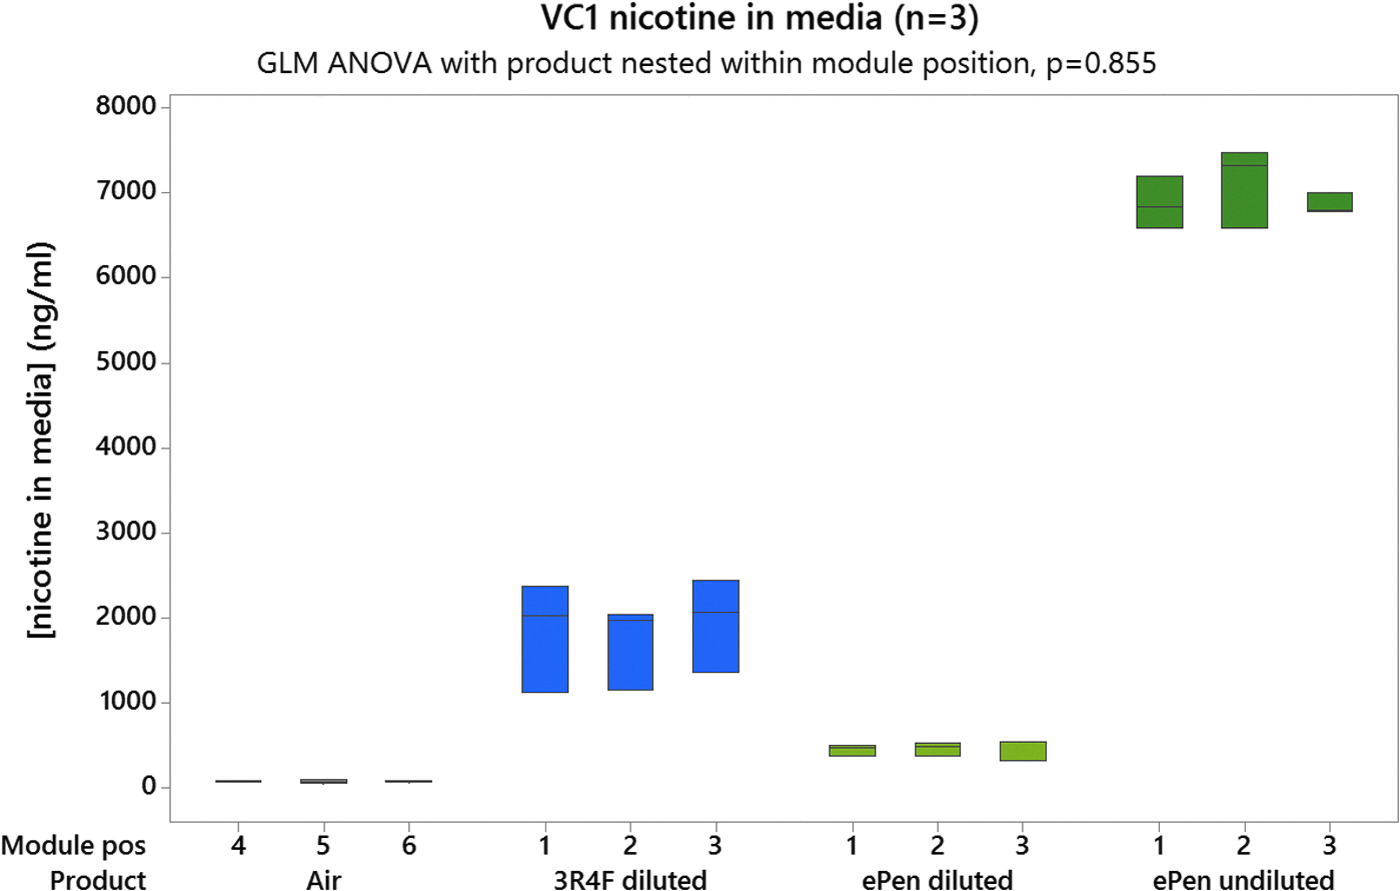
Mean nicotine concentration in exposed culture media across three wells of the Vitrocell 12/6 module under various exposure conditions (n = 3/module position). A GML ANOVA (product nested within module position) demonstrated no significant difference between the three replicate exposure wells in the 12/6 module (p = 0.855).
Results
VC1 aerosol generation assessment at source
Assessment of VC1 aerosol generation was conducted by measuring puff-by-puff in vitro nicotine concentration of 3R4F cigarettes (ISO and HCI regimes), e-cigarette (CRM81 puffing profile), and THP (HCIm regime). Mean 3R4F nicotine delivery at ISO increased through puffs 1–4 and then remained relatively constant for puffs 4–8. The nicotine concentration ranged from 0.031 ± 0.008 to 0.105 ± 0.001 mg/puff (n = 3). Mean 3R4F nicotine delivery at HCI also showed early increases (puffs 1–6) but then remained relative constant for puffs 6–10. The nicotine concentration per puff was higher overall compared to the ISO regime, and ranged from 0.090 ± 0.017 to 0.239 ± 0.045 mg/puff (n = 3; Fig. 2). Mean e-cigarette nicotine delivery was comparatively uniform through puffs 1–10, and ranged from 0.057 ± 0.006 at lowest (puff 3) to 0.072 ± 0.020 mg/puff at highest (puff 7; n = 3). Mean THP nicotine delivery gave a characteristic double peak in nicotine concentration at puffs 2 and 5, consistent with the device's double heating profile. 12 Mean nicotine concentration started at 0.043 ± 0.027 at puff 1 and finished at 0.018 ± 0.007 mg/puff at puff 8 (n = 3).
Comparisons of VC1 aerosol generation to previously published data
Puff-by-puff in vitro nicotine assessment data from VC1 source generation (IIVS) were compared to data previously published from a different laboratory (BAT R&D), using different smoke engines.16,17 Previously published data assessed the same products but used different exposure systems; the VC10 for 3R4F and e-cigarette (Vype ePen) and the Borgwaldt RM20S (RMS20) for the THP (glo). As with the VC1, these exposure systems were assessed at generation source for nicotine concentrations, as described.16,17 When comparing data, it was found that there was good agreement between the mean puff-by-puff nicotine concentrations across the different products tested: VC1 data (IIVS) in solid lines, VC10 and RM20S data (BAT R&D) previously published in dotted lines (Fig. 3).
Mean puff nicotine concentration of all products tested was virtually identical between the VC1 (IIVS) and the previously published data from VC10 and RMS20S (BAT R&D). Mean puff nicotine concentration for 3R4F at ISO was 0.080 ± 0.026 and 0.080 ± 0.010 mg/puff, IIVS and BAT R&D laboratories, respectively (n = 3). Mean puff nicotine concentration for 3R4F at HCI was higher than ISO, at 0.193 ± 0.055 and 0.199 ± 0.026 mg/puff, BAT R&D and IIVS laboratories, respectively (n = 3). Mean puff nicotine concentration for the e-cigarette was 0.069 ± 0.006 (IIVS) and 0.063 ± 0.008 mg/puff (BAT R&D) with the much tighter standard deviations indicative of the repeatable puff profile previously seen (n = 3). Mean puff nicotine concentration for the THP was the lowest of all products, at 0.048 ± 0.027 (BAT R&D) and 0.050 ± 0.015 mg/puff (IIVS; n = 3). A GML ANOVA demonstrated there was a significant difference between product types (p = 0.000); there was no statistically significant difference between the different laboratories (p = 0.903; Fig. 4).
Aerosol delivery
Following aerosol generation by the VC1, nicotine concentration was quantified in exposed culture medium using the 3R4F reference cigarette and the e-cigarette, under various exposure conditions. The delivery assessment served two purposes: to demonstrate that differences in products and dilution can be detected at the exposure interface and that replicate exposure wells (three positions) were truly uniform across the Vitrocell 12/6 module (Fig. 1). Mean nicotine concentration in the “control” air-only exposed media was negligible and across the three module positions was 78, 79 and 82 ng/mL (n = 6/position), with an overall air value of 80 ± 14 ng/mL (n = 18). Mean nicotine concentration in the media exposed to diluted 3R4F (HCI) smoke was 1847, 1720 and 1960 ng/mL across positions (n = 3/position), with an overall media concentration of 1842 ± 503 ng/mL (n = 9). Mean nicotine concentration in the media exposed to diluted e-cigarette aerosol was less than the 3R4F cigarette, at 457, 470 and 475 ng/mL across positions (n = 3/position), with an overall media concentration of 467 ± 83 ng/mL (n = 9). Mean nicotine concentration in the media exposed to undiluted e-cigarette aerosol resulted in the highest values of all scenarios, at 6883, 7133 and 6867 ng/mL across positions (n = 3/position), with an overall media concentration of 5420 ± 318 ng/mL (n = 9). A GML ANOVA (product nested within module position) demonstrated no significant difference between the three replicate exposure wells in the 12/6 module (p = 0.855) for all exposure scenarios assessed (Fig. 5).
Discussion
This study focused on the performance of the VC1 exposure system to generate and deliver repeatable and reliable tobacco product and NGP aerosols for future exposures to in vitro/ex vivo test systems. As with any scientific instrumentation, its performance must generate reliable, credible, and reproducible data. To achieve the acceptance of a reliable test or system, the transferability of methods, protocols, and scientific approaches requires that different laboratories generate consistent data using the same approach. In this study, we describe the assessment of a newly installed VC1 within our laboratories (IIVS), investigating the aerosol generation and dilution using three different products: a reference 3R4F cigarette, an e-cigarette (Vype ePen), and a THP (glo), and compared these data with those published from another laboratory (BAT R&D) using different exposure systems, VC10 and RM20S.
Dosimetry is critical in understanding and characterizing the aerosol delivered to in vitro testing platforms, to confirm delivery and help quantify exposure. While several different dosimetry methods can be used to characterize an aerosol, a chemical constituent as a surrogate marker of dosimetry is a logical candidate. Nicotine was chosen as the marker of exposure primarily because it is a marker common among all the different products tested (thus can align exposure from different products).
The puff-by-puff nicotine content of 3R4F reference tobacco products and NGP aerosols at VC1 source generation (IIVS; U.S. laboratory) were established. Data generated showed differences in nicotine concentrations between the different products and were compared to data previously published (BAT R&D, UK laboratory).16,17 Under every regime and with each product tested, the results correlated extremely well with prior data, and between laboratory comparisons, resulted in p = 0.903 (Fig. 4). Identical smoking regimes (using different smoke engines) generated and delivered similar doses of aerosols, as tested across all products in two different laboratories at different times. The VC1 aerosols samples were generated and collected in the United States and transported to the United Kingdom for nicotine analysis. Despite the different locations, laboratory environments, exposure systems utilized, and requirement to transport nicotine extract samples (at room temperature and with several days delay between generation and analyses), the resulting exposure measurements were virtually identical between the VC1 and other exposure systems and different products. This suggests that nicotine assessment is a robust marker for in vitro aerosol dosimetry assessment and the importance of understanding aerosol delivery in the exposure systems and system performance. These findings are consistent with other published VC1 dosimetry data, with consistent particulate generation at the source. 21
A concern for any exposure system where multiple test systems may be subjected to smoke or aerosol is whether the exposures are uniform. To this end, aerosol delivery to the cellular interface, as measured in the chamber exposure cell culture medium, was also quantified and found to be reproducible across replicate well positions, p = 0.855 (Fig. 5). Again, such observations are confirmed by other studies utilizing dosimetry approaches, where reproducible aerosol delivery across the exposure module wells was shown.21,22 Proof of uniform exposure within the same module is important in demonstrating the reliability and accuracy of replicate experiments with the same exposure.
Of note is that laboratory conditions at IIVS (U.S. laboratory) were not conducted under ISO/TC 126 parameters (22 ± 1°C, 60 ± 5% humidity), yet data generated exhibited exceptional correlation with that of the BAT R&D (UK laboratory) data (generated under ISO conditions). This suggests that some variation of ISO-stated conditions (a requirement for combustible products only) may not adversely affect the study results obtained for 3R4F.
Additional studies are still needed to fully characterize the performance of the VC1, for example, determining within laboratory reproducibility. Also, the currently accepted exposure regimes (ISO and HCI) were developed for traditional combustible cigarettes, and CRM81 is a CORESTA puffing profile for e-cigarettes. We realize that in the future, other exposure definitions will be generated for NGPs and may not reflect the conditions used in this study, but for the purposes of assessing exposure consistency, this is unimportant. It is not anticipated that the close correlation of results shown in this study can only be achieved with the exposure conditions we utilized in these studies. The instrument performance we demonstrated is independent of how exposures will be conducted for NGPs in the future.
Over the last decade, there has been an increase in the number of different NGPs available to consumers, as a potentially reduced risk alternative to smoking. The CTP's purview includes all new tobacco products and NGPs, which must be registered and approved before coming to market either through the SE pathway or a PMTA. The large number of products being produced and the regulatory obligations to demonstrate safety have directed researchers to assess how efficient and relevant safety nonclinical testing can be conducted. One ethical and economically feasible solution is to utilize non-animal tests ranging from simple monolayer cultures to more complex human respiratory tissue models. For all in vitro methods, the use of standardized approaches and exposure systems to generate reproducible test aerosols that model realistic human exposures is necessary. Characterizing these instruments for their ability to reproduce data across laboratories is an inherent part of assay standardization/validation that is necessary for regulatory acceptance. The study conducted here has addressed this critical component by generating initial aerosol data that highlight interlaboratory reproducibility and exposure system consistency.
We believe our interlaboratory comparative study is the first to assess aerosol generation and delivery in the Vitrocell VC1 across multiple nicotine product categories (combustible cigarette, THP, and e-cigarette) and make intermachine comparisons with published data from other exposure systems, Vitrocell VC10 and the Borgwaldt RM20S, where the same nicotine delivery products have been tested in a different laboratory at a different time. The data suggest that the VC1 established in our laboratory (IIVS) can reproducibly generate and deliver tobacco product and NGP aerosols for in vitro assessment, and matches the performance of reported exposure systems. Additional studies of this nature will continue to advance the acceptance of useful data generated from these instruments that are utilized for non-animal testing to help predict safety of new products to humans.
Footnotes
Acknowledgments
The authors thank the PETA International Science Consortium for the generous donation of the Vitrocell VC1 system. They also thank both Douglas, M. and Dean, C. for their rapid and vital assistance with laboratory sample transit through Washington Dulles airport to the United Kingdom.
Authors' Contributions
J.A., H.B., M.G., and E.H. designed the study. J.A., H.B., M.A., and D.S. conducted the experimental work. J.A. analyzed the samples and prepared the results. J.A., H.B., and M.A. drafted the article. J.A., H.B., M.A., M.G., R.C., and E.H. reviewed the study. All authors read and approved the final article.
Author Disclosure Statement
H.B., M.A., D.S., R.C., and E.H. are full-time employees of Institute for In Vitro Science, Inc., a not-for-profit contract research organization that offers services to industry and government. J.A. and M.G. are full-time employees of British American Tobacco (Investments), Ltd.
References
Supplementary Material
Please find the following supplemental material available below.
For Open Access articles published under a Creative Commons License, all supplemental material carries the same license as the article it is associated with.
For non-Open Access articles published, all supplemental material carries a non-exclusive license, and permission requests for re-use of supplemental material or any part of supplemental material shall be sent directly to the copyright owner as specified in the copyright notice associated with the article.
