
Abstract
Abstract
Introduction:
In vitro bile salt export pump (BSEP) inhibition alone does not accurately predict in vivo drug-induced liver injury in humans, suggesting that other mechanisms may be involved. Inhibition of BSEP has been shown to increase the hepatocellular concentrations of bile acids (BAs), and hepatobiliary disposition of BAs is tightly regulated by the farnesoid X receptor (FXR). Activation of FXR leads to decreased synthesis of BAs and increased expression of BA efflux transporters, BSEP, and organic solute and steroid transporter (OSTα/β). The link between BSEP inhibition and activation of the BA compensatory mechanism has not been clearly demonstrated.
Materials and Methods:
Therefore, we utilized BSEP inhibitors, cyclosporine A (CsA) and troglitazone (Trog), to explore this “triggering” event using Transporter Certified™ sandwich-cultured human hepatocytes (SCHH).
Results:
Biliary excretion of glycine-cholic acid (GCA) as a percentage of total GCA accumulation was reduced in SCHH treated with either CsA or Trog. Within 12 hours, CsA treatment concomitantly increased intracellular concentrations (ICCs) of GCA and FGF19 mRNA content, an FXR-target gene. Separately, a synergistic 76.6-fold increase of OSTβ mRNA was observed following CsA and chenodeoxycholic acid co-exposure. In contrast, Trog exposure prevented the synergistic increase of OSTβ, a component of the basolateral BA efflux transporter, under the same conditions. Finally, BA toxicity potency was increased in SCHH exposed to Trog but not CsA.
Discussion and Conclusions:
Overall, these results suggested that BSEP inhibition activates the BA compensatory mechanism reducing ICCs of BAs. However, Trog possesses both BSEP inhibition and FXR antagonist properties blocking the activation of the compensatory mechanism resulting in BA-induced hepatotoxicity.
Introduction
T
It is increasingly recognized that bile acids (BAs) play many critical roles in the signaling of key cellular pathways, including the regulation of hepatic lipid, glucose, and energy homeostasis, as well as inducing cell death through activation of death receptor pathways.4–6 Since BAs are toxic to the hepatocyte, disruption of BA homeostasis following drug exposure may lead to cholestatic DILI manifested as hepatocellular toxicity. Under normal conditions BAs are excreted primarily across the canalicular domain using the bile salt export pump (BSEP) with the basolateral efflux transporters MRP3/4 playing a minor role. 7 Inhibition of BSEP could induce hepatotoxicity by causing intracellular concentrations (ICCs) of BAs to rise above a toxic threshold.8,9 Therefore, early cholestatic DILI screening efforts have focused on a compound's potential to inhibit BSEP transport using recombinant vesicles.8,9
Although BSEP is an important efflux mechanism for BA, it is not the only mechanism by which hepatic intracellular BA concentrations can be controlled. BAs act as signaling molecules to regulate their own ICC in hepatocytes by activation of the farnesoid X receptor (FXR).10–12 Activation of FXR leads to the downregulation of CYP7A1, the rate limiting enzyme in the synthesis of BAs in the liver. 13 FXR activation can also increase the expression of BSEP thereby increasing BA efflux into the bile. 12 In addition to an increase in biliary efflux, BAs also have been shown to increase their own basolateral efflux through FXR mediated induction of the organic solute and steroid transporter (OSTα/β), which has recently been shown to be a major clearance pathway for intracellular BAs in the hepatocyte when ICCs of BA are increased.14–16 FXR activation serves as a compensatory mechanism responding to increases in the ICC of BAs to regulate both BA synthesis and efflux (e.g., biliary and basolateral transport).
BSEP inhibition potency is not always correlated with DILI (e.g., cyclosporine A (CsA); BSEP IC50 = 0.5 μM 8 ).17–19 In large clinical trials, initiation of CsA therapy was associated with only mild elevations in serum bilirubin levels, often without significant increases in serum alanine transaminase or alkaline phosphatase. 20 Simple models such as recombinant transporter vesicles overlook the role that BA homeostatic mechanisms (e.g., the FXR compensatory mechanism) play in the prevention of BA hepatotoxicity. While single transporter data are useful in understanding compound liabilities, it is not predictive of bile acid-induced (e.g., cholestatic) hepatotoxicity. Accurate prediction of cholestatic liver toxicity requires that both inhibition events and compensatory mechanisms of the liver be taken into account.
To understand the relationship between BSEP inhibition and activation of the FXR compensatory mechanism, the functional impact (changes in BA ICCs and the activation of FXR target genes) following exposure to well-known BSEP inhibitors, CsA and troglitazone (Trog), was evaluated using sandwich-cultured Transporter Certified™ human primary hepatocytes. The principal aim of this study was to evaluate the hypothesis that inhibition of BSEP “triggers” a transient increase in the ICC of BAs resulting in the activation of FXR and initiating the compensatory mechanism to suppress synthesis and increase efflux, thereby preventing BA hepatotoxicity.
Materials and Methods
Chemicals, hepatocytes, reagents
HPLC grade methanol and acetonitrile were purchased from World Wide Medical Products (Bristol, PA). Transporter Certified human primary hepatocytes were obtained from Triangle Research Laboratories (RTP, NC) and ThermoFisher Scientific (Waltham, MA). Primary human hepatocytes were cultured with proprietary cell culture media formulations developed by Qualyst Transporter Solutions (QTS), now a part of ADME-Tox Division of BioIVT. QualGro™ Seeding Medium and QualGro™ Culture Induction Medium supplemented with Matrigel (Corning, Tewksbury, MA) were from QTS (Durham, NC).
The base medium (Dulbecco's modified Eagle's medium) used by QTS and additional supplements, including fetal bovine serum, used for cell culture were from Gibco (Carlsbad, CA) and Corning (Tewksbury, MA). All quantitative real-time polymerase chain reaction (qRT-PCR) reagents were purchased from Thermo Fisher Scientific. Pierce BCA™ Protein Assays were also purchased from Thermo Fisher Scientific. Trog was purchased from Cayman Chemicals (Ann Arbor, MI). CsA and chenodeoxycholic acid (CDCA) were purchased from Sigma Aldrich (St. Louis, MO). DY268 was purchased from Tocris (Bristol, United Kingdom). Deuterated-TCA (d8-TCA) was purchased from Martrex (Minnetonka, MN). Deoxycholic acid (DCA) was purchased from Santa Cruz Biotechnology (Dallas, TX), and all other BAs, including glycine-DCA (GDCA), glycine-CDCA (GCDCA), and glycine-cholic acid (GCA), were purchased from Steraloids (Newport, RI).
Preparation of sandwich-culture hepatocytes
Sandwich-cultured human hepatocytes (SCHH) were established by thawing Transporter Certified cryopreserved hepatocytes (Table 1) according to the manufacturer's instructions. Once thawed, the cells were suspended in QualGro Seeding Medium, a QTS proprietary product, at a density of 0.8 million viable cells/mL and seeded onto BioCoat® 24-well (∼0.4 million cells/well) or 96-well (∼0.05 million cells/well) cell culture plates purchased from Corning (Tewksbury, MA). Following the initial seeding, cells were allowed to attach for 2–4 hours, then rinsed and fed with 500 μL/well warm (37°C) QualGro Seeding Medium. After a culture time of 18–24 hours, the seeding medium was removed, and the cells were fed and overlaid with QualGro™ Induction Medium supplemented with 0.25 mg/mL Matrigel (Corning).
BA, bile acid; BSEP, bile salt export pump; CsA, cyclosporine A; GCA, glycine-cholic acid; FXR, farnesoid X receptor.
Effects of CsA and Trog on BA biliary efflux
The effects of CsA and Trog on the hepatobiliary disposition of BA were determined using SCHH as described above in 96-well format and treated as follows. Stock solutions of CsA and Trog (1000× final concentration) were prepared in dimethyl sulfoxide (DMSO) and then diluted directly into QualGro Induction Medium day of assay to yield the desired final concentrations. Hepatocytes were treated with either CsA or Trog at 1, 5, 10, 25, 50, and 100 μM for 2 hours on day 5 of culture. Following the 2-hour exposure period, the cultures were rinsed, and a disposition study with d8-TCA was performed using B-CLEAR® technology as previously described.21,22 SCHH, in parallel cultures, were washed twice with Plus (+) buffer (buffer containing Ca++/Mg++) or Minus (−) buffer (buffer without Ca++/Mg++). The wash solutions were removed and replaced with fresh Plus (+) or Minus (−) buffer and incubated for 10 minutes at 37°C to modulate tight junctions.21,22 Following the incubation, the wash solution was removed, and the hepatocytes were then washed thrice with ice-cold Plus (+) Buffer. The plates were frozen at −80°C until processed for bioanalysis to determine protein content and disposition of d8-TCA. The Biliary Excretion Index (BEI), biliary clearance (ClBiliary), and total accumulation were determined as shown in the Data Analysis section. Protein content was determined using Pierce™ BCA Protein Assay Kit (Thermo Fisher Scientific, Waltham, MA) following manufacturer's instructions.
Upregulation of basolateral efflux transporter expression following BSEP inhibition
The BA basolateral efflux transporter, OSTα/β, is regulated by an FXR-dependent mechanism and may function as a “safety valve” to decrease the ICC of BAs in the hepatocyte when they are elevated.14–16 SCHH were prepared and treated with CsA (1, 10, and 20 μM), Trog (10, 50, and 100 μM), CDCA (30 μM), CsA (1, 10, and 20 μM) + CDCA (30 μM), and Trog (10, 50, 100 μM) + CDCA (30 μM). Stock solutions were prepared as previously described and diluted (1000 × ) directly into QualGro Induction Medium daily to achieve the desired final concentrations. SCHH were established as described above in 24-well format and were treated for 72 hours with daily media changes. Following the designated exposure period, SCHH were washed once with one volume of HBSS and lysed by addition of 0.3 mL of Qiagen RLT Buffer supplemented with β-mercaptoethanol and frozen at −80°C until processed for total mRNA isolation and subsequent qRT-PCR analysis of FXR target genes, FGF19, and OSTβ,15,16,23,24 as described below.
Time course of CsA effects on GCA biliary efflux, ICC, and FXR activation
The biliary efflux, ICC of endogenous GCA, and FXR activation in SCHH exposed to CsA (10 μM) were determined at multiple time points up to 12 hours. Stock solutions were prepared as previously described. SCHH were established as described above in 24-well format. Once established the hepatocytes were treated with CsA (10 μM) for 10, 60, 120, 240, and 720 minutes. The plates were frozen at −80°C until processed for bioanalysis to determine protein content and disposition of endogenous GCA. Endogenous GCA was quantitated as described below, and the hepatobiliary disposition of GCA was determined using B-CLEAR technology as previously described following the designated exposure period.21,22 In parallel plates, hepatocytes were harvested for total mRNA isolation to evaluate FXR activation by assessing the mRNA content of FGF19 and OSTβ, sensitive FXR target genes15,16,23,24 as described below.
Evaluation of FXR activation
FXR activation was determined in SCHH after treatment with potent BSEP inhibitors. Trog has been reported to modulate FXR. Kaimal et al. suggested that Trog was a weak FXR agonist at low concentrations, but could antagonize FXR activation at higher concentrations. 25 DY268 has been shown to be a potent FXR antagonist. 26 SCHH were prepared and treated with CsA (10 μM), or CDCA (30 μM) alone, CsA (10 μM) + CDCA (30 μM), Trog (100 μM) + CsA (10 μM) + CDCA (30 μM), or DY268 (5 μM) + CsA (10 μM) + CDCA (30 μM). Stock solutions were prepared as previously described. SCHH (24-well format) were treated on day 4 of culture for 24 hours in triplicate as described above. Following the designated exposure period, SCHH were washed once with one volume of HBSS and prepared for mRNA analysis as described below.
BA mediated hepatotoxicity assessment
SCHH were established as previously described in 96-well format. On day 4 of culture, SCHH were exposed to CsA (10 μM) or Trog (100 μM) for 24 hours. Compound stocks (1000 × ) were diluted directly into media alone or media containing a fixed concentration of free fatty acids (FFAs) and varying concentrations of pooled BAs up to a total BA concentration of 5 mM. The pooled BA contained a physiological mixture of the four most abundant BA in human serum (GCDCA, GCA, DCA, and GDCA) formulated at in vivo relevant ratios (1.0 GDCA: 1.0 DCA: 2.0 GCA: 4.5 GCDCA) as reported in Ogimura et al. These ratios remained constant as the total bile acid concentration was increased. 27
In a parallel experiment, the effect of increasing FFA concentrations was evaluated. On day 4 of culture, SCHH were exposed to CsA (10 μM) or Trog (100 μM) for 24 hours. Compound stocks (1000 × ) were diluted directly into media alone or media containing a fixed concentration of pooled BA (250 μM) and varying concentrations of FFAs (1:2 palmitate:oleate) from 0.1 mM to 1.0 mM. The FFA exposure in combination with BA was evaluated since lipid loading of hepatocytes has been reported to sensitize hepatocytes to BA-induced cytotoxicity. 28 Lipid accumulation and BA accumulation (e.g., cholestasis) activate similar death pathways controlling programmed cell death (e.g., apoptosis/necroptosis).6,29,30 Following the exposure period, cellular ATP was determined using CellTiter-Glo™ Luminescent Cell Viability Assay from Promega (Madison, WI). Each treatment group was evaluated in triplicate wells in Transporter Certified cryopreserved human hepatocytes.
Measuring FXR activation and ER stress under sensitization conditions
To assess FXR activation and ER stress under sensitization conditions (e.g., 250 μM BA pool and 1 mM FFA), SCHH were established in 24-well format as previously described. On day 4 of culture, SCHH were exposed to CsA (10 μM), Trog (100 μM), or DY268 (5 μM) for 12 hours. Compound stocks (1000 × ) were diluted directly into media alone, media containing a fixed concentration of BA (250 μM BA pool), media containing a fixed concentration of FFAs (1 mM; 1:2 palmitate:oleate), and media containing a fixed concentration of FFAs (1 mM; 1:2 palmitate:oleate) and BAs (250 μM BA pool). Following the designated exposure period, SCHH were washed once with one volume of HBSS and processed for total mRNA isolation and subsequent qRT-PCR analysis of FXR target genes, FGF19 and OSTβ, and ER stress biomarker, CCAAT/enhancer-binding protein (C/EBP) homologous protein (CHOP)29–31 as described below. In parallel, lactate dehydrogenase (LDH) leakage was evaluated in cell culture media from same hepatocyte cultures following 12 hours of exposure to drug treatment. LDH leakage was determined using CytoTox-ONE™ Homogeneous Membrane Integrity Assay from Promega (Madison, WI). Each treatment group was evaluated in triplicate wells in Transporter Certified cryopreserved hepatocytes.
Total RNA isolation and qRT-PCR
To evaluate treatment effects on FXR activation and ER stress in SCHH, mRNA content of FXR target genes, OSTβ or FGF19,15,16,23,24 and ER stress biomarker, CHOP,29–31 was determined. Following exposure period with specified treatment, total mRNA was extracted using a QIAGEN RNeasy® Kit (Qiagen, Hilden, Germany), according to the manufacturer's instructions. Before extraction the cells were lysed by adding a 0.3 mL aliquot of Qiagen RLT lysis buffer (supplemented with β-mercaptoethanol) to each plate. The plates were then frozen at −80°C to lyse the cells and then thawed to continue the RNA isolation procedure. Total RNA was isolated from each treatment group. The RNA isolated from three individual wells within a group was pooled. The isolated RNA was quantified using the Quant-iT RiboGreen® RNA Assay Kit (Thermo Fisher Scientific) according to the manufacturer's instructions. Pooled total RNA samples were used to prepare cDNA using 500 ng in the High Capacity cDNA Archive Kit (Thermo Fisher Scientific) according to the manufacturer's instructions. Changes in gene expression were measured by analyzing the cDNA prepared from each treatment group with gene-specific TaqMan® assays (Thermo Fisher Scientific) for OSTβ (Assay# Hs01057182_m1), FGF19 (Assay# Hs00192780_m1), and CHOP (Hs00358796_g1). Glyceraldehyde 3-phosphate dehydrogenase (GAPDH; Assay# Hs99999905_m1) was used as the endogenous housekeeping gene to normalize each sample. Polymerase chain reaction (PCR) was performed on a ViiA™ 7 system Real-Time PCR System (Thermo Fisher Scientific) in relative quantification mode for 45 amplification cycles. Standard conditions for TaqMan-based assays were used. The determination of threshold cycles (Ct) was determined by the Vii7 system software for all target genes (OSTβ, FGF19, CHOP) and endogenous control (GAPDH) genes. Relative-fold mRNA content was determined for each treatment group relative to the endogenous control gene expression and the calibrator, DMSO vehicle control using the ViiA 7 system software. Confidence intervals of 95% were calculated for each target gene relative quantitation (RQ) mean by the ViiA 7 system software.
Bioanalysis of BA
GCA or d8-TCA was extracted from cell lysates derived from the individual wells of 24-well cell culture plates. BA extraction was initiated by adding a 500 μL aliquot of lysis solution (70:30 methanol:water [v:v] containing 25 nM of d5-TCA as an internal standard) to each well. Cell lysis was performed by allowing the plates to shake for at least 15 minutes at room temperature. The cell lysates were then transferred to Whatman 96-well UNIFILTER 25 μm MBPP/0.45 μm PP filter plate (Whatman, 7770-0062) and stacked on a 96-well deep well plate. Filtration of the lysates was accomplished by centrifugation and collection of the filtrate in the deep well plate (2390 rcf for 2 minutes). The filtrate was then concentrated by first evaporating the samples to dryness under Nitrogen and then reconstituting with 120 or 150 μL of sample diluent (60:40 methanol:water containing 4 mM ammonium acetate). The samples were mixed for 10 minutes on a plate shaker at room temperature. To prepare the reconstituted samples for LC-MS/MS analysis, they were transferred to a Millipore 0.45 um filter plate (Millipore, MSHVN45) and filtered into a Costar 3957 plate by centrifugation (2390 rcf for 2 minutes) and then sealed with a silicone capmat for analysis.
LC-MS/MS was performed using a Thermo Electron TSQ® Quantum Discovery MAX™ (Waltham, MA) with an Ion Max ESI source operated in negative electrospray ionization mode. Chromatographic separation of endogenous BA and their deuterated counterparts (for use as analytical standards) was achieved using a Shimadzu binary HPLC system with LC-10ADvp pumps (Columbia, MD) equipped with a Thermo Scientific Hypersil GOLD™ 100 × 1.0 mm, 3 μm with matching guard, and precolumn filter (Bellefonte, PA), using a linear gradient of 45%–100%B, at a flow rate of 0.05 mL/minute, with mobile phase A as 20% methanol with 0.25 mM ammonium acetate and mobile phase B as 80% methanol with 0.25 mM ammonium acetate, both at native pH.
Data analysis
All calculations were performed using Microsoft Excel, 2010 unless otherwise stated. Statistical analyses were performed using GraphPad Prism Software Version 7.0 (La Jolla, CA), and p-values were defined in the figure legends where applicable. Hepatobiliary disposition results, including BEI, ClBiliary, and total accumulation of d8-TCA, were analyzed using a two-way analysis of variance (ANOVA) followed by a Dunnet's multiple comparison test. Hepatobiliary disposition results, BEI and ICC, of endogenous GCA following a 12-hour time course exposure to CsA, were assessed using a two-way ANOVA followed by a Sidak's multiple comparison test. Changes in gene expression were determined to be statistical significant if the 95% confidence intervals, calculated by the ViiA 7 system software, failed to overlap across treatment groups. Nonlinear regression (Y = Bottom + (Top-Bottom)/(1 + 10^((LogEC50-X) × HillSlope))) of ATP content versus BA or FFA concentration (Log) was performed using GraphPad Prism Software Version 7.0 (La Jolla) to estimate the concentration reducing cell viability by 50% (e.g., TC50). The TC50 parameter was utilized to compare changes in BA or FFA potency in the presence or absence of CsA or Trog. Statistical significance of ATP content and LDH leakage results was evaluated using a one-way ANOVA followed by a Dunnet's multiple comparison test.
To quantitate BA biliary efflux, the BEI was determined as previously described.21,22 Briefly, BA mass values measured in hepatocyte lysates were normalized to the total cellular protein (mg) content per well. Total accumulation of BA is defined as the mass of the BA in the hepatocyte plus the bile pocket and was determined in cells incubated with Plus (+) buffer. Cellular accumulation of BA is defined as the mass of BA in the hepatocyte only and was determined in cells incubated with Minus (−) buffer. The bile accumulation was calculated by subtracting the cellular accumulation (no bile pockets) from the total accumulation (presence of bile pockets). The BEI represents the percent of total mass taken up excreted into the bile and was calculated (equation 1) by dividing the bile accumulation by the total accumulation and multiplying by 100.
Equation 1:
To quantitate the ICC of GCA following CsA treatment, the mass of GCA in the hepatocytes (Cellular Accumulation Minus (−) Buffer) was divided by the estimated human hepatocyte intracellular fluid volume of 7.69 μL/mg protein as described in Equation 2. 32
Equation 2:
The ClBiliary was determined as shown in Equation 3.
Equation 3:
Where AUC is the area under the media concentration versus time profile and was calculated as the nominal media concentration of d8-TCA applied to the culture system multiplied by the exposure time (e.g., 10 minutes).
Results
CsA and Trog inhibit biliary excretion of BA
Following a 2 hour exposure to the BSEP inhibitors, CsA and Trog, the BEI of d8-TCA decreased in a concentration-dependent manner (Fig. 1A). CsA was a more potent inhibitor of d8-TCA biliary excretion at all concentrations. Both compounds completely inhibited the biliary excretion of d8-TCA at 100 μM. The ClBiliary and the total accumulation of d8-TCA also decreased in a concentration-dependent manner following exposure to CsA and Trog (Fig. 1B, C). At 100 μM, CsA and Trog completely inhibited ClBiliary, and the total accumulation decreased to <20% of control. These results were consistent with past published results on the effect of CsA and Trog in SCHH.33,34

Upregulation of basolateral efflux transporter expression following BSEP inhibition
The FXR agonist, CDCA (30 μM), induced both FGF19 and OSTβ mRNA content in SCHH following 72 hours of treatment consistent with published results (Fig. 2).15,16,24 Following treatment of SCHH with increasing concentrations of CsA (1, 10, 20 μM), increases in FGF19 and OSTβ mRNA content were observed up to 10 μM and ranged from 1.78- to 11.8-fold greater than solvent control for FGF19 and 2.68- to 11.4-fold greater than solvent control for OSTβ. The increases in FGF19 and OSTβ following treatment with CsA were consistent with activation of the bile acid sensing receptor, FXR. Coadministration of CsA and CDCA resulted in dose-dependent and synergistic increases of 28.5- to 356-fold and 41.5- to 183-fold in FGF19 and OSTβ mRNA content in SCHH, respectively (Fig. 2). Coadministration of Trog (10, 50, 100 μM), a well-established BSEP inhibitor, and CDCA (30 μM), resulted in lower dose-dependent increases in OSTβ and much smaller increases in FGF19 mRNA content in SCHH (Fig. 2). Increases in OSTβ and FGF19 mRNA content were 68% and 96% lower with Trog (100 μM) and CDCA (30 μM) co-treatment than CsA (10 μM) and CDCA (30 μM) co-treatment.

The basolateral efflux transporter OSTβ is upregulated by BSEP inhibition in SCHH. The expression of FXR target genes, OSTβ and FGF19, was evaluated in SCHH following treatment with CsA (BSEP inhibitor), CDCA (FXR agonist), and CsA + CDCA. SCHH were established and treated as described under Materials and Methods. After 72 hours, the cells were harvested and total RNA extracted for qRT-PCR. The BSEP inhibitor CsA (10 and 20 μM) increased OSTβ and FGF19 mRNA content. Similarly, the FXR agonist CDCA (30 μM) increased OSTβ and FGF19 mRNA content. A synergistic increase in OSTβ and FGF19 mRNA content was observed in SCHH co-treated with CsA (1, 10, 20 μM) and CDCA (30 μM). Coadministration of Trog (10, 50, 100 μM) and CDCA (30 μM) resulted in lower dose-dependent increases in OSTβ and smaller increases in FGF19 mRNA content. Values represent the RQ mean, and error bars represent 95% confidence intervals. CDCA, chenodeoxycholic acid; FXR, farnesoid X receptor; qRT-PCR, quantitative real-time polymerase chain reaction; RQ, relative quantitation.
Time course of the BA compensatory mechanism in SCHH
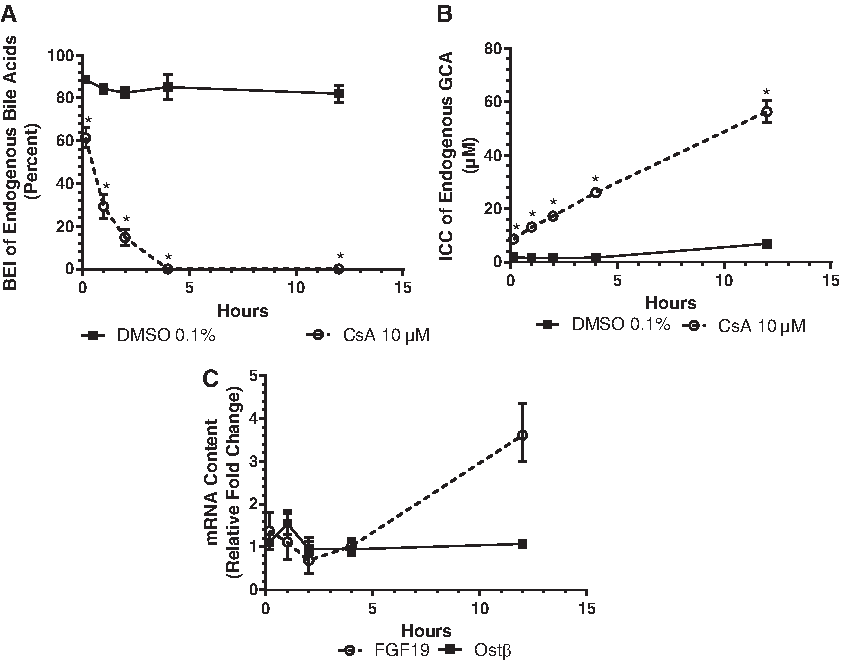
Compared to the solvent control, exposure to CsA (10 μM) decreased the biliary efflux (BEI) of endogenous GCA in a time-dependent manner with maximum inhibition occurring within 4 hours of exposure (Fig. 3A). In the same plate, concomitant time-dependent increases in the ICC of GCA were observed and achieved statistical significance following 10 minutes of exposure to CsA (Fig. 3B). The GCA ICC was highest (56.4 μM) following 12 hours of CsA exposure and represented 8.18-fold increase relative to the solvent control. These results directly link inhibition of canalicular BA efflux to increases in the ICCs of BA. Concomitant time-dependent increases in FGF19 mRNA content were observed over the same time frame as the observed increases in GCA ICCs, reaching a maximum response (3.61-fold greater than solvent control) following 12 hours of CsA exposure (Fig. 3C). However, no marked changes of OSTβ mRNA content were observed across the 12-hour CsA exposure period. FGF19 mRNA content results support the conclusion that BSEP inhibition increases the ICC of BA, which then leads to activation of FXR.
FXR regulates BA basolateral efflux compensatory mechanism
Co-treatment with CsA and CDCA resulted in a synergistic increase in FGF19 and OSTβ mRNA content of 60.8-fold and 76.6-fold greater than solvent control, respectively (Fig. 4A). However, when Trog (100 μM) or DY268 (5 μM), a potent FXR antagonist, 26 was coincubated with CsA and CDCA, the response of FGF19 gene expression was decreased by 70% and 91%, respectively. Likewise, OSTβ gene expression following treatment with Trog (100 μM) or DY268 (5 μM) in the presence of CsA and CDCA was decreased by 52% and 92%, respectively. These results were consistent with antagonism of FXR. There were no statistically significant (Dunnett's; p-value ≥0.05) decreases in cell viability as measured by ATP when any of the compounds were administered alone or in combination (Fig. 4B). Overall, these results suggested that disruption of FXR activation reduces the BA basolateral efflux compensatory mechanism in SCHH.

Assessing BA-induced hepatotoxicity
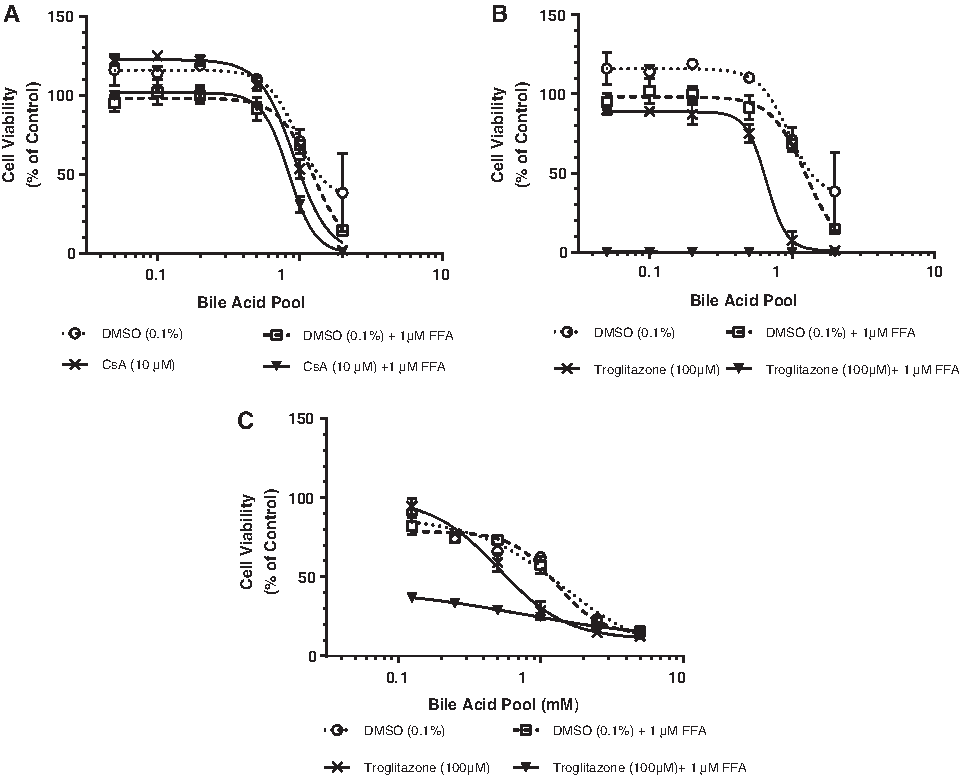
Increased exposure to BAs in the absence of CsA, Trog, or FFAs decreased the hepatocyte viability in a dose-dependent manner (Fig. 5A, B). Addition of 1 mM FFA to the BA pool titration resulted in a slight (<10%) additional decrease in cell viability (Fig. 5A, B). Addition of CsA (10 μM) to the BA pool titration in the absence or presence of FFAs, had no effect on the cell viability (Fig. 5A, Table 2). Addition of Trog (100 μM) to the BA pool titration in the absence of FFAs had a small effect on the cell viability (Fig. 5B, Table 2) decreasing the TC50 from 0.95 to 0.66 mM. However, increasing the exposure concentration of BAs in the presence of a fixed concentration of Trog (100 μM) and FFAs (1 mM) reduced the cell viability to less than 1% of control at the lowest BA concentration. In a second donor, increased exposure to BA in the absence or presence of 1 mM FFA resulted in a dose-dependent decrease in hepatocyte viability with similar estimated TC50 values (Fig. 5C, Table 2). Increasing the BA pool concentration in the presence of Trog (100 μM) in the absence of FFAs decreased the TC50 2.74-fold from 1.4 to 0.51 mM (Fig. 5C, Table 2) in this donor. In the presence of FFA, Trog treatment reduced the TC50 > 10.4-fold from 1.3 to 0.125 mM (Fig. 5C, Table 2) in this preparation of hepatocytes.
DMSO, dimethyl sulfoxide; FFA, free fatty acid; ND, not determinable.
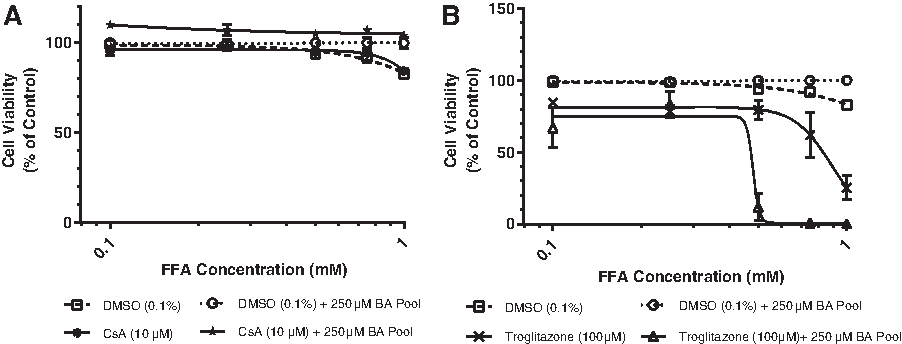
Increasing the FFA concentration in the absence of CsA, Trog, or a BA pool (Fig. 6A, B, Table 3) resulted in a slight decrease in viability (≤17.2%). Addition of 250 μM BA pool had no effect on cell viability. Addition of CsA (10 μM) to the FFA titration in either the presence or absence of BA led to no changes in cell viability (Fig. 6A, Table 3). Increasing the FFA concentration in the presence of Trog (100 μM) and in the absence of BA slightly decreased the TC50 from ≥1.0 to 0.824 mM (Fig. 6B, Table 3). Increasing the FFA concentrations in the presence of Trog (100 μM) and a BA pool (250 μM) resulted in a marked decrease in cell viability, reducing the TC50 ≥ 2.1-fold from ≥1.0 to 0.48 (Fig. 6B, Table 3) suggesting that FFAs sensitize hepatocytes to BA-induced toxicity resulting from Trog exposure.
Assessing FXR activation under sensitization conditions
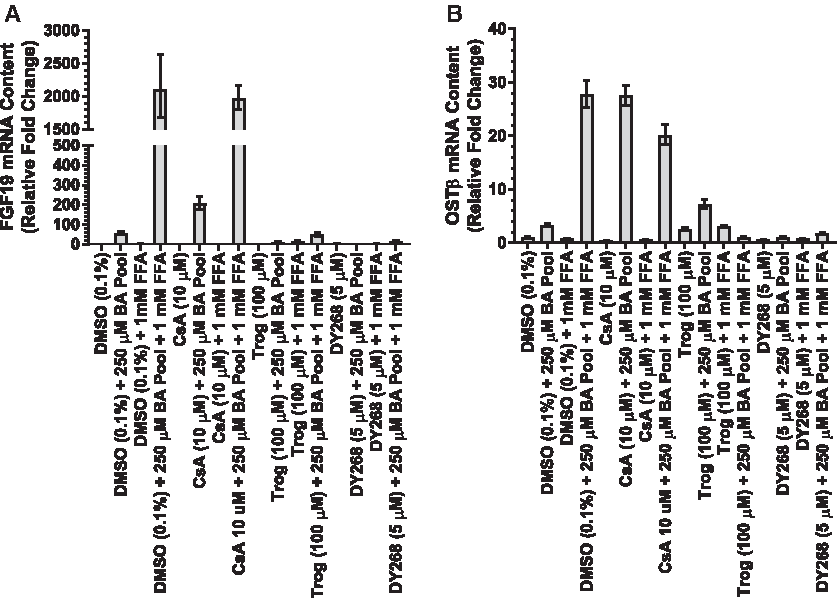
The potential of CsA and Trog to activate FXR was evaluated under sensitization conditions (e.g., BA pool + FFA). Twelve hours of exposure to a 250 μM BA pool alone increased FGF19 and OSTβ mRNA content 55.3-fold and 3.35-fold, respectively, in SCHH consistent with FXR activation (Fig. 7A, B). Synergistic increases of FGF19 and OSTβ mRNA content of 205-fold and 27.5-fold, respectively, were observed in SCHH treated with CsA + 250 μM BA pool consistent with our previous results. In the presence of 1 mM FFA, additional synergistic increases of FGF19 (2104-fold) and OSTβ (27.8-fold) mRNA content were observed in SCHH treated with 250 μM BA pool in the absence or presence of CsA. Trog (100 μM) exposure markedly reduced FGF19 and OSTβ mRNA content ≥95% and ≥74%, respectively, in SCHH cultured with 250 μM BA pool in the absence or presence of FFAs. Similar reductions in FGF19 (≥99%) and OSTβ (≥91%) were observed in SCHH treated with the potent FXR antagonist, DY268, cultured with 250 μM BA pool in the absence or presence of FFAs. Again, these data were consistent with our previous results.
Measuring ER stress and toxicity under sensitization conditions
ER stress has been implicated in BA-induced (e.g., cholestatic) hepatotoxicity as the initiating step resulting in cell death.29,31 CHOP is a key component in the ER stress-mediated cell death pathways.29–31 High concentrations of BA have been shown to induce CHOP in isolated wild-type mice hepatocytes resulting in increased cell death, whereas cell death and liver fibrosis were attenuated in CHOP-knockout mice hepatocytes. 31 Therefore, we evaluated the ER stress biomarker, CHOP, following 12 hours of exposure to CsA (10 μM), Trog (100 μM), or DY268 (5 μM) under sensitization conditions (e.g., 250 μM BA pool + 1 mM FFA). CHOP mRNA content was induced ≤2.0-fold above solvent control in SCHH treated with CsA (10 μM) or DY268 (5 μM) in the absence or presence of BA pool or BA pool + FFA (Fig. 8A). Following 12 hours of exposure, Trog (100 μM) treatment induced CHOP mRNA content 2.89-fold above solvent control in SCHH cultured in the presence of FFAs. CHOP mRNA content was further increased to 7.1-fold above solvent control in SCHH treated with Trog (100 μM) in the presence of BA pool + FFA.
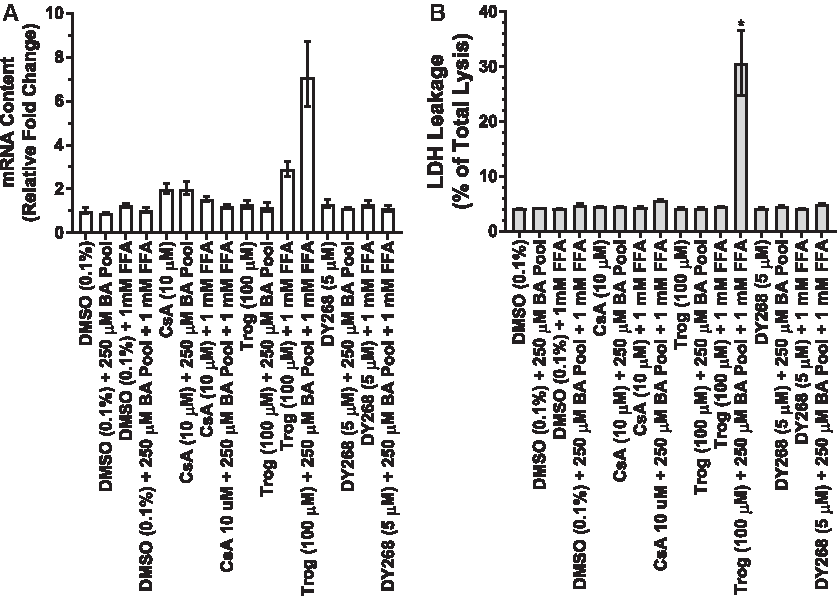
In parallel, LDH leakage was evaluated in cell culture media from the same hepatocyte cultures following 12 hours of exposure to treatments. No statistical significant increases (Dunnett's; p-value ≥0.89) in LDH leakage were observed with CsA (10 μM) or DY268 (5 μM) treatments in absence or presence of BA pool or BA pool + FFA (Fig. 8B). LDH leakage was only significantly (Dunnett's; p-value ≤0.0001) increased in SCHH treated with Trog (100 μM) in the presence of BA pool + FFA culture conditions. These results were consistent with marked induction of CHOP observed under the same conditions suggesting Trog treatment in the presence of a BA pool and FFA induced ER stress resulting in BA-induced (e.g., cholestatic) hepatocyte injury.
Discussion
Multiple publications have focused on the connection of BSEP inhibition and cholestatic (BA-dependent) DILI.8,9,17–19 However, in vitro BSEP inhibition potency values derived from vesicle studies do not accurately predict in vivo DILI incidence.17–19,35 BSEP plays an important role in the ClBiliary of BA; however, the assumption that BSEP inhibition is the only factor causing cholestatic DILI is likely an oversimplification. BAs act as signaling molecules to prevent liver injury by activating the BA compensatory mechanism (e.g., FXR). The adverse outcome pathway, a more comprehensive or holistic approach, proposed by Vinken suggests that a molecular interaction (e.g., BSEP inhibition) initiates a compensatory mechanism, decreasing BA synthesis, and shunting BA to alternative handling pathways which decrease the potential for liver injury. 36 This concept of a compensatory mechanism “triggered” by some initiating event has been well established in the literature.35,37,38 However, the “link” between BSEP inhibition and FXR activation through increased ICCs of endogenous BA has not been demonstrated until this present work.
Two potent BSEP inhibitors, CsA and Trog, were used to determine the activation of the compensatory mechanism in SCHH. Although Trog has BSEP inhibition properties, its sulfated metabolite which is formed and accumulates intracellularly in SCHH is a more potent BSEP inhibitor. 39 Under optimal conditions, SCHH repolarize and form networks of bile canaliculi-like structures and reestablish vectorial flow of BA40,41 while maintaining other mature hepatocyte functions, including nuclear receptor signaling and metabolism. 42 These are necessary biological processes involved in BA homeostasis that an appropriate model system must support to prospectively evaluate a new chemical entity's (NCE) cholestatic DILI potential. In SCHH, exposure to either CsA or Trog reduced the biliary excretion (BEI), ClBiliary, and total accumulation of an exogenously administered BA (d8-TCA). Both CsA and Trog inhibited the BSEP mediated efflux (BEI) of d8-TCA with CsA being more potent than Trog. Both compounds inhibited uptake of d8-TCA to a similar extent. The BEI of BA has been shown to be independent of effects on uptake of BA. Although basolateral efflux only accounts for ∼25% of BA efflux in SCHH under normal conditions, inhibition of basolateral efflux of BA would lead to increases in the biliary excretion of BA. Therefore, inhibition of basolateral efflux would tend to decrease the observed effect on the BEI. 43 In contrast, induction of basolateral efflux could lead to a decrease in the BEI; however, the exposure time is not consistent with induction of protein synthesis. ClBiliary, a function of uptake and efflux mechanisms, was also decreased by both compounds, with CsA having a greater effect. These results were consistent with previous studies conducted in SCHH.33,34
The primary human toxicities associated with CsA therapy are nephrotoxicity and neurotoxicity, not liver toxicity, and they have relatively low incidence of occurrence.20,44 In contrast, the clinical evidence regarding Trog toxicity estimates that the incidence of liver injury can be as high as 1:1000 patients and clearly indicates that Trog causes hepatocellular liver injury. 20 The sharp contrast in clinical liver injury incidence between these two potent BSEP inhibitors suggests that in addition to BSEP inhibition other process may be involved.
Induction of the basolateral BA efflux transporter monomer OSTβ and the transcription factor FGF19 by CDCA exposure was observed and was consistent with an FXR-dependent mechanism reported to control the expression of these genes.15,16,23,24 Induction of OSTβ and FGF19 mRNA content in SCHH treated with CsA was similar in magnitude compared to CDCA treatment following 72 hours. Co-treatment of CDCA with increasing concentrations of CsA resulted in a synergistic induction of OSTβ and FGF19 mRNA content in SCHH. These results suggested that FXR activation occurs following treatment with CsA and with co-treatments of CDCA and CsA. Given the observed synergistic effects, our data suggested that FXR activation occurred indirectly through increased ICCs of BA due to inhibition of BSEP. SCHH were then exposed to CsA, and the hepatobiliary disposition of an endogenous BA (GCA) was monitored over time using B-CLEAR technology. The biliary excretion of endogenous GCA was reduced in a time-dependent manner reaching statistical significance after 10 minutes of exposure; this resulted in a concomitant increase in the ICC of GCA. In parallel experiments with CsA using these same experimental conditions and time points, the mRNA expression of the FXR target genes, FGF19 and OSTβ, was monitored. Although OSTβ was not induced, increases in FGF19 mRNA content, the more sensitive FXR target gene, and ICC GCA mirrored each other following treatment with CsA. The lack of OSTβ induction under these conditions suggested that ICC of BA did not rise to sufficient levels to activate additional BA efflux following 12 hours of CsA exposure in the absence of exogenously applied BA. However, the FGF19 response establishes, for the first time, a direct “link” among BSEP inhibition, increased ICC of endogenous BA, and FXR activation. In addition, activation of FXR will also increase BSEP expression, but that increase is not relevant if a potent BSEP inhibitor is present. Activation of this BA compensatory mechanism by BSEP inhibition may explain the weak concordance between BSEP inhibition potency and cholestatic DILI incidence. Many compounds may inhibit BSEP; however, the hepatocyte may be able to compensate for the resulting increase in the ICC of BA through activation of FXR and an increase in the basolateral efflux. This phenomenon is consistent with clinical observations showing that increases in circulating BA are not always associated with DILI. 45
The importance of FXR regulation and the BA compensatory mechanism was evaluated following exposure to CsA, Trog, and DY268, a potent FXR antagonist. In SCHH, co-treatment of CsA and CDCA resulted in synergistic induction responses of FGF19 and OSTβ mRNA content. In contrast, Trog (100 μM) exposure decreased the synergistic induction response of FGF19 and OSTβ mRNA content observed following co-treatment with CDCA and CsA by 70% and 52%, respectively. Furthermore, treatment with a combination of CDCA, CsA, and DY268, a novel and potent FXR antagonist, 26 resulted in a ≥91% decrease in the FGF19 and OSTβ mRNA induction response. Taken together, these results suggested that Trog (100 μM) antagonized FXR preventing the hepatocyte from responding to increases in the ICC of BA. These results were consistent with reports of FXR antagonism 46 and accounts of Trog having weak FXR antagonist properties. 25
Although Ogimura et al. 27 attributed all toxicity observed in sandwich-cultured rat hepatocytes (SCRH) to inhibition of BSEP, they demonstrated a novel strategy of applying an exogenous human BA pool to SCRH to evaluate cholestatic hepatotoxicity of NCEs. Hepatocytes in vitro require a BA challenge to fully evaluate the function of the BA homeostatic mechanisms. Greater than 95% of secreted BA following a meal are reabsorbed in vivo from the ileum into the portal vein 5 ; thus, the in vivo BA portal vein concentrations are dynamic and have been reported to increase >3-fold between fasting and postprandial states. 47 In addition, FFAs have been reported to sensitize hepatocytes to BA-induced cytotoxicity. 28 Lipid accumulation and cholestasis (e.g., BA accumulation) activate similar death pathways.6,28–31 This observation was evaluated in SCHH by determining the effect of CsA and Trog on hepatocyte viability across culture conditions with varying BA pool concentrations in the absence and presence of FFAs. Trog treatment increased the BA toxicity potency 1.4- to 2.7-fold greater than solvent control across two donors. In the presence of FFAs, BA toxicity potency was markedly increased ≥10 to 24-fold greater than solvent control across both donors following Trog exposure. In contrast, BA TC50 values were unchanged and only slightly reduced (≤30%) following CsA treatment in the absence and presence of FFAs, respectively. These results suggested that Trog but not CsA reduced cell viability in a BA-dependent manner, and FFAs dramatically increased the hepatocyte susceptibility to Trog induced BA-dependent toxicity. In FFA titration experiments, Trog treatment but not CsA reduced FFA TC50 values in BA-dependent manner consistent with observations from BA titration experiments.
Under these sensitization conditions (BA pool + FFA), exposure to Trog and DY268, a potent FXR antagonist, reduced BA-dependent increases of the FXR target genes, FGF19 (≥95%) and OSTβ (≥74%). In contrast, CsA treatment did not affect the BA-dependent increases observed in FGF19 and OSTβ mRNA content under the same conditions. Taken together, these results were consistent with previous results and confirmed that Trog and not CsA inhibits FXR activation.
ER stress leading to cell death has also been reported as a possible mechanism for BA-induced (e.g., cholestatic) hepatotoxicity.29,31 Blocking the BA homeostatic mechanism through inhibition of BSEP and FXR antagonism could increase ER stress initiating the programmed cell death cascades. Under sensitization conditions (BA pool + FFA), Trog but not CsA treatment significantly induced CHOP mRNA content, a key marker of ER stress and early initiator of cell death.29–31 Concomitant increases in LDH leakage were observed under sensitization conditions with Trog but not CsA treatment. These results suggested Trog but not CsA treatment in the presence of a BA pool and FFAs induced ER stress resulting in BA-induced (e.g., cholestatic) hepatocyte injury. BA ICC determinations (data not shown), normalized for ATP content, indicated that BAs increased ∼130% and ∼900% of solvent control in SCHH under sensitization conditions following exposure to CsA or Trog, respectively. Following exposure to a BSEP inhibitor (e.g., CsA), hepatocytes were able to compensate by increasing basolateral efflux to maintain a subtoxic ICC of BAs. However, in the case of a compound possessing both BSEP and FXR antagonist properties (e.g., Trog), the BA homeostatic mechanism was blocked and caused the ICC of BA to increase rapidly which led to cell death. These conclusions were consistent with substantial clinical evidence establishing a causal link between Trog exposure and DILI 20 and lack thereof with CsA therapy.
Under this new paradigm (Fig. 9), compounds that inhibit BSEP alone would not have a high potential for BA-induced hepatotoxicity. However, if those same compounds also antagonize FXR and prevent the hepatocyte from reducing ICC of BA, then those compounds would increase the potential for cholestatic (e.g., BA induced) hepatotoxicity. Guo et al. 48 linked increases in the mRNA of OSTα/β resulting from increased ICC of BA to increases in the basolateral clearance of BA. In the presence of increased ICC of BA, basolateral efflux clearance becomes a major elimination pathway. This suggests that inhibition of basolateral efflux clearance could be an additional mechanism for cholestatic hepatotoxicity. Inhibition of multiple efflux pathways (i.e., BSEP, OSTα/β, and MRP3/4) would increase the BA concentration inside the hepatocyte and, even if FXR is activated, still result in lethal concentrations of BAs. Recently, Malinen et al. demonstrated that Trog sulfate was an inhibitor of OSTα/β mediated transport of taurocholate uptake, perhaps providing another possible mechanism for Trog hepatotoxicity. 49
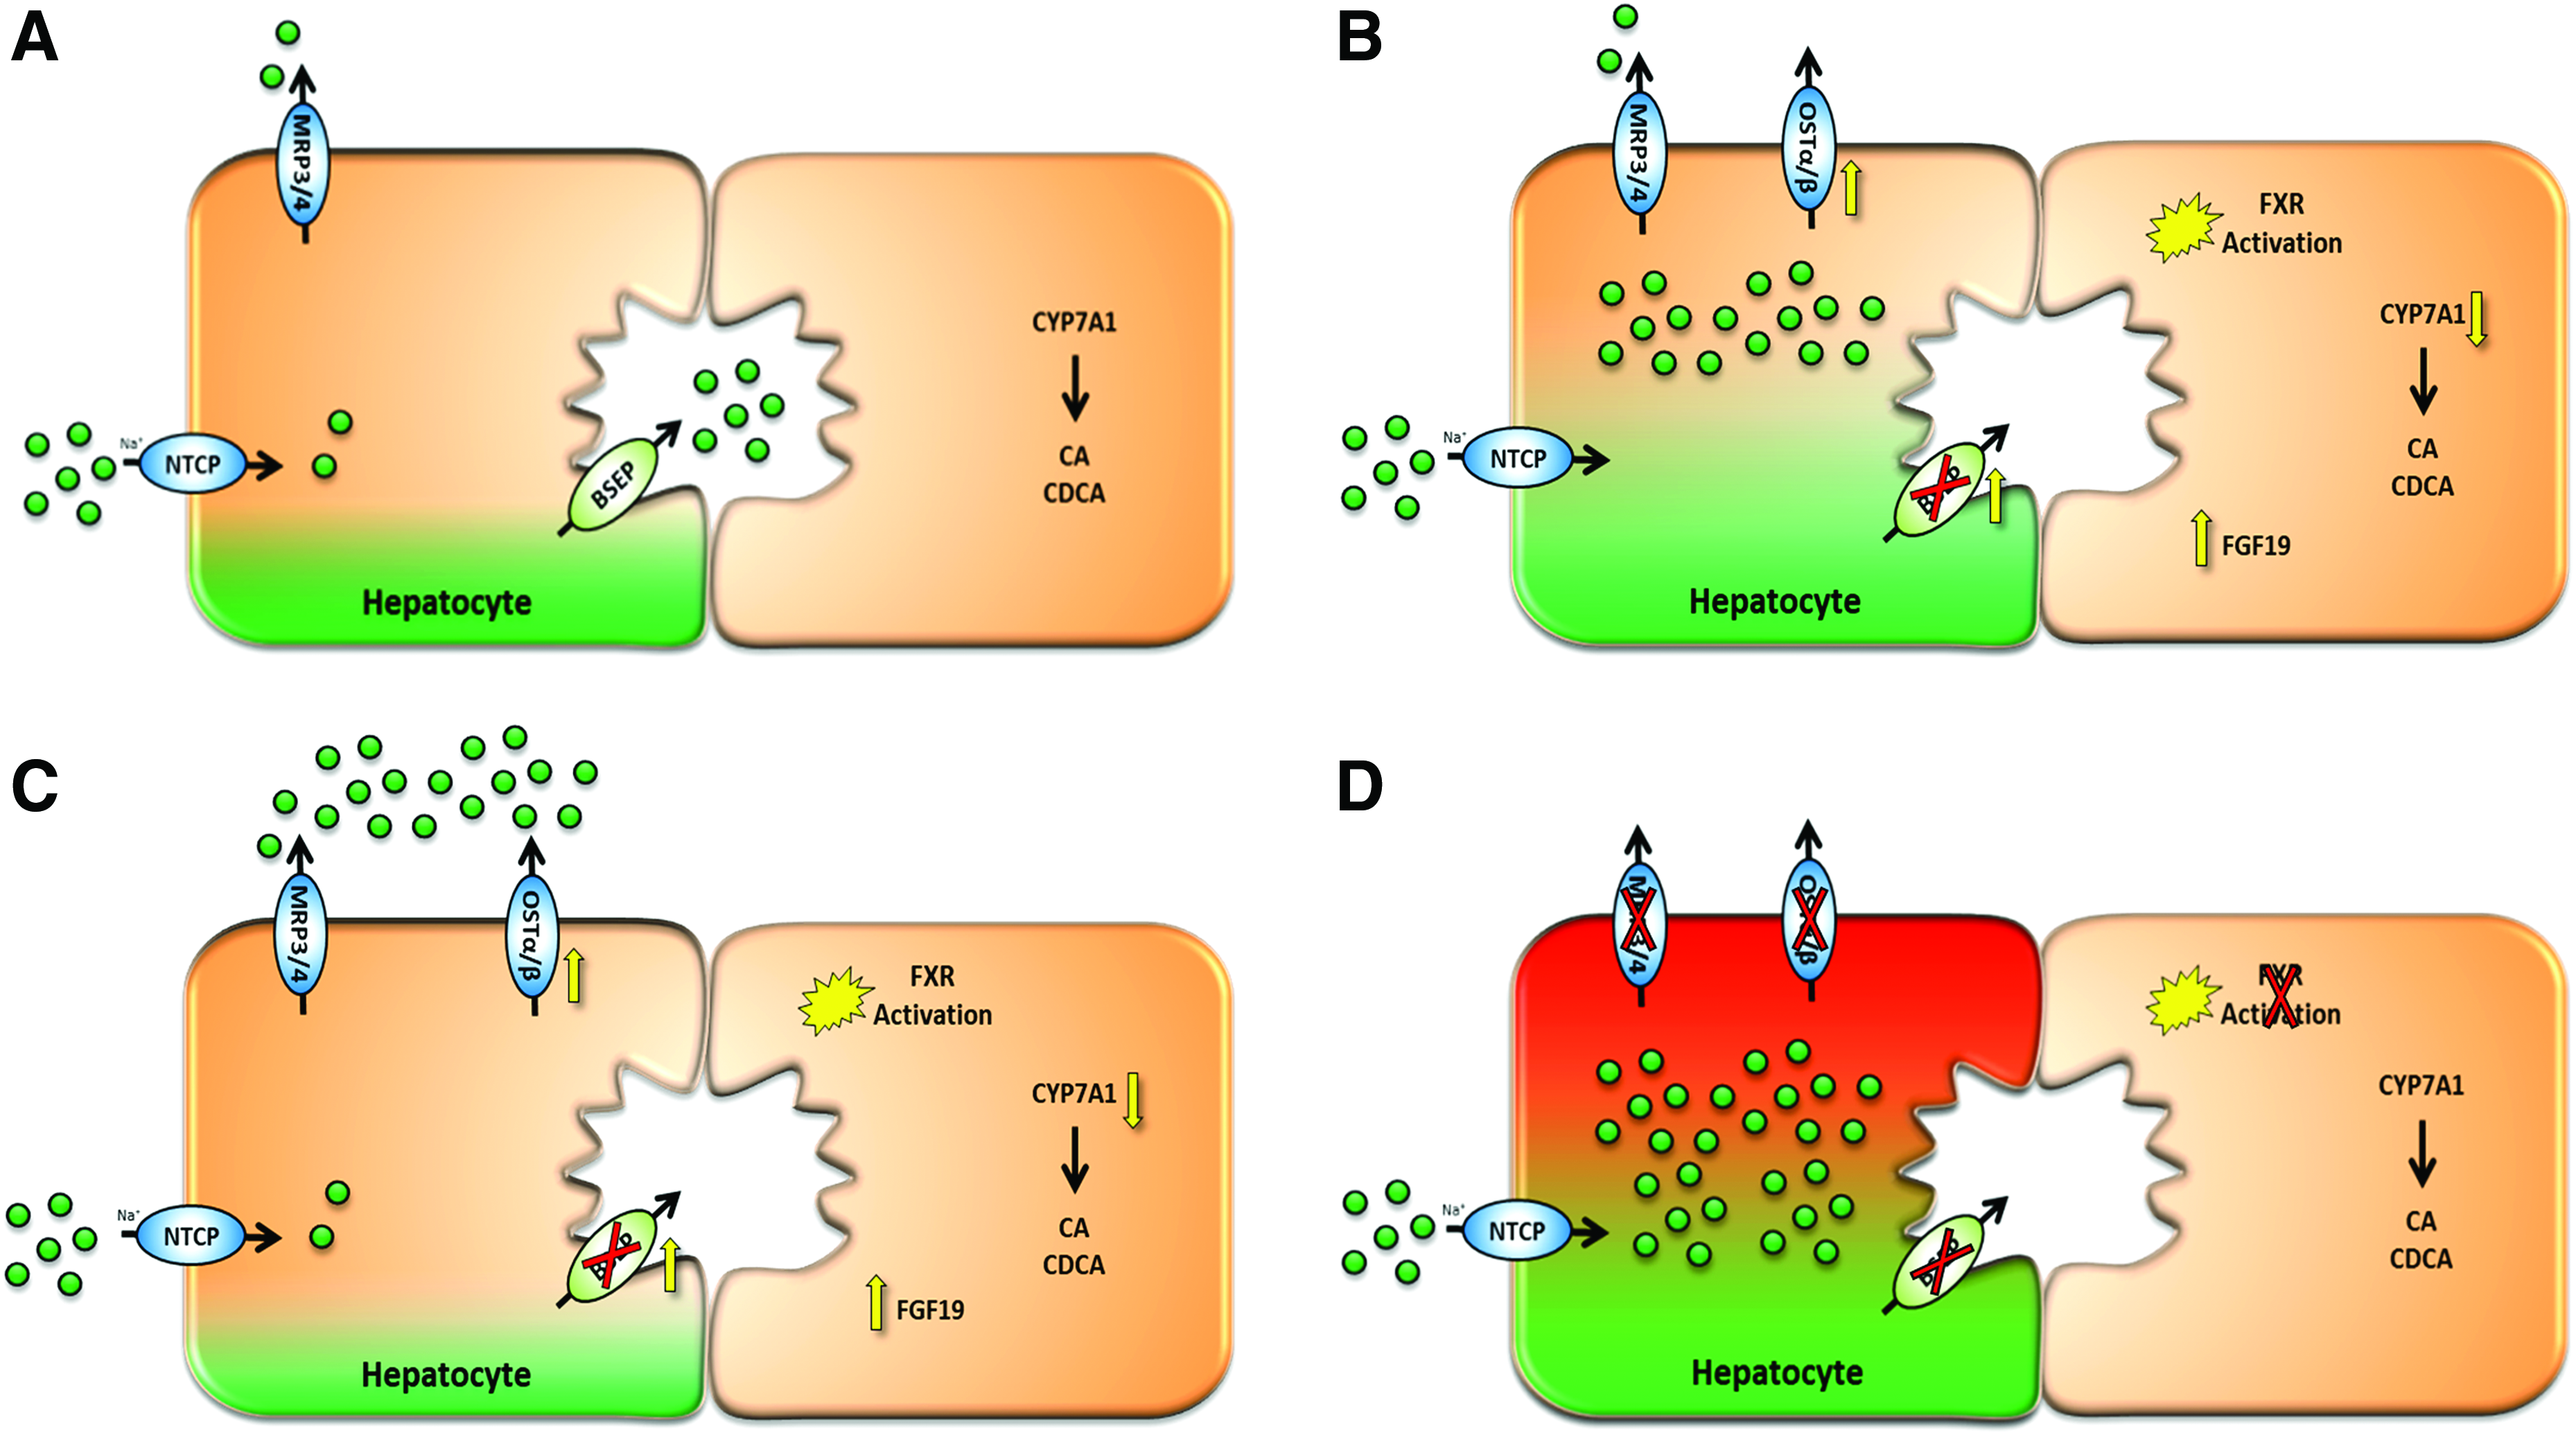
Bile acid basolateral efflux prevents cholestatic DILI. Basolateral efflux mechanism (OST) prevents cholestatic DILI.
Addition of FFAs in the presence of a BA pool improved the detection of BA-dependent hepatotoxicity by Trog exposure. These results support the reports linking lipid accumulation and BA-induced hepatocyte injury suggesting that certain human populations (e.g., nonalcoholic fatty liver disease) may be more at risk for BA-dependent DILI. 28
The hepatocyte compensatory mechanism helps to maintain appropriate BA ICC and plays an important role in protecting the hepatocyte from BA hepatotoxicity.5,14,15 This compensatory mechanism may explain the disconnect between in vitro BSEP inhibition potency determinations and accurate prediction of in vivo BA-dependent DILI incidence. In the present study, CsA and Trog were demonstrated to inhibit biliary efflux of BA; however, Trog also interfered with the hepatocyte's compensatory mechanism (FXR antagonism and inhibition of basolateral efflux clearance), resulting in hepatotoxicity which is consistent with clinical evidence of hepatocellular damage following Trog therapy. 20 Whole cell models that integrate multiple processes (inhibition, induction, and metabolism) could be extremely useful in not only assessing BSEP inhibition but also accurately predicting BA-dependent DILI.
Footnotes
Acknowledgments
The authors thank Dr. James McKim, Jr. for his assistance in the writing of this article. The laboratory research was funded by BioIVT.
Author Disclosure Statement
Jackson, Black, Freeman, St. Claire III, and Brouwer are employees of BioIVT. McKim is the founder of Iontox, LLC, Kalamazoo, MI and has nothing to disclose.