




Abstract
Introduction:
Coculture models have been extensively used for assessing the toxicity of fibers and particles. However, once cell lines are mixed in the same tissue culture well, it is difficult to evaluate differential cell toxicity without using specific cell markers, which might not be compatible with assays requiring living cells such as a particle-induced oxidative stress assay by flow cytometry.
Materials and Methods:
Human alveolar epithelial cells (A549) were specifically labeled with cell proliferation dye—eFluor™ 670—before being mixed with phorbol ester-differentiated Tohoku Hospital Pediatrics-1 cells (used as macrophages). The coculture model allowed the toxicity of crystalline silica DQ-12 and DQ-12-PVNO (particles were coated with polyvinylpyridine-N-oxide, a molecule used to quench particle surface reactivity) to be assessed. Particle-induced oxidative stress was evaluated by flow cytometry using a 2′,7′-dichlorodihydrofluorescein diacetate probe (H2DCFDA).
Results:
A549 cell treatment with a noncytotoxic concentration of an eFluor 670 probe allowed labeled and unlabeled cells to be differentiated using flow cytometry. Cellular oxidative stress induced by phorbol ester or DQ-12 detected by H2DCFDA was not affected by eFluor 670 probe cell treatment.
Conclusions:
This study showed that specific labeling of live cells before coculture setup allows assays such as oxidative stress assessment by flow cytometry to be conducted on different live cell types from the same coculture models without the use of cell-type-specific markers. Such assays would be of great value in any kind of multiple cell type model in which the effects of chemicals on a given cell population is sought.
Introduction
The assessment of the toxicological properties of inhaled fibers and particles, as well as nanomaterials, requires the use of cell cultures especially in the context of international ethical guidelines urging for the reduction, refinement, and replacement of animal experiments. 1
Many in vitro models have been used over time, from single cell line to more complex models. 2 The latter have been considered very suitable for studying mechanisms occurring in chemical-exposed tissues, since they can reproduce the interplay between different cell types present within the organ. Among these multicellular pulmonary models, we found epithelial cell and macrophage coculture models3–5 and even more complex models. 6
The determination of the performance of such in vitro models may require the use of reference materials such as crystalline silica (i.e., DQ-12). 7 Occupational exposure by inhalation to this material could induce a persistent inflammation associated with the engagement of granulocytes and macrophages. The inflammatory response to such particles as well as their intrinsic surface reactivity could lead to an overproduction of reactive oxygen species (ROS). Excess ROS could be responsible for lipid peroxidation and DNA damage leading to permanent cellular alterations and be involved in pulmonary silica-related diseases (i.e., silicosis and cancer).8,9 Furthermore, the investigation of ROS production induced by materials in target cells (such as epithelial cells) is of great importance for (nano)material toxicity testing.
Contrary to single-cell models, it is difficult to assess the toxicity of chemicals in only one cell type of the coculture models, unless cells are cultivated in two compartments separated by a microporous membrane. 10 However, in this setup, the different cell types are not in close contact with each other, which decreases cellular interaction and possibly hinders the effects. It is, therefore, necessary to find ways of separating the different cell types.
In this study, we describe a method to label living A549 epithelial cells cultivated in a coculture model with Tohoku Hospital Pediatrics-1 cells (THP-1) derived macrophages to assess ROS production in this epithelial cell type.
Materials and Methods
This study did not require any Institutional Review Board nor Animal Ethics Committee approval.
Cell culture
The cell lines were obtained from ATCC (Manassas, VA, USA): the human lung adenocarcinoma epithelial cell line A549, #CCL-185 and the human monocytic leukemia cell line THP-1, #TIB 202. A549 cells were maintained in Dulbecco's modified eagle medium (DMEM) glutaMAX (#P04-03588; Pan Biotech) (stable glutamine 6 mM) without phenol red and with 10% decomplemented fetal bovine serum (FBS; #P113103; Pan Biotech), 50 U/mL penicillin, and 50 μg/mL streptomycin (#11528876; Gibco). Cells were passaged using a 0.25% trypsin-EDTA solution (#11560626; Gibco). THP-1 cells were cultured in Roswell Park Memorial Institute 1640 without phenol red (#P04-16520; Pan Biotech) with 3 mM stable glutamine, 1 mM HEPES (#11550496; Gibco), 1 mM sodium pyruvate (#11530396; Gibco), 10% decomplemented FBS, 50 U/mL penicillin, and 50 μg/mL streptomycin. THP-1 cells were differentiated into macrophages after 24 hours of treatment with 200 nM of Phorbol 12-myristate 13-acetate (PMA). Analyses of THP-1 cell differentiation are presented in Supplementary Data S1 (Supplementary Fig. S1). The two cell lines were maintained at 37°C in a humidified atmosphere containing 5% CO2.
Labeling of A549 cells
Cells were labeled with a cell proliferation dye, eFluor™ 670 (#65-0840; eBioscience™), which binds to amino group in proteins. According to the manufacturer, when cells divide, the dye is shared equally in daughter cells and labeled cells could be used up to six generations or at least for 3 days. A549 cells were harvested, counted with a propidium iodide and acridine orange solution, using an automatic cell counter Cellometer (Nexcelom Bioscience LLC, Lawrence, MA, USA) sampled and centrifuged for 5 minutes at 400 g. To remove any serum, the cell pellets were washed twice with 10 mL sterile phosphate-buffered saline (PBS) and centrifuged for 5 minutes at 400 g. The cells were suspended in PBS at a final concentration of 5.106 cells/mL. While vortexing cells, an equal volume of the dye solution prepared in PBS (final concentrations ranging from 0.5 to 5 μM) was added. The cell suspension was incubated for 10 minutes at 37°C in the dark and the labeling was stopped by adding four volumes of cold complete medium and then incubated on ice for 5 minutes. The cells were washed three times with complete medium and centrifuged for 5 minutes at 400 g. The cell pellets were suspended in complete DMEM with only 1% FBS and seeded into six-well culture plates.
After 48 hours of culture, the supernatant and the labeled cells were harvested. Cell viability was assessed on supernatant using the LDH Cytotoxicity Assay Kit (#11644793001; Roche) according to the manufacturer's instructions. Cell fluorescence and cell morphology were evaluated using flow cytometry (BD Accuri™ C6). Cells were washed with 2 mL PBS 1 × , detached from the support with Trypsin for 5 minutes at 37°C, the trypsin activity was stopped with complete DMEM and cells were harvested by centrifugation 5 minutes at 800 g. After suspension of the cells in 0.5 mL of PBS 1 × , 10,000 events were recorded in the gate without cell debris. We gated eFluor-positive cells on forward scatter (FSC) and eFluor profile and we analyzed ROS production on these cells.
Coculture and treatment
A549 cells were labeled with eFluor 670 the day before the addition of the other cell lines for the coculture. Based on the literature, 11 the pulmonary ratio of epithelial cells and macrophages is 5:1, so we maintained the same proportion for the two A549 and THP-1 cell lines. THP-1 cells were added to A549 cell culture just before the treatment with particles.
A549 cells, alone or in coculture with THP-1 cells, were treated with crystalline silica DQ-12 or DQ-12 coated with polyvinylpyridine-N-oxide (DQ-12-PVNO) 50 and 100 μg/cm2 for 24 hours without FBS or phenol red. Polyvinylpyridine-N-oxide (PVNO) was used to inactivate the surface reactivity of DQ-12. 9 A DQ-12 solution (# DMT GmbH & Co. KG, Germany) at 5 mg/mL in water or in 1% PVNO (#01564; Polysciences) was sonicated then mixed using agitation at 1000 rpm for 5 hours. Solutions were centrifuged at 12,000 g for 5 minutes, rinsed three times with ultrapure water, aliquoted and dried at 37°C until complete evaporation of the water. The amount of PVNO adsorbed on DQ-12 was 6.8 ± 0.2 μg/mg of silica.
ROS detection assay
A cell-permeant 2′,7′-dichlorodihydrofluorescein diacetate probe (H2DCFDA) (#D399; Molecular Probes™), a nonfluorescent probe that crosses cell membranes, is commonly used to assess oxidative stress. As it passes through the cell membrane, the acetate groups are cleaved by intracellular esterases providing H2DCF. The latter is trapped in the cells and oxidized by intracellular ROS to form a green fluorescent product: the 2′,7′-dichlorofluorescein (DCF). This molecule has a maximum excitation wavelength of between 492 and 495 nm and a maximum emission wavelength of between 517 and 527 nm. This probe was used as a marker of intracellular ROS in A549 cells. Cells were incubated with 10 μM of H2DCFDA for 30 minutes at 37°C, then isolated under the action of trypsin and taken up in a volume of PBS, followed by flow cytometry analysis on the gate of eFluor 670-positive cells (BD Accuri C6). As a positive control for the induction of ROS production in A549 cells, cells were treated with 2 μM PMA for 24 hours without FBS or phenol red.
Results
The development of the specific labeling of A549 cells in coculture and its suitability for cellular assays required the validation of several parameters, including the labeling of A549 cells with eFluor 670 and the use of an assay, which required the use of live cells (here the detection of ROS production by flow cytometry using DCFDA probe).
A549 cell labeling with eFluor 670
We performed an A549 cell labeling with concentrations of eFluor 670 ranging from 0.5 to 5 μM and conducted an lactate dehydrogenase cytotoxicity assay to determine the eFluor 670-induced cytotoxicity. In Figure 1A, a dose-dependent increase in fluorescence was observed from the lowest concentration tested, that is, 0.5 μM. The flow cytometry profiles illustrate the varying peaks between unlabeled and labeled cells. In addition, results presented in Figure 1B show that the cytotoxicity did not exceed 8%, and that none of the eFluor 670 concentrations tested were cytotoxic for the A549 cells. Therefore, we decided to label the A549 cells with 0.5 μM eFluor 670, which was sufficient to detect cells allowing the isolation of the A549 cell population without induction of cytotoxicity.

eFluor™ 670 labeling of A549 cells. A549 cells were labeled by increasing concentrations of eFluor 670 (0.5–5 μM) and cultured for 48 hours.
The cell proliferation dye eFluor 670 does not modulate ROS production
A549 cells were treated for 24 hours with 2 μM PMA, then 10 μM of H2DCFDA was added for 30 minutes before flow cytometry analysis. We observed an increase in intracellular ROS level in labeled and unlabeled A549 cells induced by PMA treatment (Fig. 2). Indeed, a 28-fold increase in fluorescence intensity was observed after PMA treatment in unlabeled cells. In eFluor 670 labeled cells, PMA treatment induced an ROS production, which is 31 times greater than that produced by untreated cells.
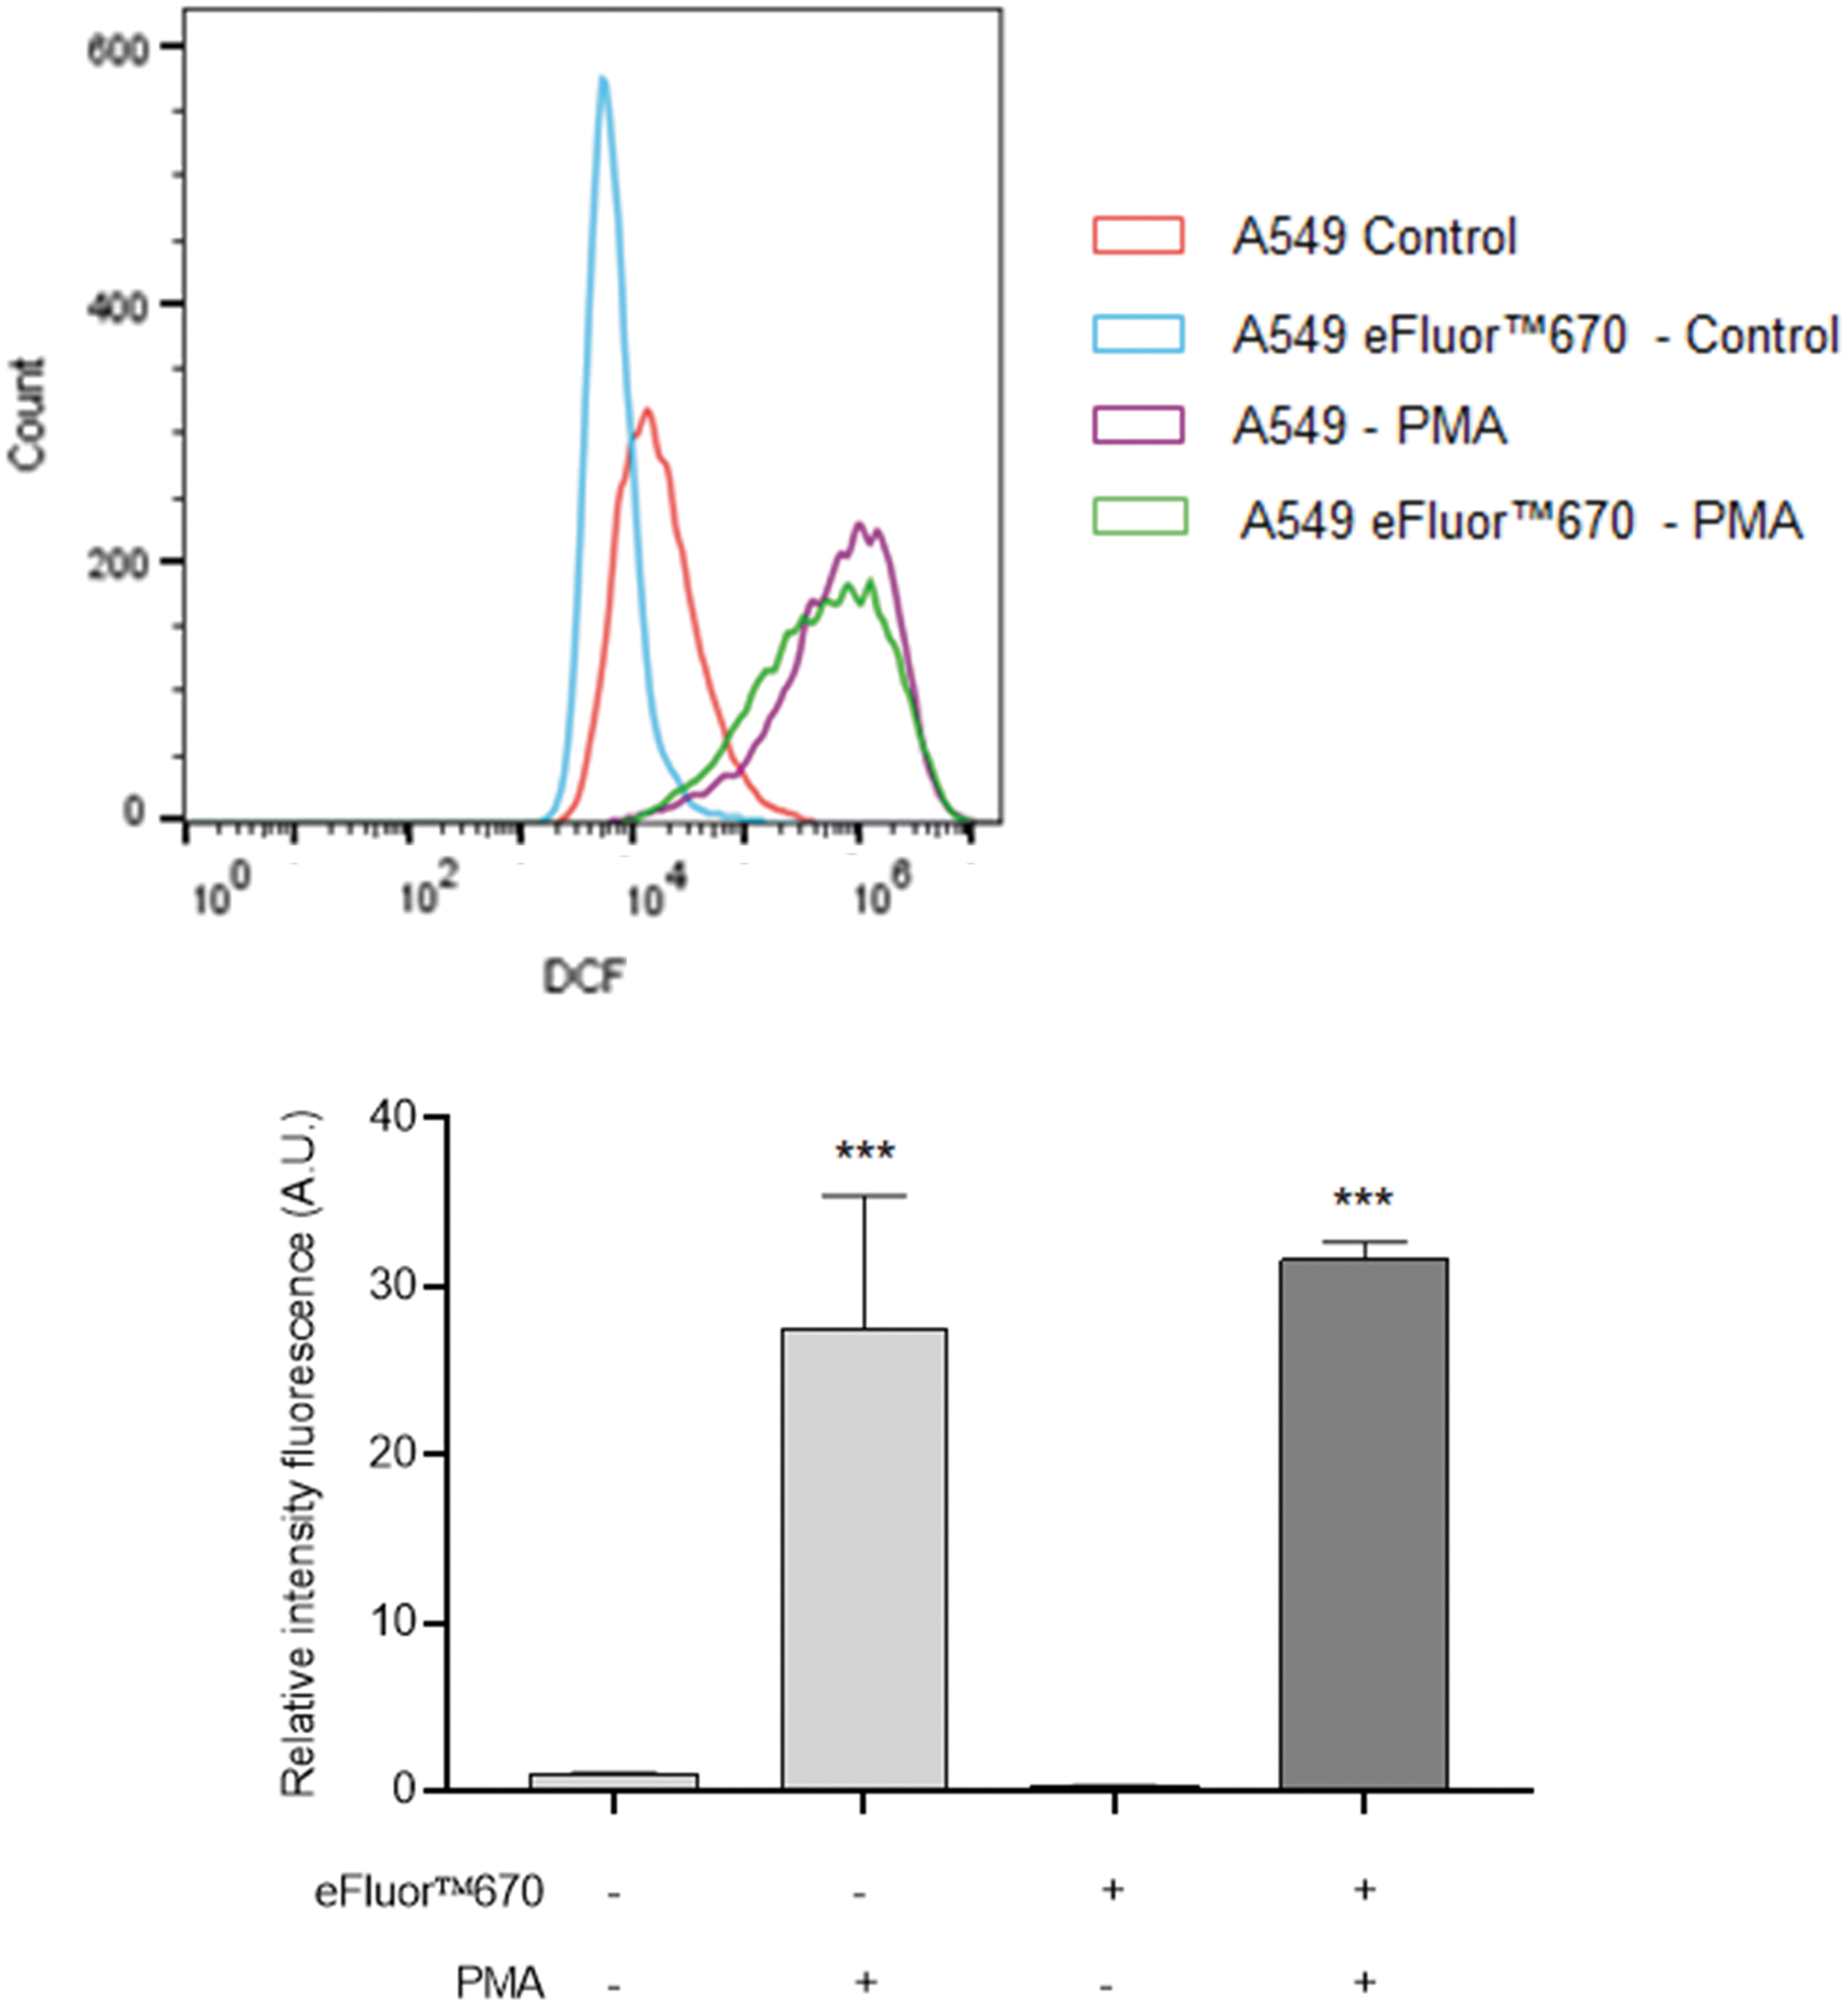
Effect of the eFluor™ 670 on ROS level. Labeled or unlabeled A549 cells with eFluor 670 were treated with 2 μM PMA for 24 hours. Fluorescence intensity of the DCF probe was analyzed using flow cytometry on the gate of eFluor 670 positive cells. Histograms represent the mean ± standard deviation of three independent experiments; flow cytometry histograms are representative of three independent experiments. ***p < 0.001 significantly different from the control. DCF, 2′,7′-dichlorofluorescein; PMA, phorbol 12-myristate 13-acetate; ROS, reactive oxygen species.
The cell proliferation dye eFluor 670 separates A549 cells from THP-1 and particles
When untreated A549 and THP-1 cells were analyzed using flow cytometry, the FSC-SSC plot did not allow the separation of the two cell types (Fig. 3A). However, when eFluor 670 was used, nonfluorescent THP-1 and labeled A549 cells could be gated separately based on FSC::eFluor flowchart (Fig. 3B). The treatment of A549 with DQ-12 led to a modification of the FSC and SSC plot due to either particle positive cells or the particles themselves (Fig. 3B). The inactive particle DQ-12-PVNO also modified the FSC of A459 cells (Supplementary Fig. S2). The use of eFluor 670 allowed A549 labeled cells to be differentiated from particles. Similarly, in the context of coculture, eFluor 670 labeled cells were easily separated from particles and THP-1 cells (Fig. 3C).

Merged representative flow cytometry charts of ROS detection in eFluor 670 labeled and unlabeled A549 cells exposed to DQ-12.
Treatment with DQ-12 induced ROS production in A549 cells
Labeled A549 cells were treated for 24 hours with 50 or 100 μg/cm2 of DQ-12 or DQ-12-PVNO, and we studied the fluorescence intensity of the DCF probe using flow cytometry. We observed that DQ-12 treatment increased ROS production in labeled A549 cells, with a 2.5% and 3.9% increase after treatment with 50 and 100 μg/cm2, respectively (Fig. 4). Treatment of A549 cells with 50 and 100 μg/cm2 of DQ-12-PVNO, an inactivated particle, did not lead to an increase in ROS production.

ROS production in A549 labeled cells exposed to DQ-12 in a coculture model. A549 cells, previously labeled with eFluor™ 670, were monocultured or cocultured with differentiated THP-1 cells. The cells were treated with DQ-12 and DQ-12-PVNO at 50 or 100 μg/cm2 for 24 hours and the ROS production was analyzed using flow cytometry on the gate of eFluor 670 positive cells. Histograms represent the mean ± standard deviation of three independent experiments; flow cytometry histograms (count and DCF) are representative of three independent experiments. *p < 0.05, **p < 0.01, ***p < 0.001 significantly different from the control. PVNO, polyvinylpyridine-N-oxide; DQ-12-PVNO, DQ-12 coated with polyvinylpyridine-N-oxide.
We then used a coculture model to compare the effect of DQ-12 and DQ-12-PVNO treatment on the production of ROS by A549 cells when these cells were cocultured with THP-1 cells. In the presence of THP-1 cells, the basal level was higher than that in a monoculture model (17.8-fold) and the treatment with DQ-12 did not induce ROS production. However, the DQ-12-PVNO treatment decreased the level in intracellular ROS (2.3-fold with 100 μg/cm2).
Discussion
The assessment of the toxicological properties of chemicals specifically in one cell type in the context of coculture models is not an easy task, especially in living cells. We describe in this study a method involving the labeling of one cell type, and its monitoring during flow cytometry assays.
In coculture models with epithelial cells and macrophages, it is possible to use dedicated antibodies, which recognize surface proteins only expressed by each cell type (i.e., CD11b and CD11c for macrophages or EpCAM and pan-cytokeratin for epithelial cells 12 ). However, such labeling techniques may require cell fixation and permeabilization and take a few hours before cell analysis using flow cytometry. Such an approach is not compatible for assessing ROS production using a fluorescent probe such as DCF.13,14 For this kind of measurement, cells need to be analyzed quickly after harvest, limiting the possibility of postcollection labeling. One way to achieve live cell labeling is to use amine reactive probes, which bind to cell proteins. One of them is the 5-(and-6)-carboxyfluorescein diacetate succinimidyl ester (CFSE), which has been used to study lymphocyte proliferation. 15 Unfortunately, this nontoxic fluorescent molecule has excitation and emission wavelengths similar to those of DCF (i.e., λex: 492 nm and λem: 517 nm). One molecule from the same family as CFSE, called cell proliferation dye eFluor 670, has a totally different fluorescence spectrum (λex: 633 nm and λem: 670 nm), which makes it more suitable for dual labeling with DCF. As we demonstrate through this study, this cell-staining molecule is not cytotoxic and can be used at a very low concentration (0.5 μM) to label cells. One may argue that macrophages and epithelial cells have different shapes and sizes, physical characteristics that can be used to separate them during flow cytometry analysis using the side scatter (SSC) and the FSC. However, in our experiment, we were unable to separate the two cell types with only an FSC-SSC plot. In addition, once treated with (nano)materials, the SSC/FSC characteristics evolve due to cell–particle interactions making it impossible to differentiate the different cell types. 16
As aforementioned, ROS can be detected using flow cytometry,8,17 classical or confocal microscopy,18,19 or fluorimetry 20 using nonfluorescent probes such as H2DCF, which once oxidized by ROS become fluorescent. 13 ROS are derivatives of oxygen, whose electrons are in an excited energetic state, which gives them great reactivity. These are a set of molecules including the superoxide radical (O2−), hydrogen peroxide (H2O2), the hydroxyl radical (OH−), nitrogen monoxide (NO), and peroxynitrite (ONOO−).13,21,22 An imbalance caused by a high production of intracellular ROS and/or a decrease in antioxidant enzymes (e.g., superoxide dismutase and catalase) is called oxidative stress. It can cause alterations in the functional properties of the cell and in particular a possible alteration of their genetic material.
As shown in this study, crystalline silica (DQ-12), known to produce hydroxyl radicals (OH−) and to possesses inflammatory and genotoxic properties, 22 can increase the level of cellular ROS and consequently the intensity of fluorescence after H2DCF conversion. When DQ-12 is coated with PVNO, 9 its surface reactivity is modified, which leads to a decrease in particle uptake and ability to induce ROS. In this study, we also observed that the pretreatment of A549 cells with eFluor 670 did not modify the increased level of DCF fluorescence intensity induced by DQ-12 treatment or PMA. These results suggest that this probe does not affect the cells' capability to produce ROS or to interact with DCF.
When macrophages and A549 are cocultivated together, the basal level of ROS in epithelial cells is highly elevated compared with the one noted in monocultured cells. The activation of epithelial signal transduction pathways by molecules such as cytokines excreted by macrophages could be responsible for the production of ROS.23,24 Therefore, we speculate that the induction of ROS in epithelial cells in this coculture model could be, at least in part, due to the presence of macrophages and probably a cellular stress induced by these cells. Finally, this high background in the coculture model might mask the ROS production effect of silica on A549.
Conclusion
Through this study, we developed a convenient approach to label a given cell type in the context of coculture to specifically monitor the effect of xenobiotic treatment on them. Apart from ROS detection, this method could be used for other flow cytometry assays requiring the separation of different cell populations without using antibodies against the membrane markers of specific cell types.
Footnotes
Acknowledgments
We would like to thank Aurélie Remy for the statistical analysis and Christian Darne for the fruitful discussions.
Author Disclosure Statement
No competing financial interests exist.
Funding Information
This study was funded by the National Fund for the Prevention of Occupational Accidents and Diseases.

References
Supplementary Material
Please find the following supplemental material available below.
For Open Access articles published under a Creative Commons License, all supplemental material carries the same license as the article it is associated with.
For non-Open Access articles published, all supplemental material carries a non-exclusive license, and permission requests for re-use of supplemental material or any part of supplemental material shall be sent directly to the copyright owner as specified in the copyright notice associated with the article.
