




Abstract
Introduction:
Risk management and mitigation of new drug candidates that induce drug-induced liver injury (DILI) in the clinic is a pivotal task to protect patients and save money during the drug development process. Nevertheless, clinical DILI risk assessment with conventionally available liver biomarkers comes with high failure rates. MicroRNAs (miRNAs) are short noncoding RNA molecules known to regulate mRNA expression. Actively secreted miRNAs which are circulating in patient blood can provide important pathway information involving specific DILI-inducing mechanisms and, therefore, have potential as early diagnostic biomarkers.
Materials and Methods:
In this study, the exosomal miRNA response of human primary hepatic spheroids treated with toxic concentrations of Chlorpromazine for 3 or 8 days was analyzed. The miRNA response of the hepatic spheroids was analyzed by quantifying a total of 752 miRNAs in the culture medium by quantitative polymerase chain reaction.
Results:
Clustering and pathway enrichment analysis of the miRNA response revealed several differentially expressed miRNAs involved in the regulation of signaling pathways that are toxicologically relevant, including apoptosis. This exosomal miRNA response was validated by a caspase 3/7 activity assay which confirmed an induction of apoptosis in hepatic spheroids treated with Chlorpromazine.
Conclusion:
Our results suggest that human hepatic spheroids are a promising test system for the discovery of secreted miRNA signatures. This could become a novel tool for discovery of human in vivo relevant compound-specific DILI biomarkers, inducing understanding mechanisms. In addition, miRNA biomarkers which can be monitored directly in the patient blood can become valuable tools to assist clinicians in risk management.
Introduction
Safety risk assessment of new drug candidates that cause drug-induced liver injury (DILI) in preclinical animal species and the translation to patients is challenging. Often DILI in animals and humans is qualitatively and quantitatively different. The reasons for this discrepancy include, among others, the different immune system of animals and human which makes it very difficult to make a correct assessment, especially in the case of the more human-specific drug modalities. Another hurdle is that the translation is made from healthy animals to diseased human patients. These observations clearly challenge the current toxicity paradigm and suggest that human derived in vitro test systems can better mimic the drug specific pathophysiological situation for patients and therefore be a useful complement to current in vivo animal models.
A preclinically tested drug candidate that induces DILI can make it into the clinic if a sufficient safety margin or therapeutic index between pharmacological and toxicological dosages is defined. Nevertheless, serum biomarkers are required as accompanying diagnostic tools for the duration of the drug therapy to monitor and alert for potential unwanted side effects. In the case of DILI, the classical clinical biomarkers alanine transaminase (ALT), aspartate transaminase (AST), gamma-glutamyl transferase, alkaline phosphatase, and Bilirubin are regularly used. While acute liver failure can be prevented by Hy's law rule of thumb, stopping fatal liver failure when the ALT upper limit of normal (ULN) is exceeding by factor of 3 and Bilirubin with an ULN of 2, DILI appearing after chronic treatment is not very well addressed by the current DILI biomarkers. Moreover, discordant ALT liver signals have been reported in cases where no liver damage was observed. In other cases, asymptomatic ALT signals occurring during chronic treatment or idiosyncratic DILI signals, which per definition were not observed in animal studies, can occur in rare cases post drug launch. These cases clearly indicate a need for more human-specific biomarkers that can be easily monitored in the clinic and with a higher specificity for predicting DILI for an improved risk management.
MicroRNAs (miRNAs) are a promising new class of biomarkers which have high potential for being more specific and sensitive in the diagnosis and monitoring of DILI. miRNAs are short single stranded noncoding RNA molecules with an average size of 22 nucleotides that mediate post-transcriptional regulation and gene silencing by targeting 3´ untranslated region of mRNA transcripts. One single miRNA can regulate more than a hundred mRNA transcripts, and each mRNA transcript can be regulated by several miRNAs. 1 Most of the transcriptome is predicted to be targeted by miRNAs so they are proposed to be involved in the regulation of all fundamental cellular processes and have already been shown to be involved in the regulation of apoptosis, proliferation, and differentiation. 2 Extracellular miRNAs are circulating in multiple body fluids, including blood in cell-derived membrane vesicles or as protein-miRNA complexes. The vesicle-bound miRNAs can furthermore be divided into exosomal and microvesicular miRNAs. Exosomal miRNAs are actively secreted by cells and mediate intercellular communication. 3 After binding to protein complexes and packaging in vesicles, such as exosomes, microvesicles, or apoptotic bodies, miRNAs are protected from nuclease degradation and are very stable in bio fluids. 4 Both the vesicle-bound and the leaked miRNAs have been proposed as promising biomarkers for noninvasive liquid biopsies although for different purposes, where leakage of miRNAs is considered as a marker indicating cell damage. To investigate the value of miRNAs as biomarkers, two main approaches can be taken. Either the total miRNA pool can be extracted from the liquid biopsy or a more precise approach can be applied to isolate vesicle-bound miRNAs exclusively, either by ultracentrifugation or with the use of membrane affinity spin columns. By the inclusion of a prefiltration step of 0.8 μm, before the extraction process, the purity of the sample can be further improved and larger particles, such as apoptotic bodies and cell fractions, can be excluded, resulting mainly in the actively secreted exosomal and microvesicle-bound miRNAs for subsequent expression analysis.
In recent years, many studies, especially in the area of cancer progression and diagnosis, have investigated the potential of circulating miRNAs as biomarkers. For example, miR-200c has been proposed as a promising prognostic biomarker for gastric cancer using serum samples of cancer patients, and miR let-7g has been demonstrated to act as tumor suppressor and predictive biomarker for chemoresistance in human epithelial ovarian cancer.5,6 In addition, several miRNAs are specifically enriched in the liver, and their presence in the blood has been linked to liver injury. For instance, miR-194 and miR-192 are enriched in hepatocytes, and miR-29 is specific to hepatic stellate cells.7,8 Moreover, miR-122, with 100,000-times higher expression in the liver compared to other tissues, is a well-accepted liver-specific miRNAs and has been extensively investigated as a potential biomarker for liver injury. Patients treated with Acetaminophen (N-acetyl-p-aminophenol; APAP) overdose were reported to have increased plasma levels of miR-122. 9 In addition to elevated levels of miR-122, Starkey Lewis and team reported significant serological elevation of miR-192 in patients with APAP-induced acute liver injury. 9 Similar findings were reported in mice, in which the serological levels of both miR-122 and miR-192 were found to be elevated in a time- and dose-dependent manner following exposure to toxic concentrations of APAP. 10 Interestingly, these changes were detected shortly after APAP overdose and before serum ALT elevations, suggesting miR-122 (and miR-192) to be an earlier biomarker than ALT in evaluating liver injury.10,11 This prompted several miRNA profiling studies to be conducted in the context of drug discovery and safety testing. In a study by Ward et al. the use of circulating miRNAs as biomarkers for APAP toxicity was investigated. 12 Serologic miRNA levels were analyzed in patients with APAP overdose and compared with the levels of the specific miRNAs after administration of N-acetylcysteine (NAC, an antidote for APAP poisoning). A panel of 11 acetaminophen toxicity-specific miRNAs was identified which not only distinguished APAP toxicity but also differentiated APAP toxicity from ischemic hepatitis. Interestingly, the elevation of these miRNA markers decreased to normal levels for most patients upon NAC treatment. 12 Similar hepatotoxicity-specific miRNA releases have been reported in rats. 13 In the study conducted in rat, exposure to APAP or carbon tetrachloride resulted in altered expression of various miRNAs, including a decrease in miR-298 and miR-370, which are known to regulate important oxidative stress-related genes. Altogether, numerous studies reported that drug treatment was affecting circulating miRNA levels. 2 The identification of novel miRNA biomarkers and the development of miRNA profiling for drug discovery and safety testing could advance the use of miRNA biomarkers in noninvasive liquid biopsy for personalized medicine and drug safety assessment. 12
Chlorpromazine was a broadly used antipsychotic medication but reported cases of DILI have limited its use. Chlorpromazine is known to be intrinsically cytotoxic to hepatocytes, and its effect is aggravated by an innate immune response (e.g., pretreatment with LPS in rats or in vitro hepatocytes).14–16 Moreover, Chlorpromazine has been reported to cause clinically relevant acute and chronic cholestatic liver injury, as well as biliary cirrhosis. 17 Although Chlorpromazine is a well-studied drug, the exact mechanism of Chlorpromazine's hepatotoxicity is not fully understood yet. Its research is hampered by species differences. For example, differences in bile acid composition and their secretion pattern restrict the possibility for investigation of cholestatic potential of a drug in an animal model. 18
Despite these limitations, animal models are extensively used in preclinical safety assessment due to the lack of efficient alternatives. Consequently, the use of human in vitro models as a potential alternative to animal models for safety assessment has increased in popularity in the last decade. Three-dimensional (3D) cultures of primary human hepatocytes, cocultured with nonparenchymal liver cells as spheroids (from now on referred to as hepatic spheroids), recapitulate essential features of a physiological liver. 19 While hepatocytes in planar cultures lose their functionality over time, hepatocytes in hepatic spheroids maintain their natural function, such as albumin secretion and stable cytochrome P450 for up to 5 weeks. 19 Moreover, hepatic spheroids were reported to be viable, with stable adenosine triphosphate (ATP) content for at least 35 days, 19 which is much longer than planar primary hepatocyte cultures (48 hours) and primary hepatocyte sandwich cultures (2 weeks).19–21 Primary hepatic spheroids have additionally been demonstrated to predict the hepatotoxicity of drugs with a twice higher sensitivity than planar primary hepatocyte cultures, showing the great utility of liver spheroids for drug safety assessment. 22
In this study, the exosomal miRNA response of hepatic spheroids to toxic concentrations of Chlorpromazine was analyzed. Chlorpromazine was administered to hepatic spheroids for 3 or 8 days. After extraction of exosomes from the cell culture supernatant, levels of 752 miRNAs secreted into the culture medium were quantified by quantitative polymerase chain reaction (qPCR) using locked nucleic acid probes. Subsequently, the exosomal miRNA response of the hepatic spheroids after Chlorpromazine treatment was analyzed by clustering and pathway enrichment, which revealed several differentially expressed miRNAs involved in the regulation of toxicologically relevant signaling pathways, including apoptosis. The miRNA expression profiling results were validated by a caspase 3/7 activity assay that confirmed the induction of apoptosis in hepatic spheroids by cytotoxic concentrations of Chlorpromazine.
Materials and Methods
Hepatic spheroid and cell culture
The hepatic spheroids used in this study were “3D InSight™ Liver Spheroid Model” (InSphero AG, Switzerland), which is a 3D coculture of primary human hepatocytes and a crude primary human nonparenchymal liver cell fraction. The nonparenchymal liver cell fraction includes CD68-positive cells (Kupffer cells) and CD31-positive cells (endothelial cells). The hepatocyte cell fraction is composed of pooled hepatocytes from 10 human liver donors. The hepatic spheroids were cultured in “3D InSight™ Human Liver Microtissue Medium—TOX” (InSphero AG), which is a fully-chemically defined bovine serum albumin-free cell culture medium. Chlorpromazine was applied twice during the 8-day treatment (day 0 and 3) and once for the shorter 3-day treatment (on day 0). Cell culture supernatant samples were collected before medium exchange. In brief, on day 3 cell culture medium was aspirated from the well, and one equal volume (70 μL) of fresh cell culture medium with compound was added to each well. The aspirated cell culture supernatant was collected and stored at −80°C in dedicated storage buffer for downstream analysis (lactate dehydrogenase [LDH] and apoptosis assay).
Viability assay
The hepatic spheroids were treated with 0.1, 1, 4, 7, 15, 30, and 100 μM of Chlorpromazine (T1384; Targetmol) and corresponding vehicle control (0.5% (v/v) dimethylsulfoxide [DMSO]) over 3 and 8 days. The DMSO concentration in the compound treated samples was normalized to 0.5% DMSO. Chlorpromazine was applied on days 0 and redosing on day 3 for the longer compound treatment. At the end of the treatment the hepatic spheroids were lysed, and the cytotoxicity of the compound was assessed by measuring changes in ATP concentration. The ATP levels were measured for each condition using RealTime-Glo MT Cell Viability Assay (Promega, Switzerland), following the protocol of the manufacturer. Luminescence was determined on 750a Tecan SPARK™ 10 M plate reader, and the data were normalized to vehicle (DMSO) treated wells. Cell viability of the Chlorpromazine-treated samples is expressed as a percentage of the vehicle control with the standard deviation between four hepatic spheroids. The IC50, 95% confidence interval (95% CI), and the Hill Slope values are calculated in GraphPad Prism® (Version 9) software using a nonlinear regression sigmoidal dose–response (variable slope) curve fitting with bottom constrained to a constant value of 0.
LDH leakage assay
The loss of cell plasma membrane integrity was assessed by measurements of extracellular LDH (Lactate dehydrogenase) release into the supernatant with LDH-Glo™ Cytotoxicity Assay (Promega). Briefly, Chlorpromazine was dosed at two concentrations (15 and 30 μM) on days 0 and redosed on day 3 for the 8-day treatment. Cell culture supernatants were collected from the spheroid containing culture plates on days 3 and 8. The two concentrations were selected based on the cellular ATP curve and the IC50 value following a 3-day long Chlorpromazine treatment (Fig. 1A). One toxic (15 μM, close to Chlorpromazine IC50 value) and a full toxic (30 μM) compound concentration were selected. The concentrations were aligned for the longer 8-day treatment. The samples from day 3 (day 0–3) and day 8 (day 3–8) were collected from the same hepatic spheroid by repeated sampling of the cell culture supernatant before medium exchange. Each condition was performed in triplicates, consisting of cell culture supernatant collected from 10 hepatic spheroids per replicate. The supernatants were stored at −80°C in LDH storage solution until analysis. The protocol of the kit manufacturer was followed, and luminescence signal was determined on a Tecan SPARK 10 M plate reader (Tecan, Switzerland). The results were normalized to the vehicle (0.5% [v/v] DMSO) treated control. The vehicle control was analyzed with six replicates. The LDH data are plotted as milliunits LDH per well with 95% CI. Statistical significance was analyzed with unpaired t-test to corresponding vehicle control. The stability of LDH in cell culture media was examined by treating the hepatic spheroids with 100 μM Chlorpromazine for 24 hours to induce membrane leakage. The cell culture supernatants of the treated hepatic spheroids were collected at the end of the treatment, transferred to a new microtiter plate, and kept incubated at 37° C for 7 days. The collected cell culture supernatant was sampled on day 1, 2, 3, 4, and 7 after the start of the incubation. The samples were analyzed for LDH activity, and data were plotted in milliunits per milliliter as mean of eight replicates.
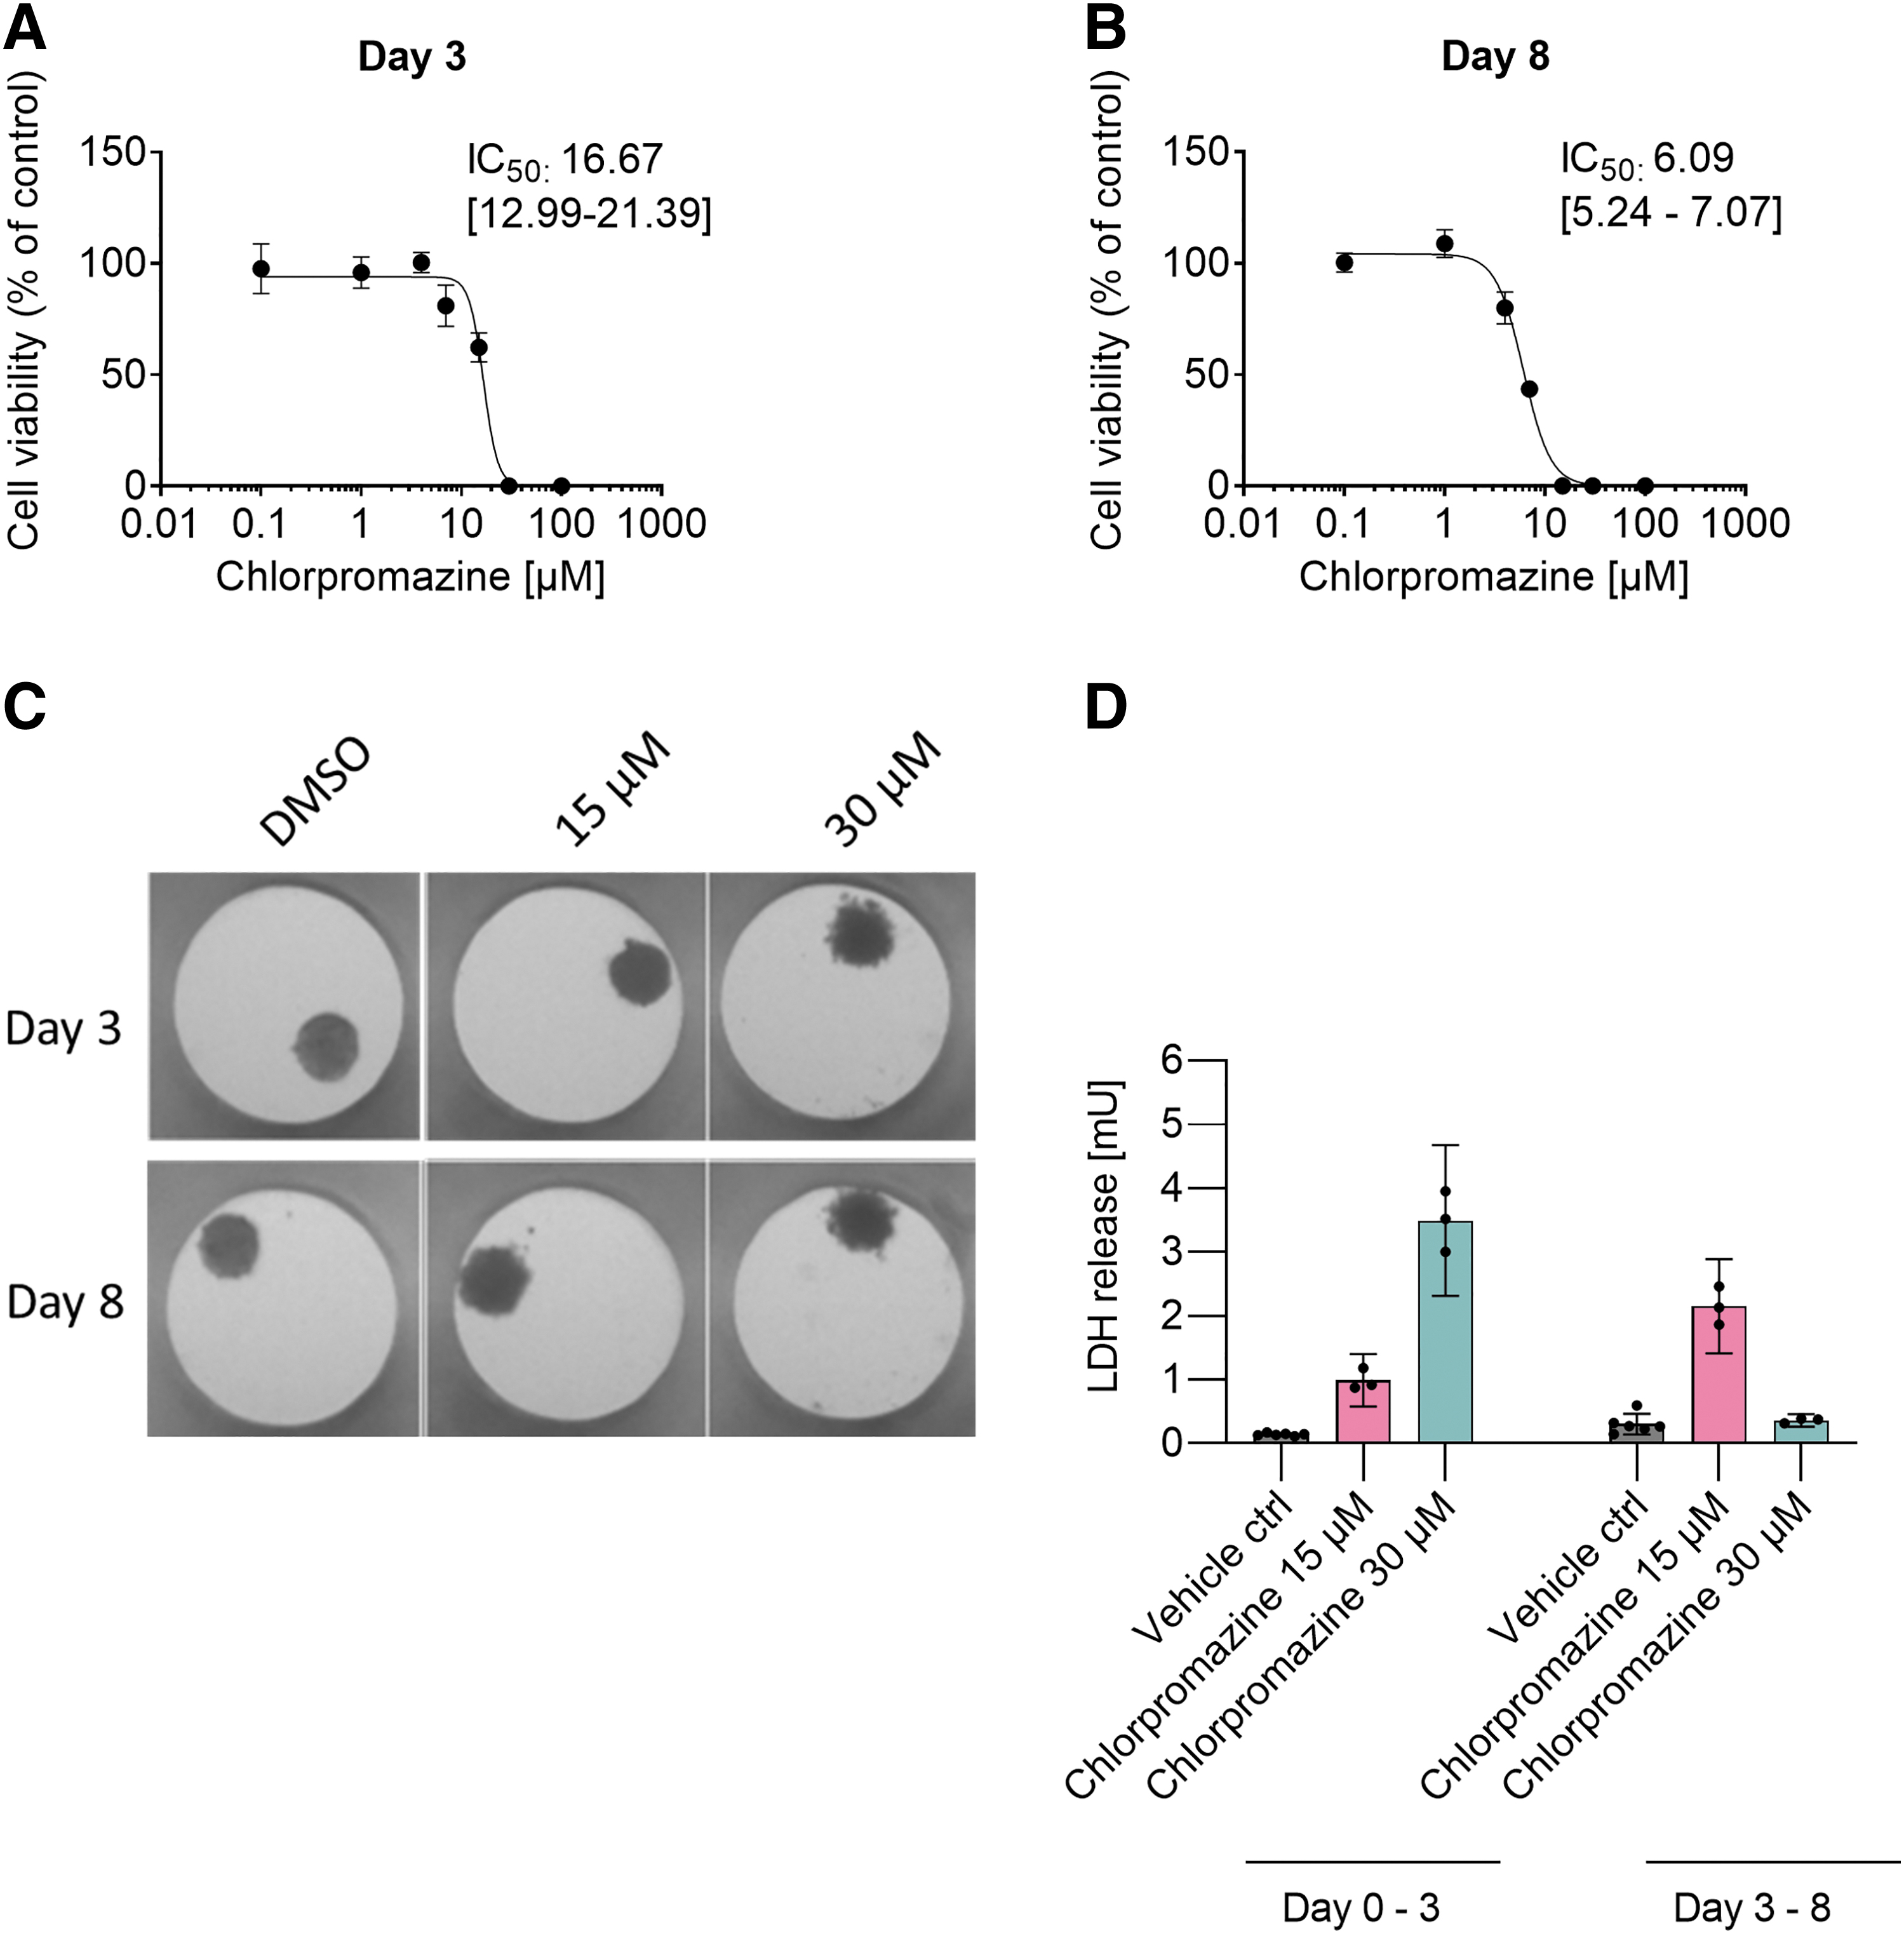
Cytotoxicity of Chlorpromazine in human hepatic spheroids.
Apoptosis assay
Apoptosis was measured as caspase 3/7 activity in compound-treated hepatic spheroids and in cell culture supernatant using the Caspase-Glo® 3/7 Assay (Promega) according to manufacturer's instructions. The hepatic spheroids were treated with Chlorpromazine (0.1, 1, 4, 7, 15, 30, and 100 μM) on days 0, and for the 8-day treatment Chlorpromazine was redosed on day 3. Supernatant and tissue samples were collected at day 3 and 8. After 30-minute incubation with the kit reagents luminescence signal was determined on a SPARK™ 10 M plate reader (Tecan). As a positive control for cell death, samples of hepatic spheroid treated with 20 μM Staurosporine for 6 hours were included. Each condition was analyzed in quadruplicates, and statistical significance was evaluated with t-test (two tailed distribution, two-sample unequal variance) to corresponding vehicle (DMSO) control.
miRNA expression profiling
All steps described below were done at Qiagen Labs in Hilden (Germany). Supernatants from treated hepatic spheroids (500 μL each; pooled from 10 hepatic spheroids) were used for isolation of exosomal miRNAs using the exoRNeasy Serum/Plasma Kit (Qiagen), following the manufacturer's instructions. Before the miRNA isolation, a prefiltration step was included to exclude particles larger than 0.8 μm. For supernatant collection, supernatants from 10 hepatic spheroids per replicate were pooled and analyzed in triplicates. For DMSO controls, pooled supernatants from six replicates of 10 hepatic spheroids each were collected. After RNA isolation, 19 μL purified RNA was reverse transcribed using the miRCURY LNA RT Kit (#339340; Qiagen). Each reverse transcription was performed including an artificial RNA spike-in control enabling quality control of the RNA isolation, cDNA synthesis, and PCR amplification steps (RNA Spike-In Kit, #339390; Qiagen). cDNA was diluted 50 × and assayed in 10 μL PCRs according to the protocol for miRCURY LNA miRNA PCR (Qiagen; #339306). In total, 752 human miRNAs contained in miRCURY LNA miRNA miRNome PCR panels I and II (#339322; Qiagen) were analyzed. The amplification was performed in a LightCycler 480 Real-Time PCR System (Roche, Germany) in 384 well plates. The amplification curves were analyzed using the Roche LC software, both for determination of quantification cycle (cq) values and for melting curve analysis. miRNA expression levels were calculated based on raw cq values. All miRNA expression data were normalized to the average of assays detected in all samples (normalized delta of quantification cycle [dcq] values) as this was shown to be the best normalization method for qPCR studies involving numerous assays. 23
miRNA differential abundance analyses
miRNA's abundance levels were estimated using qPCR. cq values were assigned to miRNAs if detected, otherwise the miRNA was labeled as nondetected (nd). cq values were normalized as described in Mestdagh et al., 23 giving rise to dcq values (Supplementary Table S1). If a miRNA was detected in all three replicates, either for a particular treatment scheme or for a control vehicle, it was submitted to differential abundance analyses, otherwise it was discarded. Prior differential abundance analyses, missing (nd) values were replaced with the lowest detected dcq value for the corresponding miRNA. Abundance change was then calculated as mean (dcq(treatment scheme))−mean (dcq(control vehicle)). p-Value for significance of abundance changed was then estimated using two-sample t-test. p-Values were then corrected for multiple testing with Benjamini–Hochberg procedure giving rise to false discovery rates (FDR). Only those comparisons with FDR <0.1 were kept for the downstream analyses.
miRNA target expression analyses
miRNA's targets were extracted from mirtarbase and filtered for those which have experimental evidence. 24 For each miRNA found to be differentially regulated, its influence on their mRNA target expression was set as miRNA_effect_score = mean(dcq(treatment scheme))−mean(dcq(control vehicle)) × log2(max(mean(dcq(treatment scheme)), mean(dcqm (control vehicle)))). Total effect of miRNAs on their target expression was set to the sum of their individual contributions (regulation + score). miRNA's targets (mRNAs) basal expression was set from previous TempO-Seq dataset (unpublished data). This basal expression was then modified with the fold_change = 1 + log4(abs(regulation_score) +1). If regulation score was negative mRNAs base expression was multiplied by fold_change, otherwise divided by it reflecting that miRNAs generally downregulate their targets. For the samples treated with Chlorpromazine differential gene expression analyses were performed using DESeq2. 25 Samples were grouped by concentration and contrasted to the vehicle control samples according to the time point. Genes (miRNA targets) with FDR <0.05 were then considered as being differentially expressed.
Principal component analysis
Principal component analysis (PCA) was performed with prcomp R package which effectively implements standard PCA procedure. Applied parameters for PCA were described in the corresponding figure legends.
Pathway enrichment analyses
For the differentially expressed genes (miRNA targets) pathway enrichment analyses were performed. Pathways and the genes associated with them were extracted from WikiPathways. 26 p-Values for pathway enrichment were calculated with Fisher exact test and further adjusted for multiple testing using Benjamini–Hochberg procedure giving rise to FDR values.
Results
Decreased viability and increased LDH leakage after Chlorpromazine treatment
Hepatotoxicity of Chlorpromazine was assessed in hepatic spheroids by monitoring the cell viability with cellular ATP. The hepatic spheroids were treated with a broad range of Chlorpromazine concentrations (0.1, 1, 4, 7, 15, 30, and 100 μM) for 3 and 8 days, with two compound applications for the 8-day treatment regimen, on day 0 and 3 (Fig. 1A, B). Cytotoxicity was observed at the highest treatment concentrations for both time points, and the IC50 value was determined to be 16.67 μM (95% CI 12.99–21.39) and 6.09 μM (95% CI 5.24–7.07) for day 3 and 8, respectively. Figure 1C displays representative images of the hepatic spheroids during the treatment with Chlorpromazine or DMSO. Changes in the morphology of the hepatic spheroids can be seen for the 30 μM Chlorpromazine treated samples. The edge of the spheroids was visibly rougher at 30 μM Chlorpromazine compared to the vehicle treated spheroids, indicating disaggregation of the spheroids following 30 μM Chlorpromazine treatment.
LDH leakage into the cell culture supernatant due to loss of cell membrane integrity is commonly used as a pan-cellular necrosis marker. LDH leakage following Chlorpromazine treatment was quantified in a kinetic setup in which the cell culture supernatant was collected on day 3 (day 0–3) and day 8 (day 3–8) (Fig. 1D). Both 15 and 30 μM Chlorpromazine treatment caused a strong increase in LDH leakage compared to vehicle control. Supernatant samples collected after 8 days of Chlorpromazine treatment showed increased LDH levels compared to day 3, showing that a longer exposure time enhanced the cytotoxic effect of Chlorpromazine. This is in contrast to 30 μM Chlorpromazine treatment on day 8, where a decrease in LDH leakage compared to day 3 was detected. This is likely due to the high toxicity of Chlorpromazine at this concentration. Treatment with highly cytotoxic compound concentrations will cause the cell membrane to leak its cytosolic content. Since the cells no longer have any LDH to be leaked, a plateau or decrease in LDH signal at the highest concentration can be observed at later time points. The detected decrease in LDH signal should not be a result of impaired LDH stability. According to our data, human LDH is stable in cell culture medium at 37°C for at least 7 days (Supplementary Fig. S1).
Expression of secreted miRNA in Chlorpromazine treated hepatic spheroids
To assess the number of miRNA species affected by Chlorpromazine treatment, exosomal miRNAs were isolated from the supernatants of hepatic spheroids treated with 15 and 30 μM Chlorpromazine and the corresponding vehicle control DMSO. After quantification by qPCR, the number of detected miRNAs grouped by treatment duration and compound treatment are displayed in Figure 2A. Chlorpromazine caused a high number of secreted miRNAs compared to the vehicle control. A time- and dose-dependent miRNA secretion pattern was detected, with an increase in detected miRNAs between 15 and 30 μM on day 3, and additionally, more miRNAs were detected in samples treated with 15 μM Chlorpromazine on day 8 compared to day 3. As expected, secreted miRNAs were detected also in the vehicle control samples. Expression values of all detected miRNAs are given in Supplementary Table S1. Figure 2B shows that following the 3-day treatment with 15 μM Chlorpromazine eight miRNAs were confirmed to be significantly differentially expressed (FDR <0.1), while 30 μM Chlorpromazine treatment resulted in 28 significantly differentially expressed miRNAs (FDR <0.1). The 8 day treatment with 15 μM Chlorpromazine caused 20 statistically differentially expressed miRNAs, while 30 μM Chlorpromazine treatment resulted in 12 differentially expressed miRNAs (FDR <0.1 each).

Expression profiling of secreted miRNAs in Chlorpromazine treated hepatic spheroids.
Supplementary Table S2 lists each significantly differentially expressed miRNA molecule following Chlorpromazine treatment on day 3 and 8 (FDR <0.1). In this table the hepatocyte-specific miR-193a had a fourfold increased expression, compared to vehicle control, following 3-day treatment with 30 μM Chlorpromazine. miR-193a has been described to be increased in NASH patients with severe liver fibrosis. 27 Moreover, liver-specific miR-122 was also upregulated on day 3 in samples treated with 30 μM Chlorpromazine compared to the vehicle control treated samples. This upregulation was only noticed at the highest concentration and not in samples treated with 15 μM Chlorpromazine, demonstrating that the miRNAs detected by our experimental setup are being actively secreted, independent of the necrotic status of the cells. As shown in Figure 1D, hepatic spheroids treated with 15 μM Chlorpromazine showed increased LDH release compared to DMSO control. However no significant regulation of miR-122 expression was detected in these samples. Moreover, miR-122 expression was also not significantly affected in samples with 8-day Chlorpromazine treatment.
Subsequently, a 2-dimensional PCA scatter plot was generated, based on normalized dcq values of all the detected miRNAs (Fig. 2C). Each sample is represented by a dot in the principal component plot. The graph shows a clear time-dependent separation over principal component 2 (PC2). Moreover, a treatment-dependent spread is shown over principal component 1 (PC1), with vehicle treated samples clustering on the left-hand side, whereas the Chlorpromazine treated samples are grouped on the right side of PC1.
Significantly regulated mRNAs (miRNA targets) following Chlorpromazine treatment
The number of predicted differently expressed mRNAs was inferred from the miRNA data (Fig. 3A). Each miRNA can regulate numerous mRNA transcripts, 1 and our analysis projected that the expression of over 300 mRNAs was changed following Chlorpromazine treatment at one specific time point and concentration. The 3-day treatment of Chlorpromazine caused the highest number of predicted differentially expressed mRNAs, with 114 and 325 for 15 and 30 μM Chlorpromazine, respectively, whereas the 8-day Chlorpromazine treatment caused 302 and 233 differentially expressed mRNAs for the samples treated with 15 and 30 μM Chlorpromazine, respectively (FDR <0.05 each). The top 100 variable genes were analyzed in a 2-dimensional PCA scatter plot (Fig. 3B). A clear separation of vehicle control treated samples from Chlorpromazine treated samples was observed over PC2. Moreover, samples treated with Chlorpromazine for 3- versus 8 days were separated over PC1. Please note that the data points for day 3 vehicle and day 8 vehicle samples cluster very near together, making it difficult to optically recognize the vehicle control data points for day 3.

Significantly regulated mRNAs (miRNA targets) following Chlorpromazine treatment.
Pathway enrichment analyses
Pathway enrichment analyses were performed for the predicted differentially expressed genes (mRNA targets of differentially expressed miRNAs). This revealed several cell cycle-related pathways to be strongly regulated following Chlorpromazine treatment (up- and downregulation of pathways, including cell cycle-related processes, DNA damage, and cancer cell cycle genes, Supplementary Fig. S2). Moreover, apoptosis emerged as one of the most affected pathways following Chlorpromazine treatment.
Regulation of apoptotic pathways
The top 50 apoptosis related genes affected by Chlorpromazine treatment are presented in a cluster heatmap (Fig. 4). miRNA data suggest that Chlorpromazine treatment led to an increased expression of BAX in a time- and dose-dependent manner. Similarly, RAF1 and CUL5 were increased in Chlorpromazine treated samples. Decreased expression was predicted for CASP7 and FAS compared to vehicle control samples, and MDM2 was predicted to be downregulated in the highest Chlorpromazine concentrations. Moreover, a decreased expression of CDKN1A and PTEN was predicted. CASP3 was downregulated at both Chlorpromazine concentrations on day 3 and became upregulated on day 8 for samples treated with 30 μM Chlorpromazine (data not shown). Furthermore, the apoptosis inhibitor X-linked inhibitor of apoptosis protein (XIAP) was predicted to be upregulated in Chlorpromazine treated samples. Figure 5 provides a schematic overview of the altered expression of apoptosis associated genes and their role in the intrinsic or extrinsic apoptosis pathway or the downstream signaling of receptor tyrosine kinases. Altogether, the miRNA data suggest that the expression of numerous key genes regulating apoptosis is affected by toxic concentrations of Chlorpromazine.
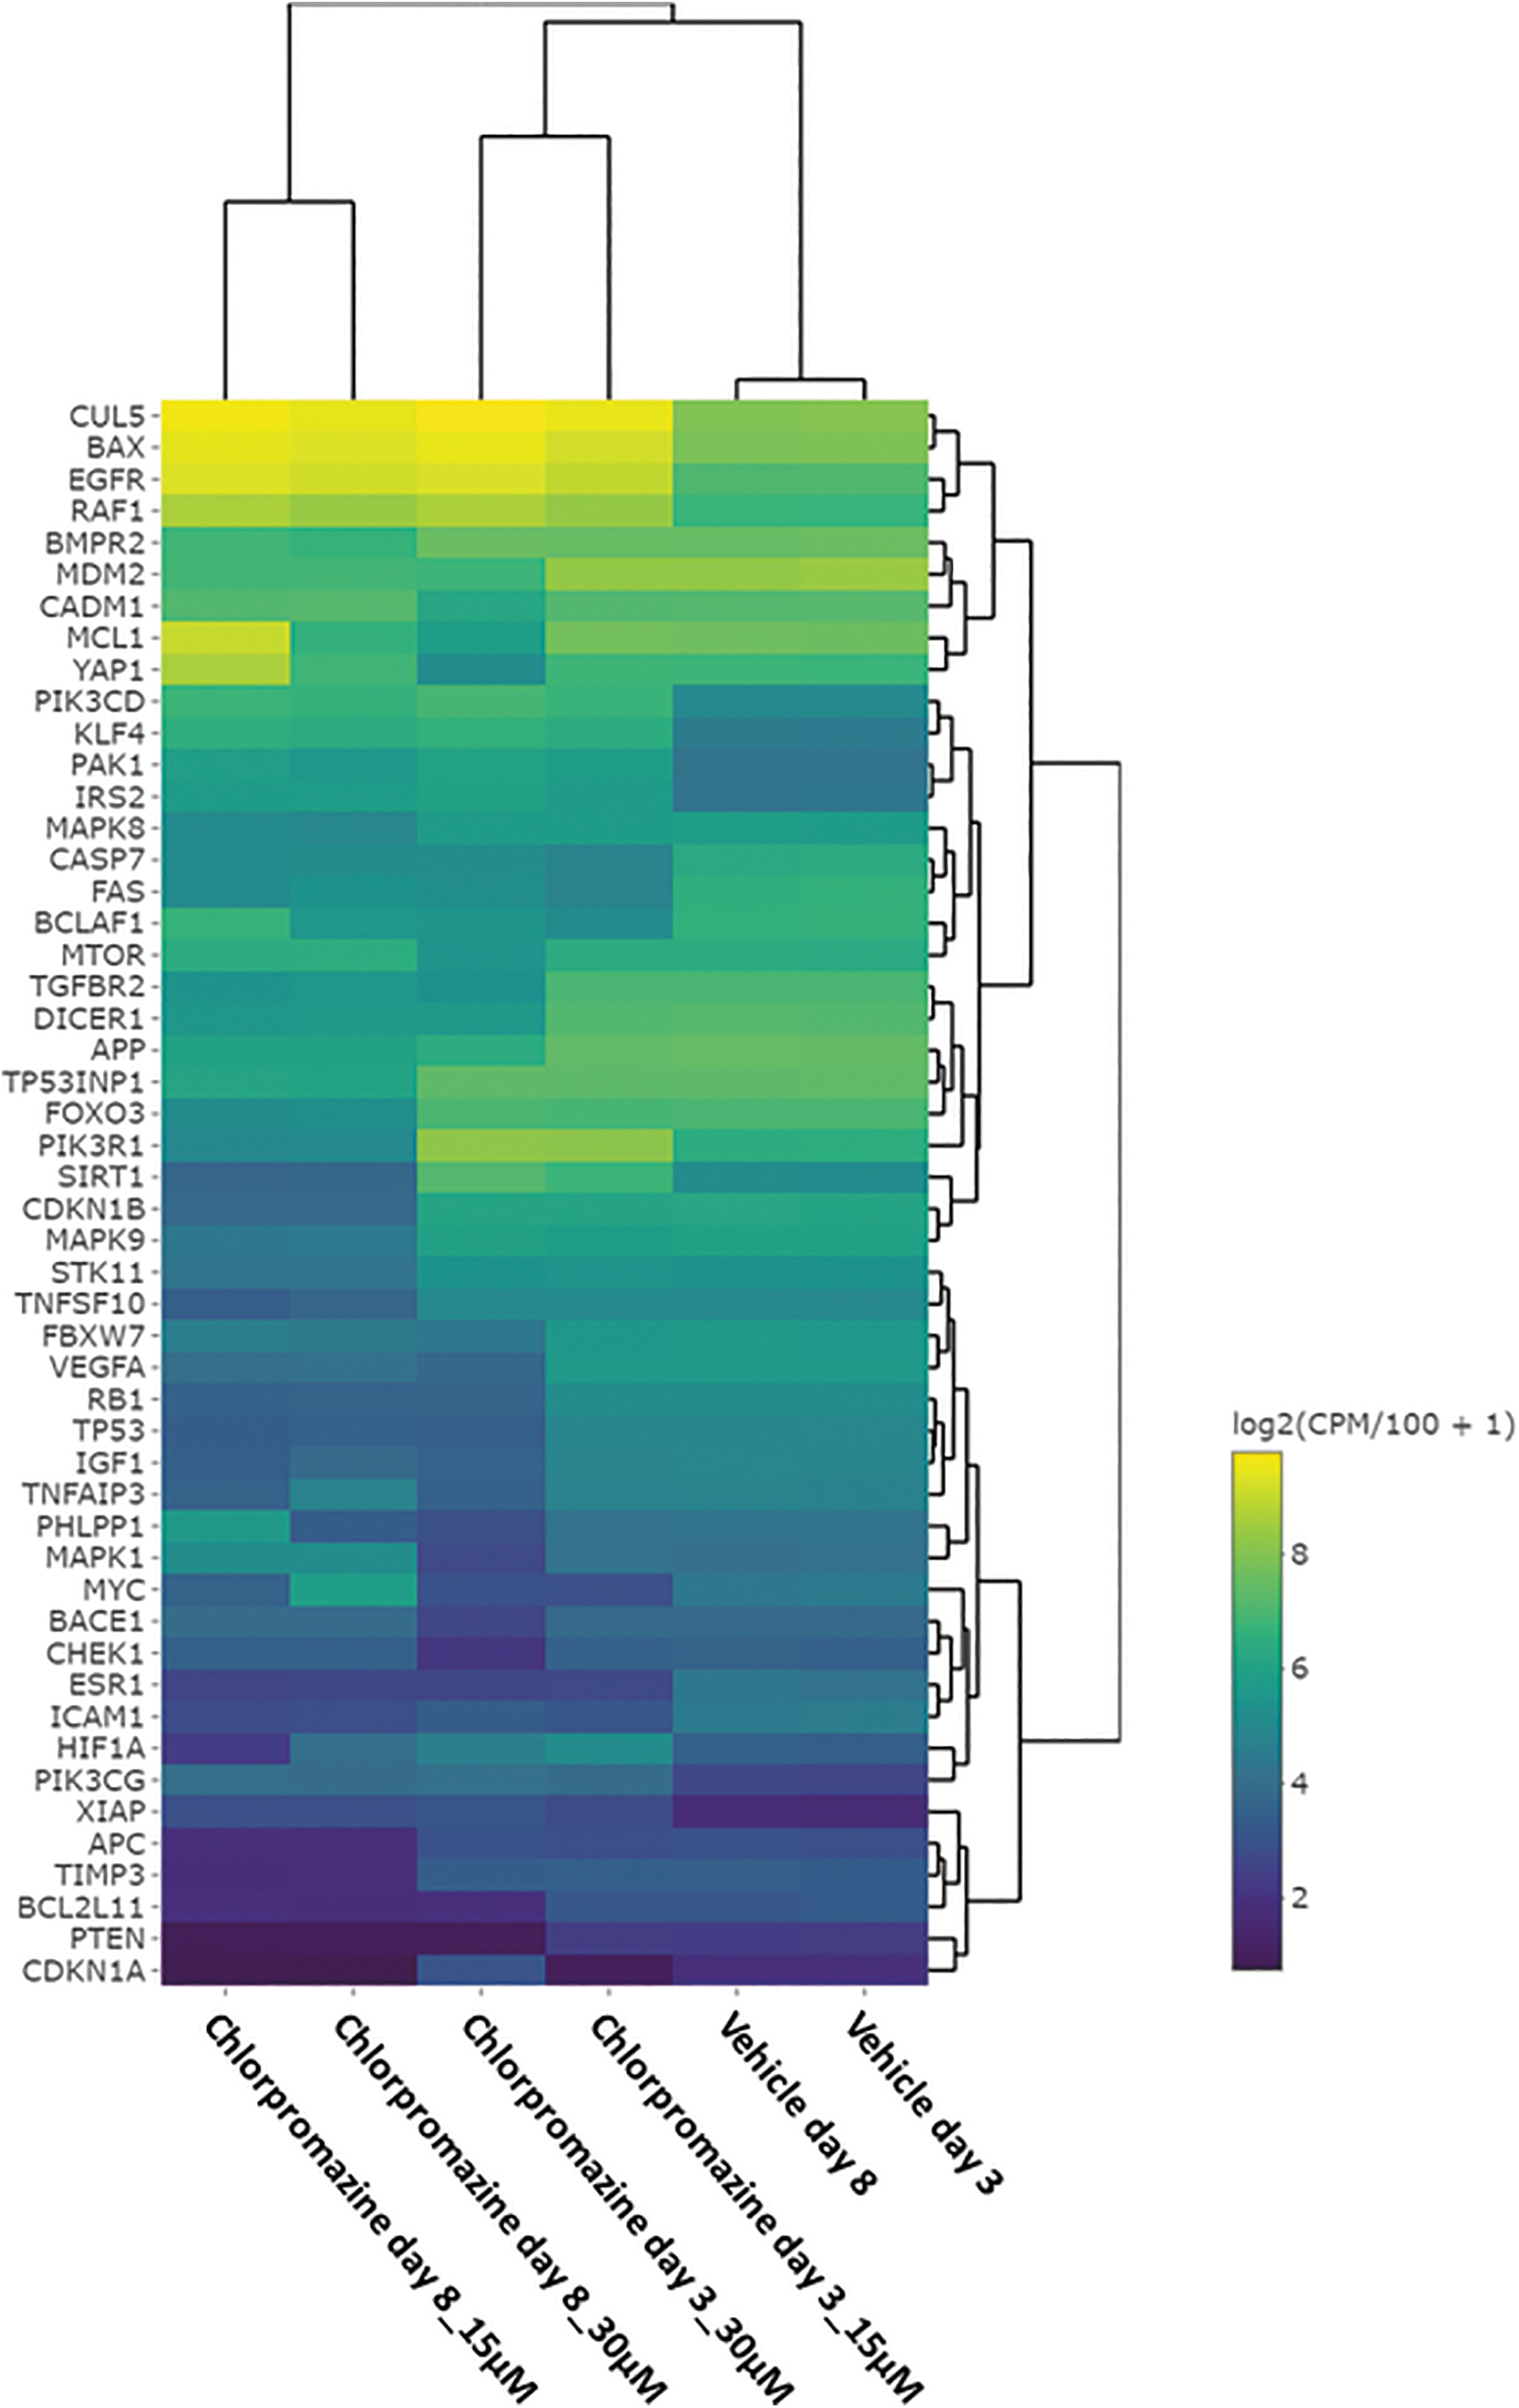
Top 50 apoptosis related genes associated to Chlorpromazine treatment. Genes and treatment schemes are grouped using hierarchical clustering. Predicted mRNA expression values (miRNA targets) for all apoptosis related genes, time points, and treatments are displayed. The top 50 regulated apoptosis related genes are displayed (FDR <0.05 in at least one treatment). Genes with predicted high expression are represented by yellow color, and genes with predicted low expression are represented by blue color.
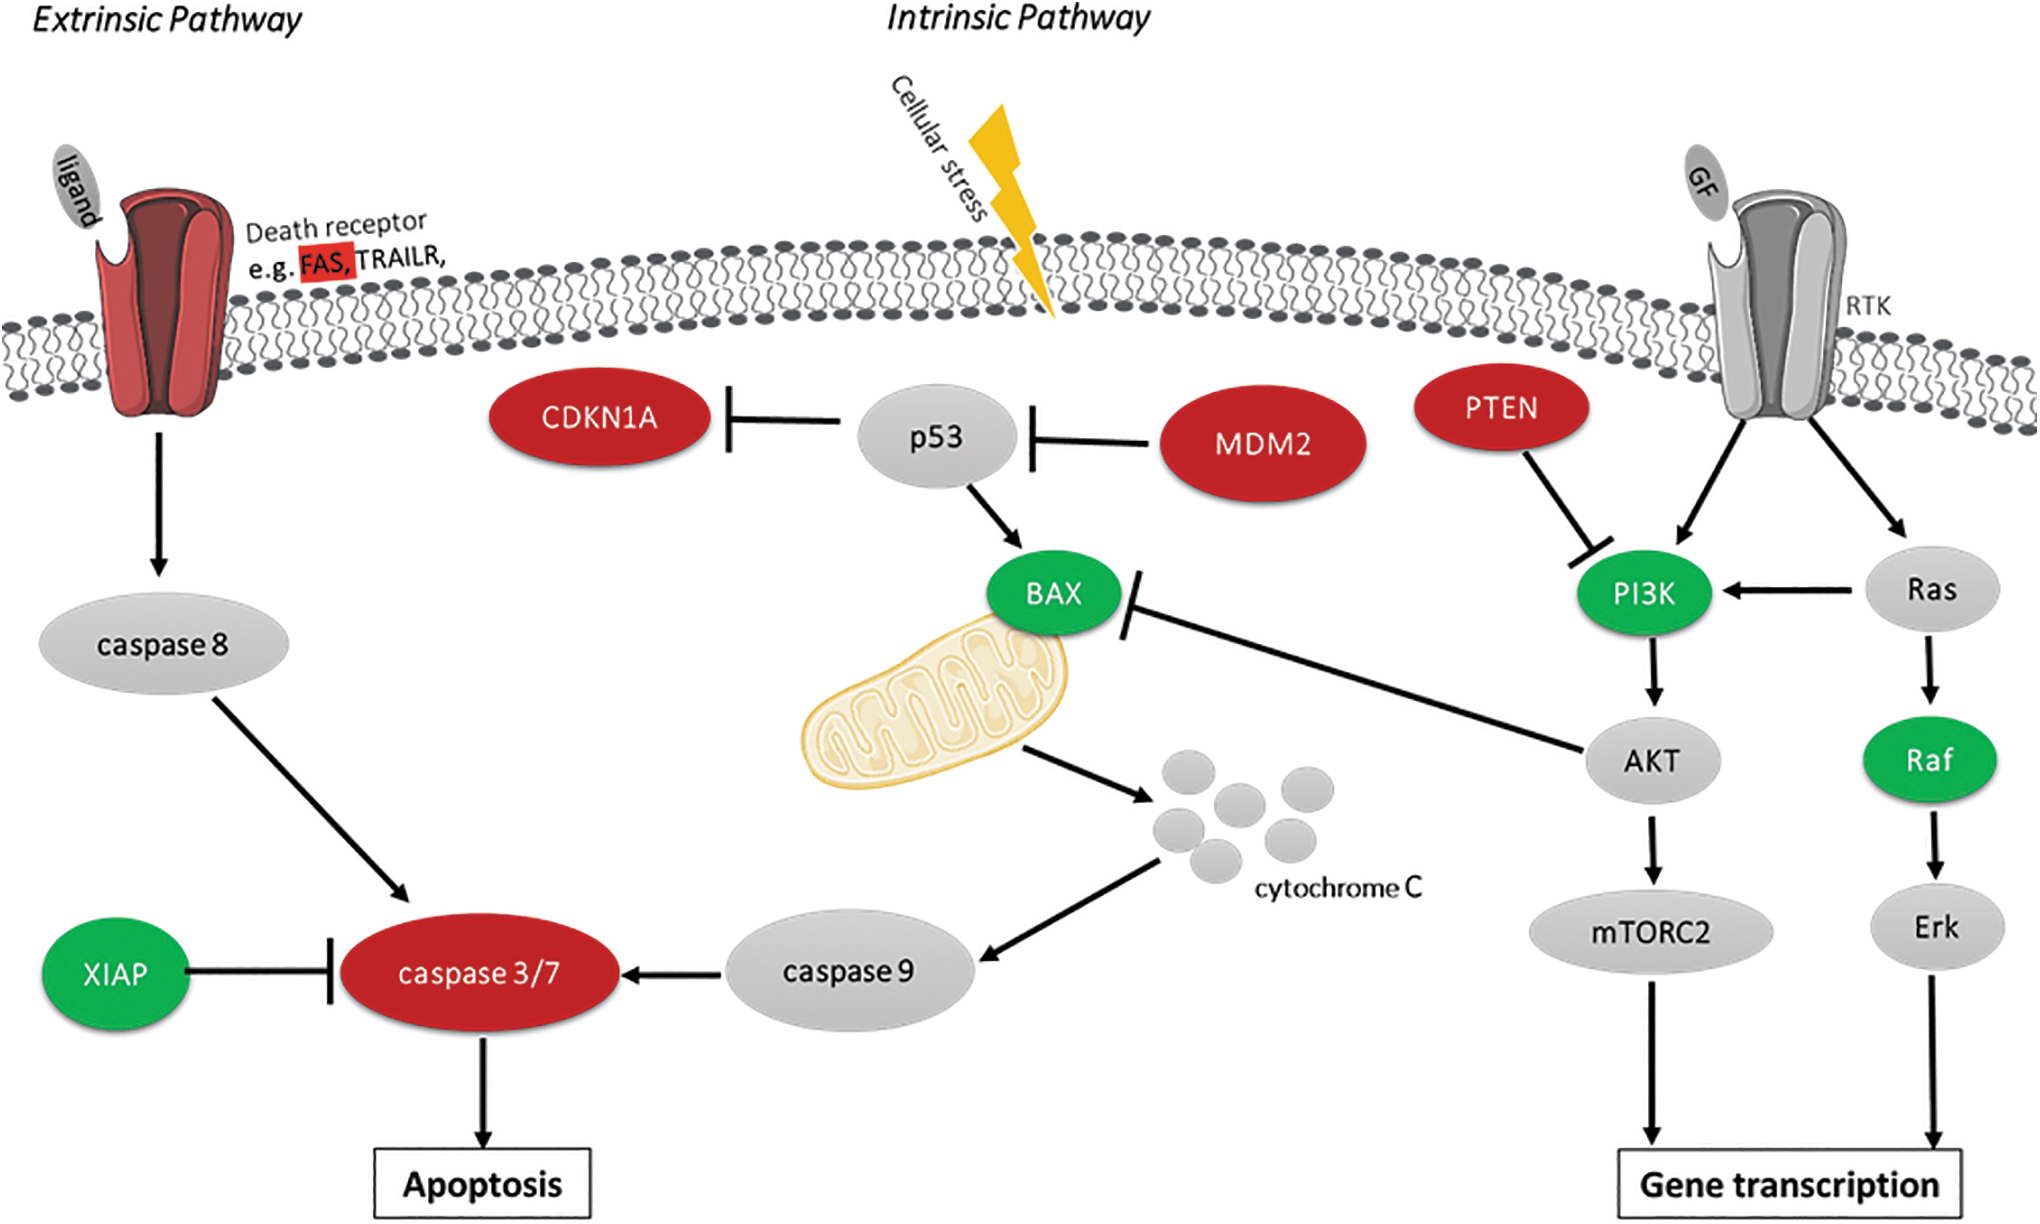
Overview of the intrinsic and extrinsic apoptosis pathway signaling and crosstalk with RTK signaling. Based on the miRNA expression data following 3 and 8 days of Chlorpromazine treatment, the predicted upregulation of mRNA due to miRNA expression changes is indicated in green color. Predicted decrease of mRNA expression due to alterations in miRNA expression is indicated in red. mRNAs not included in this data set or nonaffected by the treatment are colored in gray. PI3K symbol shows data related to PIK3CD and PIK3CG predicted expression. GF, growth factor; RTK, receptor tyrosine kinase.
Validation of apoptotic pathway findings by biochemical apoptosis assay
To demonstrate that miRNA data can produce biologically relevant information on the cytotoxicity of a drug, we assessed the effect of Chlorpromazine treatment on apoptosis induction suggested by the miRNA data using a biochemical assay. Staurosporine was used as positive control for apoptosis induction. Hepatic spheroids were treated with seven concentrations of Chlorpromazine (0.1, 1, 4, 7, 15, 30, and 100 μM) for up to 8 days, and caspase 3/7-activity was assessed in the spheroid and the supernatant (Fig. 6). A significant increase in caspase 3/7-activity was observed in both the supernatant and in the hepatic spheroid at the highest Chlorpromazine concentrations. Supernatant samples demonstrated a significant caspase 3/7-activity on day 3 for 15, 30, and 100 μM, whereas only at 15 μM Chlorpromazine on day 8 (Fig. 6A). The difference between the time points is possibly explained by an early strong response to 30 and 100 μM Chlorpromazine treatment, leading to a rapid cell death induction, with only a few living cells left at later timepoints to produce a detectable and significant caspase 3/7-activity signal. In the case of the spheroid samples (Fig. 6B) a dose-dependent response to the treatment was observed. Thirty micromolar Chlorpromazine induced an increased signal at day 3, whereas 15 μM Chlorpromazine was sufficient to produce a positive caspase 3/7 activity signal after 8 days treatment. Like the supernatant samples the highest concentrations on day 8 did not generate a significant caspase 3/7 activity signal, presumably due to the high number of already dead cells. Taken together, this result shows that miRNA data accurately informed on the onset of apoptosis in hepatic spheroids (supernatant and spheroids as well) treated with cytotoxic concentrations of Chlorpromazine. Hence, toxicologically relevant information can be obtained from miRNA expression profiles.

Increased caspase 3/7-activity in hepatic spheroids treated with Chlorpromazine.
Discussion
miRNAs are actively secreted into the circulatory blood system and have been extensively investigated for their use as biomarkers. 28 Secreted miRNA profiles can provide early insights on cellular events following medical treatment or disease development. The aim of this study was to investigate whether such a miRNA profiling can be used in combination with a cell-based in vitro model to perform investigative toxicology and discover novel DILI biomarkers. For this purpose, an in vitro hepatic spheroid model, consisting of primary human hepatocytes cocultured with a crude liver non-parenchymal cells fraction, was used. Cell-based models provide great flexibility by enabling the testing of multiple conditions and allow for assay upscaling with the possibility of high-throughput screening. Moreover, previous work convincingly showed that hepatic spheroids are a relevant model to investigate the liver safety of small molecular compounds. 22 The well-characterized drug Chlorpromazine was used here as model compound for the investigation of the predictive power of miRNA profiling for liver injury.
Chlorpromazine has been reported to cause mild and transient serum aminotransferase elevations. 17 Our analysis showed that Chlorpromazine had a strong effect on miRNA secretion. A high number of miRNAs were significantly regulated by Chlorpromazine treatment, and consequently, a change in mRNA (corresponding miRNA targets) expression was predicted. The miRNA profile of Chlorpromazine revealed a link to multiple toxic cellular reactions, including changed expression of apoptosis associated genes like BAX, CASP7, and FAS in a dose-dependent manner. Interestingly, Chlorpromazine has previously been reported to induce apoptosis in activated human lymphoblasts. 29 The authors suggested that Chlorpromazine mediates apoptosis through specific activation of intracellular proapoptotic signaling cascades involving a Sphingosine 1-phosphate (SP-1P) sensitive pathway and caspase. Furthermore, Chlorpromazine has been reported to inhibit colorectal cancer and pulmonary metastasis by inducing G2/M cell cycle arrest, apoptosis, and autophagy. 30 Another study reported that Chlorpromazine suppresses the mitochondrial membrane potential and elevates reactive oxygen species levels in cancer cells, suggesting that it induces mitochondria-dependent intrinsic apoptosis. Furthermore, in a study based on in vitro primary hepatocyte spheroids, Chlorpromazine treatment was reported to cause oxidative stress, which in turn causes F-actin distribution. 31 Noteworthy, the actin cytoskeleton which is a substrate for caspases has been proposed both as a sensor and a mediator of apoptosis. 32 In line with this, the authors reported modulations of death receptor signaling following Chlorpromazine and bile acid cotreatment. 31 Increased intrahepatocellular bile acid concentrations can induce JNK activation and membrane trafficking of Fas, ultimately leading to induction of apoptosis.33,34 In an unrelated study, the JNK inhibitor SP600125 was reported to decrease Chlorpromazine toxicity in murine hepatocytes, 16 suggesting that apoptosis induction by JNK signaling is one of the mechanisms of Chlorpromazine toxicity in hepatocytes.
Altogether, the results from these studies are in line with our miRNA data observation that genes regulating apoptosis are affected by toxic concentrations of Chlorpromazine (Fig. 5). In a subsequent biochemical assay, the induction of apoptosis in the hepatic spheroids was confirmed in terms of elevated caspase 3/7-activity in both hepatic spheroids and supernatants, following treatment with cytotoxic concentrations of Chlorpromazine. Although the differences in mRNA levels do not suggest increased expression of apoptosis-related genes after Chlorpromazine treatment, it could be possible that the predicted expression changes are caused by a negative feedback mechanism seeking to regulate the increased apoptotic activity in the cells. For example, the expression of caspase 3 and 7 is predicted to be decreased, and the apoptosis inhibitor XIAP is predicted to have an increased expression following Chlorpromazine treatment. Moreover, the increased expression of PI3K-kinases can subsequently activate Akt which acts as an inhibitor of BAX, consequently inhibiting apoptosis. In summary, these data support the concept that an exosomal miRNA signature could help to elucidate DILI mechanisms and ultimately might be useful as a clinical biomarker signature.
Blood miRNA biomarkers, if preceding the onset of traditionally used clinical biomarkers (e.g., ALT and AST), can provide an early insight into the safety state of patients and could become a useful early diagnostic tool for monitoring DILI. Hepatic spheroids are, due to their physiological relevance, promising tools for the discovery of human relevant drug-specific miRNA biomarkers specific for DILI mechanisms. In vitro miRNA profiling could enable the discovery of novel early biomarkers that can be easily tested in the clinic from blood samples (liquid biopsy). Identification of miRNA biomarkers can be helpful in the process of elucidating the cause of hepatotoxicity and assisting clinicians in clinical decision whether to continue treatment or not. Moreover, the fact that we could detect and quantify miRNA molecules in the vehicle control samples demonstrates that exosomal miRNAs can be detected also under non-necrotic conditions, strengthening the hypothesis that exosomal miRNA is actively secreted by the cells as a part of the intercellular communication and not due to passive leakage.
Taken together, we demonstrated here the potential of hepatic spheroids as an in vitro tool system for the investigation of secreted miRNA signature profiles following drug treatment. The hepatic spheroids could successfully be used to generate a dose-dependent expression profile of secreted miRNAs which could be used for investigative toxicology and the discovery of novel biomarkers that could be used to monitor liquid biopsy samples of patients to identify specific DILI inducing mechanisms.
Conclusion
Since the current available liver biomarkers like AST and ALT provide only low sensitivity and might fail on informing on specific DILI mechanisms, novel biomarkers with higher sensitivity but also with mechanistic insights are needed. In this study we identified an apoptotic DILI mechanism which is relevant to liver toxicity based on the miRNA expression profile generated from Chlorpromazine treated hepatic spheroids. Using Chlorpromazine as a tool compound and subsequently identification of expression profiles of secreted miRNAs, we identified changes in numerous cellular signals and pathways following exposure to toxic concentrations of Chlorpromazine. miRNAs as early transcriptional biomarkers have the potential to improve the risk assessment of new drugs and to provide useful mechanistic information for potential clinical interventions. The discovery of novel miRNA biomarkers for liver injury which can be monitored directly in the patient blood has the potential to become a valuable tool for the diagnosis of emerging DILI using noninvasive liquid biopsy.
Footnotes
Acknowledgments

Authors' Contributions
A.B. writing of original draft (lead), figure preparation; B.F. conceptualization, reviewing, editing, methodology; P.H. writing, reviewing, editing, conceptualization; A.W. writing, reviewing, and editing; M.G. project initiation, conceptualization, miRNA methodology, reviewing, and editing.
Author Disclosure Statement
A.B., A.W., and B.F. are employees of InSphero AG. M.G. and P.H. are employees of Merck Healthcare KGaA.
Funding Information
No funding was received for this article.
References
Supplementary Material
Please find the following supplemental material available below.
For Open Access articles published under a Creative Commons License, all supplemental material carries the same license as the article it is associated with.
For non-Open Access articles published, all supplemental material carries a non-exclusive license, and permission requests for re-use of supplemental material or any part of supplemental material shall be sent directly to the copyright owner as specified in the copyright notice associated with the article.
