
Abstract
Tenofovir disoproxil fumerate (TDF) is an effective nucleoside reverse transcriptase inhibitor for HIV infection but it is potentially nephrotoxic. A selective mithochondrial toxicity has been hypothesized. To assess early markers of renal toxicity, we evaluated a cohort of antiretroviral (ARV)-experienced HIV patients who had been switched from a thymidinic backbone to either a TDF/emtricitabine regimen (TDF; 73 patients) or an abacavir/lamivudine (ABV) regimen (28 patients). Markers of mitochondrial toxicity (cytochrome c, Cyc) or cytosolic (α-glutathione S transferase, α-GST) together with common indicators of renal damage were assessed at baseline (T0) and after 1 (T1), 3 (T2), 6 (T3), and 12 (T4) months of patient exposure to therapy. Clinical features of both groups were comparable at T0. There was no significant variation in estimated glomerular filtration rate (eGRF), median urine protein excretion, or microalbuminuria and serum phosphate levels in both groups during the study period. There was a significant increase in urinary excretion of phosphate in patients on TDF compared to those on ABV at T3 and T4. Fractional excretion of uric acid was also altered in the two treatment groups; there was no change in the ABV (constantly less than 0.10), but a progressive increase in TDF patients. Serum potassium levels were significantly lower in ABV than in TDF treated patients. Urine concentrations of α-GST showed a nonsignificant variation in both groups, while Cyc excretion was significantly higher at T1 and T3 in TDF-treated compared to ABV-treated patients. In conclusion, TDF may be associated with subclinical mitochondrial damage, inducing at a later stage increased urinary excretion of phosphate and uric acid, as markers of incipient tubular injury.
Introduction
T
Tenofovir is excreted unmodified into urine by glomerular filtration and proximal tubular secretion. The drug enters actively tubular cells through the human organic anion transporter-1 (hOAT1), which is expressed on the basolateral side of proximal tubular epithelial cells. Tenofovir is then eliminated through other proteins located at the apical side, the multidrug resistance proteins MRP-2 and MRP-4. 11 However, it can gain access to mitochondria and cause mitochondrial damage; an enzyme of the respiratory chain such as cytochrome c (Cyc) is released in the cytosol, and exerts toxic effects to the cells, by activation of intracellular pathways that lead to apoptosis. 12 Other factors, including protease inhibitors (lopinavir/ritonavir), may favor the toxic effects of tenofovir, by increasing circulating levels of the drugs and through competition at the MRP-2 pumping-off cell mechanism. 13 –30
It has been demonstrated experimentally that Cyc can be released by tubular cells following an injury and can be found in urine. 14 This protein could then be used as a marker of mitochondrial injury when assessed in urine. It is plausible that renal tubular toxicity of tenofovir involves primarily mitochondrial damage 15 and subsequently a more diffuse cytoplasmic insult that may include lysosomes and other organelles, leading to apoptosis and tubular cell necrosis. The α-glutathione S transferase (α-GST) enzyme is considered a specific biomarker of cytosolic proximal tubular cell damage.
Clinical correlates of such pathogenetic mechanisms are a full-expressed proximal tubular dysfunction such as Fanconi's syndrome or minor and subclinical renal injury. In presence of other comorbid factors, this may evolve to an overt clinical tubular nephropathy, potentially progressive to renal failure. Classic biochemical markers of renal dysfunction may not be sufficiently sensitive to disclose an undergoing tubular toxic insult.
The aim of our study was to identify early markers of tubular damage urinary cytochrome C and α-GST, which can be considered indexes of mitochondrial and cytosolic tubular toxicity, in conjunction with other common biochemical urinary parameters of an altered tubular function, during the therapeutic exposure to TDF/emtricitabine-based ARV regimen (TDF group), in comparison with another less nephrotoxic abacavir/lamivudine-based regimen (ABV group).
Methods
Study population
HIV-positive patients switched off the previous ARV therapy based on thymidinic backbones were enrolled in this study from October 2006 to June 2009. Patients with severe comorbidities and/or organ failures were excluded from the study. Also, patients with moderate to severe renal failure or nephrotic syndrome were not enrolled in the study. The patients were divided in two groups according to drug exposure. The first group comprised patients who received an abacavir/lamivudine-based regimen (ABV group) at the fixed dose of 600 and 300 mg, respectively, once per day. The second group received another nucleoside reverse transcriptase inhibitor (NRTI)-based regimen through the administration of tenofovir disoproxil (245 mg) and emtricitabine (200 mg) once daily (TDF group). In both groups, the third ARV drug was either a protease inhibitor or a non-nucleoside reverse transcriptase inhibitor (NNRTI). Clinical features of each individual patient were collected from the clinical record. Immunovirologic status and CD4 cell count at baseline was also recorded. Eighty-four patients completed the study and renal pathophysiologic parameters were available from these patients; however, data for urinary enzymatic markers at T4 were only available for 39 patients.
All patients gave an informed consent to participate to the study.
Study protocol and specimen collection
The study period was 12 months. Serum and urine samples were obtained at different time points and specifically at baseline (T0), and after 1 (T1), 3 (T2), 6 (T3), and 12 (T4) months of starting the therapy with one of the two NRTI-based regimes. A fasting blood sample was obtained during the protocol visits; the patients also provided a sample of the 24-h urine collection and a morning spot urine sample. Serum and blood samples were analyzed for routine chemistry and a complete blood count. The 24-h urine samples were centrifuged and sent to the central laboratory for evaluation of routine parameters (protein, albumin, electrolytes, urate, creatinine). In order to eliminate the effect of incorrect urine collection, all assayed parameters were expressed as ratio versus urinary creatinine. The spot urine sample was centrifuged and stored at −70°C until being tested for urinary markers.
Urinary markers of renal toxicity
In order to evaluate early markers of drug renal toxicity we assessed the urinary concentration of two tubular products: α-GST, a cytosolic enzyme present in the proximal tubular cells and cytochrome c (Cyc), an enzyme of the mitochondrial respiratory chain. Specific assays were performed with commercially available enzyme-linked immunosorbent assay (ELISA) kits: human αglutathione S-transferases (α-GST) ELISA kit, Cusabio Biotech (Newark, DE) and human cytochrome c enzyme immunoassay (EIA) kit, Assay Designs Stressgen (Plymouth Meeting, PA). Sensitivity of the assays was of 0.625 μg/L and 2 ng/L for α-GST and Cyc, respectively. To correct for the urine volume effect, concentration of both enzymes were normalized versus the urinary creatinine concentration and expressed as nanograms per gram (ng/g).
Calculated parameters
eGFR was calculated with the MDRD formula # 7,
26
which provided a more accurate estimate of GFR in our study group than measured creatinine clearance or other commonly used equations. Fractional urinary excretion of urate was calculated from urinary and serum concentration of uric acid according to the formula:
This value is a fraction of 1, and represents the amount of uric acid present in the glomerular filtrate that is excreted in the urine and normally is around 0.1.
Statistical analysis
Data were expressed as mean±standard deviation (SD) or median and interquartile range. Statistical comparison between mean values of each parameter at different time points, was performed by the Mann-Withney U test for nonpaired samples. Variation of each parameter in the different time points of each treatment groups was performed by the nonparametric multiple paired sample test, according to the Friedman's test, which yields a χ2 value.
In order to have a robust statistical comparison of the variation of biochemical parameters across the study period taking into consideration the difference in respect to the baseline (T0) and in consideration of the missing data, all end points were analyzed with a hierarchical linear model for longitudinal measurements to assess differences over time between the two groups of treatment. 27,28 The Hochberg's method was followed to obtain p values corrected for multiple comparisons. 29 An unstructured correlation type was used to account for unequally spaced time occasions during follow-up. p values <0.05 were considered statistically significant. All analyses were performed using SAS Statistical Package Release 9.1 (SAS Institute, Cary, NC).
Plotting the available values against time, and performing a linear fitting of the curve estimated variation of eGFR in each patient during the study period. The slope of the fitted linear curve represented the monthly variation of eGFR.
Results
A total of 101 HIV-infected patients treated with thymidinic-based backbones were enrolled in this study. There were 98 Caucasian patients 98 and 3 Africans (2 in TDF and 1 in ABV).
Baseline characteristics of the patients treated with either the ABV- or TDF-based regimens are summarized in Table 1. Demographic variables and risk factors (injection drug abuse) were not different between groups. Factors related to disease severity, such as longevity of HIV infection, stage of disease, hepatitis B virus (HBV) or hepatitis C virus (HCV) coinfection, and CD4+ cell count were comparable in the two groups. Use of the third ARV drug chosen (PI and NNRTI) was balanced between the two groups. Among laboratory parameters related to renal function, mean serum creatinine levels were significantly lower in TDF group; there was no significant difference in estimated GFR at baseline. All other biochemical parameters were comparable in both treatment groups.
Data represent mean±SD. Comparison of continuous variables was made by the Mann-Whitney U test. Categorical variables were compared by the χ2 test.
ABV, abacavir/lamivudine; TDF, tenofovir disoproxil fumerate; HCV, hepatitis C virus; HBV, hepatitis B virus; PI, protease inhibitors; NNRTI, non-nucleoside reverse transcriptase inhibitors; eGFR, estimated glomerular filtration rate.
There was no significant variation in eGFR at different time points in both the ABV and TDF group (χ2=2.348; p=0.672, and χ2=5.012; p=0.286, respectively). Moreover, mean rate of eGFR variation from T0 to T4, calculated from the slope of the plotted eGFR in each time point was comparable between ABV-treated (0.007±1.85 mL/min per month) and TDF-treated patients (−0.25±2.08 mL/min per month; p=0.584).
Urine protein excretion and microalbuminuria had a non-normal distribution; the prevalence of microalbuminuria at baseline, defined as an albumin creatine ratio (ACR) greater than 30 mg/g, was of 14.3% in the ABV group and 23.6% in the TDF group, respectively (χ2=0.931, p=0.335) while an overt urine protein excretion at baseline (protein/creatinine ratio >0.2 g/g) was present in 22.7% in ABV and 23.2% in TDF (χ2=0.116, p=0.734). Similarly, the variation during the study period in both parameters was not different between the two groups of patients, as well as no difference observed between ABV- and TDF-treated patients at each time point.
Serum phoshate was comparable between ABV and TDF groups. There was no difference in the percentage of hypophosphatemic patients between the two groups during the study period. Instead, the pattern of urinary phosphate excretion was different between the two groups. While the trend of phosphate excretion was decreasing from T0 to T4 in ABV-treated patients, an increasing trend was observed in the TDF-based regimen. There was no significant variation in the ABV group (χ2=7.900; p=0.095) and a highly significant variation in TDF group (χ2=18.609; p=0.001) when comparing each group of patients. Moreover, in the latter group, phosphaturia of later time points T3 and T4 differed significantly from baseline values (p=0.002 and p=0.0122, respectively; Fig. 1).
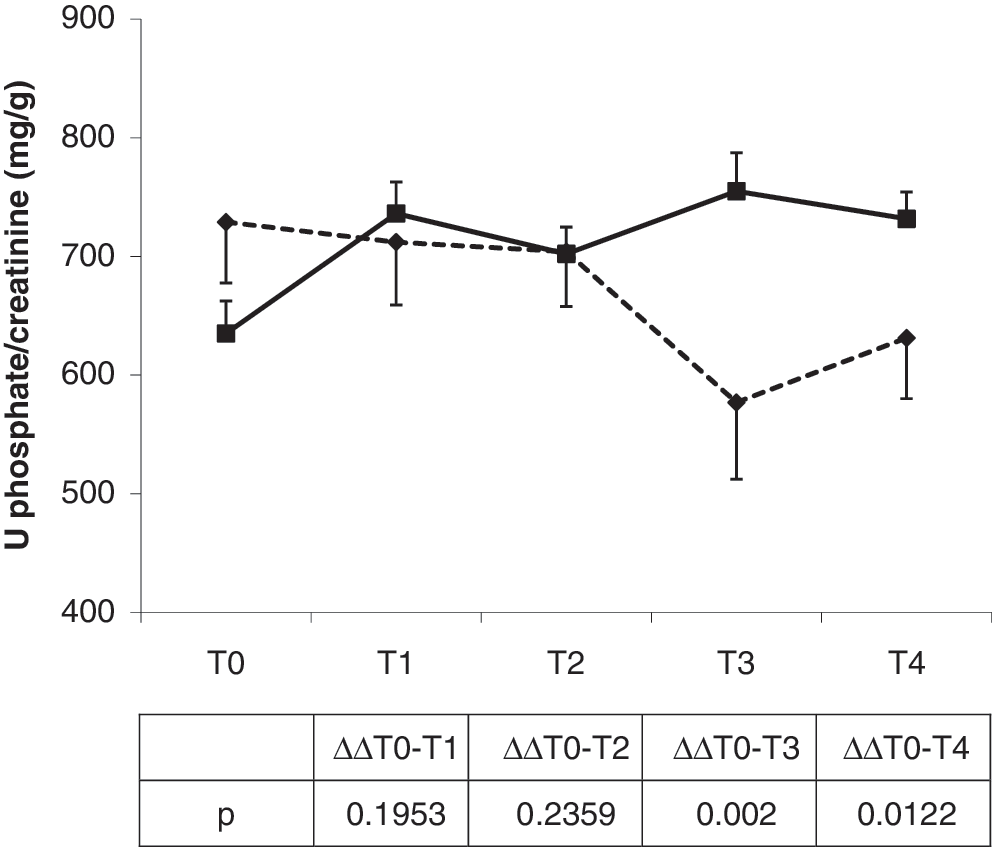
Profile of the urinary excretion of phosphate in patients treated with abacavir/lamivudine (ABV) or tenofovir disoproxil fumerate (TDF). Data represent mean±standard error (SE). In the table the p values are calculated according to the longitudinal model of Hochberg (see method section). Diamonds and shaded line, ABV; squares and solid line, TDF.
Urinary fractional excretion of uric acid showed a different pattern during exposure to either ABV- or TDF-based regimens. In the first group of patients the trend was fluctuating with mean values never exceeding 0.10 while in the TDF group a progressive increase of fractional excretion of urate was evident from T0 to T4 with a significant delta value at T1 and T3 compared to basal (p=0.0152 and p=0.0356, respectively).
Among the other biochemical parameters, a different profile was observed for serum potassium levels. ABV patients experienced a reduction of potassium levels during the study period (χ2=9.588; p=0.048), while the variations in the TDF groups were not statistically significant (χ2=8.766; p=0.067). The reduced average serum potassium levels of ABV group did not depend on an increased urinary excretion of potassium, since the mean levels of the latter were constantly lower in ABV in respect to TDF patients (data not shown).
The urinary marker of tubular dysfunction, α-GST and Cyc had a different profile in the two groups of patients. α-GST fluctuated in both groups during all time points with a trend toward a reduction of the median values in both ABV (χ2=4.800; p=0.308) and TDF regimens (χ2=7.600; p=0.107; Fig. 2). Instead, urinary Cyc excretion profile varied in the two groups. At baseline, patients enrolled in the TDF group presented median levels of Cyc (109.1, interquartile range 25.5–464.3) higher than those of patients of the ABV groups (52.3, interquartile range 24.0–108.6), although the difference was not statistically significant (p=0.090). More importantly, during the study period, patients treated with TDF excreted variable levels of Cyc, which showed an increasing profile up to T2, to subside to near basal levels at T4 (χ2=10.533; p=0.032). The profile of urinary Cyc levels was irregular in ABV-treated patients, and the difference at various time points was not statistically significant (χ2=4.870; p=0.104). Comparison of median values between the two groups at different time points showed that at T1 and T2 patients receiving TDF excreted median urinary levels of Cyc significantly higher than patients treated by ABV (p=0.015 and p=0.032 at T1 and T2, respectively), while no difference was present at T3 and T4 (p=0.562, and T4 p=0.844, respectively; Fig. 3).
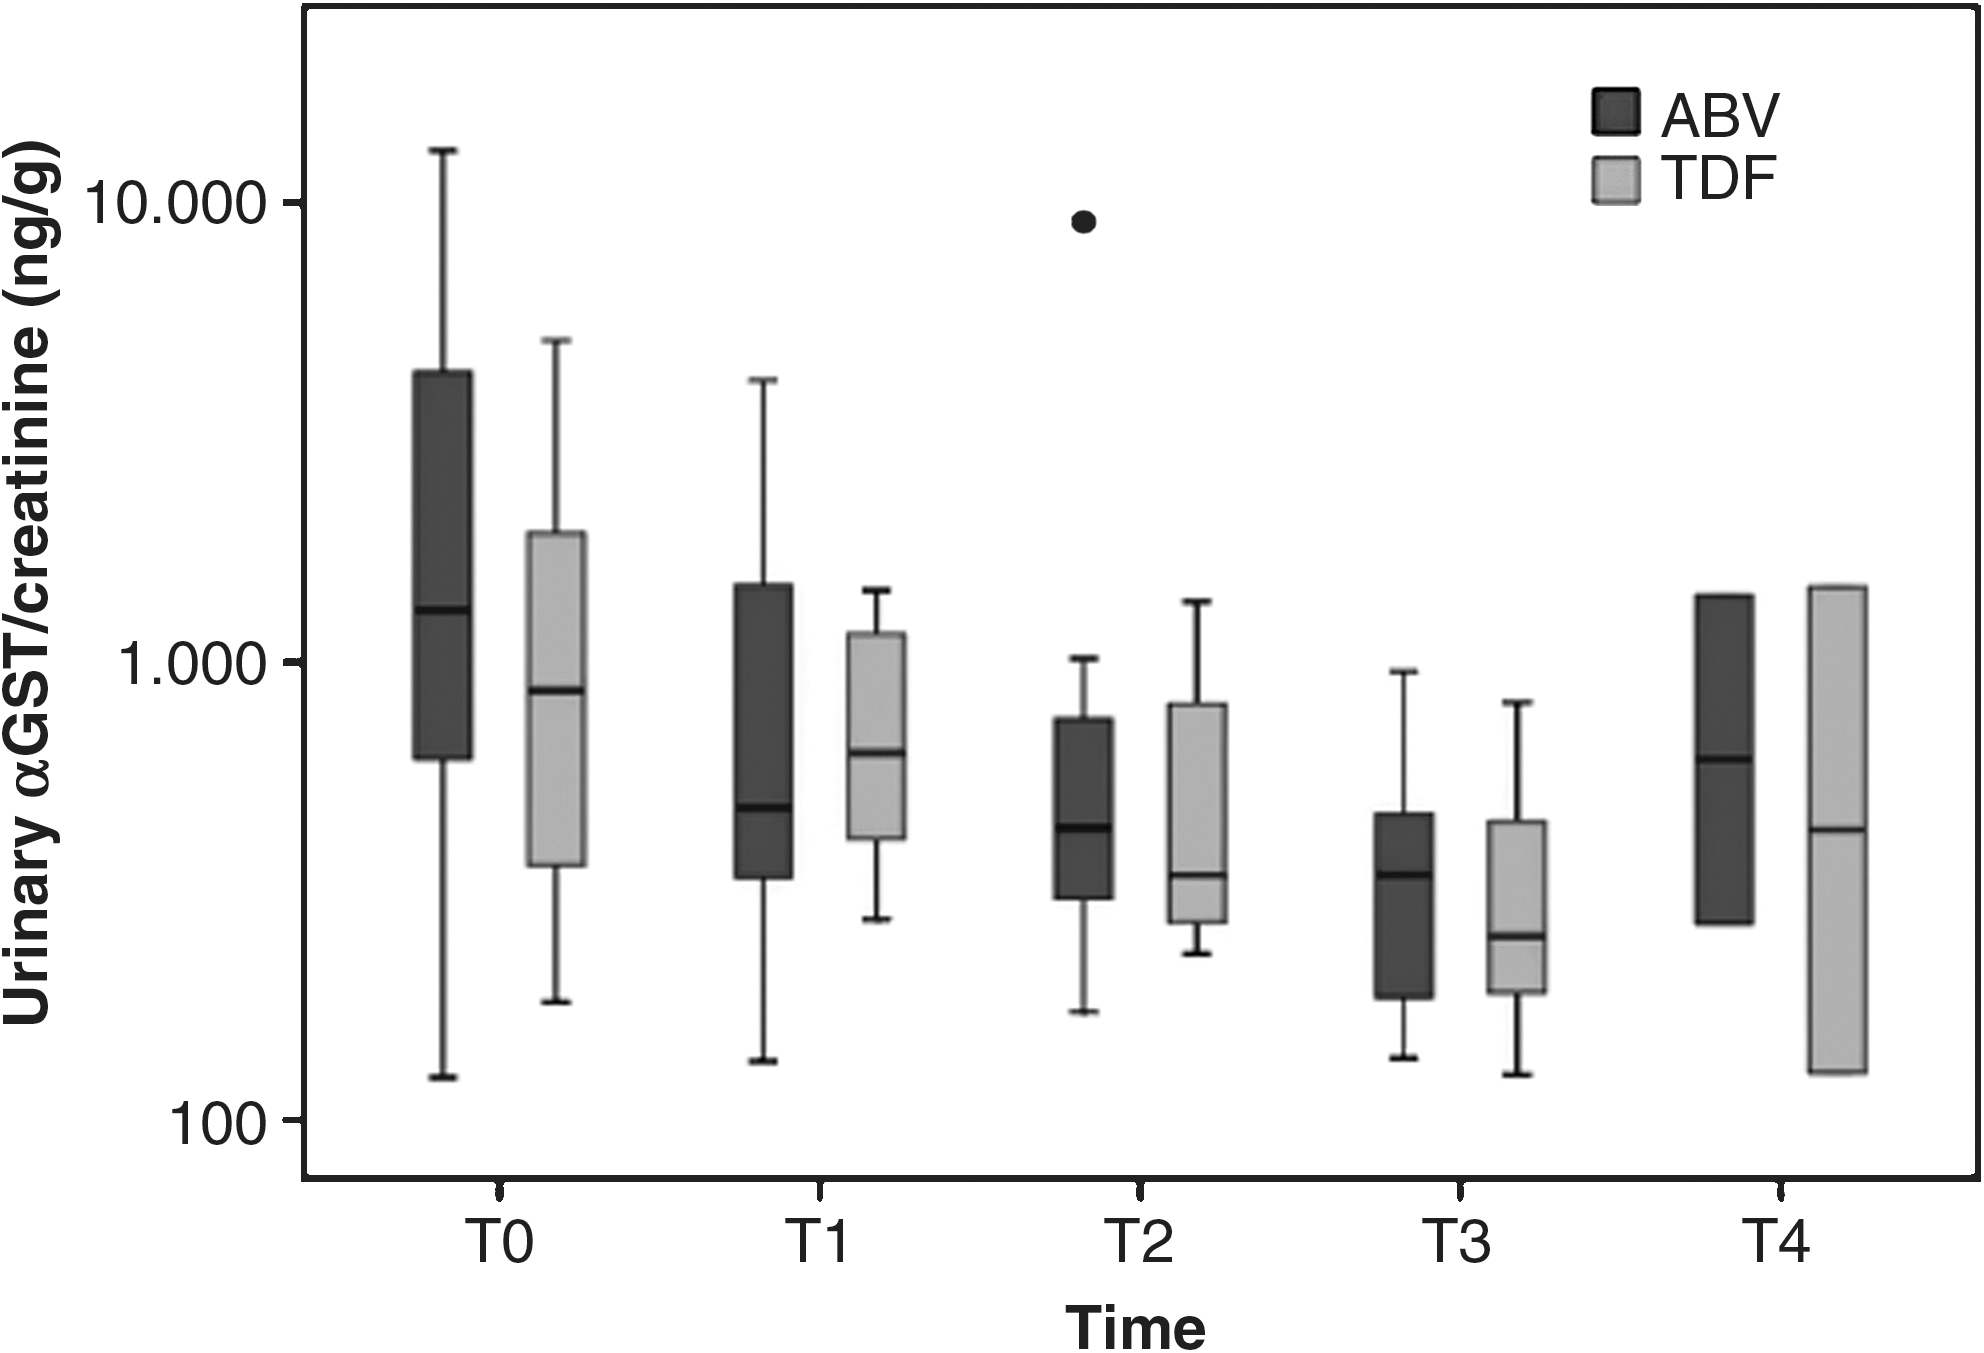
Boxplot graph of the urinary excretion levels of α-glutathione S transferase, (α-GST) in patients of the abacavir/lamivudine (ABV) or tenofovir disoproxil fumerate (TDF) groups at different time points. The dot of the T2 group represents an outlier.
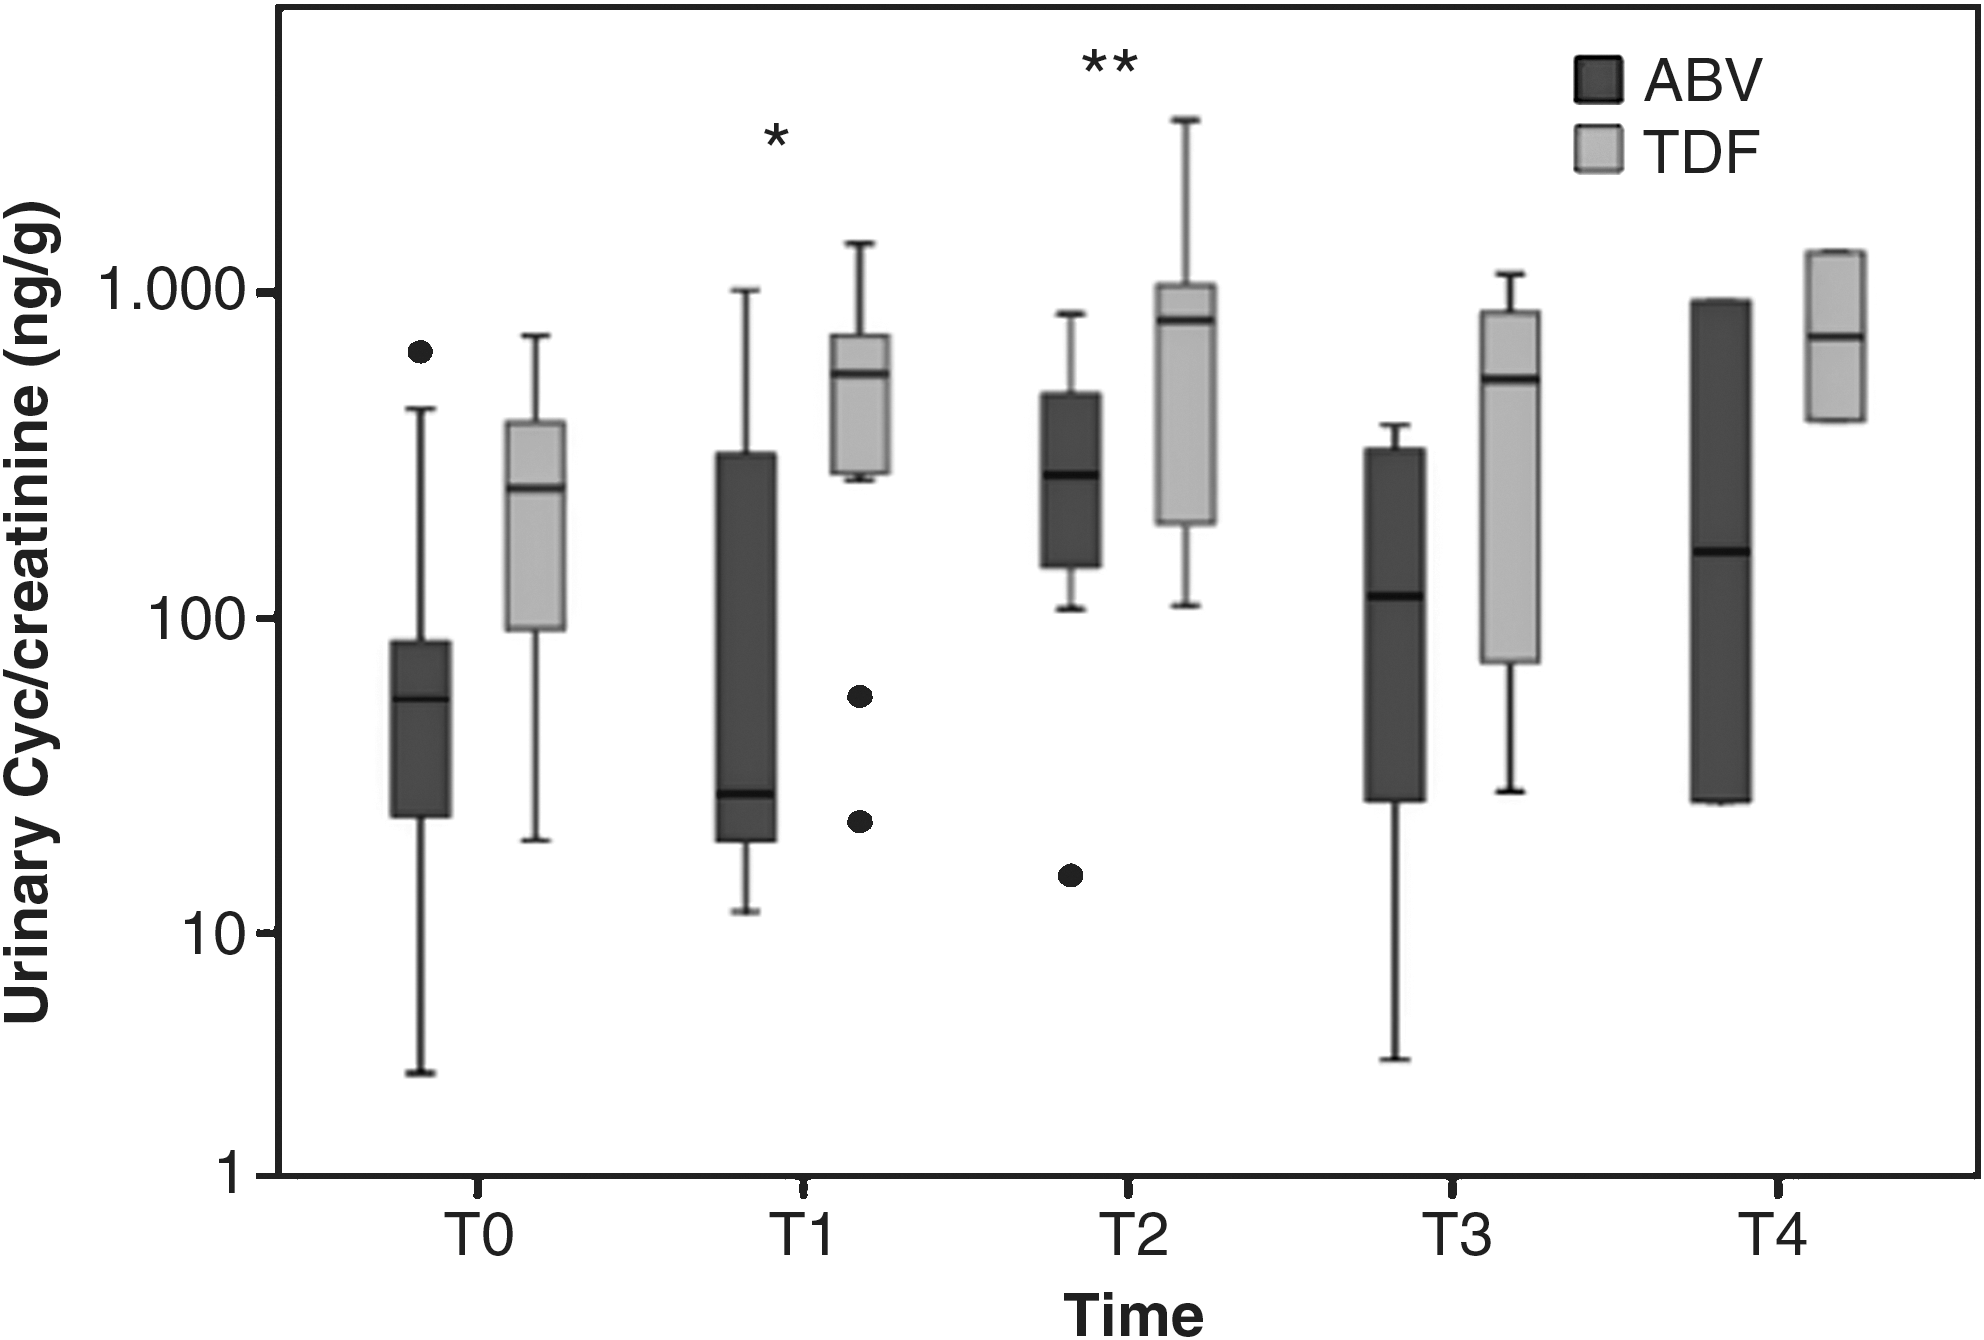
Boxplot graph of the urinary excretion levels of cytochrome c at different time points in patients treated with the abacavir/lamivudine (ABV) or tenofovir disoproxil fumerate (TDF) regimen. The dots and asterisks represent outliers.
Discussion
Our data show that treatment of HIV patients with a TDF-based regimen, compared to an ABV-regimen did not produce alterations of classical renal pathophysiologic parameters (eGFR, proteinuria, or microalbuminuria, serum phosphate) after a 12-month treatment period.
We assessed, for the first time, more sensitive and early markers of a possible tubular involvement and found an increase in urinary phosphate excretion in the group of patients receiving TDF in comparison to the ABV-treated patients. The increased urinary elimination of phosphate was evident at the late time points (6 and 12 months) after starting the NRTI therapy. Also, another sensitive pathophysiologic marker of a putative tubular damage was represented by an increased fractional urinary excretion of urate that occurred upon TDF treatment, compared with the ABV treatment.
On the side of a pathogenetic marker of tubular damage, we chose to evaluate the urinary levels of two enzymes that are released by damaged tubular cells. α-GST is a marker of cytosolic damage of proximal tubular cells; in our patient population, we did not find a clear pattern of α-GST excretion, with fluctuating levels in both groups and no statistical difference in any of the time points studied. Perhaps, this finding is not unexpected since α-GST increases in urine only under condition of a marked tubular damage, apoptotic tubular cell shedding, and cell necrosis, associated with deterioration of renal function. 16
The other marker analyzed was the urinary concentration of Cyc. Previous experimental studies had already demonstrated that under an anoxic insult to the proximal tubule in rats, this mitochondrial enzyme can migrate from inside the mitochondrion, cross the internal and external membranes, and gain access to the cytosol of cells. Moreover, it has been demonstrated that the Cyc released from mitochondria is toxic for the cells and may induce apoptosis. This latter effect is mediated through the binding with apoptotic protease-activation factors (Apaf-s), subsequent caspase-9 recruitment, with the formation of the apoptosome and downstream caspase (−3 and −7) activation that are strictly linked to the apoptosis phenomenon. 12 Finally, the released Cyc can cross the plasma membrane and pass into the tubular fluid and eventually be found in the urine. 14 Data from the same group had demonstrated that extracellular Cyc release is a more sensitive marker of a toxic injury to proximal tubular cells exposed to radiocontrast agents, compared to more canonic markers like lactate dehydrogenase (LDH). 17 Therefore, extracellular Cyc release and, in turn, Cyc enzymeuria is a sensitive marker of a functional mitochondrial impairment that may precede tubular dysfunction.
Given the specific target of the proximal tubular cellular toxicity that follows exposure to TDF, we then chose to assess urinary concentrations of this enzyme as an early, specific, and sensitive marker of tubular toxicity of TDF. Our data show that after starting the TDF/emtricitabine therapy, there was an increase in the urinary concentration of Cyc in comparison to patients treated with ABV/lamivudine. The increased urinary Cyc reached its maximum after 3 months of drug exposure, at a time when no other major pathophysiologic parameters were altered. More importantly, after peaking at 3 months, the urinary levels of Cyc subsided to near-normal levels in the TDF group. A certain increment of urinary Cyc levels was also observed in the ABV-group to a much less degree. However, the difference in absolute Cyc excretion between TDF and ABV groups was statistically significant at T1 and T3. It has been reported that after an oxidative or toxic injury to the proximal tubular cells, the release of Cyc subsides as a result of the exhaustion of the amount of cellular levels of mitochondrial Cyc. 14 We therefore can hypothesize either that the reduction of urinary Cyc levels at the late time points may depend on such an exhaustion of mitochondrial Cyc content in a damaged proximal tubule, or the reduction of Cyc is due to an offset of a transient and early tubular damage linked to the exposure to TDF, although some functional alterations may persist longer. Based on our global data and the paucity of the pathophysiologic alterations we favor the second hypothesis.
Other evidence of mitochondrial toxicity in TDF-exposed patients comes from studies performed on kidney tissue of patients treated with TDF. These patients, showed significantly reduced levels of mtDNA under certain conditions, like the coadministration of didanosine compared to other patients never treated by TDF or HIV-negative patients. 18 Moreover, a recent report on the morphologic aspects of renal toxicity of TDF emphasized a specific finding represented by the presence of eosinophilic intracytoplasmic inclusions compared to other forms of toxic acute tubular necrosis. The authors were able to identify such inclusions as giant mitochondria, once again underlining the specific damage produced to these organelles in cases of renal toxicity of TDF. 19 However, other experimental studies have confirmed the role of TDF in inducing significant mitochondrial toxicity targeted to proximal renal tubular cells, and sparing other metabolically active cells like hepatocytes. 20,21
From this study, it is relevant to note a consequential occurrence of an increase in urinary Cyc excretion at the early time points and an increased phosphaturia in the late time points that was clearly evident in the group of patients treated with TDF. Therefore, we hypothesize that a low-grade tubular dysfunction occurs after accumulation of TDF in proximal tubular cells, as evidenced by an increased excretion of phosphate and a reduced capability to reabsorb urate, which do not have an immediate clinical correlate. In fact, subclinical evidence of tubular injury, represented by an increased urinary low molecular weight protein excretion in patients treated by TDF or highly active antiretroviral therapy (HAART), in respect to naïve patients, has been reported. 4
We also hypothesize that the convergence of other potentially pathogenetic factors or clinical comorbidities may expose TDF-treated patients to overt renal damage with tubular involvement culminating in Fanconi's syndrome 32 and/or reduced GFR, or acute kidney injury 19 as has been reported in certain conditions. 1 The clinical significance of having increased urinary phosphate excretion is strictly correlated with the possibility of developing a reduced bone mineral content and osteoporosis. Metabolic bone disease has been amply described in HIV-positive patients and seems to depend on both the HIV infection per se and the effect of the HAART. 22 Some reports have also dealt with a causative role of NRTIs in general, and TDF in particular, in inducing bone mineral content loss. 23
Another finding of this study is the significant, although minimal, reduction of the serum potassium levels in patients treated with the abacavir/lamivudine regimen, in respect to the tenofovir/emtricitabine-based therapy. The reduced levels of serum potassium were not due to an increased urinary potassium excretion, since this parameter was in the average lower in ABV group, as a consequence of the reduced plasma potassium. At this time, we do not have an explanation for this finding, since no other reports have dealt with serum potassium levels and either abacavir or lamivudine treatment.
This study does have limitations. The majority of enrolled patients were already exposed to ARV therapy, which may have caused a certain predisposition to renal damage. However, patients were evaluated longitudinally and analyzed in respect to the exposure to one of the two different NRTI-based regimes; we then could compare the outcomes in each group that represented at baseline a control by itself, before starting the exposure to the specific drug regimen.
A numeric imbalance between the two groups existed. Randomization was not performed in this pilot study, also in view of a need to avoid the use of abacavir in certain patients, according to the presence of the specific HLA B*57:01 antigen that may evoke a hypersensitivity reaction. 24,25 Patients enrolled in this study were screened for the presence of the HLA B*57:01 antigen.
In conclusion, the present study shows that patients exposed to tenofovir likely have low-grade tubular mitochondrial damage, which can be evidenced by an increased urinary excretion of Cyc after 1 and 3 months of drug treatment. Interestingly, the increased Cyc enzymuria precedes or accompanies other sensitive and early markers of tubular damage, namely an increased phosphaturia or increased urinary fractional excretion of urate.
Footnotes
Author Disclosure Statement
V.M. received honoraria from Gilead Sciences and ViiV Healthcare. P.M. received honoraria from Gilead Sciences and ViiV Healthcare