




Abstract
The increased life expectancy among HIV-infected persons treated with combination antiretroviral therapy (ART), risk behaviors, and co-morbidities associated with ART place HIV-infected persons at risk for non-HIV-related causes of death. We used the San Francisco HIV/AIDS registry to identify deaths that occurred from January 1996 through December 2011. Temporal trends in AIDS- and non-AIDS-related mortality rates, the proportion of underlying and contributory causes of death, and the ratio of observed deaths in the study population to expected number of deaths among California men aged 20–79 (standardized mortality ratio [SMR]) of underlying causes of death were examined. A total of 5338 deaths were identified. The annual AIDS-related death rate (per 100 deaths) declined from 10.8 in 1996 to 0.9 in 2011 (p<0.0001), while the annual death rate from non-AIDS-related causes declined from 2.1 in 1996 to 0.9 in 2011 (p<0.0001). The proportion of deaths due to all types of heart disease combined, all non-AIDS cancers combined, mental disorders resulting from substance abuse, drug overdose, suicide and chronic obstructive pulmonary disease increased significantly over time. The SMRs for liver diseased decreased significantly over time but remained elevated. Our data highlight the importance of age-related causes of death as well as deaths from causes that are, at least in part, preventable.
Introduction
H
As one of the earliest HIV epidemic centers of the United States, San Francisco has been disproportionately affected by HIV. As of December 31, 2010, the San Francisco, California metropolitan statistical area (MSA) had the seventh highest HIV prevalence of all MSAs in the United States. 36 Although the number of persons newly diagnosed with HIV in San Francisco has declined in recent years, the emphasis in San Francisco on access to antiretroviral therapy, including early initiation of HAART, has resulted in a total of 15,705 persons living with HIV in San Francisco as of the end of 2012, of whom 51% were aged 50 years or older. 37 The size and age of the population living with HIV and the completeness of AIDS surveillance data in San Francisco provided an opportunity to examine trends in causes of death and to compare these causes among older and younger persons.
Methods
Persons with HIV/AIDS who reside in San Francisco are legally required to be reported to the San Francisco Department of Public Health. Over 80% of cases in San Francisco were reported through active surveillance whereby health department staff members review the medical records of HIV/AIDS patients and complete the case report form. Information collected included sociodemographic and risk characteristics, AIDS-related clinical data, and vital status. The completeness of HIV/AIDS case reporting is evaluated annually and has consistently found to be above 90%. 37,38 Death information was ascertained through monthly review of San Francisco death certificates, reports from the California State HIV/AIDS registry, and annual matches with the Social Security Death Master File and the National Death Index. The most recent match with the Social Security Death Master File included deaths through 2012 and the most recent match with the National Death Index included deaths through 2011.
All AIDS cases that occurred among people aged >12 years and who died from January 1, 1996, through December 31, 2011, were included in this analysis. Individuals reported with HIV who did not have AIDS were excluded because name-based HIV reporting was not in effect until 2006 and because of the small number of deaths in HIV-infected persons without AIDS (207 deaths from 2006 through 2011). The underlying and contributory causes of death were classified using the International Classification of Diseases 9th edition for deaths through 1998 and 10th edition for deaths that occurred during or after 1999. 39,40 In our analysis we included frequently occurring non-AIDS-related causes, as well as causes with known or suspected relationship to antiretroviral therapy, chronic HIV infection, or life style risk factors associated with HIV.
We compared the temporal trends in the AIDS-related and non-AIDS-related annual mortality rates in which the numerator was the single underlying cause of death and the denominator was the number of persons living with AIDS plus the number of persons who died each year. For subsequent analyses, we divided the years into four time periods based upon the distribution of deaths: 1996–1997, 1998–2001, 2002–2005, 2006–2011. Then we compared the demographic characteristics of decedents over each of these time periods. Next, to assess trends in multiple causes of death, we measured changes in the proportion of selected underlying and contributory causes of death in the four time periods. For this analysis the numerator was the number of deaths due to the selected cause (as either the underlying or a contributory cause) and the denominator was the total number of deaths for that time period. We also repeated this analysis using the single underlying cause only. For this analysis the numerator was the number of deaths due to the underlying cause and the denominator was all deaths in the time period. We calculated the standardized mortality ratio (SMR) and 95% confidence intervals of selected non-AIDS-related underlying causes of death in each of the four time periods. The SMR, the ratio of observed to expected deaths, was calculated by dividing the observed number of deaths by the expected number of deaths. Because there were so few AIDS deaths among women, we only calculated age and race adjusted SMRs among men using the California population of men aged 20–79 years as our standard population. 41 Lastly, we plotted the four most frequent non-AIDS underlying causes of death that occurred in any of the four time periods in three age groups (under 40 years, 40–49 years, and 50 years or more) to visualize these trends. Because the most frequently occurring deaths differed in the time periods, the number of causes examined in each age group differed between age groups. The chi square test was used to measure differences in the demographic characteristics of decedents using SAS version 9 (SAS Institute, Cary, NC). The Mantel-Haenszel chi square test for linear trend was used to measure changes in the proportions of causes of deaths across the four time periods (SAS version 9; SAS Institute, Cary, NC), in the annual death rates, and in the SMRs over time. 42,43
Results
There were a total of 5338 deaths reported in AIDS patients from 1996 through 2011. AIDS was the underlying cause of death in 3617 (68%) of the 5338 deaths. The annual death rate (per 100 deaths) from AIDS declined from 10.8 in 1996 to 4.0 in 1997, and to 3.0 in 1998, from which point the death rate slowly declined until 2010 when the death rate reached 0.9 where it remained in 2011 (p<0.0001 for linear trend, Fig. 1). The death rate from non-AIDS-related causes declined from 2.1 per 100 deaths in 1996 to 0.9 in 2011 (p<0.0001 for linear trend). In 2011, and for the first time, the number of AIDS-related deaths equaled the number of non-AIDS-related deaths.
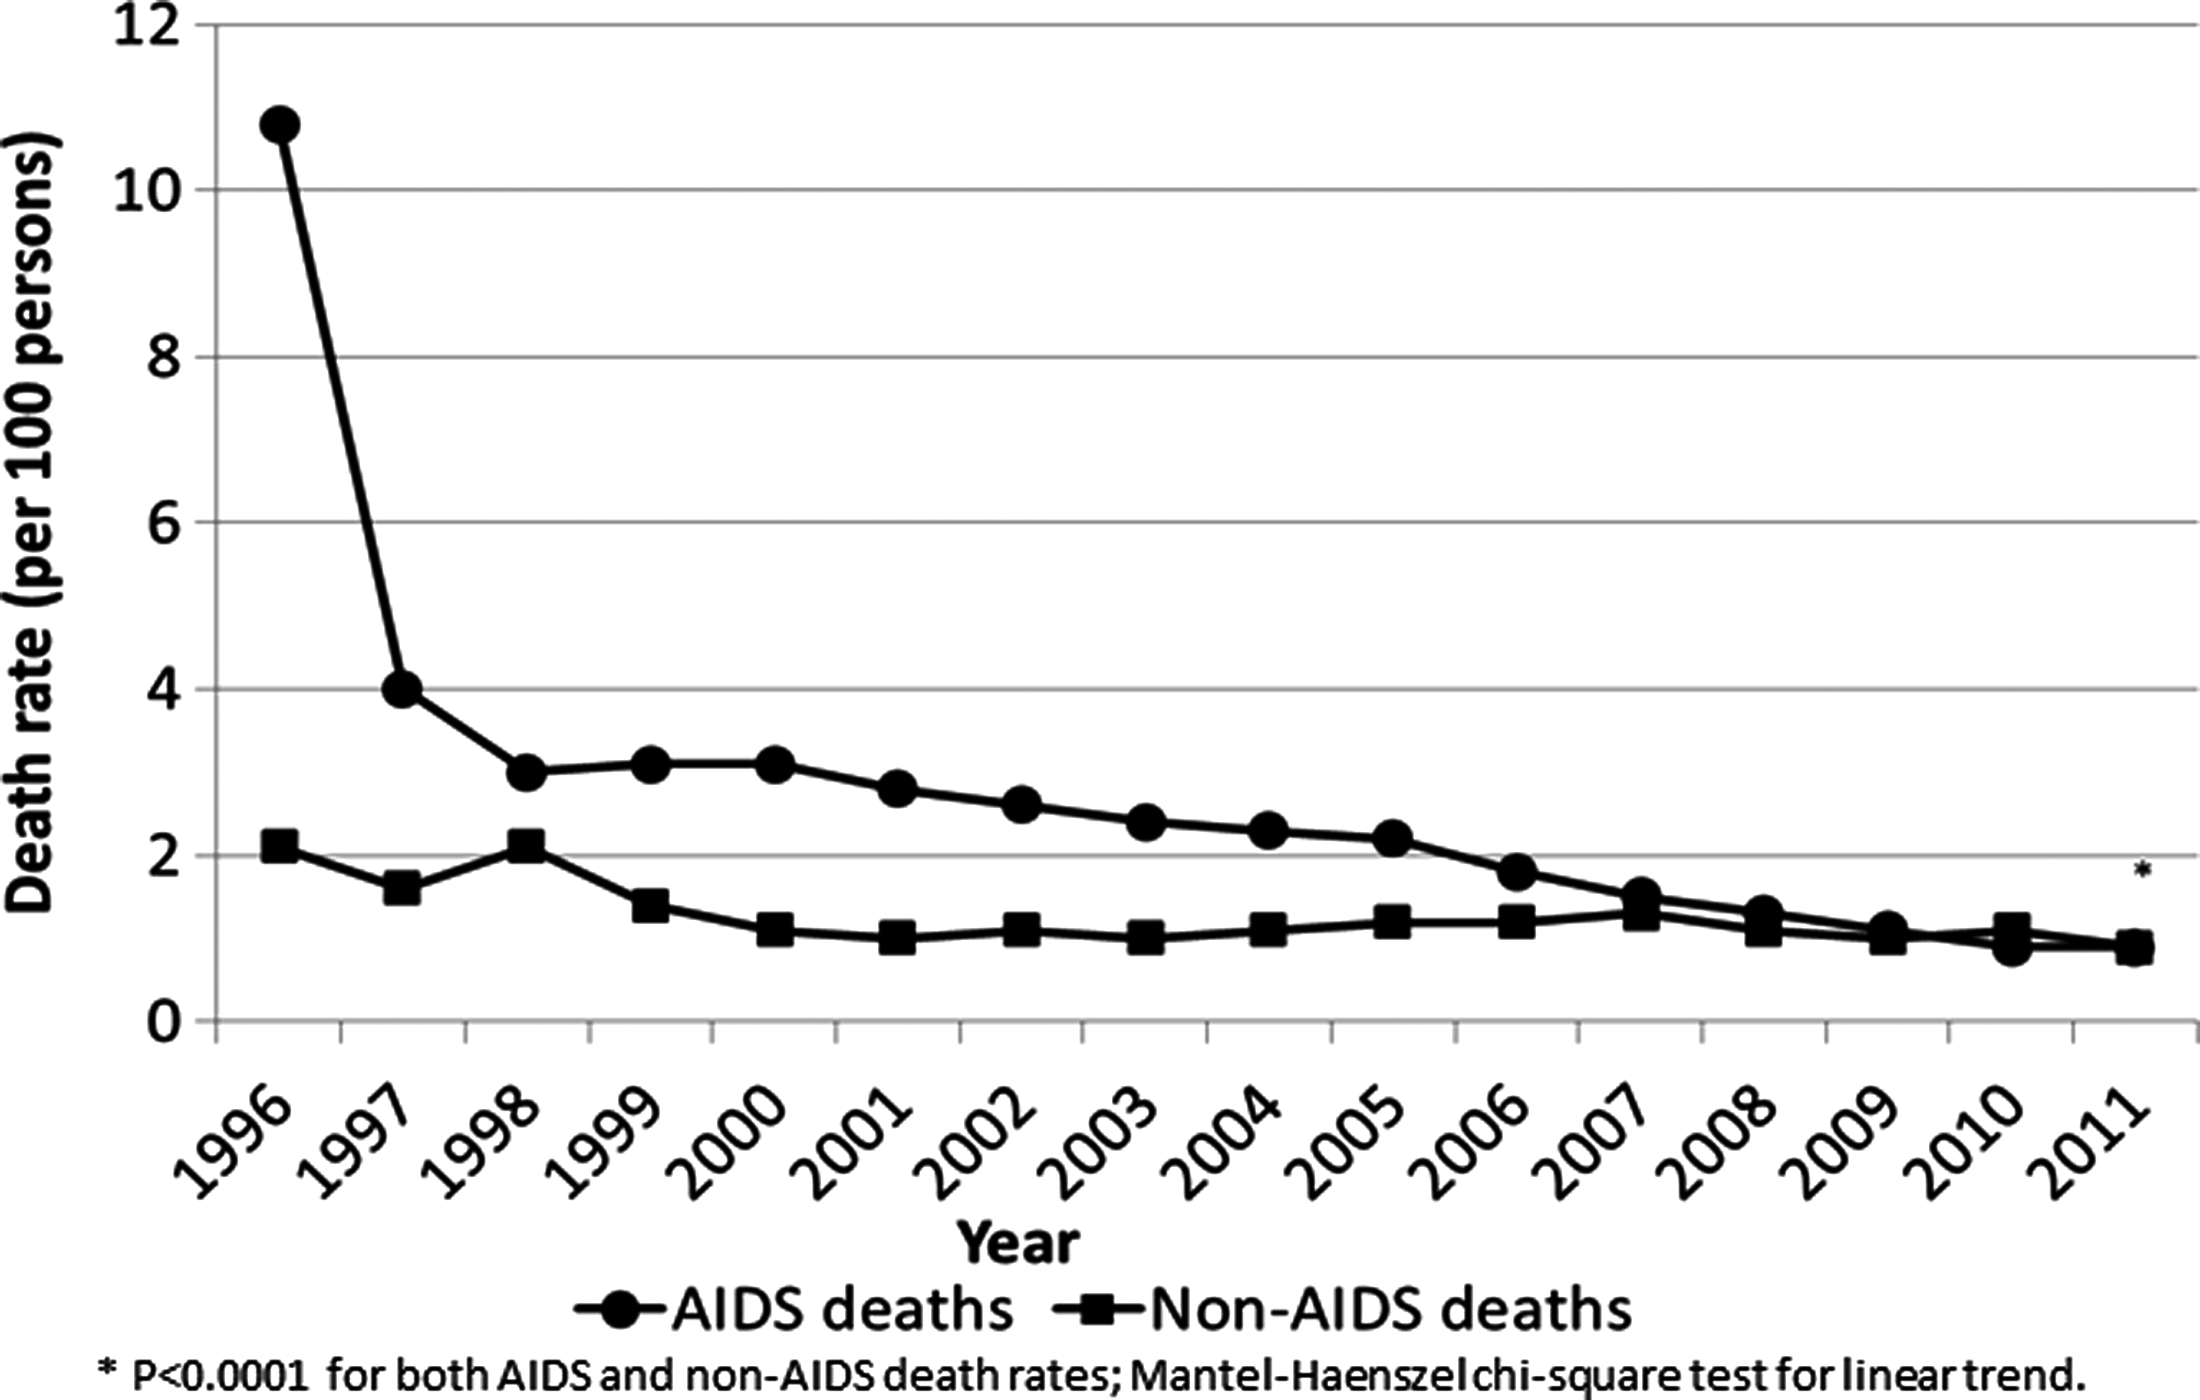
AIDS-related and non-AIDS-related death rates among San Francisco AIDS cases, 1996–2011.
The sociodemographic and risk characteristics of decedents changed significantly over the observation period. The proportion of deaths among men, Whites, Latinos, persons less than 50 years old at death, men who have sex with men, and persons with private insurance decreased over time (Table 1).
Chi square test; bmissing 563 records with unknown insurance status; cmissing 37 records with unknown country of origin.
The proportion of underlying and contributory AIDS-related causes of death was significantly different over the study period decreasing from over 90% in the period 1996 to 1997 to 72% in the period 2006–2011 (Table 2). The proportion of deaths due to all types of heart disease, coronary heart disease, all non-AIDS cancers, lung, liver, and anal cancers, mental disorders resulting from substance abuse, drug overdose, suicide, and chronic obstructive pulmonary disease were also significantly different, and increased over the four time periods. Deaths due to liver disease and viral hepatitis increased between each of the first three time periods and then declined in the most recent time period. Deaths from renal disease increased steadily over the first three time periods and remained relatively stable through 2006–2011. Among the non-AIDS causes of death, heart disease (n=1040), pneumonia (n=755), liver disease (n=665), non-AIDS cancers (n=595), and viral hepatitis (n=575) were the most frequent causes. When we restricted our analysis using underlying causes, only the trends in deaths due to anal cancer, renal disease, and septicemia were no longer statistically significant (p=0.1265, 0.2423, and 0.8203, respectively).
Individuals may have more than one cause of death; bMantel-Haenszel chi-square test; cpercent of total deaths within each time period.
The SMRs were elevated for heart disease beginning in the 1998–2001 time period and remained so through the most recent time period, while the SMRs for all non-AIDS cancers, lung, liver, and anal cancers were elevated in all four time periods, with the highest SMR observed for anal cancer (Table 3). Although the number of observed deaths from liver disease was significantly higher than the number of expected deaths in all time periods, the SMRs declined from 5.29 (95% CI 3.02–8.58) in the first time period to 1.53 (95% CI 1.00–2.24; p=0.01) in the last time period.
Observed deaths are non-AIDS-related deaths that occurred among men with AIDS between ages 20–79 years during the years 1996–2011; expected deaths were derived using cause-specific death rates among California men, aged 20–79 years and adjusted for race and age.
Mantel-Haenszel chi-square test for linear trend; bthe number of expected deaths was rounded to one decimal place except for when the expected number of deaths was less than one in which case the number was rounded to two decimal places.
The most frequently occurring underlying non-AIDS causes of death differed by age group and calendar period (Fig. 2). The proportion of deaths due to all non-AIDS causes combined increased with age. Among those who died before age 40, deaths from drug overdose and suicide accounted for higher proportions of deaths than most other non-AIDS causes, and both of these causes showed sharp proportional increases in the most recent time period. Among persons who died between ages 40 and 49 years, deaths from drug overdose were also proportionately higher in the most recent time period. In contrast to younger decedents, the proportion of deaths due to non-AIDS cancers and heart disease increased in older age groups. For persons who died at age 50 years and above, deaths from non-AIDS cancers and heart disease were proportionately greater than other causes and increased over time. As was observed with the other age groups, deaths due to overdose were relatively frequent and showed a sharp increase between the calendar periods 2002–2005 and 2006–2011.

The proportion of deaths due to non-AIDS causes among San Francisco AIDS cases by age group and calendar period, 1996–2011.
Discussion
We observed marked declines in the absolute number of deaths among persons with AIDS and in the rates of AIDS-related and non-AIDS-related deaths, with greater declines observed in AIDS-related deaths than non-AIDS-related deaths. The decline in deaths due to AIDS-related causes likely reflects better clinical management of HIV infection, including the widespread use of antiretroviral therapy. This has led to HIV-infected adults reaching ages at which non-AIDS causes of death, such as cancer and heart disease, are increasingly common. Our study, as well as others, demonstrated an increase in the proportion of deaths due to non-HIV causes. 1 –8
The elevated risk of death from non-AIDS cancers, heart, and liver disease across nearly all time periods among persons with AIDS compared to the general male population, merits careful examination to identify areas to target for prevention and early detection. Our finding of the increase in deaths from heart disease beginning in 1998 may be due, at least in part, to the use of protease inhibitors that have been shown to increase the risk of cardiac disease. 28,30,31 The elevated risk of death from lung, anal, and liver cancers, coronary heart disease, and liver disease are, at least to some degree, and either directly or indirectly, due to behaviors such as use of tobacco and alcohol, anal sex, and injection drug use that occur in higher frequency among HIV-infected adults than the general adult population, 19 –23 as well as from the lack of specific guidance for screening HIV-infected persons for non-AIDS cancers 44 and inadequate adherence to hepatitis screening and treatment guidelines. 45,46 Re-evaluation of the risks and benefits of cancer screening for HIV-infected persons, particularly those with substantial tobacco exposure and anal sex, as well as renewed focus on adherence to screening and treatment guidelines and on primary prevention through programs to prevent or eliminate tobacco and other substance use are warranted.
Non-AIDS causes of death accounted for a higher proportion of deaths in older adults over the duration of the study, with cancer and heart disease accounting for larger proportions of non-AIDS causes. The excess risk of these diseases, after adjusting for age and race, supports the hypothesis that HIV infection and its sequelae contribute to the development of non-AIDS-related diseases.
Among adult AIDS cases under 40 years old, deaths from overdose accounted for a substantial proportion of non-AIDS deaths. In addition, we observed a sharp increase in this proportion between the calendar periods 2002–2005 and the most recent period. Though less dramatic, increases in deaths due to overdose were observed in the other age groups during the same periods. This mortality pattern among adults under 40 years old is also reflected in the general population of San Francisco, and may reflect increases in overdose from prescription opioids (P. Coffin, M.D., personal communication, January 7, 2013). 50–54
Limitations to this study must be considered. The mortality data come from death certificates; causes of death may be under-reported or misclassified, particularly those associated with social stigma. Additionally, contributory causes of death may have been incomplete if the person completing the death certificate was not familiar with the patient's full medical history. Our data also come from a single city where men who have sex with men account for the vast majority of cases. As such, our ability to characterize deaths among injection drug users, women, and heterosexual men is greatly limited. We examined deaths among persons with a prior AIDS diagnosis; while there may be important information obtained from studying deaths among HIV-infected persons prior to the development of AIDS, the number of deaths in San Francisco among HIV-infected persons who did not have AIDS was too small for meaningful analysis. In our analysis of multiple causes of death, the number of comparisons may have resulted in over estimating significance. To assess this, we conducted the analysis using the Bonferroni correction; only trends in anal cancer did not remain statistically significant.
Our findings contribute to the growing number of reports demonstrating decreases in deaths among adults with AIDS and a shift to increasing proportions of deaths due to non-AIDS causes and expand the literature by describing these non-AIDS causes and their frequency in younger and older persons. Although aging of the HIV-infected population contributes to the development of and death from non-AIDS causes, our data highlight the importance of deaths from causes that are, at least in part, preventable. As the prevalence and age of the HIV-infected population continues to increase in the United States and elsewhere, more can, and should be done to prevent premature death in this ever growing population.
Footnotes
Acknowledgments
The authors wish to thank Dr. George Rutherford for his critical review of the article and the San Francisco Department of Public Health HIV Epidemiology Section staff for their collection of HIV and AIDS surveillance data.
Financial support for this analysis was provided through the Centers of Disease Control and Prevention cooperative agreement number 5U62PS001000-02.
Author Disclosure Statement
No competing financial interests exist.