
Abstract
On a population level, trends in viral load (VL) and CD4 cell counts can provide a marker of infectivity and an indirect measure of retention in care. Thus, observing the trend of CD4/VL over time can provide useful information on disparities in populations across the HIV care continuum when stratified by demography. South Carolina (SC) maintains electronic records of all CD4 cell counts and HIV VL measurements reported to the state health department. We examined temporal trends in individual HIV VLs reported in SC between January 1, 2005 and December 31, 2012 by using mixed effects models adjusting for gender, race/ethnicity, age, baseline CD4 count, HIV risk category, and residence. Overall VL levels gradually decreased over the observation period. There were significant differences in the VL decline by gender, age groups, rural/urban residence, and HIV risk exposure group. There were significant differences in CD4 increases by race/ethnicity, age groups, and HIV risk exposure group. However, the population VL declines were slower among individuals aged 13–19 years compared to older age groups (p<0.0001), among men compared to women (p=0.002), and among people living with HIV/AIDS (PLWHA) with CD4 count ≤200 cell/mm3 compared to those with higher CD4 counts (p<0.0001). Significant disparities were observed in VL decline by gender, age, and CD4 counts among PLWHA in SC. Population based data such as these can help streamline and better target local resources to facilitate retention in care and adherence to medications among PLWHA.
Introduction
T
Over time there has been a disproportionate impact of the HIV endemic on the Southern US in terms of the overall number of PLWHA, as well as survival rates after HIV/AIDS diagnosis. 5 In 2011, 50% of all new HIV diagnoses occurred in the South, which had the highest rate (20.9) of new HIV diagnoses per 100,000 persons. 6 The Southern states most impacted by the HIV epidemic share socio-demographic and economic characteristics that may promote disease transmission. 5,7 This inequity is especially prominent in African American (AA) men who have sex with men (MSM), women, and rural residents. 8 –10 HIV-related stigma, high rates of incarceration, and poverty may be responsible for the HIV burden in these states. 7 South Carolina (SC), a predominantly rural state, has consistently ranked in the top ten in the US in the annual AIDS case rate for the past several years. At the end of 2011, SC ranked 8th in the nation with an annual AIDS case rate of 13.7 per 100,000. 11 The number of PLWHA in SC has increased from 14,088 in 2007 to 15,142 in 2011 (an increase of about 7.5%). Racial disparities are evident with AA carrying a greater burden of the disease, and constituting 72% of the total PLWHA in the state. 12 SC also ranked first in the rural prevalence of PLWHA (320.0 per 100,000) among the 28 states that provided county-level information on numbers of PLWHA in state surveillance reports. 13 Further, recent studies on retention in HIV care found that a large proportion of PLWHA in SC failed to remain in care on a regular basis. 14 –16 These trends may be due in part to provider attitudes and practices regarding HIV testing and linkage to care, as HIV screening, early diagnosis, entry, and retention in care are important components relating to disparities in HIV outcomes. 17 Given the HIV burden in SC and the need to focus on retention in HIV care within the context of the National HIV/AIDS Strategy goals, 18 it is important to assess the trends in VL using statewide data. Such assessment not only provides insights into changes in the HIV epidemic over time, but also allows us to identify associated disparities.
Many studies have reported disparities in VL outcomes among subpopulations defined by geographic, demographic, socio-economic, and behavioral characteristics. 19 –23 A few studies have examined community VL (CVL) and its impact on HIV incidence rates. The CVL is an average VL of a community and represents an aggregate measure for that particular community 24,25 where the unit of analysis is a community. In contrast, in individual VL analysis, the unit of analysis is an individual. The individual VLs can be modeled by different individual characteristics to examine trends over years.
In the past, investigators have examined complete healthcare systems data spanning multiple medical facilities from a particular state to analyze various HIV outcomes. 26,27 To our knowledge, no previous studies have examined the trends in individual VL using complete statewide data. The purpose of our investigation is to examine statewide trends in individual VL over time among PLWHA and identify disparities, if any, by gender, race/ethnicity, age group, HIV risk exposure group, and current residence.
Methods
This population-based surveillance data analysis was conducted after securing approvals from the Institutional Review Boards of the University of South Carolina and SC Department of Health and Environmental Control (DHEC).
Sample and setting
Data for this study were obtained from the SC enhanced HIV/AIDS Reporting System (SC e-HARS) surveillance database. SC has had mandatory confidential HIV/AIDS reporting since 1986. Since January 2004, laboratories are legally mandated to report all CD4 count and VL measurements to the SC DHEC. 28 These data are stored in the SC e-HARS surveillance database along with patient's socio-demographic characteristics. The SC e-HARS database quality rating exceeds the CDC minimum standards of reporting timeliness with 95% of new cases being reported within 6 months of HIV diagnosis and 98% of all HIV cases reported. 29 The sample included all SC residents aged ≥13 years old who were living with HIV between January 1, 2005 and December 31, 2012 and who had at least two reported VLs during the study period.
Variables of interest
Age was grouped as 13–19, 20–29, 30–39, 40–49, 50+ years, gender (male or female), race/ethnicity [black, non-Hispanic (black); white, non-Hispanic (white), or Hispanic/others], HIV risk exposure group [heterosexual, MSM, injecting drug users (IDU) and others (no identified risk and no risk reported)], and current residence (rural or urban). Age was determined based on the age of the individual on January 1, 2005 or at the time of first entry into e-HARS for individuals newly identified after January 1, 2005. Current residence was determined by the last reported residence. Urban/rural was defined according to the SC State Budget and Control Board definition; residence was considered “urban” if the largest city in the county had at least 25,000 inhabitants and “rural” if otherwise. 30
The first (baseline) CD4 and VL counts were defined as the first value reported to e-HARS after January 1, 2005 or at the time of diagnosis for newly identified HIV-infected individuals, and last values were the last available values reported to e-HARS. The first CD4 cell counts were grouped into four categories: ≤200, 201–350, 351–500, and >500 cells/mm3. All undetectable VL values reported during the study period were replaced with 200 copies/mL following the CDC guideline 31 because the undetectable level changed during our study period. VLs were divided into two categories: ≤200 (undetectable) and >200 copies/mL (detectable). The VL was treated as a continuous variable for all the calculations following log10 transformation because the distribution of VLs was highly skewed.
Statistical analysis
Descriptive statistics were used to examine demographic characteristics of the sample. Frequencies and percentages were used to summarize the number of PLWHA by gender, race/ethnicity, age group, current residence, and HIV risk exposure group. Wilcoxon signed-rank test was performed to compare first and last CD4 and VL counts by gender and current residence, while Kruskal Wallis test was used to compare the counts by age group, race/ethnicity, and HIV risk exposure group. To evaluate the VL trends over time, we developed a mixed effects model incorporating the linear, quadratic, and cubic terms for time and race/ethnicity, gender, age group, current residence, HIV risk exposure group, and CD4 count. CD4 count was used as a time variant covariate in the mixed model analysis. For individuals who provided multiple VL measurements during the study period, the measurements from the respective individual in different times were correlated. To adjust for the repeated VL values by individual subjects over time, we used compound symmetry correlation structure in mixed effects models. 32 Using the mixed model, we compared slopes of different age groups, gender, race/ethnicity, rural/urban residency, CD4 count, and HIV risk exposure groups. All analyses were performed using SAS version 9.3.
Results
Table 1 summarizes the demographic characteristics and baseline CD4 and VL counts of the study population. From January 1, 2005 to December 31, 2012 there were 16,432 PLWHA in SC and 15,136 had at least two reported VL measurements. The total VL measurements used in the analysis were 183,684. Median age was 41 years (range 14–86 years). Men (n=10,488, 69.3%) and blacks (n=10,869, 71.8%) dominated the sample. The largest proportion of PLWHA belonged to the age group 40–49 years (n=5,193, 34.3%), followed by 30–39 years (n=3985, 26.3%). More than 70% PLWHA lived in urban counties. Mean baseline CD4 count was 384 cells/mm3 (range=0–1588 cell/mm3) and nearly one-third of the sample had baseline CD4 counts ≤200 cell/mm3. Another one-third of individuals had baseline CD4 count >500 cell/mm3. Baseline VL ranged from 10 to 50,000,012 copies/mL (mean 117,832.9 copies/mL and median 11,472 copies/mL). Only 22% of the sample had suppressed VLs (≤200 copies/mL).
First CD4 and VL counts were defined as the first available value after January 1, 2005, or at the time of diagnosis for newly identified HIV-infected individuals.
Figure 1 presents the mean VL over time stratified by gender, race/ethnicity, age, risk exposure groups, current residence (rural versus urban), and baseline CD4 count. We observed declines in VL for all subpopulations in SC from 2005 to 2012.
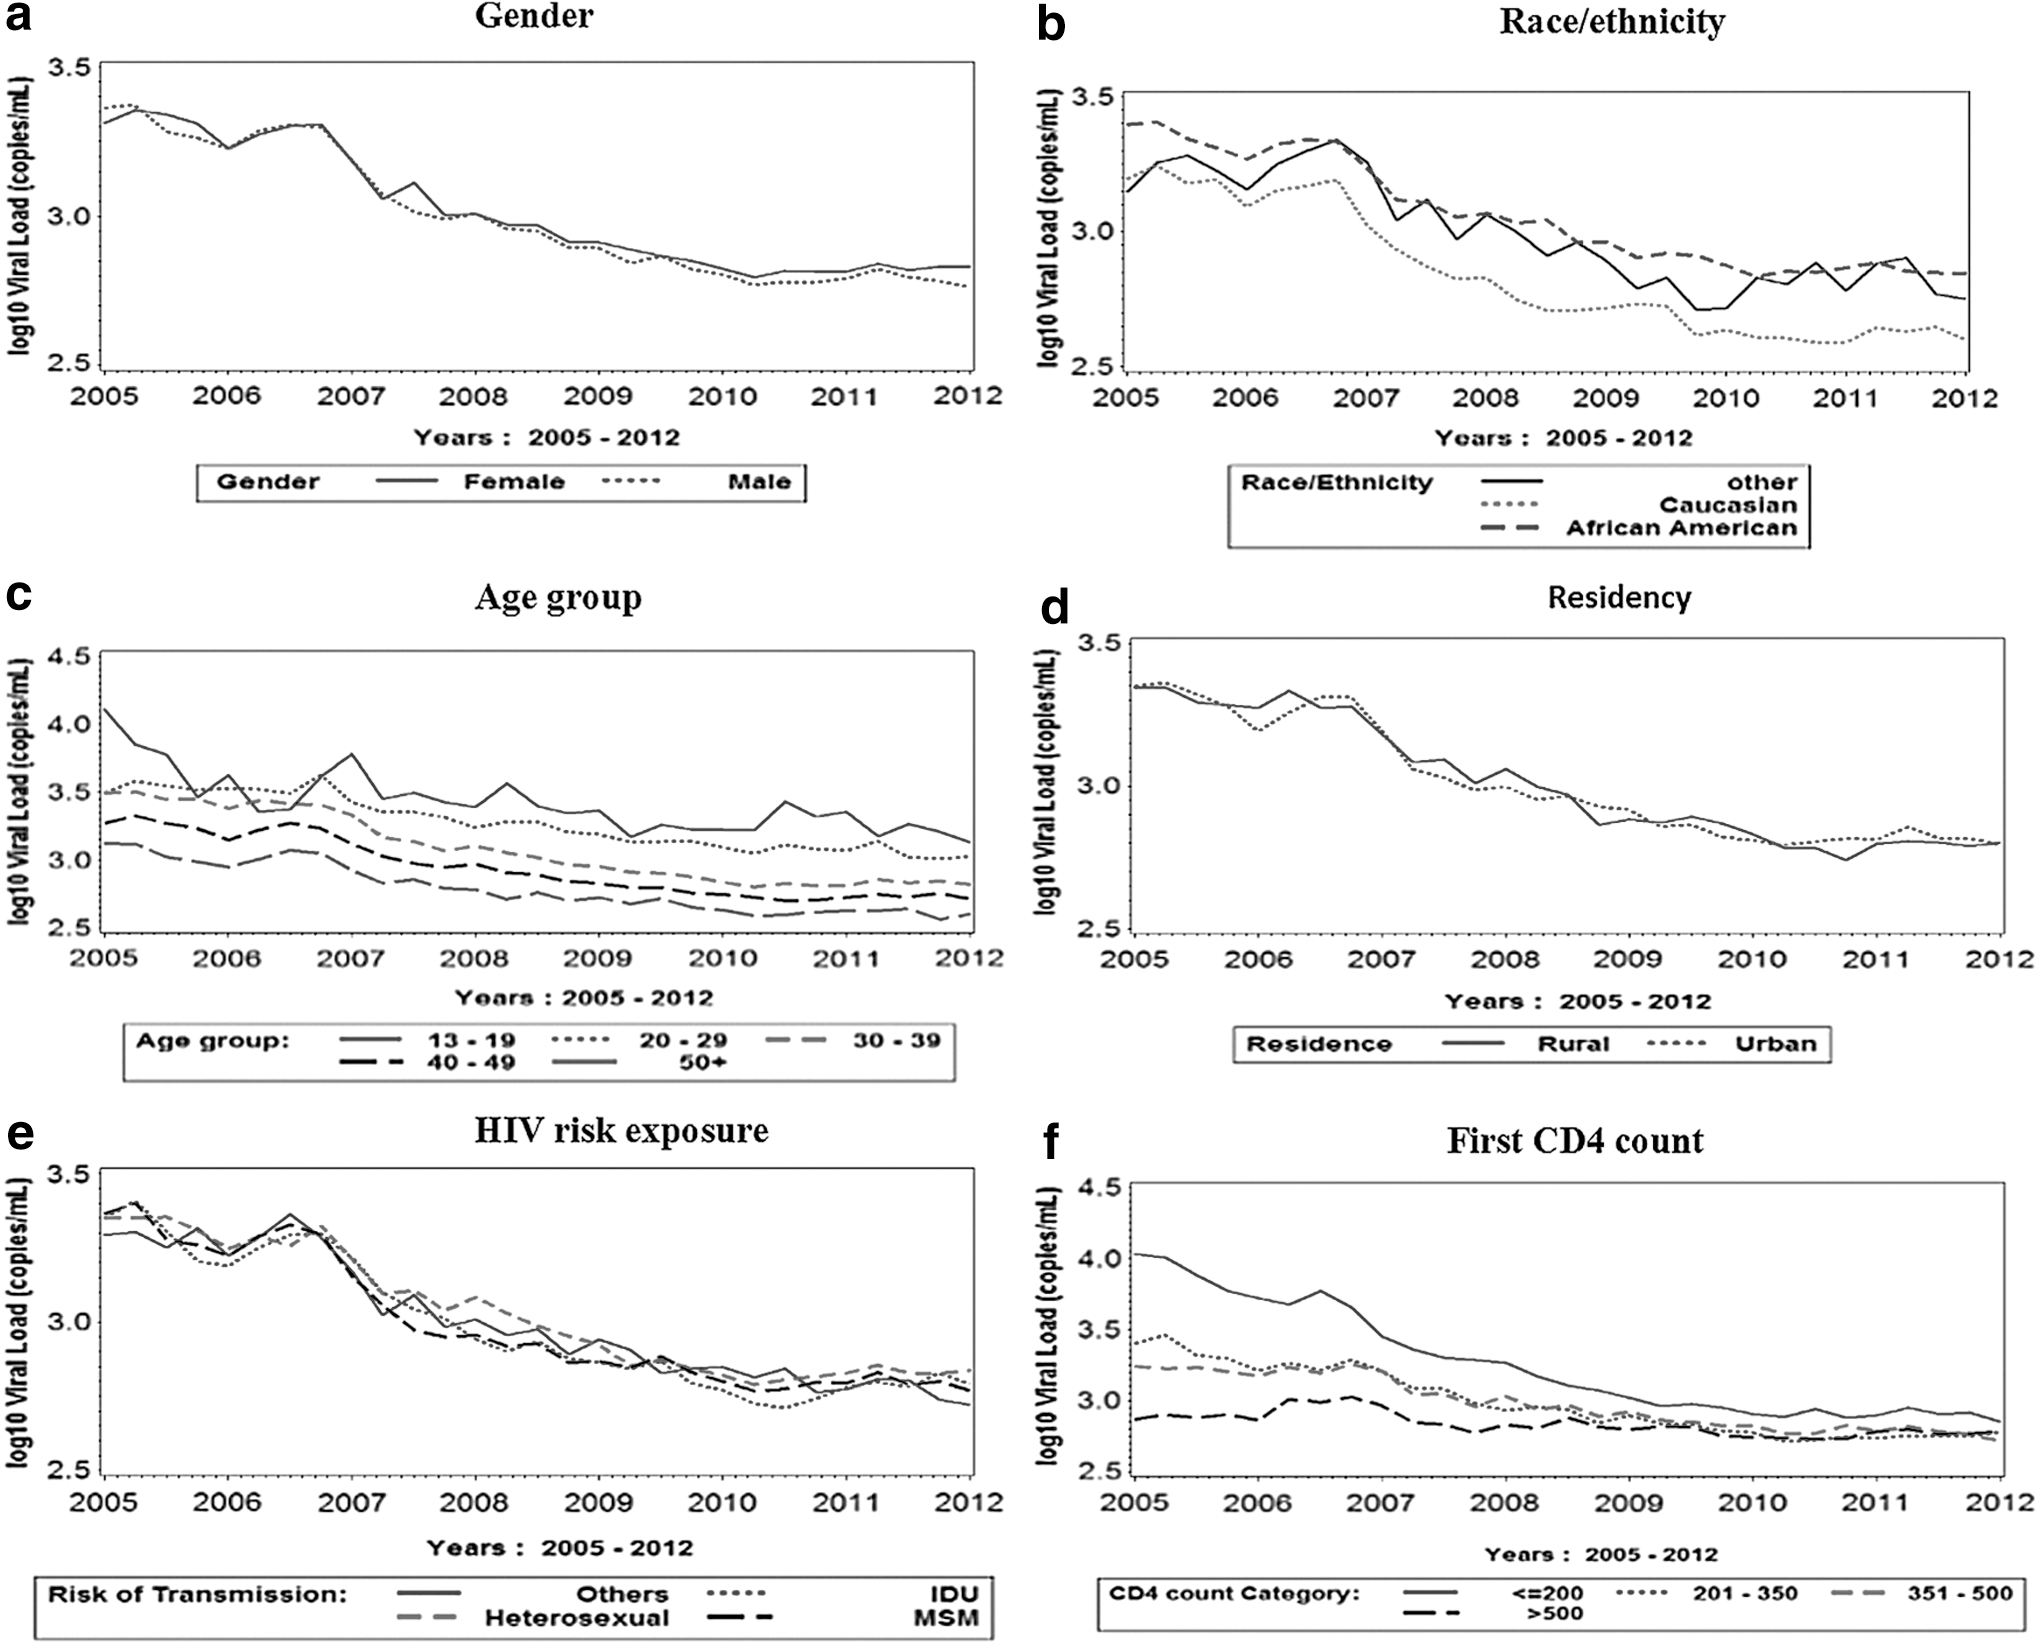
Mean HIV viral load over time by gender, race/ethnicity, age group, residency, HIV risk exposure, and first CD4 count in SC: January 1, 2005 to December 31, 2012.
Table 2 compares the baseline and the last reported CD4 and VL counts during the study period by age group, gender, race/ethnicity, rural/urban residency, and HIV risk exposure groups. Statistically significant differences in changes in VL and CD4 counts were found by age group, and HIV risk exposure groups. Statistically significant differences in VL decline, but not in CD4 counts increases were found by gender and rural-urban residence. Also, a statistically significant difference was found in CD4 count increases, but not in VL decline by race/ethnicity.
Baseline CD4 and VL counts were defined as the first available value after January 1, 2005, or at the time of diagnosis for newly identified HIV-infected individuals. Last CD4 and VL counts were the last available value in the dataset.
From the mixed model analysis (Table 3) we found notable disparities in VL trends (slopes) over time by gender (p=0.002), race/ethnicity (p<0.0001), age group (p<0.0001), CD4 count category (p<0.0001), and risk exposure group (p<0.0001). Current residence had no effect on VL trend (p=0.85). Compared to whites, blacks had a larger decline in VLs (p<0.0001) and whites maintained a lower average VL during the study period. Men had greater VL decline than women (p=0.002). Individuals aged 13–19 and 20–29 years had slower declines in VL compared to individuals who were 30–39 years (p=0.0021, <0.0001), 40–49 years (p<0.0001, <0.0001), and 50+ years (p<0.0001, <0.0001). VL in individuals aged 30–39 years declined slower than VL for individuals age 40–49 years (p<0.0001) and 50+ years (p<0.0001). The VL decline over time was greater for those aged 50+ years compared to 40–49 age group (p<0.0001). There was no significant difference in VL trends when we compared the groups aged 13–19 and 20–29 years (p=0.43).
Individuals with CD4 count ≤200 cell/mm3 had significantly slower decrease in VL over time than those with CD4 count 201–350, 351–500, and >500 cell/mm3 (all p values <0.0001). Similarly, VL declines in individuals with CD4 counts 201–350 and 351–500 cell/mm3 were slower than for those with counts >500 cell/mm3 (p<0.0001). We did not, however, observe any significant difference in VL decline between individuals with CD4 counts 201–350 and 351–500 cell/mm3. Individuals whose HIV risk exposure was MSM had significantly greater VL declines compared with individuals whose HIV risk group was classified as IDU (p<0.0001) and heterosexual (p<0.0001). Individuals whose HIV risk exposure was heterosexual had significantly greater VL decline compared to IDU (p=0.02), but had significantly lower VL decline compared to other risk groups (p=0.001).
Discussion
This study is the first to examine the trends in individual VLs in SC PLWHA during the period from January 1, 2005 through December 31, 2012. The findings highlight the disproportionate impact of the HIV epidemic and associated disparities in SC. Overall, the HIV epidemic in SC is dominated by men, blacks, adults aged 20–49 years, and urban residents. The proportion of blacks (71.8%) and women (30.7%) among PLWHA were higher compared to the national proportions (44% and 25%, respectively). At the national level, about 13% of the population is black and among PLWHA, 44% are blacks. In SC, blacks account for 27.9% of the overall SC population, but represent 71.8% of PLWHA. 32,33
Over time, the average VL has been decreasing for all PLWHA in SC. There are probably multiple factors influencing this trend. As treatment guidelines have changed to emphasize early diagnosis, treatment, and linkage to care, a greater portion of individuals are receiving ART. Similarly, as the ART regimens have become more potent and more easily tolerated, it is easier to maintain individuals on therapy and suppress their VL. On the other hand, it is possible that individuals with higher VL are not surviving as long leaving a healthier population with lower VL. However, we observed a slower decline among blacks compared to whites and other races. One possible explanation for the slower decline in VL amongst blacks compared to other race groups is poor engagement and retention in care. Blacks may have more barriers to initiating and remaining in care as well as have lower adherence to HIV medications compared to whites. Past research has highlighted such disparities among the different racial/ethnic HIV-infected population. 34 –36
The possible reasons for a slower decline in VL in men compared to women are less clear. Although some studies have shown that men are more likely to be late testers compared to women, 34 the body of research on healthcare utilization and adherence among women with HIV is mixed with many studies suggesting greater barriers, delayed care, and poor health outcomes for women. 37 The observed results showing more rapid VL declines in women in this investigation may be due to unmeasured biologic or behavioral factors (e.g., better adherence to HIV care and medications). This may also reflect earlier HIV diagnosis in women who are tested for HIV as part of prenatal care.
We observed a slower decline in VL among younger age groups compared to the older age groups. According to the CDC, 38 nearly 25% of new HIV infections occur in youth aged 13–24 years and about 60% of all youth with HIV are not aware of their HIV infection. It is likely that due to delayed screening and diagnosis, young adults may have higher VLs at baseline. Such higher VLs coupled with fragmented healthcare utilization among youth due to various reasons, 39,40 including HIV-related stigma, may result in slower decline in VLs. This is particularly critical in young black MSM who may experience additional layers of stigma not only related to HIV, but also related to their race and sexual orientation.
Individuals with baseline CD4 count ≤200 cell/mm3 had significantly lower average VL than those with baseline CD4 count 201–350, 351–500, and 500 cell/mm3 when we adjusted for gender, race/ethnicity, age group, CD4 count, risk exposure, and current residence in the model. These findings may be explained by the fact that many individuals with CD4 count >500 cell/mm3 might have entered the study with lower or undetectable VLs compared to other CD4 groups, making it difficult to detect any additional VL decline in this group. Alternatively, individuals with CD4 >500 cell/mm3 were less likely to be initiated on HAART as, until recently, this was not considered standard of care. 41 However, individuals with baseline CD4 count ≤200 cell/mm3 are at more advanced stages of the disease and need more time for reduction in their VLs compared to those individuals whose CD4 counts are higher than 200. A similar finding was reported by Chakraborty in 2011. 23
The study had several limitations. Given that this was a secondary data analysis, data entry errors cannot be excluded. However, this is likely to be minimal because of electronic laboratory reporting, and SC eHARS audits have consistently exceeded quality rating with regards to timeliness and accuracy of reporting. 28 Data on VL and CD4 counts were not available for those who dropped out of care after their diagnosis because these laboratory markers are a proxy for care engagement. For individuals who sought care in another state, SC eHARS would not capture their CD4/VL values. Further, we were unable to capture individuals living with HIV/AIDS who were not diagnosed. Additionally, our dataset did not include co-morbidities, such as diabetes and hypertension, which can impact HIV self-management, especially in the older population. 42 Given that co-morbidities can complicate HIV/AIDs regimens, the presence of added conditions in older PLWHA might account for differences in VL and CD4 cell counts between age groups. This is a topic worth further exploration. Lastly, we did not examine non-HIV health outcomes among the sample that could influence VL trends (e.g., concomitant sexually transmitted infections). Despite these limitations, the study offers a snapshot of how VLs trends in different populations are changing over time in SC.
This investigation identified populations with certain characteristics associated with slow declines in VL. Targeted public health efforts are needed to improve linkage and retention to HIV care in order to eliminate the observed disparities. Future research should focus on the social determinants of health that influence optimal care outcomes and may cause these observed VL disparities.
Footnotes
Acknowledgments
We wish to acknowledge Teresa G. Stephens from the division of surveillance and technical support, South Carolina Department of Health and Environmental Control, for her help with data management. Gilead Science provided funding for secondary data analysis but had no influence on study objectives, analyses, or article preparation.
Author Disclosure Statement
All the authors declare no conflict of interest.