
Abstract
Subtle structural and functional retinal abnormalities, termed ‘HIV-associated Neuroretinal Disorder (HIV-NRD)’, have been reported in HIV patients receiving combination antiretroviral therapy (cART), without infectious retinitis or any apparent fundus abnormalities otherwise. In this review, we provide an overview of studies investigating HIV-NRD in HIV patients without opportunistic ocular infections in the cART era, and try to elucidate underlying mechanisms and associated risk factors. Most studies focused on patients with severe immune-deficiency and demonstrated that patients with nadir CD4 counts <100 cells/μL are most at risk for neuroretinal damage, with a thinner retinal nerve fiber layer, subtle loss of color vision and/or contrast sensitivity, visual field deficits, and subnormal electrophysiological responses. In contrast, alterations in retinal vascular calibers and retinal blood flow were not associated with nadir CD4 counts, but instead with detectable viremia, suggesting a role for (chronic) inflammation in microvascular damage. Although the alterations in visual function are subtle, they can lead to difficulties in activities, such as reading or driving, thereby affecting quality of life. Since HIV has become a chronic disease, its long-term effects with respect to visual function loss become more important, as is recently emphasized by a longitudinal study, reporting that AIDS patients with HIV-NRD have higher risks of developing bilateral visual impairment and even blindness than patients without HIV-NRD. The question remains whether patients with high (>350 cells/μL) nadir CD4 counts and well-suppressed HIV infection on cART remain at risk for HIV-NRD, as this group constitutes a growing part of the aging HIV-infected population.
Introduction
T
Furthermore, in the last few years, subtle subclinical retinal abnormalities have been reported in HIV patients, treated with cART, without infectious retinitis and any visible fundus abnormalities. Several studies demonstrated decreased visual function in HIV patients without retinitis, such as a subtle loss of color vision and/or contrast sensitivity, visual field deficits, and subnormal electrophysiological responses. 2 –12 Structural studies showed a thinner peripapillary retinal nerve fiber layer thickness, especially in patients with nadir CD4 counts <100 cells/μL, using several techniques, such as optical coherence tomography and scanning laser polarimetry (GDx). 2,5,13 –17 In addition, changes in retinal vascular calibers have been reported in these patients, as well as ocular hemorheological abnormalities. 18 –25
These findings are thought to be part of an ‘HIV-associated Neuroretinal Disorder’ (HIV-NRD) and may be associated with a broader spectrum of neurological abnormalities reported in cART-treated HIV patients, including HIV-associated neurocognitive disorder (HAND), 26 subtle brain alterations, 27,28 and autonomic dysfunction. 29 The pathophysiology underlying both the neuroretinal and central nervous system (CNS) changes is largely unknown, but may be mediated by similar processes, such as a long-standing (micro)vasculopathy, 18 –24,30 direct damage of neural tissue by HIV and/or cART, 31 chronic immune activation and inflammation, 32,33 and accelerated/accentuated biological aging of the HIV-infected population. 34,35
In this review we describe and compare studies investigating HIV-NRD in HIV patients without (prior) opportunistic ocular infections, specifically in the cART era, and try to elucidate the possible underlying mechanisms and associated risk factors. Since HIV has become a chronic disease, it is important to preserve the quality of life of HIV patients as they age, which may be affected by a decrease in contrast sensitivity and color vision, by an impaired reading speed, 36 and by disturbed visual function, resulting in, for example, difficulties in driving. 37,38
Studies are categorized in six sections: functional, structural, structure and function combined, vascular, and genetic studies exploring HIV-NRD. A separate section addresses the possible mechanisms and pathophysiology of HIV-NRD.
Functional Studies
Multifocal electroretinography
Multifocal electroretinography (mfERG) is used to measure ERG activity in small areas of the retina, in the posterior pole, localizing focal retinal damage occurring in a variety of diseases, including diabetes (Fig. 1). Parameters of the mfERG can be separately related to the function of the outer retina or the inner retina. Special computational programs are provided with the recording system for multifocal ERG to extract the first- and second-order kernels. The first-order kernel (FOK) response reflects mainly outer retinal function (receptor cells and bipolar cells) with little contribution by ganglion cells, while the second-order kernel (SOK) parameters are thought to reflect early changes in adaptive retinal mechanisms and inner retina cell function (ganglion cells).
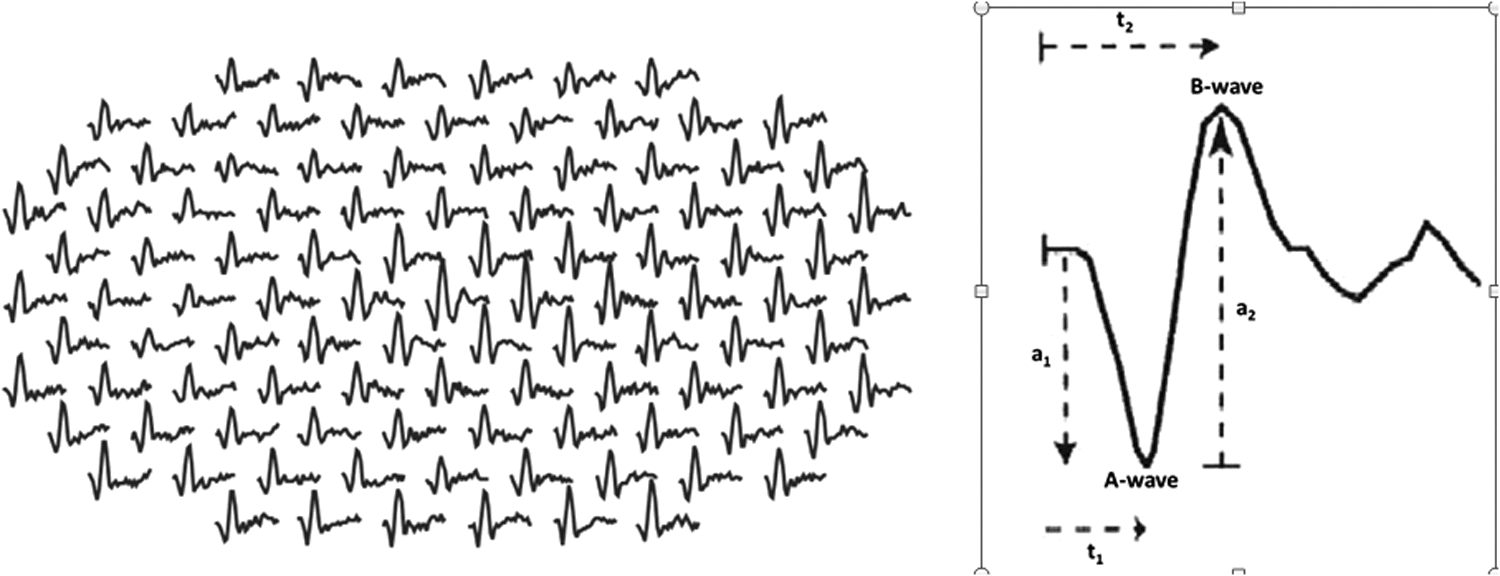
The multifocal electroretinogram (mfERG) technique allows local ERG responses to be recorded simultaneously (left). The ERG waveform consists of a negative a-wave followed by a positive b-wave (right). Parameters measured are: (1) the amplitude from the baseline to the negative trough of the a-wave (a1) and the amplitude of the b-wave measured from the trough of the a-wave to the following peak of the b-wave (a2); and (2) the “implicit times”: time from flash onset to the trough of the a-wave (t1) and the time from flash onset to the peak of the b-wave (t2).
In an early pilot study by Falkenstein et al. 3 using mfERG (RETIscan, Version 3.1) analyzing the FOK, no differences in amplitudes and implicit times between groups were found, although this study consisted of only a small number of patients (15 HIV patients and 15 controls). Also there was no correlation between local visual field defects (Humphrey VFA; 6 of 10 studied eyes) and mfERG responses in corresponding areas. These results suggest inner retinal damage (visual field defects) in HIV patients without infectious retinitis, while the outer retina is spared (normal mfERG FOK responses).
In a second study by Falkenstein et al., 4 three groups of patients were evaluated by mfERG: 50 HIV patients with a nadir CD4 count above 100 cells/mm3, 56 HIV patients whose nadir CD4 count was less than 100 cells/mm3 for at least 6 months, and a group consisting of 41 HIV-negative controls. Although there were no significant differences in amplitudes between the groups in both kernels, widespread delays in implicit times were found in both kernels, especially in the patients with low nadir CD4 counts. These findings reflect subtle functional changes before noticeable diminished amplitudes or clinically relevant vision loss.
A subsequent study, 12 using support vector machine (a machine learning classifier) to analyze the SOK response of mfERG, confirmed the presence of mfERG SOK abnormalities in HIV patients; more specifically, delayed implicit times were found. The new finding in this study was the comparable severity of the delay in implicit times in both low and high nadir CD4 groups. The authors concluded that the support vector machine was more sensitive in detecting mfERG abnormalities than standard linear classifiers. A limitation of these studies is the lack of information on (current) CD4 counts, viral load levels or cART.
Visual fields
Machine learning classifiers were also used in a study by Kozak et al. 8 to analyze visual field defects (Humphrey Visual Field Analyzer, model 620) in 35 HIV patients with CD4 counts <100 cells/μL at some point during their medical history for at least 6 months, 38 HIV patients with nadir CD4 counts >100 cells/μL, and 52 HIV-negative individuals. All HIV patients were treated with cART prior to and at the time of examination; data on current CD4 counts and viral load levels were not described. Patients in the low CD4 group had visual field defects, especially in the visual field superiorly near the blind spot, implying more pronounced damage to the retina inferiorly near the optic disc. Although most visual fields appeared normal in the group of patients with higher CD4 counts, the machine learning classifiers were able to distinguish these eyes from normal eyes, whereas human experts rated most of these visual fields as normal. The locations of the visual field defects in the high CD4 group followed no specific pattern.
Visual field results are generally expressed as mean deviation (MD) and pattern standard deviation (PSD). The MD gives an overall value of the total amount of visual field loss, and the MD value becomes more negative as the overall field worsens. The PSD is designed to highlight localized defects by accounting for generalized visual field loss (likely due to a cataract). A high PSD indicate a non-uniform sensitivity loss.
Freeman et al. 6 also used the Humphrey Field analyzer (model 600/700) to assess visual field function in 1336 patients diagnosed with AIDS (without ocular opportunistic infections), participating in the prospective Longitudinal Study of Ocular Complications of AIDS (LSOCA). The study population consisted mainly of males (80%), approximately 80% of the patients were on cART during the time of examination, with a median current CD4 count of 180 (quartiles: 71,328) cells/μL and a median HIV viral load of 1518 (200,56957) copies/mL. Median nadir CD4 count was 42 (13–106) cells/μL and median time since AIDS diagnosis was 4.1 (1.7–6.9) years.
Since there was no control group, visual field results were compared with published visual field data from a healthy population of the Diagnostic Innovations in Glaucoma Study (DIGS). Thirty-nine percent of the examined eyes had an abnormal mean deviation defined as less than the lowest 2.5 percentile [−2.63 decibels (dB)] from the expected distribution of DIGS controls with normal vision, and 33% of the eyes had an abnormal pattern standard deviation [higher than the upper 2.5 percentile (2.57 dB) from the expected distribution of DIGS controls with normal vision]. Risk factors for visual field loss included race (higher risk for blacks and Hispanics vs. whites), intravenous drug use, anemia, lower Karnofsky score, and lack of private health insurance, reflecting a higher disease severity and/or less access to care for HIV disease. Although there was no internal control group in this study, the results show that there is a large percentage of patients with an AIDS diagnosis with reduced visual field function.
Color vision and contrast sensitivity
Several studies examined contrast sensitivity and/or color vision in HIV-infected subjects. Shah et al. 11 evaluated contrast sensitivity (CS; Pelli-Robson chart) and color vision (Farnsworth-Munsell 100-Hue color test; FM-100) among 71 HIV patients, with 65 patients having nadir CD4 counts <200 cells/μL (who were also co-enrolled in the LSOCA study). cART was being administered to 55 subjects, median current CD4 counts were 330 (range: 9–998) cells/μL and median HIV viral load was 509 (range: 19–441.661) copies/mL. The results were compared with published values for normal populations. Seven percent of the patients had reduced contrast sensitivity (<1.5 log CS; >2 SD below the mean score for a healthy population described by Myers et al. 39 ) and 9.9% had abnormal color vision (>2 SD above the mean score for a healthy population aged 40–49 years described by Verriest et al. 40 ). No relationship was found between impaired CS and impaired color vision. Associations with HIV-related factors were likewise not detected.
Freeman et al. 6 also assessed Pelli-Robson values among 1330 HIV patients diagnosed with AIDS who were participating in the LSOCA study. Approximately 12% of the examined eyes had low contrast sensitivity values (defined as <1.5 log CS). Risk factors for low CS included intravenous drug use, lower education levels, and lower current CD4 counts. Discrepancies in the association between CS and CD4 counts in this study compared with the previous study by Shah et al. 11 could be explained by the much smaller sample size of the study by Shah et al.
Follow-up LSOCA study
A recent report by the LSOCA study group 41 describes the incidence, risk factors and long-term outcomes of HIV-associated neuroretinal disorder (HIV-NRD; defined as having a Pelli Robson contrast sensitivity value <1.5 log units) among 1822 patients with AIDS (80% male), having median CD4 counts of 198 (IQR 81–362) cells/μL at enrollment, median nadir CD4 counts of 41 (IQR 13–109) cells/μL and median HIV viral load levels of 2.68 (IQR 1.74–4.59) log10 copies/mL at enrollment. Of the 1822 AIDS patients (of whom 85% were on cART), 294 (16%) had HIV-NRD at enrollment, which was found to be significantly associated with being female, African American, having lower CD4 counts at enrollment, and a positive hepatitis C antibody status. In addition, a significantly lower percentage of patients with HIV-NRD used cART (at present or past) compared to patients without HIV-NRD (79% vs. 86%). Patients with HIV-NRD at enrollment had increased risks of bilateral visual impairment [hazard rate (HR) 6.5; 95% CI 2.6–16.0] and blindness (HR 5.9; 95% CI 1.5–23.2) than patients without HIV-NRD, as well as a greater mortality risk (HR 1.7; 95% CI 1.3–2.1) during follow-up.
The incidence of HIV-NRD was 1.9/100 person-years (95% CI 1.7–2.2/100 PY); risk factors for incident HIV-NRD included, in addition to being female or African American, a higher age at AIDS diagnosis (HR 1.6; 95% CI 1.2–2.1), current CD4 counts <100 cells/μL (HR 1.9; 95% CI 1.4–2.8), a detectable (>2.6 log10 copies/mL), HIV viral load (HR 2.2; 95% CI 1.6–3.0) and not being on cART (HR cART-use 0.6; 95% CI 0.4–0.9). The estimated cumulative incidence for HIV-NRD by 20 years after AIDS diagnosis was 51% (95% CI 46–55); among patients with immune recovery (HIV VL <2.6 log10 copies/mL and current CD4 >100 cells/μL), cumulative incidence at 15 years was 30% (95% CI, 21–39).
Structural Studies
Retinal nerve fiber layer (RNFL) thickness
Since subtle visual abnormalities have been demonstrated in HIV patients, it could be expected that subtle structural changes of the neuroretina are also present, such as a thinner retinal nerve fiber layer (RNFL) thickness and/or decreased retinal thickness. Several studies have addressed this question, using different imaging techniques, including optical coherence tomography (OCT; see also section Structure-Function Relationships).
In the last years, OCT (Fig. 2) has proven to be a highly valuable and commonly used retinal imaging modality. It is a noninvasive technique, similar to ultrasound. With OCT, reflected light is used to produce cross-sectional and 3D images of the retina, making it possible to evaluate retinal layers and the optic disc in great detail.
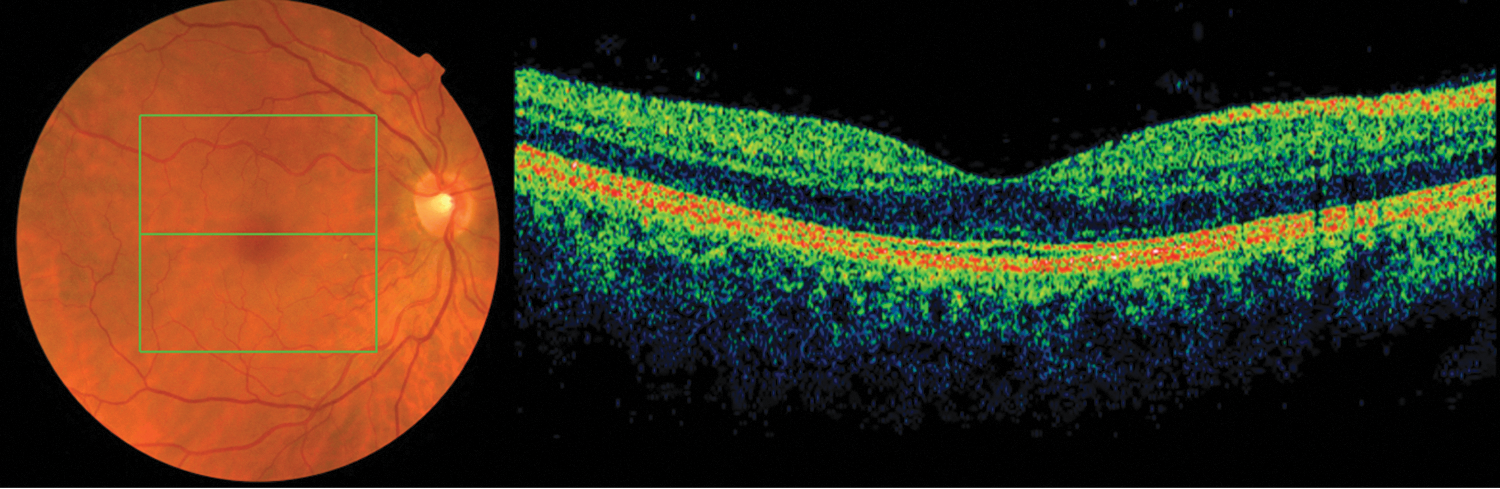
Example of a fundus photo (left) and corresponding Spectral-Domain (SD)-OCT scan (right) of the right fovea of a healthy individual, both taken simultaneously with a Topcon 3D OCT-2000 device. In OCT, reflected (near infrared) light is used to form a cross-sectional (B-scan) image of the retina by automatic analysis of the reflective properties of retinal tissue. OCT technology is continually evolving and the introduction of SD-OCT provided greater scanning resolution, higher scan density, and a significant increase in scanning speed, allowing for greater data acquisition than the original Time Domain (TD)-OCT (such as the Stratus OCT). (Color image can be found at
Kozak et al. 14 measured the peripapillary RNFL thickness (Stratus OCT 3000) in HIV patients (n=18) with nadir CD4 counts >100 cells/μL, HIV patients (n=25) with a history of CD4 counts <100 cells/μL for at least 6 months, and compared the results with a healthy control group of 22 individuals. All patients were on cART and most patients were Hispanic. The low nadir CD4 group had a significant lower average RNFL thickness than the other two groups in all quadrants, except the nasal quadrant. No significant differences were found in thickness between the CD4 group with nadir CD4 counts >100 cells/μL and the HIV-negative controls.
Confocal laser scanning ophthalmoscopy (Heidelberg Retinal Tomograph; HRT) and scanning laser polarimetry [GDx-variable corneal compensator (VCC)] were used in a few studies investigating peripapillary RNFL thickness and optic disc parameters in HIV patients without retinitis. Besada et al. 13 compared HRT values between 13 HIV patients, all on antiretroviral therapy, with 12 patients having current CD4 counts >100 cells/μL, and 13 HIV-negative control subjects. A subgroup of 6 patients and 5 controls were also examined with GDx-VCC. HRT and GDx-VCC indicators of peripapillary RNFL thickness were significantly reduced in HIV-positive patients, while there was a lack of correlation between CD4 counts, viral load, number of ART medications, years since diagnosis of HIV, and RNFL thinning, possibly due to the small sample size.
Plummer et al. 17 used the HRT in a cross-sectional study between 17 HIV patients without CMV retinitis or cotton wool spots and 24 age-matched controls. Significant differences were found between the two groups in a number of measures of the peripapillary retinal nerve fiber layer, with worse outcomes in HIV patients without retinitis. Plummer et al. did not indicate whether the patients in their study were using cART nor did they provide information regarding the subjects' CD4 counts or viral load levels.
In a study by Kozak et al., 15 GDx-VCC was used to measure the peripapillary RNFL in 26 HIV patients with CD4 counts always >100 cells/μL, 35 HIV patients with nadir CD4 counts <100 cells/μL for at least 6 months, and 25 HIV-negative controls. All patients were on cART. The low nadir CD4 group had significantly lower RNFL values (superior average, inferior average, ellipse average) and a higher nerve fiber indicator value (NFI; a global index of RNFL integrity; higher values increase the likelihood of having glaucoma) than the controls. No significant differences were detected between the high nadir CD4 group and the controls.
It is difficult to correctly interpret these studies, since detailed information on HIV- and cART-related parameters was not given, such as duration of HIV and cART use, current/nadir CD4 counts (and their distribution), and peak/current viral load (and their distribution). However the results of these studies suggest that HIV patients with nadir CD4 counts <100 cells/μL are more at risk for having a thinner peripapillary RNFL.
Structure–Function Relationships
In addition to the aforementioned studies addressing only functional or structural retinal changes in HIV, in recent years there has been an increasing interest in examining possible associations between functional and structural abnormalities in HIV patients.
RNFL thickness and contrast sensitivity/color vision
In 2012, Kalyani et al. 7 evaluated relationships between contrast sensitivity (Pelli–Robson chart; logCS score), color vision (Lanthony D-15 test; color-confusion index), and peripapillary RNFL thickness (SD-OCT; RTvue) among 57 predominantly male, HIV patients (89% diagnosed with AIDS; these patients were also enrolled in the LSOCA Study). Median time since HIV diagnosis was 194 (range: 3–359) months, median current CD4 count was 420 (range: 80–1037) cells/μL, median nadir CD4 count was 66 (range: 0–602) cells/μL, and median current HIV viral load was 0 (range: 0–188.393) copies/μL. Duration and proportion of patients on cART was not given. The results were compared with published values for normal populations. Mean CS was 1.85±0.14 logCS and mean color-confusion index was 1.74±0.74. Only 2.9% of the eyes had abnormal CS (<1.5 log CS; as described earlier 42 ) in contrast to 40.2% of examined eyes with abnormal color vision (color confusion index >1.78, as described by Vingrys and King-Smith 43 ).
Temporal RNFL thickness was significantly positively correlated with logCS and inversely correlated with color-confusion index. A surprising finding was the presence of a subgroup with average RNFL thickness greater than normal (n=10 eyes; >1 SD of mean value of average peripapillary RNFL thickness described by Rao et al. 44 ). There was a trend for shorter duration of HIV disease for this subgroup than for those with a thin RNFL thickness (13.3 vs. 18 years), although this was not statistically significant.
Pathai et al. 10 performed a similar study on peripapillary RNFL thickness (SD-OCT: Opko/OTI) and CS (Pelli-Robson chart) in a South African (±70% female) population, consisting of 225 HIV patients without retinal opportunistic infections and 203 healthy controls. Eighty-eight percent of the HIV patients were on cART for a median duration of 56.5 (IQR 34–74) months. Current and nadir median CD4 counts in this group were 468 (IQR 327–607) cells/μL and 136 (IQR 77–175) cells/μL, respectively. Peak viral load was 4.47(IQR 3.74–4.97) log10 copies/mL, while at present 85% had an undetectable plasma viral load (<50 copies/mL).
Contrast sensitivity was significantly lower in the patient group compared to the controls, although the difference was only one letter (1.76 vs. 1.82 logCS). A higher percentage of HIV patients had ‘poor’ CS (<1.65 logCS; defined using the cut-off value of the 25th percentile in the control group) compared to the control group (43.5% vs. 31.8%). Among the HIV patients on cART, ‘poor’ CS was significantly associated with a positive frailty status and HIV viral load >2 log copies/mL.
The peripapillary RNFL thickness (average and per quadrants) was not significantly different between the two groups, in contrast to other studies reporting a thinner RNFL, especially in HIV patients with low nadir CD4 counts. 5,14 Associations between RNFL thickness and nadir/current CD4 counts were not detected. An unexpected and new finding was a trend for increased superior quadrant RNFL thickness with higher values of viremia, with ART-naïve HIV patients and a detectable viral load having an increased RNFL thickness (140 μm) in comparison with HIV negative controls (132.2 μm) and HIV patients on cART with undetectable VL (133.8 μm). This is the second study reporting an increased RNFL thickness in a subgroup of HIV patients. Longer ART duration was significantly associated with thinning of inferior and nasal RNFL quadrants. A lower CS was associated with a thin temporal RNFL, in agreement with the previous study by Kalyani et al. 11
RNFL, macular thickness, and visual fields
Arantes et al. conducted two studies comparing OCT findings (Stratus OCT) with frequency-doubling technology (FDT) perimetry (FDT Humphrey Matrix; Carl Zeiss Meditac, Dublin, California; and Welch-Allyn, Skaneateles, NY) outcomes. It is thought that FDT reflects the function of ganglion cells involved in the magnocellular pathway. Like the Humphrey Field Analyzer, the main FDT outcome measures are mean deviation (MD), pattern standard deviation (PSD), and glaucoma hemi-field test (GHT).
The first study 5 was published in 2010 and compared macular retinal thickness and peripapillary RNFL thickness with visual field outcomes between 26 HIV patients with a CD4 count <100 cells/mm3 for minimal 6 months in their medical history (Group A), 25 HIV patients with CD4 counts always >100 cells/mm3 since diagnosis (Group B), and 22 HIV negative controls (Group C). Nadir and current mean [±standard error (SE)] CD4 counts were 28.31±4.67 and 219.96±49.18 cells/mm3 in group A, and 301.08±31.11 and 502.29±41.36 cells/mm3 in group B. All HIV patients were on cART and mean (±SE) time since HIV lab diagnosis (group A: 100.73±15.45 months; group B: 85.88±10.03 months), and cART use (group A: 70.96±13.81 months; group B: 76.96±10.34 months) was not significantly different between the two groups.
Average peripapillary RNFL thickness, as well as RNFL thickness in quadrants (with the exception of the temporal quadrant), was significantly reduced in the low nadir CD4 group compared to the other groups. The temporal and inferior outer macula were also significantly thinner in the low nadir CD4 group. Thickness measurements were not significantly different between the high nadir CD4 group and the controls. The FDT mean deviation (MD) values were significantly worse in the low nadir CD4 group versus the controls; the pattern standard deviation (PSD) values were significantly worse in the low nadir CD4 group compared to both the high nadir CD4 group and controls. In addition, abnormal Glaucoma Hemi-field Test (GHT) results were found more frequently in patients with low nadir CD4 counts. Eyes of HIV patients with GHT and PSD results outside normal confidence limits of the normative database of the perimeter had a significant thinner average peripapillary RNFL than eyes with results within normal limits in the same group of patients. These results are in accordance with previous studies demonstrating that patients with low nadir CD4 counts are more at risk of developing structural and/or functional retinal abnormalities.
The next study by Arantes et al. 2 also compared peripapillary RNFL thickness (Stratus OCT) with FDT results (Humphrey Matrix) in a group of 51 HIV patients, all on cART, versus 22 HIV negative controls. These patients presumably represent the same cohort as reported in the previous study, but without a distinction being made between patients with a low and high nadir CD4 count. Duration since HIV diagnosis and cART were 93.45±66.06 and 73.90±60.21 months, respectively. Mean current and nadir CD4 counts were 355.48±267.69 and 162.02±175.69 cells/μL, respectively. Associations between RNFL thickness and VF sensitivity were evaluated in 12 clock-hour OCT sectors and in 21 VF zones. The HIV-group was significant thinner in sectors 2, 7, and 11. Other sectors as well as the average RNFL thickness were not different between the groups. Statistically significant differences in VF zones were observed in (nasal) zones 14 and 15 only.
In HIV-patients, there was no association between the FDT Matrix MD and the OCT average RNFL thickness, although the association between the FDT Matrix PSD and average RNFL thickness was significant. When comparing regional RNFL thinning with locally measured VF zones, the strongest correlations were found between the superior RNFL measurements and inferior VF zones and between the nasal RNFL measurements and temporal VF zones. There were no significant associations between average RNFL thickness and current CD4 count, nadir CD4+ T-cell count, duration of lab diagnosis of HIV-infection or duration of cART. Associations between these HIV-related parameters and VF results were not mentioned.
RNFL thickness and computer-based simulators
Two studies examined the relationship between peripapillary RNFL thickness and specific computer-based simulations. The first study 37 included 22 HIV patients (45% with a nadir CD4 count <100; exact values of nadir and current CD4 counts were not described) and 16 HIV negative controls, who completed a 10.2-mile computer-based, wide field-of-view driving simulation (STISIM driving simulator) in which they had to obey traffic rules and participate in emergency situations, as well as more routine settings. A “weighted error score” was calculated in order to summarize the participants' driving performance and give greater weight to more dangerous situations. The mean peripapillary RNFL thickness (Stratus OCT3) was significantly thinner in the low nadir CD4 group than the high CD4 group, while a comparison with the HIV negative control group was not made. The HIV group in general had a significantly higher weighted error score than the controls, which was not associated with nadir CD4 counts. Within the HIV group, RNFL thickness was significantly correlated with driving errors. The highest number of driving errors occurred in individuals with both a low CD4 count and significantly reduced RNFL thickness (<80 μm).
The second study 38 used an interactive computer program (Central Vision Analyzer) to assess vision performance in a time-dependent manner (900 msec per test) under a variety of light/contrast conditions that simulate stressful and real-world environments. In addition, peripapillary RNFL thickness was measured (Heidelberg Spectralis OCT) and associations between thickness and visual performance were investigated. The patient group included 37 eyes of 19 HIV patients with a nadir CD4 count >200 cells/μL and 52 eyes of 28 HIV patients with a nadir CD4 count <200 cells/μL for a minimum period of 6 months; the exact values and distribution of the nadir CD4 counts were, again, not reported. All patients were on cART for at least 6 months (total duration unknown), mean CD4 count was 672±281 cells/μL (range: 264–1305 cells/μL), mean HIV plasma viral load was 24.9±19.8 copies/mL (range: 0–50 copies/mL), and the mean estimated duration of HIV was 17.7 years. The control group consisted of 105 eyes of 57 HIV negative controls.
The HIV group—in particular the low nadir CD4 group, and also, but to a lesser extent the high nadir CD4 group—performed significantly worse in various mesopic and backlight-glare conditions than the control group. There was no difference in visual performance between the two HIV subgroups. The average peripapillary RNFL thickness was similar between the three groups, but after changing the definition of low nadir CD4 from 200 to 100 cells/μL, the thickness turned out to be significantly different between the groups, more specifically in the low nadir CD4 group versus the controls. There was no significant correlation between estimated duration of HIV and visual scores in any CVA module or RNFL thickness, respectively. RNFL thickness, and more specifically the temporal–inferior sector, was significantly associated with visual scores under various mesopic conditions. As in previous studies mentioned earlier, this study shows that patients with low nadir CD4 counts are at a higher risk for developing thinning of the RNFL and visual abnormalities.
Retinal Vascular Calibers and Hemorheology
Despite a substantial decrease in incidence of non-infectious HIV retinopathy, subclinical retinal microvascular changes and abnormalities in blood flow have been reported in HIV patients, even in the cART era. It is thought that these abnormalities play a role in developing HIV-NRD (see also section Pathophysiology).
Hemorheological abnormalities
Blue field entoptoscopy uses the ‘blue field entoptic phenomenon,’ allowing patients to view their own circulating macular leukocytes. The retina is exposed to a diffuse blue light with a wavelength of 430 nm, enabling perception of tiny bright dots moving quickly along curved lines in the visual field, corresponding to the patient's leukocytes moving in the macular retinal capillaries within a 20 degree region centered around the foveola. The patient compares the velocity and density of these particles to that of similar particles in a computer-generated simulation that is intermittently shown to the patients. Macular leukocyte velocity and perceived leukocyte density are measured.
Lim et al. 21 determined whether HIV patients have decreased macular capillary blood flow in vivo, by using the blue field simulation technique (BFS-2000, Oculix). Forty-one HIV patients without CMV retinitis or any signs of retinopathy, and 31 HIV negative controls were examined. Current CD4 counts ranged between 0–800 cells/μL in the HIV positive group, with counts <50 cells/μL in 10 patients, between 50–200 cells/μL in 9 patients, and >200 cells/μL in 22 patients. Among the last group, nadir CD4 count had been <50 cells/μL in 7 individuals and >200 cells/μL in 9 individuals.
Mean current HIV viral load was 65±125 x 103 copies/mL. Both mean macular leukocyte velocity and mean perceived leukocyte density were found to be significantly lower in the patient group. No correlations were observed between velocity measurements and current or nadir CD4, HIV VL, duration of medication use or duration of elevated CD4 counts (determined in 6 patients on ART with current CD4 count >200 and nadir CD4 count <50).
Blue field entoptic technique (BFS-2000, Oculix) was also used in a study by Dejaco-Ruhswurm et al. 24 to measure macular leukocyte flow. In addition, fundus pulsation amplitude and blood flow velocities in the retrobulbar vessels were determined by laser interferometry and Doppler sonography, respectively. The fundus pulsation amplitude (FPA), representing the maximum distance change between the cornea and the fundus during a cardiac cycle, gives an estimate pulsatile blood flow on a selected fundus location. Doppler sonography of the retrobulbar vessels yields information about blood velocity due to the Doppler effect. Peak systolic and minimal diastolic flow velocities of the ophthalmic artery (OA), the central retinal artery (CRA) and the posterior ciliary arteries (PCAs) are assessed and from these parameters the mean flow velocity and the resistive index (=peak systolic flow velocity- minimal diastolic flow velocity) are calculated.
The eyes of 37 HIV patients and 25 HIV-negative controls were evaluated; current CD4 counts were not above 500 cells/μL, with 22 patients having CD4 counts<200 cells/μL. Mean current and nadir CD4 counts were 206.8±145.6 and 119.2±109.4 cells/μL, respectively. Mean HIV viral load was 5.9×10⁴ (range: 0–4.5×10⁵) copies/mL at time of examination. Eighty-nine percent of the patients were on cART, of whom 81% took protease inhibitors. Mean duration since HIV diagnosis was 6±3.8 years. Five patients had HIV retinopathy.
A significant reduction in leukocyte density was seen in HIV patients compared to the control group. The resistive index in the central retinal artery was higher in the HIV group, but other hemodynamic parameters were not significantly different between the groups. As in the previous study, no correlations were found between flow parameters and current/nadir CD4 count, viral load or HIV retinopathy.
Other hemorheologic abnormalities (measured in vitro) reported in HIV patients are abnormal erythrocyte aggregation 20 and increased polymorphonuclear leukocyte rigidity. 25 Because these changes can alter microvascular blood flow and appear to be unrelated to immunodeficiency, HIV patients may remain at risk for retinal vascular damage, even in the cART era. It is suggested that some antiretroviral agents [in particular, the nucleoside reverse transcriptase inhibitors (NRTI's) such as zidovudine] may make these changes even worse, by causing macrocytosis. 20
Retinal vascular calibers
In recent years, advances in fundus photography and retinal image analysis techniques have enabled the objective and accurate assessment of quantitative retinal vascular caliber measurements (Fig. 3). Epidemiological studies have shown that changes in retinal arteriolar and venular caliber size are associated with several factors, including age. For example, both narrower retinal arteriolar and venular calibers are associated with an older age, with absolute differences in changes between individuals >80 years compared to those who are 55–60 years in the order of magnitude of 10–15 μm. 45

Example of a measurement of retinal arteriolar (red) and venular (blue) calibers using special algorithms
41
–43
(white is undetermined). In general, three summary variables are determined in a semi-automated manner, using fundus photographs: the central retinal artery equivalent (CRAE; the projected caliber size of the central retinal artery), central retinal vein equivalent (CRVE; the projected caliber size of the central retinal vein), and arteriole-to-venule-ratio (AVR). Images used with permission of references.
41
–43
(Color image can be found at
Retinal vascular calibers have also been measured in HIV patients. Gangaputra et al. 18 evaluated potential relationships between retinal vessel calibers and HIV-associated factors as well as mortality in the LSOCA study. Included were 1250 patients with AIDS without ocular opportunistic infections, with a median time of 4.2 (range: 1.6–7.1) years since AIDS diagnosis, of whom 85% were on cART at baseline. Median CD4 count at baseline was 192 (range: −81–350) cells/μL. Mean follow-up time for determination of mortality was 6.1 years. A smaller CRAE and larger CRVE were significantly associated with (previous or current) cART, and larger CRAE was associated with lower baseline CD4 counts. No relationships were found between vessel calibers and HIV viral load, duration of AIDS, nadir CD4 count, and CD8+T-cell count. Worse Karnofsky scores were correlated with larger CRVE and smaller AVR. There was a 12% (95% CI, 2–21%) increase in mortality risk per quartile of decreasing AVR.
Data from the same group of patients were used in a separate analysis, comparing retinal vessel calibers with visual function outcomes, measured by Goldmann perimetry, Humphrey Field Analyzer, and Pelli-Robson CS testing. 19 CRAE and CRVE were not associated with visual function parameters, but a smaller AVR was correlated with reduced visual field by Goldmann perimetry and worse MD and possibly worse PSD on automated perimetry. In addition, there was a weak association between smaller AVR and worse CS. These relationships were independent of ART use and level of immunodeficiency (CD4 counts and HIV viral load). Retinal vascular indices at baseline did not predict changes in visual function during follow-up.
Since a control group was not available in both these studies, the hypothesis of accelerated aging in HIV patients, with more advanced retinal vessel caliber changes compared to an age matched healthy control group, could not be tested. Furthermore, in these studies, retinal vessel calibers were measured at baseline only, leaving the question unanswered whether changes in vessel caliber indices predict changes in visual function and whether caliber sizes are influenced/reversible by changes in CD4 counts or viral load over time.
Pathai et al. 22 assessed associations between retinal vessel calibers and clinical and demographic characteristics in a population of 242 HIV patients and 249 HIV negative controls in South Africa. Among HIV patients, 72.7% had a history of WHO stage 3 (moderately symptomatic stage) or stage 4 (severely symptomatic stage=AIDS) defining illness. Eighty-seven percent of the patients were receiving cART, of whom 84% had an undetectable VL at examination. Among the patients on cART, current CD4 count was 468 (IQR, 325–607) cells/μL and nadir CD4 count was 127 (IQR, 76–171) cells/μL. Peak viral load in the cART group was 4.56 (3.84–4.98) log10 copies/mL. Median cART duration was 58 (IQR, 34–75) months.
Surprisingly, no significant differences were found in CRAE and CRVE between patients and controls. Pathai does not further address this in her discussion. When analyzing the HIV patients (on cART) separately, narrower arterioles were associated with an increasing duration of cART, independently of age, and with a higher viral load (>10.000 copies/mL) while on cART.
Tan et al. 23 performed a similar study in Singapore, examining 85 HIV patients (98% was receiving cART at enrollment) without ocular opportunistic infections and 251, age-, sex-, and race-matched controls. Both median time since HIV diagnosis and duration of cART were 7 (range: 1–94) months. Median (current?) CD4 count was 91 (range: 15–952) cells/μL.
In addition to the retinal vessel calibers (CRAE, CRVE, and AVR), retinal branching angle, tortuosity, and fractal dimension (a measure summarizing the branching pattern of the retinal vasculature) were determined. As in the study by Pathai, 22 no significant differences in retinal vessel calibers were found between patients and controls, nor in vascular branching angle or fractal dimension. However, the patients had more tortuous arterioles and venules compared with the controls. Among HIV patients, increasing viral load (unclear whether viral load was measured pre-cART or at time of enrollment) was associated with decreased CRAE and AVR, again in line with Pathai's results. 22 In contrast to Pathai, 22 this study found no association between cART duration and retinal vascular abnormalities. Tan notes that the duration of cART use was much shorter in this population, compared to Pathai's population, where retinal arteriolar narrowing was found only after cART duration of 6 years. Both Pathai and Tan 22,23 found no correlations with CD4 counts and vascular calibers, contrary to the LSOCA Study. 18
Genetics
The LSOCA Study Group conducted a few genetic studies to evaluate the influence of several host genetic factors on HIV-NRD development. The authors hypothesized that HIV-NRD could be related to a worse AIDS prognosis 6 and that host genetic factors, known to influence HIV infection, AIDS progression, therapy response and antiviral drug metabolism, 46 –50 might therefore also affect the development of HIV-NRD. Furthermore, associations between hepatitis C co-infection and HIV-NRD were assessed, as well as variations in mitochondrial DNA haplogroups and HIV-NRD development.
Mitochondrial haplogroup J
Loss of optic nerve axons has been described in AIDS patients, in histological studies in the pre-HAART era, suggestive of mitochondrial dysfunction. 51 Furthermore, among patients with HIV, mitochondrial dysfunction has been associated with mitochondrial DNA (mtDNA) depletion, disruption of energy production, antioxidant enzyme deficiency, and increased oxidative damage. 52
Hendrickson et al. 53 explored whether variation in mitochondrial DNA haplogroups influenced the development of HIV-NRD (from the time of AIDS diagnosis), defined as having a Pelli-Robson contrast sensitivity <1.5 log units, in 503 European-American AIDS patients (having mitochondrial macrohaplogroup “N”), participating in the LSOCA Study.
In genetic studies, the definition of a haplogroup is a group of individuals with similar haplotypes who share a common ancestor and for that reason have the same single nucleotide polymorphism (SNP) mutation in all haplotypes. A human mitochondrial DNA haplogroup is a haplogroup defined by such similarities in human mitochondrial DNA.
The patients in this study had no infectious retinitis, mean duration of time since AIDS diagnosis was 5.1 years and 84% were on cART. Sixty-four (7.9%) patients had HIV-NRD at enrollment and among the 439 patients without HIV-NRD, 19.6% developed HIV-NRD during follow-up.
Within the macrohaplogroup N, haplogroup J was found to be protective in both a survivorship analysis of time-to-NRD in patients with no prior NRD diagnosis at enrollment (80% decrease in risk; HR 0.20; 95% CI 0.03–1.48) as well as in a cross-sectional analysis comparing the prevalence of HIV-NRD at enrollment between patients with and without haplogroup J (1.5% vs. 8.9%; OR 0.39; 95% CI 0.15–1.00). Haplogroup J is associated with accelerated AIDS progression in untreated patients. 54 In patients on cART however, J seemed to be protective against lipoatrophy, an ART side effect. 55 The results of this HIV-NRD study seem to confirm the protective role of haplogroup J in patients on cART.
IL-10 and RANTES gene polymorphisms
Another LSOCA study 56 found significant correlations between HIV-NRD and polymorphisms that have a crucial role in the IL-10 signaling pathway (in European Americans), and polymorphisms in the RANTES gene (in African Americans).
In 345 European Americans (55 with HIV-NRD, 290 without HIV-NRD), IL-10-5A variant and its promotor haplotype HG1 were associated with HIV-NRD development (HR 2.72, CI 1.19–3.67). 46 The IL-10-5A variant (in the promotor region of IL-10) is a low producer of IL-10, and together with its associated haplotype, has been shown to influence HIV infection and accelerate progression to AIDS in European Americans. 57 –59
In a group of 234 African Americans (54 patients with HIV-NRD, 180 without HIV-NRD), RANTES-In1.1.C and the associated haplotypes H2 and H3 showed increased HIV-NRD susceptibility (HR 2.72, CI 1.48–5.00). RANTES (Regulated on Activation, Normal T cell Expressed and Secreted) is a CC chemokine receptor 5 (CCR5) ligand; a potent inhibitor of HIV entry and replication. 60 RANTES variants and haplotypes influence RANTES production and affect HIV infection, progression to AIDS, and cART outcome. 46,48,61 –64
Hepatitis C virus co-infection
A third genetic LSOCA study examined the impact of hepatitis C virus (HCV) infection on the prevalence and incidence of HIV-NRD, 65 in view of the fact that HCV is pro-inflammatory 66 and penetrates the central nervous system, 67 –71 thereby possibly increasing the susceptibility of developing HIV-NRD. Associations between HCV and single-nucleotide polymorphisms (SNPs) in the IL-10 receptor 1 gene, associated with HIV-NRD in the previous genetic LSOCA Study, 56 were assessed as well. The group included 244 AIDS patients with NRD at baseline and 1332 AIDS patients without NRD. Median follow-up time was 4.9 (IQR 2.4–8.8) years. There were 263 incident cases of HIV-NRD. After adjustment for several factors, both incidence and prevalence of HIV-NRD were significantly higher in patients with chronic HCV infection (OR 1.54, 95% CI 1.03–2.31 and HR 1.62, 95% CI 1.13–2.34, respectively), compared to patients without HCV markers. Three of the 4 SNPs analyzed (in a subset of 902 patients), expected to reduce IL-10 signaling, were associated with chronic HCV infection, but none of these SNPs were associated with HIV-NRD. These results indicate that HCV is a possible risk factor for HIV-NRD and that alterations in the IL-10 signaling pathway may increase susceptibility to HCV infection and HIV-NRD.
Pathophysiology
The pathogenesis of HIV-NRD remains uncertain and speculative. Proposed hypotheses include: (1) direct HIV infection of neuroretinal tissue, (2) damage caused by chronic immune activation and (para) inflammation, (3) cumulative damage to the neuroretina from a long-standing microvasculopathy and associated hemorheological abnormalities, and (4) accelerated/premature aging, presumably induced by a combination of several factors, including HIV infection itself, ART side effects, and the accelerated aging of the immune system in the setting of a (cART-treated) HIV infection. In addition, recent studies indicate that specific host genetic factors might make an individual more susceptible for HIV-NRD. 53,56 Associated socio-demographic risk factors include (black/Hispanic) race, a history of injection drug use, lower Karnofsky scores, and lack of private health insurance. 6 Presumably HIV-NRD is not caused by just a single mechanism, but rather by an interplay between several processes (Fig. 4).

Simplified diagram of factors/mechanisms thought to be involved in the development of HIV-NRD.
Severity of immune deficiency
The abovementioned studies illustrate that, in particular, HIV patients with a more advanced disease status [e.g., low (nadir) CD4 counts, high viral load, prior (non-ocular) AIDS diagnosis, and a lower Karnofsky score] develop the visual symptoms and structural retinal changes related to HIV-NRD. Abnormalities in mf-ERG, visual field results, color vision, contrast sensitivity, and worse performances with computer-based simulators were all found to be correlated with low (nadir) CD4 counts. 4 –6,8,37,38 In addition, several studies reported a thinner peripapillary RNFL thickness in HIV patients with low (nadir) CD4 counts. 5,14,15,38
Most of these studies categorized patients according to their nadir CD4 count, in particular below and above a threshold of 100 cells/μL, and did not detect any significant changes between HIV patients with nadir CD4 counts >100 cells/μL and HIV-negative controls. Moreover, studies that compared a more heterogeneous group of HIV patients (with varying levels of immune deficiency), with a HIV negative control group, found similar outcomes of tests between the two groups. 2,10,22,23,38 These findings suggest that patients with higher (>100 cells/μL) nadir CD4 counts are less susceptible for developing HIV-NRD.
Chronic (para)inflammation and aging
In contrast to a decreasing RNFL thickness, two studies described a subgroup of HIV patients with a thicker RNFL than normal. Kalyani et al. 7 found a trend for increasing peripapillary RNFL thickness with shorter HIV duration, while Pathai et al. 10 report an association with detectable viremia. Kalyani hypothesizes that it could be that the RNFL goes through an initial phase of swelling, as the axons are compromised by mitochondrial toxicity [mediated by HIV or ART (in particular the nucleoside analog reverse-transcriptase inhibitors)], before becoming atrophic. Mitochondrial dysfunction contributes to para-inflammation and aging. 72 Para-inflammation is a chronic, low-level inflammatory response to tissue stress or dysfunction and is associated with the aging process. 32,73 Pathai speculates that increased levels of HIV viremia may initiate a para-inflammatory process in the retina, which may initially manifest as increased thickness of the RNFL.
Pathai et al. demonstrated earlier that HIV infection is associated with frailty, 74 and that frailty is an important predictor of poor CS in HIV patients, supporting the theory of accelerated/accentuated aging in HIV. 10 The finding that abnormal CS is also independently associated with mortality in patients with AIDS corroborates this point of view. 75 Other nonretinal studies described changes in features of the corneal endothelium 76 and increased ocular lens density/cataract formation 77 in HIV patients compared to HIV negative individuals, which are all known to be age-related changes.
Subclinical microvasculopathy
Microvascular changes, in combination with hemorheological abnormalities, are thought to mediate damage to the neuroretina, thereby playing a role in developing HIV-NRD.
It is proposed that activated leukocytes in HIV patients play a key role in the development of blood flow alterations. Activated leukocytes are capable of causing direct microvascular damage by adhering to endothelial cells followed by degranulation, in addition to altering blood flow directly, through increased persistent leukocyte rigidity 25 and increased aggregation and decreased deformability of erythrocytes. 20 Some antiretroviral agents have been associated with macrocytosis, thereby also influencing erythrocyte deformability. 20 These hemorheological abnormalities 20,21,24,25 could contribute to developing hypoxia, which might in turn contribute to subtle retinal vascular parametric changes of narrower arterioles and increased tortuosity, as observed in HIV patients.
Narrower retinal arterioles were found to be associated with a higher viral load, and not with nadir CD4 counts, 22,23 possibly reflecting a heightened inflammatory state associated with chronic HIV infection. In addition, cART use/duration 18,22 was also identified as a risk factor for narrower retinal arterioles, which is more difficult to explain. Although initially the increased (cardio)vascular risk in HIV patients was primarily attributed to metabolic alterations associated with the use of particular antiretroviral agents, findings from especially the Strategies for Management of Anti-Retroviral Therapy Study (SMART Study) 78 showed that patients on intermittent antiretroviral therapy had a significant higher risk for vascular events than patients who received continuous antiretroviral therapy.
In recent years, there has been more focus on inflammation, immune activation, and endothelial dysfunction, facilitated by HIV infection itself, as key factors for vascular risk in HIV. 79 As for the eye, detectable HIV RNA levels have been observed in ocular tissues, 80 –82 even in the absence of a detectable plasma viral load, 83 and it has been suggested that HIV impairs and penetrates the blood–retinal barrier, by inducing an inflammatory state in retinal pigment epithelium cells through exposure to HIV proteins. 84,85
Genetic factors
Mitochondrial haplogroup ‘J’ (within the Western-European macrohaplogroup ‘N’) was found to have a protective effect against the development of HIV-NRD in cART-treated patients with AIDS. 53
On the other hand, mutations in an IL-10 receptor gene (in European-Americans having AIDS 56 ), as well as mutations in the RANTES gene (in African Americans with AIDS 56 ), were associated with an increasing risk for HIV-NRD. These genes are known to affect HIV infection and AIDS progression 57 –59 and considering that HIV-NRD is predominantly present in patients with a worse HIV outcome, it is possible that these host genetic variants may be affecting the severity of the AIDS progression rather than having a direct effect on the neuroretina and the development of HIV-NRD. Whether the observed associations are specific for NRD could be explored in a study with a population of HIV patients who develop HIV-NRD independent of AIDS.
Neural damage
IL-10 is a suppressor of TNF 86 –88 (associated with myelin and membrane damage in optic nerves 89 –92 ), therefore, the correlation between a low IL-10 producing genetic variant in European Americans with an increased HIV-NRD risk, may be partly explained by increased immune activity (higher TNF production) leading to optic neuronal damage. Furthermore, the central nervous system (CNS) is considered to be a sanctuary for HIV, which crosses the blood–brain barrier early in the course of the disease and produces neurotoxic viral proteins, irrespective of HIV stage. 93 These proteins can be transported along the neural pathways, causing damage. 94
In addition to hepatitis C virus, other frequent co-infections known to penetrate the central nervous system (CNS), such as hepatitis B virus 95 and syphilis, 96 may also indirectly affect the neuroretina, possibly through persistent or heightened immune activation and increased HIV replication.
Finally, there are some reports suggesting potential neurotoxicity of several antiretroviral agents penetrating the CNS, although the evidence from these (predominantly preclinical) studies is mixed and inconclusive. 97
Discussion
In summary, HIV-NRD comprises subtle vision abnormalities 2,3,5 –7,9 –11,37,38,75 (reduced contrast sensitivity, color vision, visual field loss), changes in peripapillary RNFL thickness, 2,5,7,10,13 –17,37 and subclinical microvascular alterations 18 –25 (hemorheological abnormalities, changes in retinal vessel calibers) in HIV-patients without opportunistic ocular infections or visible noninfectious ischemic HIV retinopathy. The subtle abnormalities are not manifested as overt clinical symptoms and as the pathophysiology is complex and partly unknown, it is complicated to identify the individuals who are at risk, although the disorder is more common among patients with current or prior severe immune deficiency. The prevalence of HIV-NRD (Pelli-Robson CS<1.5 logCS) is reportedly between 3–16%, 6,7,10,11,75,98 and the LSOCA study estimated a cumulative incidence as high as 51%, 20 years after AIDS diagnosis. 98 Patients with higher nadir CD4 counts seem to have a lower risk of developing HIV-NRD. However, there is a lack of clinical data on the occurrence and risk factors of HIV-NRD in HIV patients with high nadir CD4 counts (>350 cells/μL) and well-suppressed HIV-infection, who constitute a growing part of the (Western) HIV-infected population.
Although the alterations in visual function are subtle, they can lead to difficulties in activities, such as reading or driving, thereby affecting the quality of life of a patient. Since HIV has become a chronic disease, its long-term effects with respect to visual function loss become more important, especially in patients with severe immune deficiency, as the LSOCA study demonstrated recently. 98 AIDS patients with HIV-NRD had considerably increased risks of bilateral visual impairment and even blindness versus those without HIV neuroretinal disorder. 98
The studies in this review have several important limitations. Although all studies were conducted in the cART era, most of them included HIV patients who became infected in the pre-cART era, thereby presumably having a different risk profile than HIV patients infected in the cART era, for example, due to exposure to toxic and ineffective mono- and duo-nucleoside analogues. In addition, several studies examined patients with a more advanced disease status, such as the LSOCA study, including only patients with an (prior) AIDS diagnosis and excluding patients in earlier stages of the disease. The patients examined in these studies showed no signs of opportunistic ocular infections or visible HIV retinopathy at the time of examination, but having low CD4 counts at some point during their disease implies they might have had some microvascular abnormalities, which were resolved at the time of testing, but led to permanent inner retinal damage. 99
Another important issue is the lack of a gold standard for the diagnosis of HIV-NRD. Contrast sensitivity testing (Pelli Robson chart) was used by many studies as a marker for HIV-NRD. In addition to being a subjective method, this test does not purely measure retinal function, since the outcome is also influenced by alterations in the anterior segment, such as (subtle) media opacities. As HIV patients have been reported to have increased lens densities and undergo cataract surgeries more frequently than their HIV-negative counterparts, 77,100 contrast sensitivity is a less sensitive method for assessing HIV-NRD. Furthermore, as cART has prolonged the life expectancy of HIV patients, they are at increased risk for other co-morbidities affecting the eye, such as diabetes, hypertension, and glaucoma. These conditions can also confound the results of the tests used in the studies investigating HIV-NRD.
The majority of the studies performed were cross-sectional with a small sample size and lacked relevant information regarding HIV-related factors (VL, CD4 counts, cART), making it difficult to interpret the results in terms of ausality/pathophysiology.
The longitudinal studies that were conducted (LSOCA) did not report whether adequate immune recovery had a protective effect on progression of the neuroretinal damage observed earlier on in patients with severe immune deficiency. In addition, an overview of causes of visual impairment and blindness observed in patients with HIV-NRD in the long term was not provided.
Finally, a major limitation of some of the studies, such as the LSOCA, was the lack of a control group to compare with the patient group.
To investigate the long-term effects of HIV infection on the neuroretina, prospective longitudinal studies with HIV patients at varying disease stages (with a follow-up of at least 2–5 years) are warranted. Some major questions remain unanswered to date. Among HIV-patients with immune deficiency, is the neuroretinal damage stationary or progressive after adequate immune recovery? Are patients with high nadir CD4 counts—who will likely never develop AIDS—still at risk for HIV-NRD? A highly similar control group is essential to delineate the specific effects of the HIV infection itself.
In addition to structural (SD-OCT measurements, retinal vessel calibers) and functional (mf-ERG, VF, etc.) examinations, genetic and immunological tests (cytokines) can help elucidate the underlying cascade of reactions leading to neural damage. Fluorescence angiography/OCT angiography could be used to determine the extent of the involvement of the vascular component in HIV-NRD. Studies so far have purely investigated the peripapillary RNFL or total macular thickness, but the question is whether there are also changes in individual retinal layer thicknesses in HIV-NRD. Since HIV-NRD is a subtle disorder, the peripapillary RNFL thickness and total macular thickness can appear normal, while there could be changes in individual retinal layers.
Lastly, it is possible that neuroretinal dysfunction in HIV is part of central nervous system dysfunction in general. A comparison of ocular examinations with CNS assessment (MRI techniques, neuropsychological assessment) can give more information on this matter.
Footnotes
Acknowledgments
This publication was made possible by a research grant from the Aids Fonds (Project Number 2012023).
Author Disclosure Statement
No competing financial interests exist.