
Abstract
Polypharmacy is the concurrent use of five or more medications. We used group-based trajectory analysis to identify groups of non-HIV medication polypharmacy and investigate associated risk factors among HIV-positive and HIV-negative men in the Multicenter AIDS Cohort Study (MACS) from 2004 to 2016. Each participant was assigned to mutually exclusive groups based on their observed patterns of polypharmacy over time. Risk factors associated with membership with resulting groups were investigated using a multinomial generalized logit model with repeated measures. There were 3160 participants (54.3% HIV positive) included in the study. The overall prevalence of polypharmacy was 33.1% and was higher in HIV-positive than HIV-negative participants (36.2% vs. 30.0%; p < 0.001). Four distinct groups of polypharmacy emerged over time among all participants and among HIV-positive participants only: (1) nonpolypharmacy, (2) slow increasing polypharmacy, (3) rapid increasing polypharmacy, and (4) sustained polypharmacy. Being HIV positive, being 50 years of age or older, having medication insurance coverage, and having increased health care use were positively associated with membership in groups with sustained or increasing polypharmacy. Half of participants in each analysis had membership in one of the three high polypharmacy groups. This study revealed that access to care, through medication insurance coverage and health care use, was a key driver of polypharmacy in this cohort. Further exploration of medically appropriate and inappropriate prescribing practices in the context of polypharmacy and its impact on health outcomes in this and other populations is warranted.
Introduction
The adoption of highly active antiretroviral therapy (HAART) has extended the life span of individuals infected with HIV. 1 However, with increasing age, HIV-positive individuals are at greater risk for cardiovascular disease, dyslipidemia, diabetes, and other chronic age-related non-HIV medical conditions compared with HIV-negative counterparts. 2,3 While the number of pills in a typical antiretroviral therapy (ART) regimen has decreased over time, overall medication burden among aging HIV-positive patients increasingly comprise medications prescribed to treat chronic age-related non-HIV comorbidities. 4 Polypharmacy has been defined as the concurrent use of five or more medications. 5 There are several factors that contribute to polypharmacy among HIV-positive persons. Lower-income individuals have a greater risk of polypharmacy. 5 Medication insurance coverage has also been shown to correlate with excessive polypharmacy. 5 Harms of polypharmacy include more frequent and serious adverse drug-related events (including drug–drug interactions), geriatric syndromes (falls, bone fractures, and impaired cognition), organ system injury, hospitalization, decreased medication adherence, and mortality. 6 HIV-positive patients older than 50 years may have an enhanced susceptibility to harm from polypharmacy due to ongoing immune dysfunction, decreased organ system reserve, and chronically elevated systemic levels of inflammation that contribute to adverse health outcomes. 7
To our knowledge, there are limited data regarding longitudinal patterns of polypharmacy. In the general United States population, polypharmacy prevalence has nearly doubled from 8.2% in 1999–2000 to 15% in 2011–2012. 8 Among adults 65 years of age and older, the proportion taking five or more medications tripled from 12.8% in 1988 to 39.0% in 2010. 9 Among HIV-positive cohorts, the reported prevalence of polypharmacy has ranged from 23% to 39%, with two studies noting higher polypharmacy among HIV-positive than HIV-negative individuals. 10 –12 Kong et al. explored the differences in non-HIV medication polypharmacy between persons living with HIV (PLWH) and HIV-negative persons 65 years of age and older and found greater non-HIV disease and medication burden among PLWH compared with HIV-negative counterparts. 13 In previous research, we reported polypharmacy prevalence over a 12-year period among HIV-positive and HIV-negative men at 25.3% and 18.7%, respectively. 14 While these aggregated rates described the overall burden of polypharmacy over time, they did not elucidate individual-level burden. Group-based analyses can reveal different patterns of response to a particular outcome within heterogeneous populations, such that the most vulnerable individuals can be identified. Therefore, we used group-based trajectory modeling, developed by Jones et al., to identify clusters of individuals based on their patterns of polypharmacy over time. 15,16 To our knowledge, no other study has used this approach to longitudinally examine patterns of polypharmacy among HIV-positive and HIV-negative individuals. We sought to determine trajectories of polypharmacy and investigate associated risk factors among HIV-positive and HIV-negative participants in the Multicenter AIDS Cohort Study (MACS) from October 2004 to April 2016.
Methods
Study population
The MACS is an ongoing prospective cohort study that examines the natural history of HIV/AIDS among men who have sex with men in four United States sites: (1) Baltimore, Maryland/Washington, DC; (2) Chicago, Illinois; (3) Los Angeles, California; and (4) Pittsburgh, Pennsylvania/Columbus, Ohio. Since its inception in 1984, a total of 7352 HIV-positive and HIV-negative men who have sex with men have enrolled into the study during four time periods: 4954 in 1984–1985; 668 in 1987–1991; 1350 in 2001–2003; and 380 in 2011–current. MACS participants attend semiannual clinic visits that involve an Audio Computer-Assisted Self-Interview and a standardized clinical examination where data and specimens are collected. The study design of the MACS has been described elsewhere.
17
–19
Detailed information regarding non-HIV medication use has been collected at every visit since the beginning of the study. Questionnaires are available at
Outcome measures
Non-HIV medications
As part of routine data collection and processing during each semiannual visit, information regarding self-reported non-HIV medications was collected and drug codes were assigned, which were created for use within the MACS. Drug codes were generated using guidelines from the World Health Organization's Anatomical Therapeutic Chemical Index. Non-HIV medications were grouped into general drug classifications corresponding to the following classes: cholesterol, hypertensive, diabetes, hepatitis C virus, hepatitis B virus (including antiretroviral treatments), steroid, hormone, anticancer, antidepressant, tranquilizer, aspirin, antibiotic, and “unclassified” drugs. For this analysis, additional drug classifications were created for drug codes that were originally “unclassified.” These new classes were antihistamines, appetite suppressants, antianginals, anticoagulants, antidiarrheals, antifungals, antiulcers, central nervous system stimulants, digestive/biliary drugs, dopamine, herbal supplements, muscle relaxants, nonsteroidal anti-inflammatory drugs, opioids, substance abuse treatments, antituberculosis treatments, and vitamins. Medications with very low prevalence were combined into an “other” medication category. Non-HIV medications included prescription and nonprescription drugs and excluded recreational drugs. 14 We did not differentiate between prescription and nonprescription drugs to count all non-HIV medications. Prescription medication polypharmacy has been fairly well researched; however, there is limited knowledge on polypharmacy that includes over-the-counter medications, dietary supplements, and as-needed medications. 5
Polypharmacy
Polypharmacy was defined using a dichotomous indicator of five or more non-HIV medications taken since the prior visit. This definition was consistent with previous literature and has been noted to be associated with negative health outcomes. 5,6,9,10,12,14 Routinely used and as-needed medications were treated similarly to assess total pill burden at each visit. All HIV antiretroviral medication was excluded from the polypharmacy count to have comparable analyses between HIV-positive and HIV-negative participants. 12
Co-factors
Sociodemographic characteristics
Self-reported race/ethnicity at baseline was categorized as non-Hispanic white, non-Hispanic black, and other. Geographic location was categorized by the four MACS sites: Baltimore, Maryland/Washington, DC; Pittsburgh, Pennsylvania; Chicago, Illinois; and Los Angeles, California. Enrollment was classified into early recruitment (1987–1991) and later recruitment (2001–current). Educational attainment was classified into less than a high school education, high school education, and college degree or higher. Age at each visit was calculated from the self-reported date of birth and date at visit, and categorized as younger than 50 and older than or equal to 50 years. Race/ethnicity and enrollment were collected at the participants' study entry (index visit). Age was allowed to vary with time (i.e., participants were recategorized when they aged from younger than 50 to 50 years of age or older over the follow-up period).
Insurance type, medication insurance coverage, and health care use
Participants reported the insurance type at each visit from the following choices: (1) health maintenance organization, (2) employer-provided insurance, (3) self-purchased insurance, (4) Medicare, (5) Medicaid, (6) Veteran Affairs health coverage, (7) Ryan White, and (8) other. Three dichotomous variables (yes/no) were generated based on the reported choices: (1) private insurance (health maintenance organization, employer-provided, and self-purchased insurances), (2) public insurance (Medicare, Medicaid, Veterans Affairs, and Ryan White), and (3) other (reported other type of insurance). Current medication insurance coverage was defined using self-reported responses to the question, “Do you have health insurance that covers the cost of medications? (Yes/No).” For each participant, the number of visits to a physician's office, emergency department, or other health care clinic (health care use) was calculated at each visit.
HIV-related risk factors
HIV status (HIV positive/HIV negative) was assessed using enzyme-linked immunosorbent assay with confirmatory Western blot for all MACS participants at their initial visit and at every visit for HIV-negative participants. HIV-positive participants included all those who were HIV positive at baseline and those who seroconverted during study observation. CD4+ T cell counts/mm3 (CD4) and plasma HIV RNA levels [viral load (VL), copies/mL] were collected through blood draw among HIV-positive participants at every visit. CD4 and VL were dichotomized into <200 cells/mm3 and 200 cells/mm3 or more, and detectable (≥40 copies/mL) and undetectable (<40 copies/mL), respectively.
ART use
ART medication use was categorized into four categories according to the Panel on Antiretroviral Guidelines for Adults and Adolescents: (1) HAART, (2) combination therapy, (3) monotherapy, and (4) none. 20 In modeling, ART medication use was a dichotomous variable (yes/no) for participants reporting any HAART, combination therapy, or monotherapy use. ART adherence was assessed by the question, “On average, how often did you take your medication as prescribed?” to which participants had the following choice of responses: (1) 100% of the time, (2) 95–99% of the time, (3) 75–94% of the time, and (4) <75% of the time. 21
Attrition
Binary variables (lost to follow-up and death) were constructed. Lost to follow-up was defined as more than 1 year of missed consecutive visits through the last visit in 2016. Death was any death that occurred during the observation period.
Statistical analysis
We generated descriptive statistics using frequencies, medians, and interquartile ranges (IQRs) where appropriate. Comparisons of sample characteristics were performed using a χ 2 test (frequencies) and Wilcoxon signed-rank test (medians). Using a group-based semiparametric modeling strategy, we identified groups of individuals who followed similar patterns arising from their probability of polypharmacy (patterns of polypharmacy) from October 2004 (visit 40) to April 2016 (visit 65). Details on the SAS procedure for group-based trajectory analysis have been described elsewhere. 15,16 Each participant was assigned to mutually exclusive groups based on their patterns of polypharmacy over time using the maximum-probability assignment rule, for which participants were assigned to the group for which their probability of membership was highest. 15,16 We used the Bayesian Information Criterion (BIC), group size, statistical significance of group membership, and the mean posterior probability of membership within each group (entropy) to select the appropriate number of groups. Trajectory models were generated for 1, 2, 3, 4, 5, and 6 groups. BIC, group size, statistical significance, and entropy were recorded at each step. We selected the model with the lowest BIC, statistically significant groups (p < 0.05), groups that were greater than or equal to 10% in size, and entropy values >0.7. 15,16,22 After the optimal number of trajectory groups was established, we determined the appropriate shape of trajectory for each group. Trajectory shapes were adjusted using higher- or lower-order terms (linear, quadratic, or cubic), depending on the significance of those terms. Trajectory models were produced first for the entire sample and then separately for HIV-positive participants using identical model selection criteria.
Descriptive statistics were generated for the resulting groups. Using a multinomial generalized logit model with repeated measures, we modeled the risk factors associated with the likelihood of group membership compared with the group with the lowest probability of polypharmacy (referent). Our primary independent variable was HIV status. We included age, race/ethnicity, geographic location, educational attainment, enrollment period, health care use, insurance type (private, public, or other), and medication insurance coverage as co-factors. Binary indicators for loss to follow-up and death were also included to adjust for the effect of attrition. For the HIV-positive trajectory groups, we added current CD4 count (≥200 cells/mm3 or <200 cells/mm3), VL (detectable or undetectable), and ART medication use (yes or no) as time-varying co-factors. Each co-factor was modeled independently and selected for the final model if the p value was <0.10. Adjusted odds ratios (aORs) and 95% confidence intervals (CIs) were reported. All analyses were performed in Statistical Analysis Software (SAS) version 9.4 (SAS Institute, Inc.).
Results
Descriptive statistics
There were 3160 participants (54.3% HIV positive) included in the analytic sample. The median follow-up time for all participants was 12.0 years (IQR, 5.0–12.5). The rates of loss to follow-up and death were 21.8% and 9.6%, respectively. Most participants identified as non-Hispanic white (60.0%) had obtained at least a high school education (77.9%) and were recruited in the earlier enrollment period (52.7%) (Table 1). Across follow-up, participants had a median age of 53.0 years (IQR, 46.0–60.0) and most (81.5%) reported medication insurance coverage and had a median of two health care visits (health care use) before each semiannual MACS visit (IQR, 1.0–4.0). Details on insurance type and characteristics stratified by HIV status are reported in Table 1. Among HIV-positive participants, most indicated using HAART (78.2%) and self-reported at least 95% adherence (75.7%). More than half maintained an undetectable VL (57.7%) and had a CD4 count ≥200 (53.5%) (Table 1). The overall median number of non-HIV medications used at each visit was three (IQR, 2.0–5.0), with a higher number among HIV-positive than HIV-negative participants (four vs. three; p < 0.001). The overall prevalence of polypharmacy across all study visits was 33.1% and was more common among HIV-positive (36.2%) compared with HIV-negative (30.0%) participants (p < 0.001).
Characteristics of Multicenter AIDS Cohort Study (MACS) Participants by HIV Status Across All Visits From 2004 to 2016 (n = 53,583)
Measured at baseline; the number of participants used to calculate baseline visit percentages was 3160 (HIV positive: n = 1715; HIV negative: n = 1445).
ART, antiretroviral therapy; HAART, highly active antiretroviral therapy; IQR, interquartile range.
Polypharmacy trajectories among all participants
Four distinct trajectory groups of polypharmacy emerged in the overall sample: (1) nonpolypharmacy, (2) slowly increasing polypharmacy, (3) rapidly increasing polypharmacy, and (4) sustained polypharmacy (Fig. 1). The best-fitting model had an observed BIC of −27,497.70, with the sizes of the groups ranging from 12.8% to 46.0%, and entropy values ranging from 0.85 to 0.90. Figure 1A illustrates the probability of polypharmacy in each group from 2004 to 2016 (visits 40–65). Participants in the nonpolypharmacy group (46.0% of participants) maintained the lowest probability of polypharmacy at <6% across the observation period. The slowly increasing polypharmacy group (25.9% of participants) began with a 16.7% probability of polypharmacy at visit 40, which steadily increased to 58.6% at visit 65. The rapidly increasing polypharmacy group (12.8% of participants) began with a 12.6% probability of polypharmacy at visit 40, which quickly increased around visit 45 to 40.0%, ending at more than 85.8% at visit 65. The sustained polypharmacy group (15.2% of participants) maintained the highest probability (above 75%) of polypharmacy across the observation period.
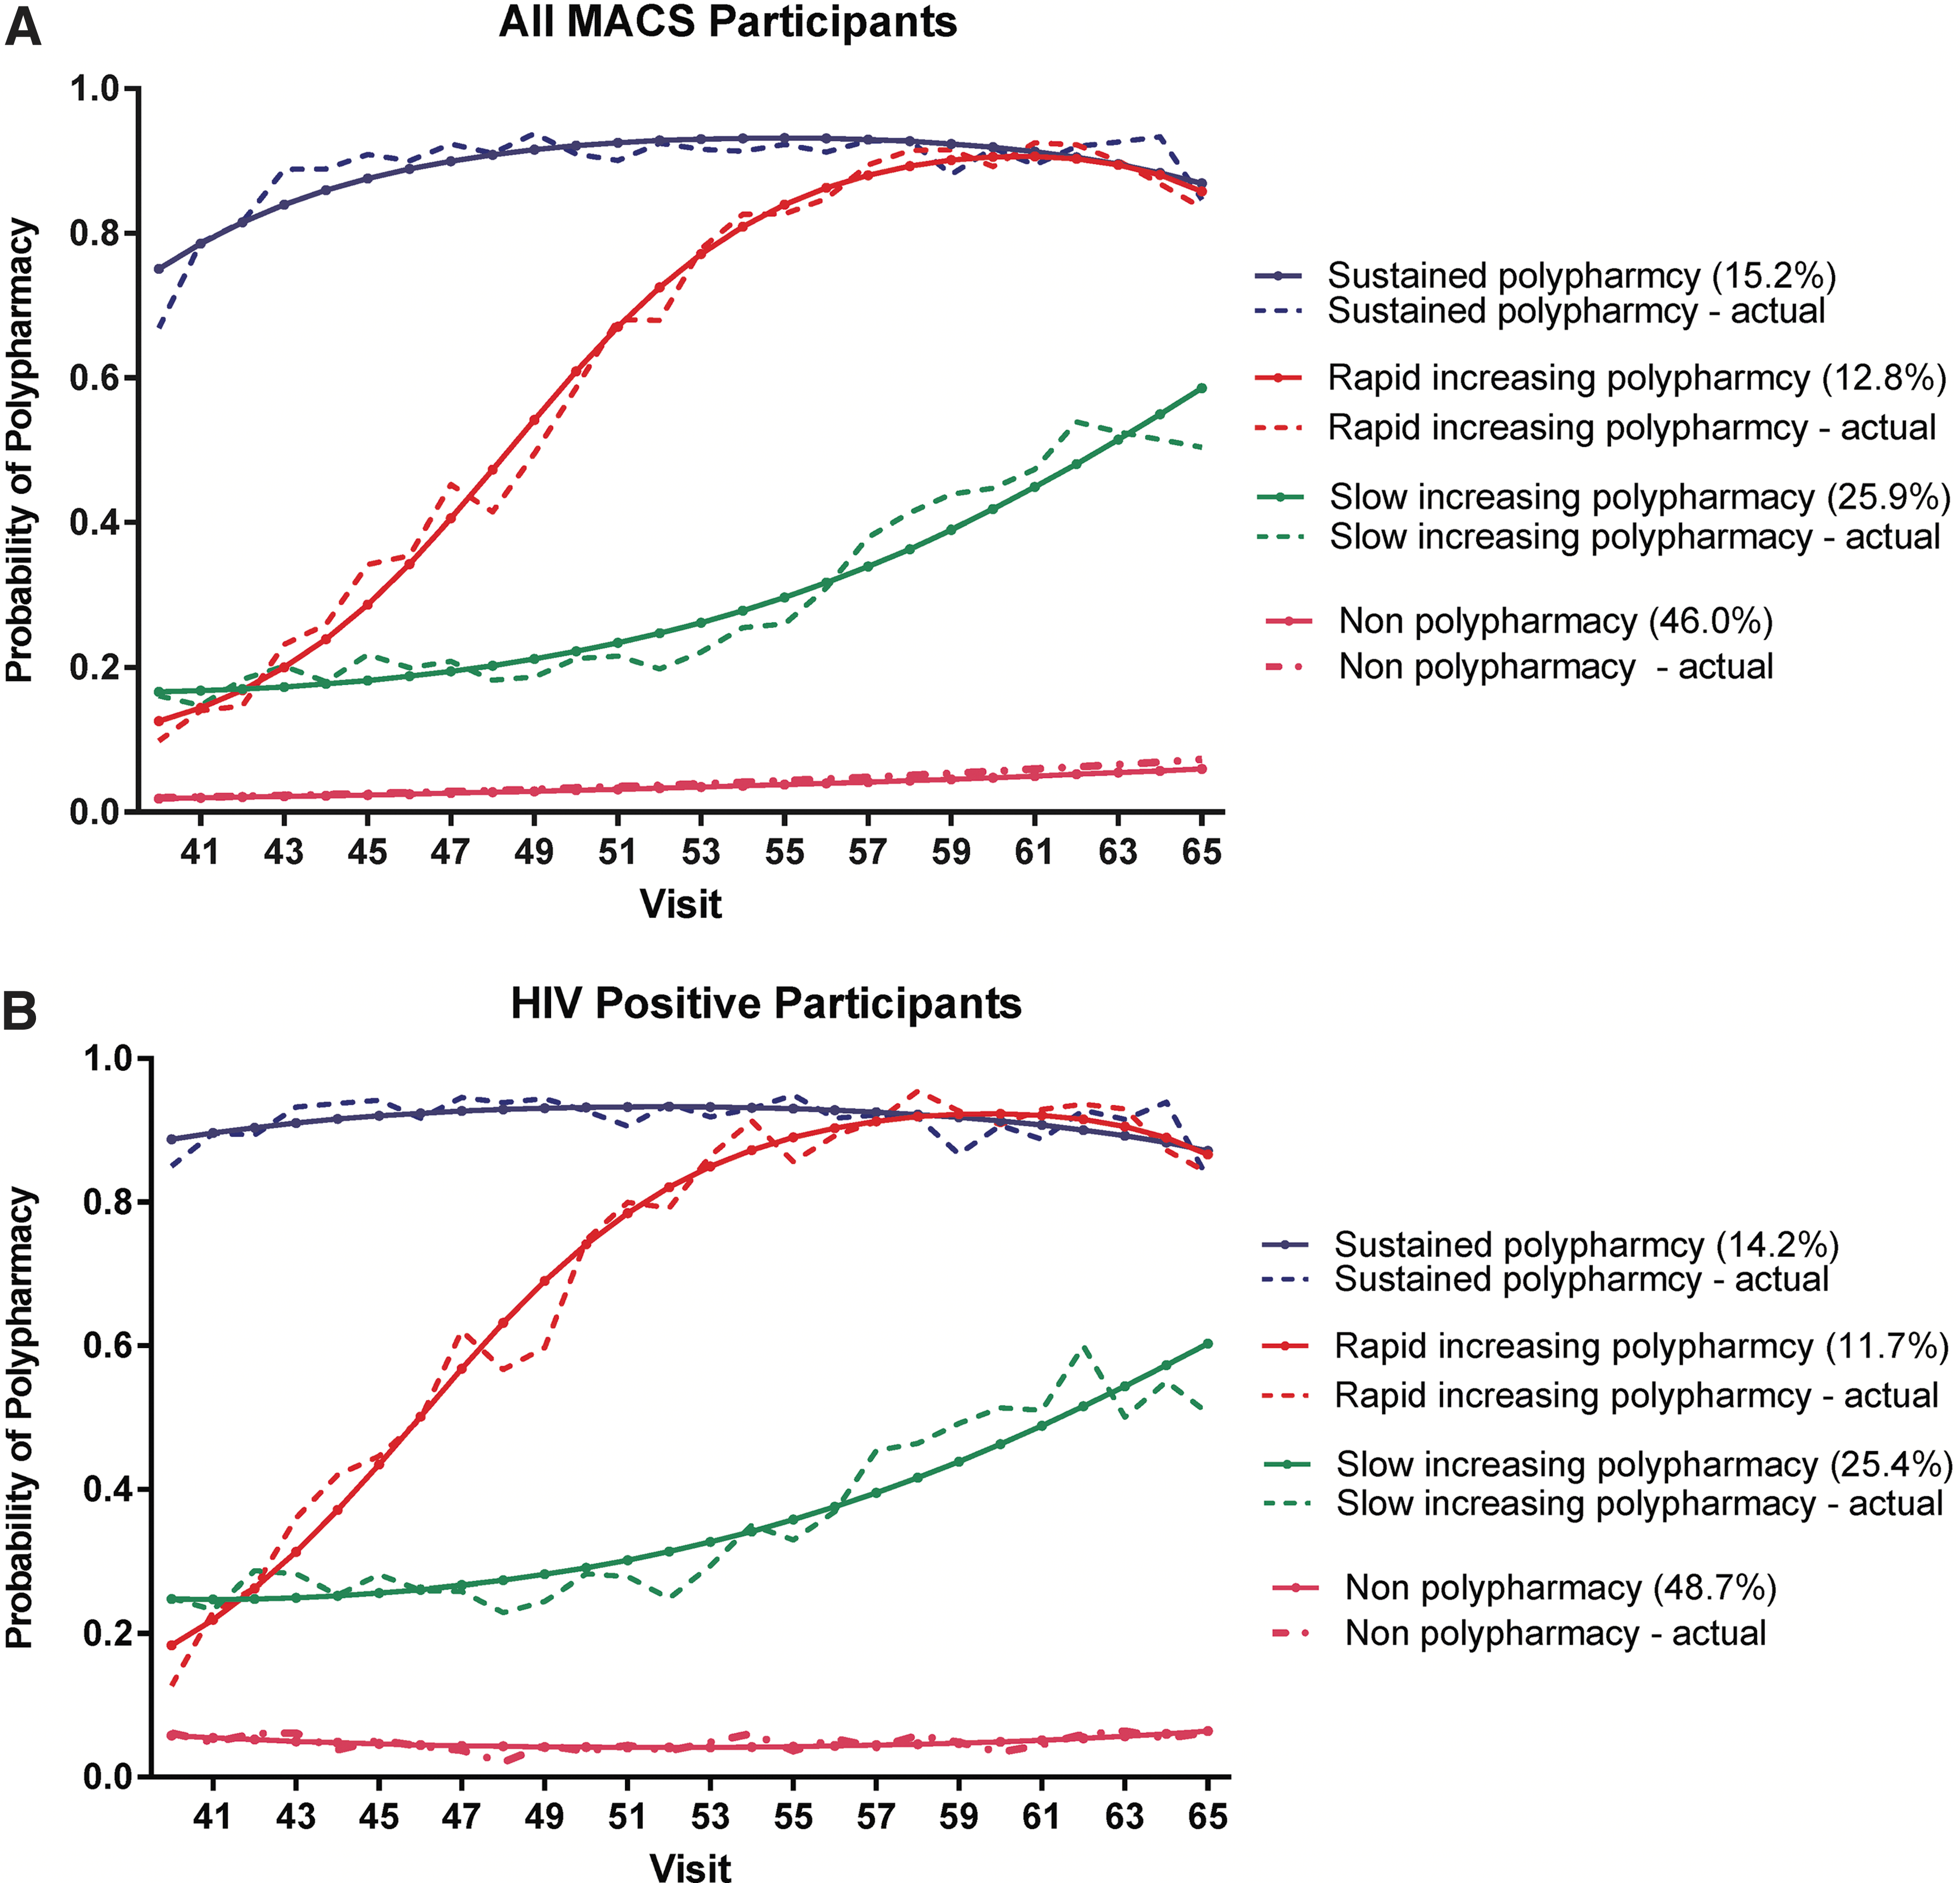
Trajectories of polypharmacy among all MACS and HIV-positive MACS participants. MACS, Multicenter AIDS Cohort Study.
Table 2 displays the characteristics of all participants by group membership. Approximately half of the participants in the nonpolypharmacy group were HIV positive (52.7%) and non-Hispanic white (48.0%), with 60.6% recruited in the late period. Half reported private insurance (52.8%) with most having medication insurance coverage (73.4%). They were also the youngest [median age, 50.0 years (IQR, 42.0–57.0)] among the four groups. Among participants in the slowly increasing polypharmacy group, 57.9% were HIV positive, 67.6% were non-Hispanic white, 60.2% were recruited in the earlier period, and 82.6% reported insurance coverage. The median age in this group was 53.0 years (IQR, 47.0–60.0). In the rapidly increasing polypharmacy group, 52.2% were HIV negative, 76.2% were non-Hispanic white, 65.8% were recruited in the earlier period, and 91.1% reported medication insurance coverage, with a median age of 57.0 years (IQR, 50.0–63.0). Participants in the sustained polypharmacy group were the oldest [58.0 years (IQR, 52.0–63.0)], majority HIV positive (62.7%), mostly non-Hispanic white (75.2%), recruited in the earlier period (74.2%), had private insurance (66.7%), and 92.4% reported medication insurance coverage. Health care use (in median visits) was the lowest in the nonpolypharmacy group [1.0 (IQR, 0.0–3.0)] and the highest in the sustained polypharmacy group [4.0 (IQR, 2.0–8.0)].
Baseline (n = 3160) and Time-Varying Characteristics (n = 53,583) of Trajectory Groups in the Full Multicenter AIDS Cohort Study (MACS) Sample
Measured at baseline; number of participants used to calculate baseline visit percentages was 3160 (HIV positive: n = 1715; HIV negative: n = 1445).
IQR, interquartile range.
Polypharmacy trajectories among HIV-positive participants
We identified similar trajectory groups among the HIV-positive participants, as illustrated in Fig. 1B: 48.7% in the nonpolypharmacy group, 25.4% in the slowly increasing polypharmacy group, 11.7% in the rapidly increasing polypharmacy group, and 14.2% in the sustained polypharmacy group. The best-fitting model had an observed BIC of −15,797.95, with group sizes ranging from 11.7% to 48.7%, and entropy values ranging from 0.88 to 0.95. Table 3 displays the characteristics of the HIV-positive participants in each of the polypharmacy groups. These characteristics were similar to those found in the full sample trajectory groups. In regard to HIV-related factors, 21.1% of nonpolypharmacy group members indicated no ART use and only 68.6% were at least 95% adherent to their ART medications. They also experienced the highest rate of detectable viremia and CD4 count <200 cells/mm3 at 33.1% and 35.5%, respectively (p < 0.001) (Table 3).
Baseline (n = 1715) and Time-Varying Characteristics (n = 27,051) of Trajectory Groups in HIV-Positive Participants
Measured at baseline; number of participants used to calculate baseline visit percentages was 3160 (HIV positive: n = 1715; HIV negative: n = 1445).
ART, antiretroviral therapy; HAART, highly active antiretroviral therapy; IQR, interquartile range.
Factors associated with membership in sustained, rapid, and slow increasing polypharmacy groups among all participants
After adjustment for co-factors, HIV-positive participants (vs. HIV-negative participants) were more likely to be in the sustained [aOR, 2.24 (95% CI, 1.69–2.96)], rapidly increasing [aOR, 1.19 (95% CI, 0.90–1.58)], and slowly increasing [aOR, 1.23 (95% CI, 0.98–1.54)] polypharmacy groups than in the nonpolypharmacy group (Table 4). Compared with non-Hispanic white participants, non-Hispanic black participants [aOR, 0.45 (95% CI, 0.30–0.67)] had lower odds of membership in the sustained polypharmacy group, while those of other races/ethnicities [aOR, 1.05 (95% CI, 0.65–1.69)] had higher odds. Being 50 years of age and older [aOR, 2.20 (95% CI, 1.73–2.80)], having been recruited in the early enrollment period [aOR, 2.97 (95% CI, 2.13–4.16)], having a college degree or higher [aOR, 1.62 (95% CI, 1.20–2.17)], reporting public insurance [aOR, 2.00 (95% CI, 1.57–2.56)], reporting medication insurance coverage [aOR, 1.45 (95% CI, 1.11–1.89)], and having greater health care use [aOR, 1.11 (95% CI, 1.09–1.13)] were associated with greater odds of membership in the sustained polypharmacy group. In comparison with being located in the Baltimore, Maryland/Washington, DC, area, living in Chicago [aOR, 0.82 (95% CI, 0.56–1.19)], Pittsburgh [aOR, 0.65 (95% CI, 0.45–0.92)], and Los Angeles [aOR, 0.33 (95% CI, 0.23–0.48)] presented lower odds of membership in the sustained polypharmacy group. The associations between the co-factors and membership in rapidly increasing and slowly increasing polypharmacy groups are reported in detail in Table 4.
Multi-Variable Risk Factors for Membership in the Sustained, Rapid Increasing, and Slow Increasing Polypharmacy Groups Relative to Nonpolypharmacy Group Among All Multicenter AIDS Cohort Study (MACS) Participants
Statistically significant at p < 0.05.
CI, confidence interval.
Factors associated with membership in sustained, rapid, and slow increasing polypharmacy groups among HIV-positive participants
Among HIV-positive participants, reporting public insurance [aOR, 2.39 (95% CI, 1.71–3.34)], being enrolled in the earlier enrollment period [aOR, 2.58 (95% CI, 1.68–3.96)], having a college degree or higher [aOR, 1.99 (95% CI, 1.30–3.06)], and a unit increase in health care use [aOR, 1.11 (95% CI, 1.08–1.14)] were associated with increased likelihood of membership in the sustained polypharmacy group compared with the nonpolypharmacy group (Table 5). Having a detectable VL [aOR, 0.76 (95% CI, 0.62–0.94)] was associated with decreased likelihood of membership in the sustained polypharmacy group. The associations with rapidly increasing and slowly increasing polypharmacy group membership are reported in detail in Table 5.
Multi-Variable Risk Factors for Membership in the Sustained, Rapid Increasing, and Slow Increasing Polypharmacy Groups Relative to Nonpolypharmacy Group Among HIV-Positive Multicenter AIDS Cohort Study (MACS) Participants
Statistically significant at p < 0.05.
ART, antiretroviral therapy; HAART, highly active antiretroviral therapy; IQR, interquartile range.
Discussion
In this large well-characterized cohort of HIV-positive and HIV-negative men, four distinct groups of polypharmacy (overall and among HIV-positive participants only) emerged. Half of all participants (53.9%) and half of HIV-positive participants (51.3%) had membership in one of the three categories of increasing or high polypharmacy groups. Polypharmacy seems to be driven by access care through insurance coverage and health care utilization, particularly among HIV-positive participants.
This novel approach to examining the patterns and associated risk factors of polypharmacy produced results consistent with current published research. Kantor et al. found statistically significant increases in polypharmacy over a 12-year period using data from the National Health and Nutrition Examination Survey. 8 Charlesworth et al. reported the median number of prescribed medications doubling from two to four, and the proportion taking five or more medications tripling over a 22-year period. 9 In a study comparing PLWH and non-PLWH, Moore et al. also found increases in polypharmacy in both populations, with rates increasing among PLWH. 23 Similar to these studies, we found older age, being HIV positive, medication coverage, and increased health care use were strong risk factors for polypharmacy. However, in contrast to Charlesworth et al., we found non-white participants had a decreased risk of being in the higher polypharmacy groups. 9 We also found lower educational attainment to be associated with reduced likelihood of membership in higher polypharmacy groups, which is contrary to published literature that found it to be a risk factor for polypharmacy. 24,25 The positive association between early recruitment and polypharmacy may be explained by early recruited participants being, on average, older than those in the later recruitment period. Among HIV-positive participants, this association may be due to longer duration of infection. The geographic location of participants was associated with group membership. In comparison with the Baltimore, Maryland/Washington, DC, location, participants in Chicago, Pittsburgh, and Los Angeles/San Francisco were less likely to be in the sustained polypharmacy group. The largest employer in the Baltimore, Maryland/Washington, DC, area is the US federal government, which has higher salary and benefits than private sector jobs. 26 With insurance coverage being a key driver of polypharmacy in this cohort, this may explain the increased likelihood of polypharmacy among participants in this location.
Among HIV-positive participants, some associations, such as age and race/ethnicity, were no longer statistically significant. Earlier onset of age-related comorbidities among HIV-positive individuals may have attenuated the association between age and polypharmacy. 3 Surprisingly, the association between CD4 cell count and polypharmacy was not statistically significant, while VL detectability was. The direction of effect for both was the opposite of what would be expected. HIV-positive individuals experience chronically elevated levels of inflammation that contribute to increase incidence of comorbidities. 7 In the overall analysis of this sample, we found HIV-negative participants with slightly higher rates of aging-related comorbidities; however, polypharmacy was found to be significantly higher among HIV-positive participants. 14 HIV-positive participants with medication insurance coverage had higher rates of viral suppression and CD4 cell counts greater than 200 cells/mm3. Further, rates of medication insurance coverage were higher among HIV-positive participants. This points to higher access to care (i.e., medication insurance coverage) among HIV-positive participants as a driver of polypharmacy rather than comorbidities or virologic or immunologic control. However, care must be taken when considering these implications. Participants in the nonpolypharmacy group had lower medication insurance coverage, fewer health care visits, and, among those who were HIV positive, had lower CD4 cell counts, had lower rates of VL suppression, and reported less ART medication use.
There are several limitations to this study. First, we relied on participants' self-reported medication use, presenting the possibility of recall bias. Short-term medication use, such as antibiotics, may have been underreported. In addition, there is concern that including short-term medication use could impact the results and identification of trajectory groups. However, these medications represent a small percentage (<5% across 12-year period) of polypharmacy and are unlikely to affect group identification. Second, physician bias in prescribing practice may have influenced polypharmacy rates in this cohort, particularly among HIV-positive participants. 27 Third, the probability of polypharmacy within each trajectory group may have been influenced by loss to follow-up or deaths. This was especially true for the sustained polypharmacy group, in which the participants were more likely to be HIV positive and older. To account for possible attrition, we controlled for those factors in the model. Fourth, this study was restricted to HIV-positive and HIV-negative men in four major metropolitan areas; therefore, results may not be generalizable to the general population of HIV-positive and HIV-negative persons. And finally, group assignments were an approximation of real-life behaviors; therefore, care must be taken in applying these trajectories to real-life scenarios. Last, this study did not distinguish between medically appropriate and inappropriate prescribing practices as well as prescribed and nonprescribed medications. Despite these limitations, there were considerable strengths in our evaluation of polypharmacy in this long-term cohort. The MACS undertook standardized collection of medication use over time, which was recorded semiannually, including capture of nonprescription medications and nutritional supplements. To our knowledge, this is the first report using group-based trajectory analysis to ascertain patterns of polypharmacy in a long-term cohort.
More than half of participants belonged to groups that demonstrated a pattern of increasing or sustained polypharmacy. Our study revealed that access to care, through medication insurance coverage and increased health care use, was a key driver of polypharmacy in this cohort, and those in the nonpolypharmacy group had less insurance, had fewer health care visits, and were less immunologically suppressed (HIV positive). Further exploration of medically appropriate and inappropriate prescribing practices in the context of polypharmacy and its impact on health outcomes in this population is warranted.
Additional information
The MACS website is located at
Footnotes
Acknowledgments
Data in this article were collected by the Multicenter AIDS Cohort Study (MACS) with centers at Baltimore (U01-AI35042): The Johns Hopkins University Bloomberg School of Public Health: Joseph B. Margolick [principal investigator (PI)], Todd Brown (PI), Jay Bream, Adrian Dobs, Michelle Estrella, W. David Hardy, Lisette Johnson-Hill, Sean Leng, Anne Monroe, Cynthia Munro, Michael W. Plankey, Wendy Post, Ned Sacktor, Jennifer Schrack, and Chloe Thio; Chicago (U01-AI35039): Feinberg School of Medicine, Northwestern University, and Cook County Bureau of Health Services: Steven M. Wolinsky (PI), Sheila Badri, Dana Gabuzda, Frank J. Palella, Jr., Sudhir Penugonda, John P. Phair, Susheel Reddy, Matthew Stephens, and Linda Teplin; Los Angeles (U01-AI35040): University of California, UCLA Schools of Public Health and Medicine: Roger Detels (PI), Otoniel Martínez-Maza (PI), Otto Yang (co-PI), Peter Anton, Robert Bolan, Elizabeth Breen, Anthony Butch, Shehnaz Hussain, Beth Jamieson, John Oishi, Harry Vinters, Dorothy Wiley, Mallory Witt, Stephen Young, and Zuo Feng Zhang; Pittsburgh (U01-AI35041): University of Pittsburgh, Graduate School of Public Health: Charles R. Rinaldo (PI), Lawrence A. Kingsley (PI), Jeremy J. Martinson (PI), James T. Becker, Phalguni Gupta, Kenneth Ho, Susan Koletar, John W. Mellors, Anthony J. Silvestre, and Ronald D. Stall; Data Coordinating Center (UM1-AI35043): The Johns Hopkins University Bloomberg School of Public Health: Lisa P. Jacobson (PI), Gypsyamber D'Souza (PI), Alison Abraham, Keri Althoff, Michael Collaco, Priya Duggal, Sabina Haberlen, Eithne Keelaghan, Heather McKay, Alvaro Muñoz, Derek Ng, Anne Rostich, Eric C. Seaberg, Sol Su, Pamela Surkan, and Nicholas Wada; National Institute of Allergy and Infectious Diseases: Robin E. Huebner; and National Cancer Institute: Geraldina Dominguez.
The MACS is primarily funded by the National Institute of Allergy and Infectious Diseases, with additional co-funding from the National Cancer Institute, the National Institute on Drug Abuse, and the National Institute of Mental Health. Targeted supplemental funding for specific projects was also provided by the National Heart, Lung, and Blood Institute and the National Institute on Deafness and Communication Disorders. MACS data collection is also supported by grant UL1-TR000424 (Johns Hopkins University Institute for Clinical and Translational Research) from the National Center for Advancing Translational Sciences, a component of the National Institutes of Health (NIH), and NIH Roadmap for Medical Research. This research was supported by the NIH by interagency agreement with the National Institute of Allergy and Infectious Diseases, the Eunice Kennedy Shriver National Institute of Child Health and Human Development, and other NIH Cooperative Agreements (U01-HD-32632); and National Institute on Minority Health and Health Disparities (R01-MD010680) [Washington, DC/Baltimore, MD Metropolitan Area: Michael Plankey (co-PI) and M. Reuel Friedman (co-PI)].
Author Disclosure Statement
No competing financial interests exist.