
Abstract
Although pre-exposure prophylaxis (PrEP) has been approved for primary HIV prevention for individuals aged 18 years or older since 2012, PrEP utilization has been suboptimal. To understand trends in PrEP provision from the health care providers' perspective, we systematically assessed each specific stage along the PrEP implementation cascade (i.e., awareness, willingness, consultation, and prescription) among health care professionals (HCPs) in the United States. Between June and December 2018, we conducted a systematic review of published studies on this topic. A total of 36 eligible studies were identified and included in the analyses. Random-effect models were employed to examine the pooled prevalence of each key stage along the cascade. Time trend and subgroup analyses were conducted. A thematic analysis was used to identify barriers and facilitators along the PrEP cascade. In this study, a total of 18,265 HCPs representing diverse demographics were included. The pooled prevalence of PrEP awareness was 68% [95% confidence interval (CI) = 55–80%], willingness to prescribe PrEP was 66% (95% CI = 54–77%), PrEP consultation was 37% (95% CI = 25–51%), and prescription provision was 24% (95% CI = 17–32%). Subgroup analyses revealed that PrEP provision among HCPs was lowest in the south, but has been improving annually nationwide. Infectious disease specialists [odds ratio (OR) = 4.06, 95% CI = 3.12–5.28; compared with primary care providers] and advanced practice registered nurses/physician assistants (OR = 1.51, 95% CI = 1.09–2.09; compared with physicians) had higher odds of prescribing PrEP. Barriers and facilitators regarding optimal PrEP implementation were embedded within individual, dyadic, social, and structural levels. This meta-analysis has comprehensively examined the trend and pattern of PrEP implementation among HCPs. To achieve optimal implementation of the PrEP cascade in the United States, tailored training and programs need to be provided to HCPs.
Introduction
An estimated 1.1
To curb the HIV epidemic, the US Food and Drug Administration (FDA) approved the use of daily oral pre-exposure prophylaxis (PrEP, brand name Truvada®) for primary HIV prevention in 2012 for “at-risk individuals aged 18 years or older,” and expand this indication to adolescents in 2018, based upon sufficient evidence of efficacy and safety from multiple clinical trials. 4 –9 In 2014, the Centers for Disease Control and Prevention (CDC) released clinical practice guidelines for health care providers to facilitate in prescribing PrEP to individuals with indications for its use, 10 and the US Preventive Services Task Force (USPSTF) issued a final grade A recommendation statement endorsing provision of PrEP to persons at high risk of HIV acquisition. 11,12 Based upon these recommendations, before prescribing PrEP, clinicians should confirm HIV-negative serostatus, assess kidney function, and test for hepatitis B and C, sexually transmitted infections, and pregnancy (when pertinent). 11
Although health care professionals (HCPs) have made tremendous efforts, the uptake and provision of PrEP among people at risk of HIV acquisition has been slow. 13 Although there has been a 73% overall increase in PrEP uptake since 2012, of a large number of persons who were at substantial risk of HIV infection in 2016 [1,232,000, 95% confidence interval (CI) = 661,000–1,803,000], 13,14 only a small proportion (6.4%) were prescribed the medication. Even with this small proportion of PrEP users, significant disparities are observed across different geographical regions and at-risk groups. For instance, the rate of PrEP uptake in the northeast (47.4/100,000) was approximately two times higher than that in the south (22.6/100,000), west (28.1/100,000), and midwest (23.5/100,000), respectively. 15 There were 14 times more male PrEP users than female users in 2016, 15 and PrEP users are predominantly white. 16 Further, PrEP use remains underutilized among various at-risk groups, including MSM (3–6%), 17 –19 black and Hispanic women (2%), 20 injecting drug users (IDUs) (<2%), 21 and sex workers (no reported data) in the United States. 21 –23 In addition, significant racial/ethnic disparities have been observed among PrEP users: blacks account for 44% of new HIV infections, only 10% of those on PrEP in 2015 were black. 12,20 Thus, the provision of PrEP for people at risk of HIV acquisition and concomitant health disparities has become a top priority and significant research gap.
Nunn et al. proposed a “PrEP implementation cascade” model that suggests that progression along stages of the cascade must involve interaction and engagement among patients, HCPs, and other critical stakeholders in the system. 24 Most available studies describing barriers to PrEP use, however, primarily focus on patient-level factors ranging from individual (e.g., ethnicity/race and age), 25,26 dyadic (e.g., mistrust with HCPs), 27 social (e.g., HIV stigma), 28 –30 or structural factors (e.g., insurance coverage,) 31 –33 with a smaller number of studies examining the role of health providers 34 –36 and other key stakeholders (e.g., pharmacists and community workers) 34,35,37 –42 as well as barriers embedded within PrEP implementation (e.g., prescription logistics and location of PrEP clinics). 31 –33
Studies focusing on HCPs either quantitatively examine factors that may influence PrEP prescription including sociodemographic variables (e.g., gender and race/ethnicity), practice characteristics (e.g., years of practice, expertise, and discussion of sexual history with patients), 43 –45 cognitive variables (e.g., attitudes and beliefs), 36 and structural factors (e.g., available trainings and cost) 36 among HCPs in different settings (e.g., primary care settings and HIV clinics), 46 –48 or qualitatively examined their concerns (e.g., patients' risk compensation behaviors and medication side effects) and solutions (e.g., tailored training) regarding PrEP provision. 29,41,49 Further, several previous reviews have synthesized findings to describe the critical role of HCPs in PrEP implementation. 34,35,46,47,50 For instance, a series of reviews conducted by Krakower and Mayer have comprehensively described different types of providers along the PrEP implementation cascade, in addition to proposed practical strategies for promoting optimal PrEP usage. 34,35,50 However, lack of a systematic quantitative assessment of the provider PrEP implementation cascade may serve as a limitation for interpreting findings from these and other reviews. Besides, the “purview paradox” [i.e., neither infectious disease (ID) specialists nor primary care providers (PCPs) believe that PrEP care falls within their practice] has been consistently mentioned as a key barrier to PrEP implementation, 29,51,52 but no studies have assessed this phenomenon quantitatively. Further, Pinto et al. identified multi-level challenges among HIV service providers and individuals at risk for infection (e.g., cognitive barriers and PrEP stigma) along the PrEP implementation cascade. 29 However, most existing reviews segment health providers (e.g., physicians) from other HCPs (e.g., pharmacists) who also play a key role in PrEP implementation. 34,35,46,47,50
To date, no studies have systematically examined PrEP implementation among HCPs in the United States as well as corresponding barriers and facilitators using statistically rigorous analytical strategies, such as meta-analysis. To fill this gap, the goal of this study is to identify and synthesize existing data along the PrEP implementation cascade among HCPs in the United States with three specific aims: (1) to quantitatively estimate the proportion of HCPs at each specific stage (e.g., awareness, willingness to prescribe, patient consultation, and actual prescription) along the PrEP cascade and quantitatively evaluate the “purview paradox” phenomena among HCPs, (2) to identify barriers and facilitators associated with PrEP implementation reported by each individual study, and (3) to make pragmatic recommendations for future programs aiming to promote PrEP implementation within the current health system in the United States.
Methods
This review was conducted following the Preferred Reporting Items for Systematic Reviews and Meta-Analyses guideline (Supplementary Table S1). 53 –56 For the first aim, studies were included if they reported provider-level data on PrEP care implementation in the United States. For the second aim, we extracted identified barriers and facilitators along the PrEP implementation cascade from included studies. Where multiple articles reported a single cohort, only the article with the most comprehensive data was included. We registered this review in the International Prospective Register of Systemic Reviews (Registration No. CRD42019122876).
Search strategy and study selection
Between June and December 2018, we conducted a comprehensive literature search from multiple databases including PubMed/MEDLINE, Web of Science, PsycINFO, EMBASE, and Google Scholar, with the following key words HIV and/or AIDS; health professionals and/or health providers; and PrEP care cascade or implementation (Supplementary Table S2). We also conducted a thorough search of conference proceedings, as well as references from reviews and articles that met our inclusion criteria. Two reviewers (C.Z. and Y.L.) independently reviewed articles identified in the initial search and disagreement was resolved by discussion (inter-rater reliability >95%). We also contacted one study author to clarify data information, but no response was obtained.
Published articles were included if they (1) presented results on PrEP implementation cascade for a sample including at least one type of HCPs and specialty [e.g., pharmacists, advanced nurse practitioners, and physician assistants (PAs), or physicians in specialties including HIV/ID, obstetrics-gynecology (OBGYNs), family medicine, internal medicine, PCPs] in the United States; (2) used quantitative (e.g., randomized control trials and cross-sectional/cohort studies) or qualitative (e.g., focus group and in-depth interviews) or mixed-method study designs; (3) reported quantitative measures (proportions) for any stages of the PrEP implementation (e.g., PrEP awareness, acceptance/willingness to prescribe PrEP, consultation on PrEP use, and PrEP prescription); or provided sufficient information to calculate pooled estimates; and (4) were peer reviewed and published in English, and could be searched from indexed databases or published sources. We excluded articles if they were (1) descriptive studies (e.g., case studies or case reports) or studies without quantitative measurements; (2) studies that only report data at patient- or institution- or state level; (3) reviews/meta-analyses; and (4) theoretical/modeling studies without original data.
Data extraction
Statistical analyses
Aim 1: synthesized pooled proportions
Prevalence of PrEP awareness (proportion of those who had ever heard of PrEP), willingness to prescribe PrEP (proportion of those who self-reported willingness to prescribe PrEP), PrEP consultation (proportions of those who ever provided PrEP-related consultation to patients), and PrEP prescription (proportion of those who have prescribed PrEP), were the key estimates in the current analyses. We calculated these PrEP implementation estimates by selected provider demographic characteristics, specialties, and professions, for studies in which these data were available. We also calculated the odds ratio (OR) for each PrEP cascade outcome by selected provider characteristics. For example, using the raw data we calculated the ratio of the odds of prescribing PrEP among advanced practice registered nurses (APRNs; number of APRNs who prescribed PrEP/the number of APRNs who did not prescribe PrEP) to the odds of prescribing PrEP among physicians (number of physicians who prescribed PrEP/the number of physicians who did not prescribe PrEP).
We employed the DerSimonian–Laird random-effects model to weight and pool the individual estimates, 57 as all included studies were conducted among different populations across heterogeneous settings. 58 Unlike the fixed effects model that assumed that all studies shared identical true effect sizes, the random-effects model was designed to capture variances of estimates across studies. 58,59 In addition to the overall synthesis, we also conducted subgroup analyses to examine the pooled estimates by location of data collection, study design, and years of when data were collected.
In the analyses, we assessed differences (ORs) in implementing each stage of PrEP cascade across specialties (e.g., ID vs. PCPs) and provider types (e.g., APRNs vs. physicians). In addition, we calculated the pooled proportions for each specific stage along the PrEP cascade using the information provided by each study, with time trend analyses performed to assess whether the significant variance was observed across years. Further, a series of bivariate random-effects meta-regression analyses using aggregate-level data were performed to assess factors that may be associated with each specific stage of the PrEP implementation cascade as well as to explain heterogeneity of included studies better. 60 In addition, sensitivity analyses were employed to examine the stability of the pooled estimates by evaluating whether the overall pooled estimates were sensitive to the exclusion of any individual studies (e.g., study with extreme weights or sample sizes). The I 2-statistic and its corresponding 95% CIs describe heterogeneity, with higher percentages indicating higher heterogeneity. 58 Publication bias was assessed by funnel plots (asymmetry indicating existing publication biases) and Egger's test (testing the asymmetry statistically). 61 We performed all statistical and meta-analysis using STATA®15 (College Station, TX).
Aim 2: barriers and facilitators associated with PrEP care implementation
We extracted factors that were associated with stages of the PrEP cascade that were either reported by HCPs from qualitative studies or identified by analytical models from quantitative studies. Two reviewers (C.Z. and Y.L.) independently coded data from included studies based upon pre-established themes (i.e., barriers and facilitators regarding PrEP provision at individual, dyadic, and structural levels). The inter-rater reliability was >95%, and disagreement was solved by discussion. We further employed a thematic analysis to synthesize data to identify common themes in findings, and a narrative review of both quantitative and qualitative studies was presented.
Results
Search results
The initial search using keywords yielded 300 results. After initial screening by reading titles, 178 were retained for further assessment. An additional 38 articles were identified by hand searching reference lists, resulting in a total of 216 records. These records were assessed by reading abstracts, which yielded 94 references reviewed for full text. Of these, 50 articles were excluded for various reasons: 8 review articles, 15 PrEP care model articles, 7 conceptual articles, 8 reporting patient-level data, 4 reporting state/institution-level data, and 8 no relevant data, resulting in a total of 44 articles that met all inclusion criteria. Among all included publications, four pairs of articles reported the same data, 36,62 –68 and we retained only one from each pair with the most comprehensive information. Therefore, a total of 36 studies were retained that reported data regarding PrEP care implementation among HCPs including 26 quantitative studies, 36,62 –65,68 –92 10 qualitative studies, 49,51,65 –67,93 –99 and 1 study using mixed methods 93 (Supplementary Fig. S1).
Study characteristics
Detailed study characteristics (i.e., authors, publication year, location, time of the survey, recruitment, study design, and key measurements) are reported in Supplementary Tables S3 and S4. Of the 36 included studies, 26 were published since 2015; however, two-thirds of the data were collected before 2015. The majority of quantitative studies employed cross-sectional designs. One study employed a longitudinal open cohort design to assess the PrEP implementation cascade across several years (e.g., 2009–2015), 87 and two studies employed pre-post study designs to assess the effectiveness of a PrEP training intervention, 60 and PrEP awareness before and after the publications of the PrEP efficacy results among physicians. 63,64 For qualitative studies, three employed focus groups 49,94,98 and the remainder used in-depth interviews for data collection.
The majority of studies employed convenience sampling strategies, with only a few using purposive sampling, 36,51,62,93,97 snowball sampling, 96,98 and probability-based sampling. 91 Most data in quantitative studies were collected online (e.g., e-mails survey or web-based data collection), with three studies using in-person data collection (e.g., distributed paper-based questionnaires during professional conferences/workshops) 73,84,86 and one study using a mail-out survey. 89
Aim 1: pooled estimate of each stage of PrEP implementation cascade
A total of 18,265 US-based HCPs with various sociodemographic and backgrounds were identified and included for the Aim 1 analysis. Specifically, 51% (95% CI = 43–58%) of the included participants were female, 69% (95% CI = 66–72%) were white, 28% (95% CI = 17–39%) were APRNs/PAs (as we cannot separate APRNs from PAs among several included studies, 13,85,89,91,93 we combined APRNs with PAs as one category), 39% (95% CI = 25–52%) were PCPs, 31% (95% CI = 17–48%) were trained in ID, and 4% (95% CI = 0–10%) were OBGYNs. Among all studies, two studies collected data from a total of 476 pharmacists. 86,90
In the meta-analyses, we calculated the pooled proportion of each specific stage along the PrEP cascade using all included HCPs as the denominator. At baseline, the pooled prevalence of being aware of PrEP was 68% (95% CI = 55–80%), willingness to prescribe PrEP of the total participants was 66% (95% CI = 54–77%), provided a PrEP consultation was 37% (95% CI = 25–51%), and ever prescribed PrEP was 24% (95% CI = 17–32%). The bivariate meta-regression revealed that OBGYNs were less likely to be aware of PrEP, but no other statistically significant associations were identified between key characteristics and PrEP care implementation among included participants (Table 1 and Supplementary Fig. S2).
Meta-Analysis for Pre-Exposure Prophylaxis (PrEP) Implementation Cascade Among Health Care Professionals (N = 36)
Proportions are based upon meta-analysis using metaprop command.
Nursing cohort includes registered nurse, nurse practitioners, and physician assistants.
Based upon a single data point.
β-coefficient and its corresponding 95% CI, from bivariate regression using metareg command.
p < 0.05.
95% CI, 95% confidence interval; DF, degree of freedom; ID, infectious disease; OBGYNs, obstetrics-gynecology; PrEP, pre-exposure prophylaxis.
Subgroup analyses by geographic location revealed that PrEP care was implemented least optimally in the southern United States, which had the lowest prevalence of provider consultation (37%) and prescription (19%) compared with other regions. In contrast, HCPs in the west reported the highest proportions of PrEP awareness (94%) and consultation (72%). In the northeast, participants reported the highest proportion of provider prescriptions (30%), which was 20% higher than the overall proportion (Table 2 and Fig. 1).
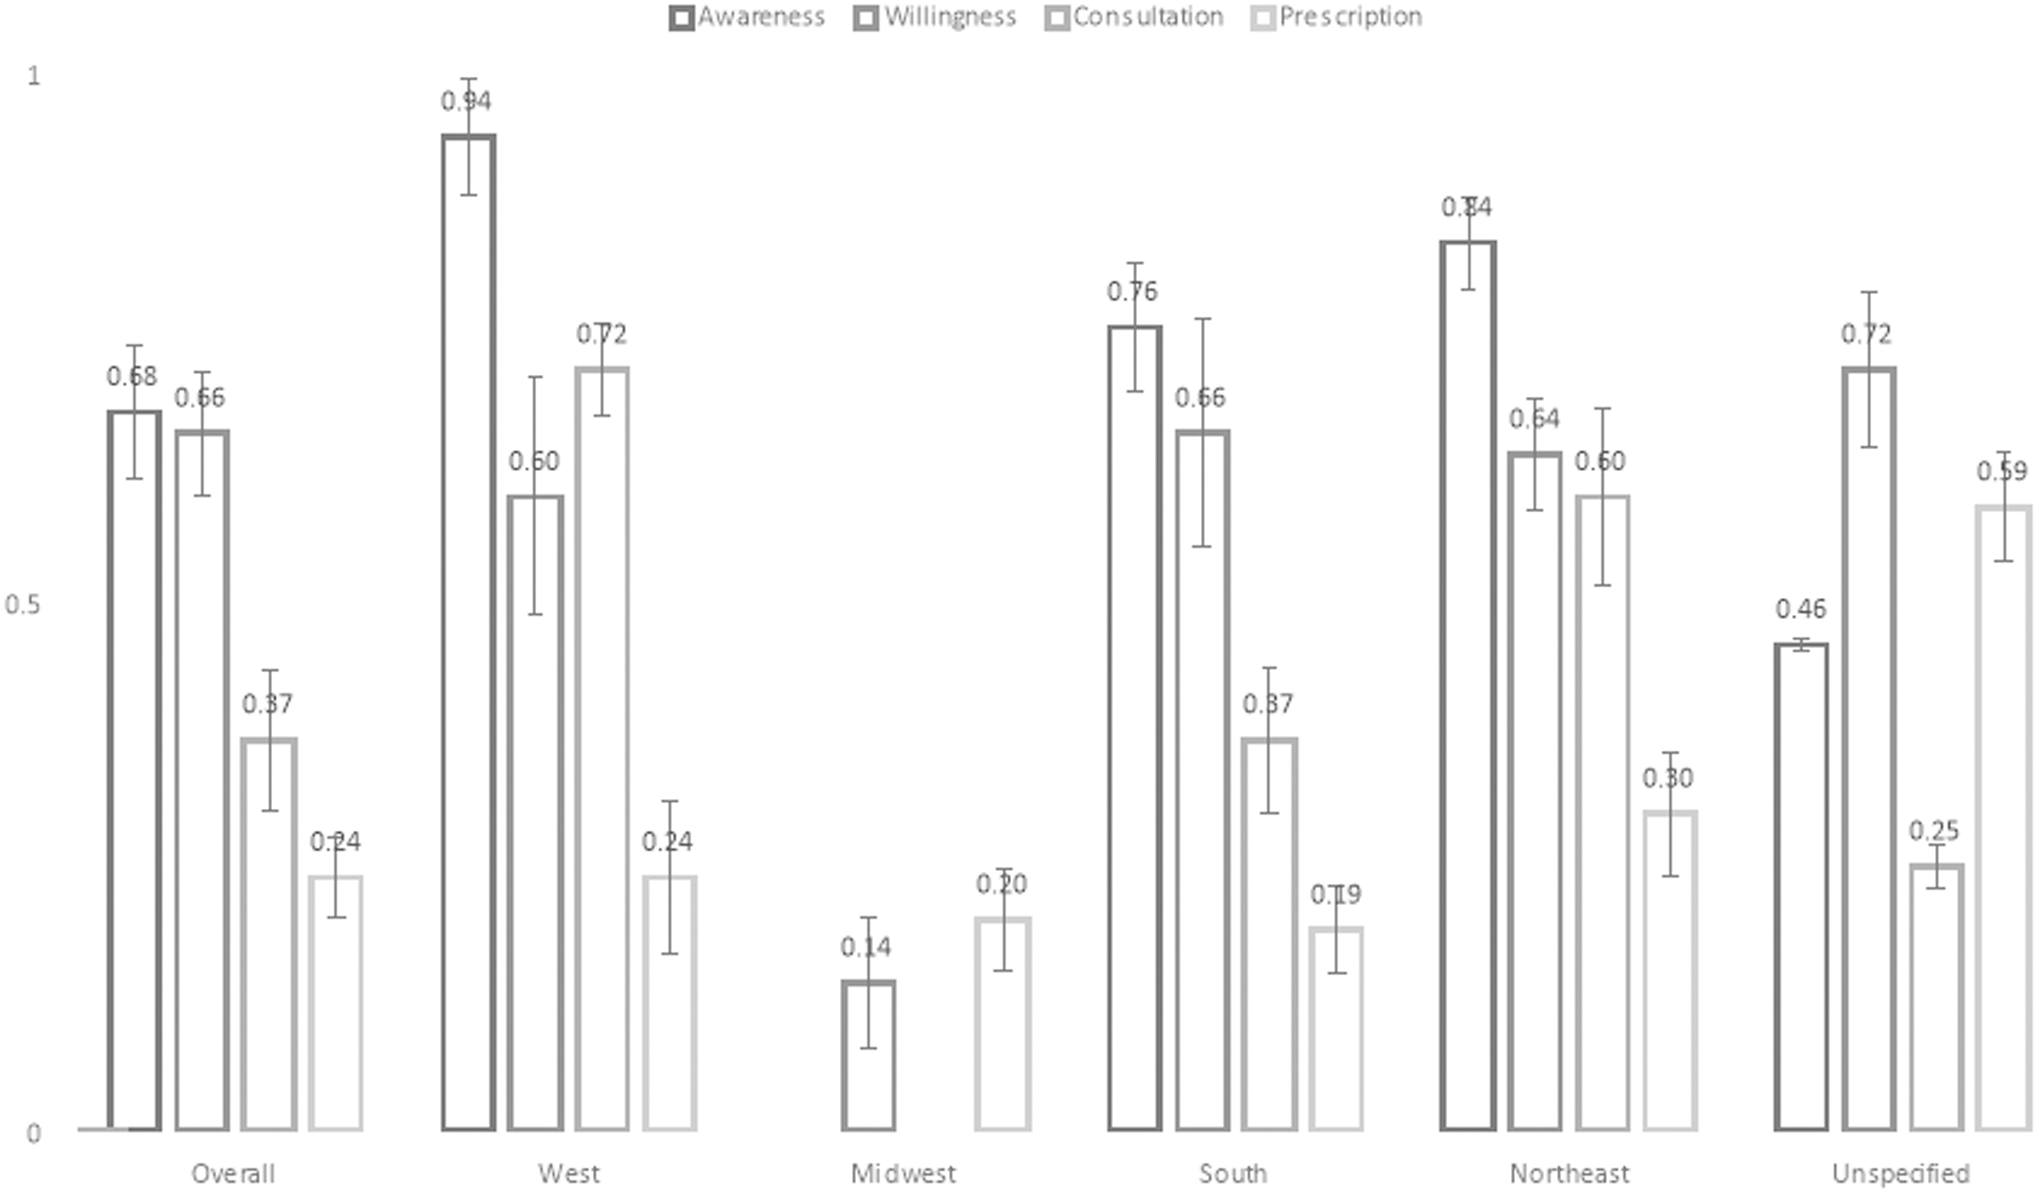
PrEP care implementation among health care professionals by different locations in the United States. Midwest has very limited number of studies. Standard errors are presented to illustrate the variance across different variables. PrEP, pre-exposure prophylaxis.
Subgroup Analyses Based Upon Location, Survey Time, and Types of Health Care Professionals (Baseline, N = 36)
Cannot identify specific locations where the data were collected.
PCP, primary care provider.
Although PrEP implementation among HCPs differed across regions, it improved over time nationally, especially for PrEP prescription (p-trend <0.05). Provider willingness to prescribe PrEP and PrEP consultation also increased over time (Fig. 2). We further examined PrEP implementation between 2013 and 2015, the most recent years after FDA approval, and found that PrEP was better implemented than that when considering all available data across years between 2009 and 2016 (Supplementary Table S5).

PrEP care implementation among health care professionals in the United States (by year). A series of trend tests using “ntrend” command have been used. The trend tests showed PrEP awareness across years is insignificant (z = 0.29; p = 0.771); PrEP willingness across year is insignificant (z = 1.85, p = 0.065); PrEP consultation across year is insignificant (z = 1.20, p = 0.229); PrEP prescription across year is significant (z = 2.96, p = 0.003). Standard errors are presented to illustrate the variance across different variables.
We further assessed PrEP implementation among studies with different designs and found HCPs in quantitative studies reported higher awareness and consultation, but lower prevalence of willingness and prescription than those who participated in qualitative studies (Table 2).
We also examined the “purview paradox” quantitatively. Our analysis showed that compared with PCPs, IDs had higher odds of being aware of PrEP (OR = 6.11, 95% CI = 3.56–10.48), willingness to prescribe PrEP (OR = 3.06, 95% CI = 2.27–4.11), and prescribing PrEP (OR = 4.06, 95% CI = 3.12–5.28). When we examined this phenomenon across different years, we found that PrEP awareness, willingness, and prescription increased incrementally over time among IDs (Supplementary Fig. S3). Our analysis also revealed that the odds of PrEP awareness were lower among APRNs/PAs than among physicians (OR = 0.61, 95% CI = 0.45–0.83); however, once awareness was established, the odds of prescribing PrEP were 1.51 (95% CI = 1.09–2.09) times higher among APRNs/PAs than among physicians, whereas the odds of APRNs/PAs willingness to prescribe were similar (OR = 1.00, 95% CI = 0.98–1.02) to that of physicians (Supplementary Fig. S4a, b). Further, when we examined the cascade over time, we found that the PrEP implementation increased among APRNs/PAs (Supplementary Fig. S5).
Heterogeneity, publication biases, and outlier assessment were all systematically assessed. High between-study heterogeneity was detected across studies evaluating PrEP awareness (I 2 = 98.65%, 95% CI = 98.27–98.95%), willingness (I 2 = 98.06%, 95% CI = 97.61–98.42%), consultation (I 2 = 97.33%, 95% CI = 95.66–98.35%), and prescription (I 2 = 98.85%, 95% CI = 98.67–99.00%) (Table 1). Asymmetries were also evident in funnel plots across all stages along the PrEP implementation cascade, but Egger's test only suggested significant publication biases for studies assessing willingness and prescription (Supplementary Fig. S6). Besides, meta-regression revealed that most outcomes were stable across different practice specialties except for OBGYN (Table 1). Sensitivity analyses, including or excluding studies with extreme weights, showed no significant differences. However, if pharmacists were excluded from the analysis of PrEP consultation, the pooled proportion of consultation became higher among other types of HCPs (p = 0.41, 95% CI = 0.28–0.56 when excluding pharmacists vs. p = 0.37, 95% CI = 0.25–0.51 when including pharmacists).
Aim 2: identified barriers and facilitators associated with PrEP care implementation
A narrative review of barriers and facilitators along the PrEP implementation cascade is presented for each study included in our analysis. After a thematic analysis, multi-level barriers were identified: (1) drug level: provider concerns about efficacy, safety, side effects, and drug resistance, (2) patient level: lack of requests for PrEP and low adherence, (3) provider level: lack of awareness/knowledge/skills, lack of training, workload management, and concerns for potential risk compensation (e.g., reduced condom use after initiating PrEP), and (4) structural level: cost/insurance coverage, lack of PrEP care models, no guidance for specific groups including adolescents, IDUs, and HIV serodiscordant couples. Almost all studies mentioned cost/insurance coverage and safety/efficacy issues as major concerns among HCPs. In contrast, PCPs considered better PrEP knowledge, skills, and experience, having patients who were MSM, serodiscordant couples or who requested PrEP use, and availability of evidence and guidance as to the most promising facilitators of PrEP implementation (Table 3).
Barriers and Facilitators Along Pre-Exposure Prophylaxis Care Implementation Identified from All Included Studies (n = 36)
ART, antiretroviral therapy; IDUs, injecting drug users; IMB, information-motivation-behavioral skills; IPV, intimate partner violence; MSW, men who have sex with women; nPEP, nonoccupational postexposure prophylaxis; OBGYN, obstetrics-gynecology; PWID, people who inject drugs; WSM, women who have sex with men.
Discussion
In this study, we systematically reviewed and rigorously synthesized estimates of PrEP awareness, willingness to prescribe, patient consultation, and PrEP prescription practices among HCPs in the United States. We further quantified the different roles of PCPs and IDs as well as physicians and APRNs/PAs in the cascade. Our findings have crucial implications for enhancing the PrEP implementation cascade for stakeholders, including patients, HCPs, and policymakers.
These study findings reveal several notable discrepancies regarding PrEP implementation. First, a discrepancy between overall awareness and the actual prescription was substantial among HCPs. Our data reveal that the pooled prevalence of PrEP awareness (68%) was similar to the willingness to prescribe (66%), but it was almost three times higher than the prevalence of actual prescription (24%). HCPs have encountered barriers embedded within different levels during their practice, which may hinder the prescription of PrEP for HIV prevention despite the general willingness to prescribe the medication. Although the discrepancy between willingness to prescribe and actual prescribing is large, this discrepancy is similar to the well-recognized concept of clinical inertia or failing to initiate intervention or intensify it appropriately. Clinical inertia has been observed across a range of interventions. 100
Second, although the overall trend is increasing prevalence across stages and the peak of PrEP implementation was observed in 2014, there appears to be a downward trend from 2014 to 2015 on willingness, and perhaps consultations and prescriptions. We also found that the PrEP implementation cascade for the most recent years after FDA approval (2013–2015) was the most optimal. This downturn in the PrEP cascade may be the result of a lack of training or supporting programs for HCPs who were interested in but unable to provide PrEP care.
Third, significant disparities of the PrEP implementation cascade were observed across regions. For instance, the lowest provider-reported prescription prevalence was identified in the south, a region that has among the highest HIV incidence and prevalence. 101 Although several risk factors including poverty, lack of health insurance coverage, mistrust with HCPs, and internalized and structural stigma may contribute to the HIV epidemic in the south, 30,102 suboptimal engagement of HCPs in PrEP care may further exacerbate HIV disparities in this region. In addition to identified regional disparities based upon our analysis, our data echoed the underutilization of PrEP care in the United States from providers' perspective with previously published data from PrEP users' perspective. 15
Fourth, we found several differences in provider-reported PrEP implementation by health care specialty. Although the “purview paradox” prevails in the existing literature, 29,49,51,52 significant distinctions across each stage of PrEP cascade were observed between the actual practice of PCPs and IDs after rigorous assessments. Our review of the literature indicates that a lack of experience and knowledge is reported as the major barriers hindering PCPs from providing PrEP care. Although the feasibility of PrEP provision in primary care settings has been demonstrated by previous research, 35,82 the gap of the trajectory of PrEP diffusion from early adopters (e.g., ID/HIV specialists) to early/late majorities is still significant. 50,103 The purview paradox predicts low PrEP provision by both PCPs and IDs. Resolution of the paradox could be that both PCPs and IDs equally increase PrEP provision, or it could be resolved by one of the two specialties “owning” PrEP provision, thereby one specialty would increase more than the other. The dynamic breakdown of ORs between specialties by years showed the purview paradox is being resolved gradually, although progress is needed requiring sustained effort from all stakeholders.
In addition to health care specialty, we assessed PrEP implementation by the health care profession—physicians and APRNs/PAs. Most published studies emphasized the role of physicians in PrEP implementation. 46,62 –64,71,81 However, our study revealed that although awareness of PrEP among APRNs/PAs was lower than physicians, the odds of prescribing PrEP among APRNs/PAs were 50% higher than physicians. Despite a recently published article advocating for APRNs to accelerate PrEP scale-up, 104 the role of nurses in PrEP implementation has been overlooked in the extant literature. 46,62 –64,71,81 A recent study indicated that the supply of APRNs increased more rapidly than physician supply, especially in rural areas, which can offset the shortage of physician supply in the United States. 105 Therefore, APRNs may be in the ideal position for PrEP care implementation. 104
In addition to these identified discrepancies, “patients' request” is consistently quoted as a critical factor related to the PrEP implementation. 49,80,82 “Patient-centered” care models in which both patients and health providers can make mutual decisions regarding PrEP use are essential for optimal PrEP care implementation in clinical settings. 65,97,106 Further, as pharmacists usually have direct interactions with patients, their role in PrEP uptake and adherence is crucial. 37,42,86,107 More research is urgently needed to explore the engagement of pharmacists in the PrEP care implementation model.
Strengths
This study has several strengths. First, it is the first to quantitatively evaluate the pooled prevalence of each specific stage along the PrEP implementation cascade. Besides, this study contains a reasonably large number of studies with a considerable sample size, affording substantial power to detect the outcomes. 108 Second, DerSimonian–Laird random-effects modeling has been employed to account for heterogeneity across studies. 57 Also, we used both I 2 and corresponding 95% CI to assess heterogeneity to account for the biased estimates of studies in the meta-analysis. 109,110 Third, we used metan to calculate effect sizes and metaprop to calculate the pooled proportions based upon the binominal nature of the data. In addition, meta-regression was employed to assess the association between study-level demographics and PrEP implementation cascade among HCPs as well as to better explain the heterogeneity of included studies. 111,112 Likewise, we filled a research gap by considering weighted sample sizes to account for potentially inflated type I errors in published studies while assessing each specific stage along the cascade. 113 Fourth, we quantified the different roles of PCPs and IDs as well as physicians and APRNs/PAs in the cascade.
Limitations
Our findings should be interpreted with caution, considering a few caveats. First of all, our meta-analysis reveals significant publication biases throughout studies that may be subject to inflated type I errors. Second, there was high heterogeneity across studies due to different design, populations, and settings among study participants, which may lead to biased pooled estimates. Third, data on PrEP implementation by certain specialties are scarce. No PrEP implementation-related information was available specifically for OBGYN or reproductive health care specialists, a subgroup that has been suggested as ideal for PrEP prescription. 114 –116 Fourth, as the categorization and measurement of several variables may vary across studies, we had to group participants arbitrarily, which may have affected the precision and validity of crucial estimates. For instance, some studies categorized APRNs and PAs as one category with no information provided to assess each profession separately. Last, due to the limited number of studies, we cannot conduct analyses while controlling time-varying effects. However, our trend analyses have revealed crucial patterns for the PrEP cascade across years.
Conclusions
Utilizing synthesized data from 36 studies representing ∼20,000 HCPs in the United States, this is the first study to date to report pooled proportions along each stage of the PrEP implementation cascade. We found that significant discrepancies exist between relatively high provider awareness and willingness to prescribe PrEP on the one hand, and low prevalence of PrEP consultation and prescribing on the other. Our results point to opportunities to expand PrEP provision by further engaging a more extensive range of health care professions and specialties and focusing on regions with disparities between HIV incidence and PrEP uptake. These findings can help guide future research and policy to address identified discrepancies. As one of the key pillars in the strategic initiative that has been proposed by the US Department of Health and Human Services, PrEP plays a crucial role in ending the HIV epidemic in the United States. 117
Footnotes
Acknowledgments
We sincerely thank Mr. Daniel Trout who worked as a librarian at the University of Rochester Miner Library and helped us with key words development as well as a comprehensive and iterative process to evaluate inclusiveness and relevancy of potentially included studies.
Author Disclosure Statement
No competing financial interests exist.
Funding Information
This study was supported by the University of Rochester Center for AIDS Research (P30A1078498) and School of Nursing at University of Rochester Medical Center. The content is solely the responsibility of the authors and does not necessarily represent the sponsor who had no role in the design or conduct of the study, the writing of this report, or its submission for publication.
Supplementary Material
Supplementary Figure S1
Supplementary Figure S2
Supplementary Figure S3
Supplementary Figure S4
Supplementary Figure S5
Supplementary Figure S6
Supplementary Table S1
Supplementary Table S2
Supplementary Table S3
Supplementary Table S4
Supplementary Table S5
References
Supplementary Material
Please find the following supplemental material available below.
For Open Access articles published under a Creative Commons License, all supplemental material carries the same license as the article it is associated with.
For non-Open Access articles published, all supplemental material carries a non-exclusive license, and permission requests for re-use of supplemental material or any part of supplemental material shall be sent directly to the copyright owner as specified in the copyright notice associated with the article.