
Abstract
Identifying people with HIV infection (PHIV), who are at risk of not achieving viral suppression, is important for designing targeted intervention. The aim of this study was to develop and test a risk prediction tool for PHIV who are at risk of not achieving viral suppression after a year of being in care. We used retrospective data to develop an integer-based scoring method using backward stepwise logistic regression. We also developed risk score categories based on the quartiles of the total risk score. The risk prediction tool was internally validated by bootstrapping. We found that nonviral suppression after a year of being in care among PHIV can be predicted using seven variables, namely, age group, race, federal poverty level, current AIDS status, current homelessness status, problematic alcohol/drug use, and current viral suppression status. Those in the high-risk category had about a 23 increase in the odds of nonviral suppression compared with the low-risk group. The risk prediction tool has good discriminative performance and calibration. Our findings suggest that nonviral suppression after a year of being in care can be predicted using easily available variables. In settings with similar demographics, the risk prediction tool can assist health care providers in identifying high-risk individuals to target for intervention. Follow-up studies are required to externally validate this risk prediction tool.
Introduction
In the United States, at the end of 2015, about 1.1 million people were living with HIV infection, and in 2015, there were an estimated 38,000 new HIV infections. 1 In 2017, Florida had the highest number of estimated new HIV infections (4800). 1 Within Florida, Miami-Dade County had the highest number of people with HIV infection (PHIV); ∼29,969 in 2017. 2
Once diagnosed with HIV, PHIV need to be linked to and retained in care, take antiretroviral therapy (ART), and adhere to their medications to have successful HIV care outcomes. The HIV care continuum, defined as stages of HIV medical care that PHIV go through, from initial diagnosis to achieving viral suppression, 3 includes five steps, namely, HIV diagnosis, linkage to HIV care, retention in HIV care, adherence to ART, and viral suppression. 4 Viral suppression is the final step and ultimate goal of the HIV care continuum and is usually a reflection of success in HIV care. Viral suppression benefits the individual living with HIV and the community. Virally suppressed PHIV have slower disease progression and increased survival. 5 –7 At the community level, virally suppressed individuals are less likely to transmit the virus to others. 8 –10 Despite the availability of ART, a substantial number of PHIV are not virally suppressed. 11 For example, in 2015, in 39 US states and District of Colombia, 40.2% of the PHIV were not virally suppressed. 12
Given the importance of viral suppression, there is a need to develop evidence-based strategies to monitor and predict this outcome. There are numerous cross-sectional and longitudinal studies that have identified factors associated with viral suppression among PHIV. 13 –24 These factors include young age, 13,14 gender, 14 –16 black race, 13,15,17 –19 unstable housing, 20 substance use, higher baseline viral load, 21 long duration of HIV infection, 18 poor general health status, 18,22 being US born, 23 and low educational attainment. 24 There is a need to translate these findings about individual factors into validated and easy-to-use risk tools for use in predicting an individual's risk of not achieving viral suppression.
Studies have been conducted to develop risk prediction tools for virologic failure, 25 and for predicting extended high viremia among newly diagnosed people. 26 Clinical and behavioral factors related to suboptimal adherence, recent cluster of differentiation 4 (CD4) count, drug and/or alcohol abuse, prior ART exposure, prior treatment failure, and recent HIV-1 viral load were used to predict virologic failure after 1 year among those who were virologically suppressed on ART at enrollment. 25 Researchers have also developed risk prediction tools for HIV disease progression, particularly for mortality. 27 –29 The aim of our study was to develop and test a risk prediction tool for PHIV who are in care but are at risk of not achieving viral suppression after a year of being in care, to use for triaging those in need of more assistance. If people likely not to achieve viral suppression are identified early, intervention strategies could be implemented to assist these individuals into achieving viral suppression and ultimately improve their quality of life. 30
Methods
Data source and study population
We developed and internally validated a risk prediction tool for nonviral suppression using retrospective data from the Miami-Dade County Ryan White Program (RWP) Part A/Minority AIDS Initiative (MAI) for the calendar years 2016–2017. The data set included 6492 PLWH who were in care between 2016 and 2017 in the RWP Part A/MAI. In care was defined as having at least one viral load or CD4 count test or encounter with healthcare professional in each year. All exposures were measured in 2016, and viral suppression was measured in 2017.
The RWP is a comprehensive system of care for PHIV. It provides primary medical care and other support for PHIV without health insurance. In the United States, more than half of PHIV receive services through the Ryan White HIV/AIDS Program each year. 31 The RWP services include outpatient/ambulatory health services, oral health care, other professional services (legal services and permanency planning), food bank, medical transportation (in the form of vouchers), mental health services, medical case management (including treatment adherence), health insurance premium and cost sharing assistance, local AIDS pharmaceutical assistance, substance abuse care and services (both outpatient and residential), and outreach services.
Predictor variables
We selected sociodemographic, clinical, and behavioral variables based on evidence from the literature and completeness of information in the data set. 13 –24 All characteristics were parameterized as categorical variables and refer to the year 2016. Age was categorized as 18–24, 25–39, and ≥40 years. All other variables were binary and included sex assigned at birth (male/female), homelessness (yes/no), race (black/white or other), transgender (yes/no), Hispanic ethnicity (yes/no), alcohol/drug use resulting in any problem in patients daily activity or legal issue or hazardous situation (referred as problematic alcohol/drug use in this article) (yes/no), self-reported feelings of depression or anxiety (yes/no), patient getting the food he/she needs (yes/no), patient had CDC (Centers for Diseases Control and Prevention)-defined AIDS as of 2016 (yes/no), patient virally suppressed in 2016 based on the last viral load laboratory test in 2016 (yes/no), patient had access to transportation for health care/dental/social service appointments (yes/no), patient had a history of injection drug use (IDU; yes/no), and federal poverty level (FPL) <100% (yes/no). FPL <100% in 2016 was defined as having a household income less than $11,880 for a single person. 32 We defined problematic alcohol/drug use as having any of the following. (a) Has alcohol/drug use resulted in legal problems, (b) Has alcohol/drug use resulted in hazardous situation, and (c) Is your alcohol/drug use preventing you from carrying out your daily activities? All predictor variables were obtained from the patient intake assessment (information collected at the time of entry into the RWP Part A/MAI), comprehensive health assessment (biannual assessment of all RWP Part A/MAI patients), or laboratory data.
Outcome
The outcome, viral suppression, was a binary variable, and nonviral suppression was defined as having viral load ≥200 copies/mL in the last viral load measurement in 2017. 33
Inclusion and exclusion criteria
We included PHIV who were in care in 2016 and 2017 and who had a comprehensive health assessment in 2016. Comprehensive health assessment is a health and social needs assessment of RWP patients that is completed every 6 months to determine plan of care and needs for referrals to other services. Patients who were younger than 18 years in January 2016, died in 2016 or 2017, had no comprehensive health assessment in 2016, or were out-of-network referrals in 2016 or 2017 were excluded. Out-of-network referrals are people who were referred to the RWP from a non-RWP provider. Patients whose case was closed because of moving to another state/county, financial ineligibility, or incarceration for greater than 6 months during 2016 or 2017 were also excluded.
Analysis
First, we conducted bivariate analysis to assess the association between each predictor variable and the outcome and estimated crude odds ratio (OR). All variables associated with nonviral suppression at p < 0.1 in the bivariate analysis were included in the initial logistic regression model. With stepwise backward elimination, we retained only significant factors (p < 0.05) in the final model. 34
We assessed calibration using calibration plots by dividing subjects into deciles of risk according to their model predictions, and the observed nonviral suppression levels among the subjects. Each decile was plotted against the average predicted probability of nonviral suppression and compared with the 45° line (perfect calibration). 35 The ability of the prediction model to distinguish events versus nonevents (discrimination) was measured by the concordance statistic or C-statistic (which is equal to the area under the receiver operating characteristic curve). 35
We assessed internal validity with a bootstrapping procedure, extracting 1000 samples with replacement, of the same size as the original data set (n = 6492). 36,37 For each sample, we used the same procedure that was used on the original data set (stepwise backward logistic regression model). Then we calculated optimism by comparing the final model performance (C-statistic) between the bootstrap samples and the original data. The bootstrap-corrected C-statistic was computed by subtracting the optimism from the original C-statistic. 34
Risk score development
We aimed to develop a simple risk score tool that could be easily assessed in a variety of settings to identify PHIV who are at risk of not achieving viral suppression after a year of being in care. After obtaining the beta-coefficients from the final logistic regression model, the scores for each predictor were determined by multiplying each beta-coefficient by 10 and rounding to the nearest integer. 34,38
The total risk score was calculated by adding the scores for all existing risk factors. To develop an easily interpretable method to classify patients according to the risk of not achieving viral suppression, we divided the risk score into three strata (by placing cut-points at the 25th and 75th percentiles of the model's total risk score distribution). We also calculated the sensitivity, specificity, positive predictive value, and negative predictive value for a range of potential cutoff points. All statistical analyses were performed using SAS software version 9.4 (SAS Institute, Cary, NC). This study was approved by the Florida International University Institutional Review Board.
Results
Of the 8014 PHIV who were in care in the RWP Part A/MAI in 2016 in Miami-Dade County, 1522 (19.0%) were excluded for various reasons (Fig. 1); 571 of whom were not in care in 2017. Of the 6492 PHIV in the final data set, 606 (9.4%) were not virally suppressed in 2017.
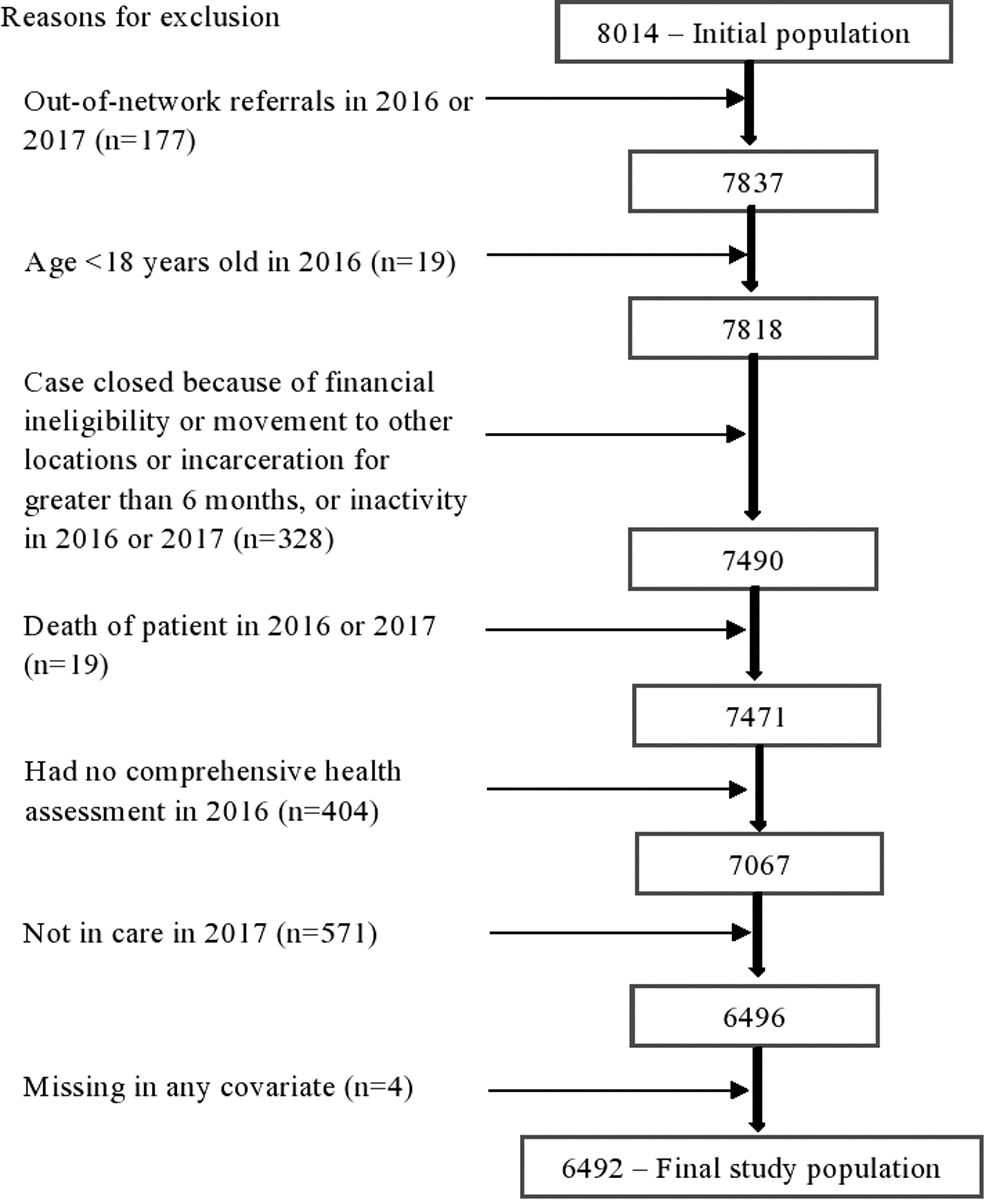
Flow diagram of exclusion criteria in the present study.
The majority of the PHIV were >40 years old (65.8%), male (76.3%), and virally suppressed in 2016 (87.5%) (Table 1). In the bivariate analysis, age in 2016, race, Hispanic ethnicity, poverty level, homelessness, problematic alcohol/drug use, feeling depressed or anxious, viral suppression status in 2016, and AIDS status as of 2016 were associated with nonviral suppression in 2017 at p < 0.001; whereas food needs, history of IDU, and sex assigned at birth were associated with nonviral suppression in 2017 at p < 0.05. Transgender status and access to transportation to appointments were not associated with nonviral suppression in 2017.
Population Characteristics of People with HIV Infection (N = 6492) by Viral Suppression Status and Association of Factors with Nonviral Suppression
AIDS, acquired immunodeficiency syndrome; CDC, Centers for Diseases Control and Prevention; CI, confidence interval; FPL, federal poverty level; IDU, injection drug use; OR, odds ratio.
In the stepwise backward logistic regression model, 12 variables were entered in the initial model, and seven variables maintained statistical significance at p-value <0.05. These risk factors include being in the age group 25–39 (β = 0.27, p < 0.001) or age group 18–24 (β = 0.06, p < 0.05), black race (β = 0.32, p < 0.001), poverty level <100% (β = 0.17, p < 0.001), homeless (β = 0.27, p < 0.001), problematic alcohol/drug use (β = 0.37, p < 0.001), diagnosed with AIDS as of 2016 (β = 0.24, p < 0.001), and not virally suppressed in 2016 (β = 0.91, p < 0.001) (Table 2). The C-statistic for the derivation model was 0.767% (Fig. 2). The optimism-corrected C-statistic was 0.763% (optimism = 0.004). The calibration plot shows good calibration with a predicted and observed probability of viral suppression aligning with the 45° line.
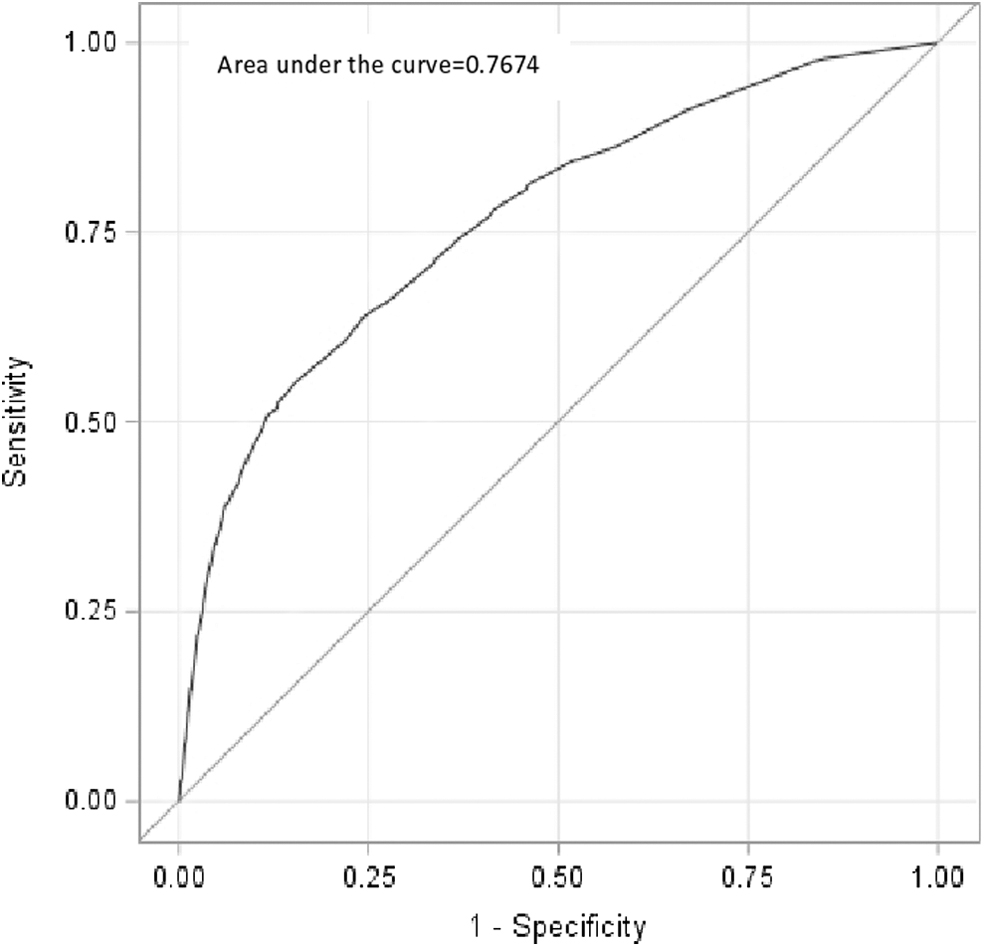
ROC curves for the final logistic regression model. ROC, receiver operating characteristic.
Final Predictors of Nonviral Suppression and Associated Risk Scoring System
Scores are formed by multiplying the beta-coefficients by 10 and then rounding to the nearest integer.
AIDS, acquired immunodeficiency syndrome; CDC, Centers for Diseases Control and Prevention; FPL, federal poverty level.
The risk score ranged from 0 to 26 (Table 3). A patient will have highest risk score (score = 26) if the patient is aged 25–39, black, homeless, poverty level <100%, had AIDS as of 2016, had problematic alcohol/drug use, and had unsuppressed viral load in 2016. Nonviral suppression in 2016 greatly predicted nonviral suppression in 2017, and more than one-third of the total risk score was contributed by this variable. The simplified integer-based risk score performed well in the derivation data set (C-statistic = 0.768%). The distribution of predicted and observed percentage by these risk scores is provided in Fig. 3. An increase of one point in the risk score was associated with 1.2 increase in the odds of nonviral suppression (OR 1.22; 95 CI 1.20 − 1.24).
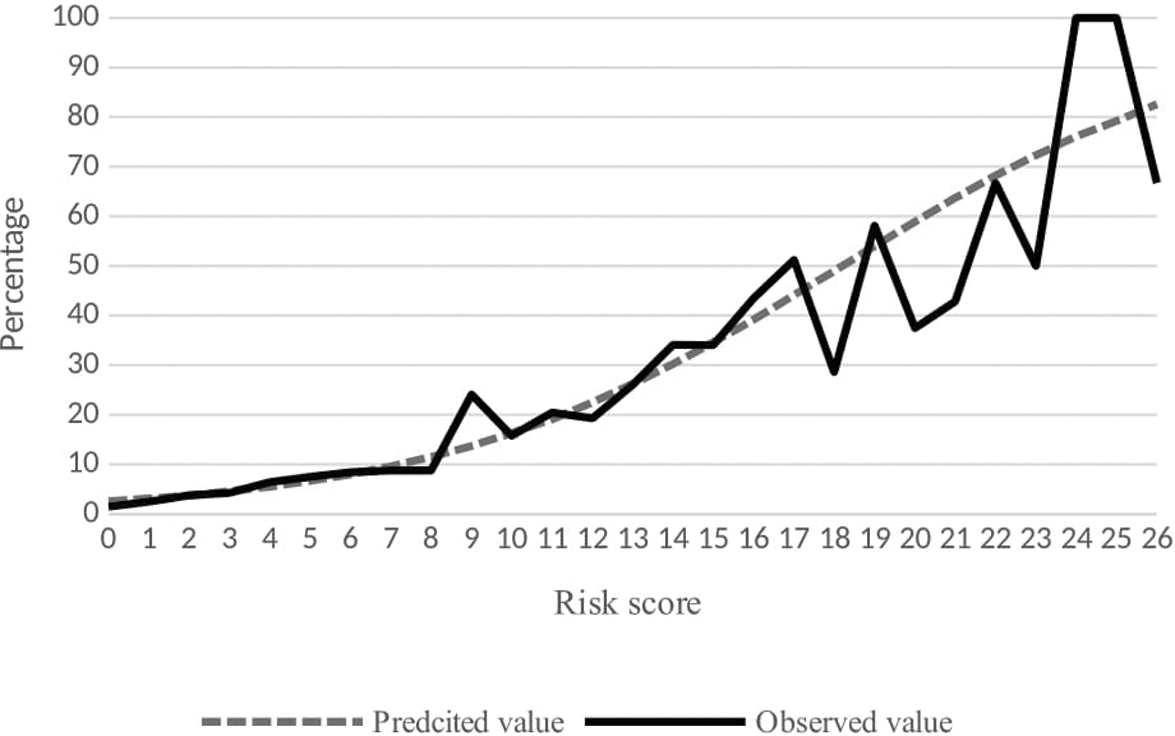
Distribution of predicted and observed percentages by these risk scores.
Risk Score 4 Tool for Nonviral Suppression After a Year of Being in Care and Predicted Risks Associated with Total Scores
How to use this tool: A risk score for each patient can be calculated by adding the scores for each risk factor. For example, if a patient is a 27-year-old black, FPL >100%, not homeless, has no alcohol/drug use resulted in any problem in daily activity or legal issue or hazardous situation, presents with AIDS diagnosis, and unsuppressed viral load, the health care provider can put the following scores in the patient's score column: Age in 2016 = 3; Race = 3; FPL <100% = 0; Homeless = 0; Has no alcohol/drug use resulted in any problem in daily activity or legal issue or hazardous situation = 0; Has CDC-defined AIDS as of 2016 = 3; and Virally suppressed in 2016 = 9. By adding all these scores, (3 + 3 + 0 + 0 + 0 + 3 + 9), the total risk score for the patient is 18. Then looking at the risk score and predicted risk columns, a patient with 18 risk scores will have a probability of 49.0% to have nonviral suppression by the end of 1-year follow-up.
This risk score tool works if there is complete information on all the six factors. If there is missing information on any of these factors, a separate risk score tool is required.
AIDS, acquired immunodeficiency syndrome; CDC, Centers for Diseases Control and Prevention; FPL, federal poverty level.
Table 3 shows a one-page scoring and decision tool that can be used in health facilities. This scoring and decision tool includes the list of the seven variables and space to record the score for each variable and a total score. On the right side, it includes the risk of nonviral suppression associated with each total score computed from the risk prediction score. To illustrate the application of the risk score, consider a patient who is a 27-year-old black, poverty level >100%, has permanent housing, no problematic alcohol/drug use, presents with AIDS diagnosis, and unsuppressed viral load. Then, according to Table 3, the total risk score of the patient can be calculated as 3 + 3 + 0 + 0 + 0 + 3 + 9, which will add up to 18. Looking at the right side of Table 3, this person has a 49.0% probability of not being virally suppressed by the end of next year.
Based on the percentile distribution of the total risk score, we created three categories. These were low risk (score 0–1), medium risk (score 2–7), and high risk (score ≥8). About 15% (n = 969) of the study population were in the low-risk category, and 1.6% (n = 15) of these were not virally suppressed. About 65% (n = 4243) of the study population were in medium-risk category, of whom 6.0% (n = 255) were not virally suppressed. About 20% (n = 1280) of the study population were in the high-risk category, and 26.5% (n = 339) of these were not virally suppressed. Compared with those who are in the low-risk category, those who are in the medium-risk and high-risk category were more likely not to be virally suppressed [OR 4.06 (CI 2.40–6.87) and OR 22.89 (CI 13.54–38.68), respectively].
We estimated sensitivity, specificity, and predictive values for various cutoff points in the risk scoring tool. A risk score of ≥7 as a cutoff point has a sensitivity of 63%, specificity of 77%, positive predictive value of 21%, and negative predictive value of 95%, whereas risk of ≥8 as a cutoff point has a sensitivity of 57%, specificity of 85%, positive predictive value of 31%, and negative predictive value of 94%. A risk of ≥9 as a cutoff point has a sensitivity of 52%, specificity of 88%, positive predictive value of 31%, and negative predictive value of 94%.
Discussion
We found that nonviral suppression by the end of 1-year follow-up time can be predicted using seven variables, which are easily ascertained by patient history and medical record. These variables include current age group, race, poverty level, current AIDS diagnosis, current homelessness, problematic alcohol/drug use, and current viral suppression status. The risk prediction tool has a total risk score of 26, and the risk for nonviral suppression increases as the risk score increases. In addition to predicting the magnitude of risk of nonviral suppression associated with each risk score, we also stratified the cohort into risk groups. Those in the high-risk category had about 23 times the risk of having nonviral suppression compared with the low-risk group. The risk prediction tool has good discriminative performance and calibration.
Many studies have identified individual risk factors associated with poor attainment of viral suppression. 13 –24 Previous studies have shown the predictive role of age group, race, poverty level, AIDS diagnosis, alcohol/drug use, and homelessness on viral suppression. 13 –15,17–21,25,27 Poverty and homelessness may be predictive of viral suppression due to competing needs. 39 AIDS status could affect viral suppression due to advanced nature of the disease. 40 The predictive role of current viral load to future virologic failure and other HIV disease progression has been demonstrated in previous risk prediction tools. 25,27 There is no evidence of direct mechanism through which race can predict viral suppression. In populations without great disparities in socioeconomic status and access to care such as the military 41 and populations who receive care from culturally competent health care providers, 42 the black race has not been found to be predictive of HIV care outcomes. In the current study, the black race is likely serving as a proxy for unmeasured factors such as low educational level, stigma, discrimination, mistrust of the health system, and quality of provider relationship that may be differentially affecting the black PHIV.43−45
Health care providers can use different cutoff points depending on availability of resources. If we consider sensitivity and specificity equally important, the cutoff value of 7 in the risk score gave a maximized value of sensitivity and specificity (63% and 77%, respectively). The corresponding positive and negative predictive values were 21% and 95%, respectively. However, based on the importance of false-positives and false-negatives, health care providers may choose to use different cutoff points. The cutoff point 7 identified 62% of individuals who failed to achieve viral suppression in next year, whereas the cutoff point 9 identified 52% of individuals who failed to achieve viral suppression in the next year. Moreover, the cutoff point 7 would put 26.8% of our population for intervention, whereas the cutoff point 9 would put 15.7% of our population for intervention. A lower cutoff value in the risk score would put a large proportion of our population for intervention and would identify the majority of individuals who failed to achieve viral suppression in the next year.
Our study builds on the study by Robbins et al., using more recent data. However, our study is different from the study by Robbins et al. in the definition of the outcome. Robbins et al. included patients who were virologically suppressed on ART at enrollment and defined virologic failure as (a) two consecutive measurements of HIV RNA level of >400 copies/mL or (b) one measurement of HIV RNA level of >400 copies/mL and no confirmatory test in the subsequent 3 months. 25 In our study, we included all PHIV regardless of viral suppression status, and our outcome of interest, nonviral suppression, was defined as having viral load ≥200 copies/mL in the last viral load measurement of the subsequent year. Moreover, while Robbins et al. included factors such as adherence to ART and antiretroviral history, which are not available in our data set, our study considered additional socioeconomic factors such as poverty level, access to transportation to medical appointments, food needs, transgender status, and AIDS status to develop the risk prediction model.
We attempted to explore alternative models with a reduced number of predictors (data not shown). After we exclude homelessness from the model, the discriminative performance of the model was similar (C-statistic = 0.763). To assess the performance of the model in situations where viral load measurement is not available, we excluded viral suppression status in 2016 from the model, but the C-statistic greatly reduced to 0.70.
Risk prediction tools that are simple to use, accurate in predicting risk, are generalizable across contexts, and use routinely collected variables are needed to identify patients at high risk for poor outcomes and to provide individualized risk assessment. 46 The risk prediction tool developed in this study needs external validation to evaluate its performance in other populations. The risk score could be useful in settings similar to the RWP. At the time a person with HIV visits an HIV care provider, the provider can quickly and easily use this tool to predict the probability of the person being not virally suppressed by the end of next year. Thus, the scoring can be useful to stratify PHIV in risk categories so that resources are directed to those at greater risk. Accordingly, patients can be targeted for intervention. Depending on the available resources and infrastructure, multifaceted interventions can be implemented to improve the success of the HIV care continuum. Addressing service-related, medical, and psychosocial factors, designing community-based interventions, including management and/or patient navigation, 47 home-based health care, economic empowerment, and population-specific interventions such as youth-friendly clinics and services 48,49 could improve the success of patients in the HIV care continuum.
About 8% (571) of those receiving care in 2016 were not in care in 2017 (lost to follow-up). We compared the baseline characteristics of our study population (those in care in 2017) and those lost to follow-up in 2017. Compared with our study population, those lost to follow-up were more likely to be 25 − 39 years old (36.1% vs. 29.3%; p < 0.001), black (53.9% vs. 38.5%; p < 0.001), non-Hispanic (59.2% vs. 42.3%; p < 0.001), being at poverty level of <100% (58.1% vs. 42.0%; p < 0.001), homeless (13.3% vs. 5.2%; p < 0.001), not virally suppressed in 2016 (27.3% vs. 12.5%; p < 0.001), feeling depressed or anxious (19.1% vs. 14.8%; p < 0.001), and have problematic alcohol/drug (7.0% vs. 2.0%; p < 0.001). These differences in baseline characteristics indicate that those lost to follow-up could have worse viral suppression status compared with our study population.
Despite the strengths of this simple risk prediction score model, there are several limitations that need to be acknowledged. First, we had a large sample size, and the model had good discrimination and calibration in the bootstrapped samples, but the model should undergo external validation to see the performance of the risk prediction model/score in other populations. Our population are low-income PHIV and high number of immigrants especially Latinos; hence, the predictive performance of the model/score may differ if the underlying population has different sociodemographic and behavioral characteristics from ours. Second, our study included people with new and existing HIV diagnosis. People with new HIV diagnosis may have different challenges to achieve viral suppression. Therefore, they may need a different risk score. Third, we depended on self-report for feeling depressed or anxious, problematic alcohol/drug use; this may be underreported. Fourth, exposures are measured at any time point in 2016; therefore, there might be differential follow-up time. However, we took the first comprehensive health assessment measurement of 2016 to ensure adequate follow-up time. Last, we were not able to measure adherence to ART and the duration of time the patients had been on ART. Including information about adherence to and duration of patients under ART could have improved the discrimination of the predictive model.
In summary, we have identified a set of readily available variables that can be used to predict nonviral suppression after a year of being in care among PHIV. The predictors of nonviral suppression were age group, race, poverty level, AIDS diagnosis, homelessness, problematic alcohol/drug use, and viral suppression status. The tool has good discriminative ability. In addition, the tool can be used to stratify PHIV into risk groups that can be identified for targeted intervention. In settings with similar demographics, the risk prediction tool can assist clinicians and health care providers to identify high-risk individuals and target for interventions. Follow-up studies are required to externally validate this risk prediction tool.
Footnotes
Author Disclosure Statement
No competing financial interests exist.
Funding Information
This research was supported, in part, by the National Institute on Minority Health and Health Disparities (NIMHD) under award numbers 1R01MD012421, 1R01MD013563, 5S21MD010683, K01MD013770, and U54MD012393, and Florida International University graduate school dissertation year fellowship. The content is solely the responsibility of the authors and does not necessarily represent the official views of the National Institute on Minority Health and Health Disparities or National Institutes of Health.