
Abstract
Evidence on the impact of human immunodeficiency virus (HIV) drug resistance on regimens following treatment failure is varied and inconclusive. Differential medication adherence may explain this variation. We aimed to test the association between drug resistance at first-line antiretroviral therapy (ART) switch and adherence to and virologic failure on subsequent ART. We conducted a secondary analysis of data from an open-labeled randomized trial of second-line ART (ACTG A5234). ART susceptibility was determined from study entry plasma using the Stanford Drug Resistance database version 8.7. Adherence was measured with microelectronic monitors. Three adherence variables and rates of virologic failure (HIV-1 RNA ≥1000 copies/mL) on second-line ART were compared between participants with and without resistance at first-line ART failure. Of 214 participants switching to second-line ART with baseline resistance results, 113 (53%) were men, mean age was 39 years (standard deviation 10.3), and 37 (17%) had susceptible virus at study entry. Cumulative genotypic susceptibility score (cGSS) was inversely associated with adherence, adjusted odds ratio (aOR) 0.15, 95% confidence interval (CI) (0.05–0.40), p < 0.001. The aOR of virologic failure for a one-unit increase in cGSS was 1.72, 95% CI (1.22–2.41), p < 0.001. Participants switched to second-line ART without resistance displayed inferior adherence and had higher rates of virologic failure. Therefore, these individuals warrant additional adherence interventions to help them achieve virologic success.
Clinical Trial Registration number: NCT 00608569.
Introduction
Antiretroviral therapy (ART) has significantly reduced morbidity and mortality among people with human immunodeficiency virus (HIV) infection. 1 –4 The success of ART depends on the ability of patients to adhere fully to their treatment to achieve, maintain viral suppression, and to minimize drug resistance. 5
Many individuals maintain high levels of adherence with resultant viral suppression, and others have poor or inconsistent adherence during the course of treatment. 6,7 When individuals are nonadherent, virologic failure can occur with or without the development of resistance associated mutations (RAMs). 7,8
Unless transmitted de novo, RAMs development requires ongoing viral replication in the presence of suboptimal antiretroviral (ARV) drug concentrations, 9 –12 resulting in the selection of resistant variants. Therefore, partial exposure, as opposed to nearly complete nonexposure, is a major driver of the development of HIV drug resistance. 8,9,13,14 Thus, individuals failing their first-line ART regimens with a wild-type virus are more likely to be those who were not taking their ARVs than those taking them intermittently.
There is mixed evidence about the effect of HIV drug resistance on viral outcomes in subsequent ART regimens. Earlier studies showed that participants who initiate second-line regimens with resistant virus experienced worse outcomes possibly because of nucleoside(tide) reverse transcriptase inhibitor (NRTI) cross resistance, which potentially results in failure even with good adherence. 15 –18 However, paradoxically, recent studies and programmatic data show that participants who switch to second-line ART with a susceptible virus experience worse outcomes. 4,7,16,19 To explain this, some studies have suggested that resistance tests may be overestimating the impact of mutations, while in fact some mutations might decrease viral fitness and enhance host virologic control, 20,21 and others postulate that this is simply a result of differential adherence to second-line regimens. 4,7,16,22 We think that resistance at first-line failure shows that the participants were taking their medicine and therefore will do better on second line and that participants without resistance were not taking their medicine. No study has empirically assessed if first-line resistance is associated with adherence to subsequent regimens. Assessment has been difficult from previous work because adherence data were not available, or if available, were not accurately measured.
In this study, we aimed to compare both adherence and virologic failure between participants switching to second-line ART with first-line resistance versus those without resistance as determined by population-based sequencing. We postulated that past behavior predicts future behavior; therefore, participants who were nonadherent to their first-line ARV drugs would be at higher risk of both insufficient adherence and subsequently virologic failure in second-line regimen.
Methods
This study is a secondary analysis of A5234 conducted by the AIDS Clinical Trials Group (ACTG), published elsewhere. 23 A5234 was an international multi-center randomized open-labeled trial that sought to test whether a partner-based adherence intervention [modified directly observed therapy (MDOT)] improved adherence and clinical outcomes of HIV-1-infected participants who were experiencing or had experienced first-line virologic failure on a non-nucleoside reverse transcriptase inhibitor (NNRTI)-based first-line ART, despite following the World Health Organization (WHO) protocols for management of ARV therapy failure. Participants aged at least 18 years from eight different countries of Botswana, Brazil, Haiti, Peru, South Africa, Uganda, Zimbabwe, and Zambia, for whom first-line ART was failing or had failed (HIV-RNA ≥1000 copies/mL), were enrolled between April 23, 2009, and September 29, 2011. At entry, participants were switched to a tenofovir disoproxil fumarate, emtricitabine, and a ritonavir-boosted lopinavir second-line ART regimen. 23 Participants were randomized to one of the two adherence strategies: MDOT versus self-administered therapy (standard of care). 23
At enrollment, plasma was collected from all participants and stored for future analysis. Participants' adherence to the second-line ART regimen was prospectively measured using microelectronic monitors/Medication Event Monitoring System (MEMS), Aardex, Zug Switzerland) for 52 weeks. During this time, clinical and laboratory parameters were monitored every 3 months or more frequently if clinically indicated. The trial concluded that a partner-based adherence intervention strategy improved neither adherence nor outcomes. 23
Resistance determination
We sequenced the full reverse transcriptase (RT) and protease (PR) regions of the HIV genome on stored plasma samples from study entry. A population-based HIV drug resistance testing was performed at BARC-SA/Lancet Laboratories, South Africa, using a laboratory-developed assay that was DAIDS Virology Quality Assessment certified. All assays generated an amplicon by RT-initiated polymerase chain reaction encompassing the entire PR and RT. Sequencing was performed with an ABI Prism 3500 Genetic Analyzer (Applied Biosystems). If samples were unable to be amplified by the laboratory-developed assay, they were amplified using the US Food and Drug Administration (FDA)-approved ViroSeq HIV-1 Genotyping System (v.2.0), as per the manufacturer's instructions (Celera Diagnostics, Alameda, CA).
Using the Stanford University HIV drug resistance database version 8.7, we identified mutations with known impact on drug susceptibility and calculated the estimated level of resistance to each first-line ART drug the patient took. We then calculated a cumulative genotypic susceptibility score (cGSS) by assigning a score of 0 (high-level resistance), 0.25 (intermediate resistance), 0.50 (low-level resistance), 0.75 (potential–low-level resistance), and 1.00 (susceptible) to each prescribed drug. 7,10,24 We also created a binary resistance variable defined as having a cGSS of less than two and susceptibility as having a cGSS of at least two.
Adherence
We derived the following adherence metrics from electronic monitors per quarter year and compared them between the study comparison groups as previously described 2 : (1) percentage dose taken (PDT), (2) coefficient of variation (CV) of dose executions, and (3) longest dosing gap for every participant per yearly quarter. We defined a yearly quarter as 90 days of active follow-up from the date of initial dose execution, and PDT as the proportion of dosing executions (bottle openings recorded) divided by the total doses expected multiplied by 100. 2 We then categorized PDT into five ordinal categories of adherence(dependent variable) as described by Paterson et al. 25 The CV of dosing intervals, calculated by dividing the standard deviation of the dosing intervals with the mean of dosing intervals multiplied by 100, is a more stable measure of dispersion, and indicates the magnitude of deviations from the prescribed dosing intervals during follow-up. 26,27 Higher CV indicates worse adherence behavior. Last, we calculated from MEMS the longest dosing duration/interval in hours across quarters of follow-up, during which a participant did not execute a dose. These metrics assess the implementation phase of adherence. 28
Virologic failure
Virologic failure was defined as a binary outcome variable plasma HIV RNA ≥1000 copies/mL versus virologic suppression (HIV-RNA <1000 copies/mL) at or any time after 12 weeks post-ART initiation, consistent with the WHO definition.
Statistical analysis
All analyses were done with STATA version 14, and error rate was set at 5%. Continuous variables were compared using t-test and Wilcoxon rank-sum test, while categorical variables were compared with chi-squared tests or Fisher's exact tests. Random effects ordered logistic regression model with robust standard error estimators were used to test for associations between cGSS to first-line ART (independent variable) and the five-level ordinal adherence (dependent), and to account for the possible correlation given the longitudinal/panel data structure, using quarter and participant as the time and panel variables, respectively.
We tested the associations between cGSS and virologic failure (dependent variable) using multivariate binary logistic regression models. First, we tested the association without adjusting for adherence and other confounders and then later tested the association adjusting for all adherence metrics and confounders in the model. We expected that if there was an association between resistance and virologic failure, and this association was totally explained by adherence, then adjusting for adherence would substantially attenuate this association.
Potential confounders were selected for admission to the models using the stepwise forward selection method in both analyses with probability of entry set at 0.20. Baseline CD4 cell count, duration on first-line highly active antiretroviral therapy (HAART), country, and randomization arm were all admitted in the first model. In addition, baseline viral load (HIV RNA) and whether or not patient was still on HAART at regimen switch were admitted in the second model. For epidemiologic reason, we included sex in both models.
To test if the association between resistance, adherence, and virologic failure was further explained by lamivudine resistance, we undertook a sensitivity analysis in which we calculated the predicted probabilities of virologic failure by lamivudine resistance and compared them with those obtained by the cumulative resistance variable. We expected that if this paradox was explained by lamivudine resistance, the differences in the probabilities of failure will be further increased.
The quadrature approximation sensitivity test was used to evaluate the goodness-of-fit of the random-effects model, 29 while the Hosmer–Lemeshow test and the area under the receiver operating characteristic curve (AUC) were calculated to assess the goodness-of-fit for the logistic regression model. The study was reviewed by the Institutional Review Board of the University of Pennsylvania, USA, and deemed to meet the criteria for exemption under 45 CFR 46.101, category 4, and consent was waived.
Results
A total of 256 participants were randomized in the parent trial, 7 died, 6 were unable to get to the clinic, 3 were lost to follow-up, 1 had severe debilitation, 1 withdrew consent, 1 nonadherent to study protocols, 3 participants were excluded for not having resistance results at study entry, with 214 participants contributing to this analysis. T-tests and chi-square comparisons of study entry characteristics of participants by resistance and virologic outcome on second-line ART are presented in Tables 1 and 2, respectively. Median first-line cGSS was 0.50 (interquartile range, 0.25–1.00). A Wilcoxon rank-sum test showed that all adherence metrics were significantly higher for participants with resistance in all other quarters except in the first quarter: percentage of doses taken (p = 0.15), CV (p = 0.06), and largest gap (p = 0.09). In addition, CV (p = 0.28) and the largest dosing gaps (p = 0.05) were also not different in the fourth quarter, as shown in Table 3. Participants with resistance were generally concentrated in higher adherence categories. In contrast participants without resistance were more concentrated in lower adherence categories, as shown in Fig. 1.
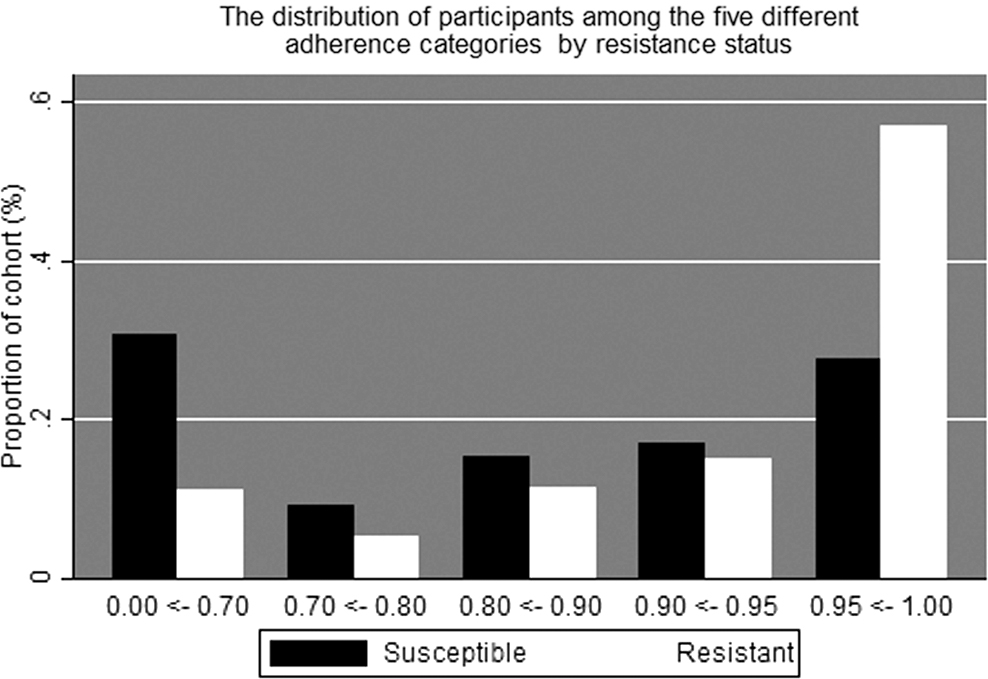
The distribution of cohort participants in the five adherence categories by resistance status.
Participants' Baseline Characteristics
HAART, highly active antiretroviral therapy; HIV, human immunodeficiency virus; MDOT, modified directly observed therapy.
Participants' Characteristics by Virologic Outcome on Second-Line Antiretroviral Therapy
ART, antiretroviral therapy.
The Mann–Whitney Test Comparisons of Adherence Metrics
IQR, interquartile range.
As shown in Fig. 2, if participants adhered well, they generally achieved viral suppression regardless of their resistance status. Participants who failed treatment generally had lower median adherence regardless of their resistance.
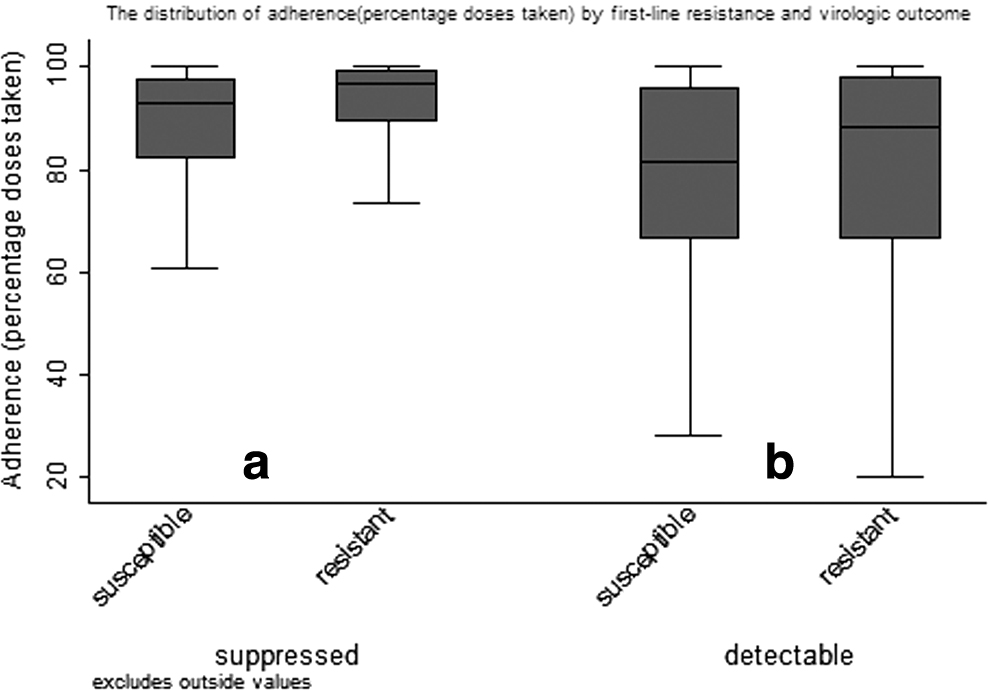
Median adherence by resistance status. Y axis represents percentage of doses taken (PDT), box plots display the median and interquartile range (25%ile, 75%ile), and X-axis represents resistance status at first-line ART failure.
A unit increase in cGSS was associated with an 85% reduction in the odds ratios (ORs) of having better adherence unadjusted [OR 0.22, 95% confidence interval (CI) (0.11–0.46) and adjusted OR (aOR) 0.15, 95% CI (0.05–0.40), both p < 0.001].
Similarly, a unit increase in cGSS was associated with a 72% increase in the ORs of virologic failure in unadjusted [OR 1.78, 95% CI (1.34–2.36) and aOR 1.72, 95% CI (1.22–2.41) p < 0.01] having first-line resistance was still significantly protective against virologic failure [aOR 0.21, 95% CI (0.09–0.48) p < 0.001].
At lower adherence levels (<70%), the probabilities of virologic failure were not different regardless of resistance. In contrast, as the adherence level improves (>70%), the probabilities of virologic failure were significantly higher for participants without resistance versus those with resistance, as shown in Fig. 3.
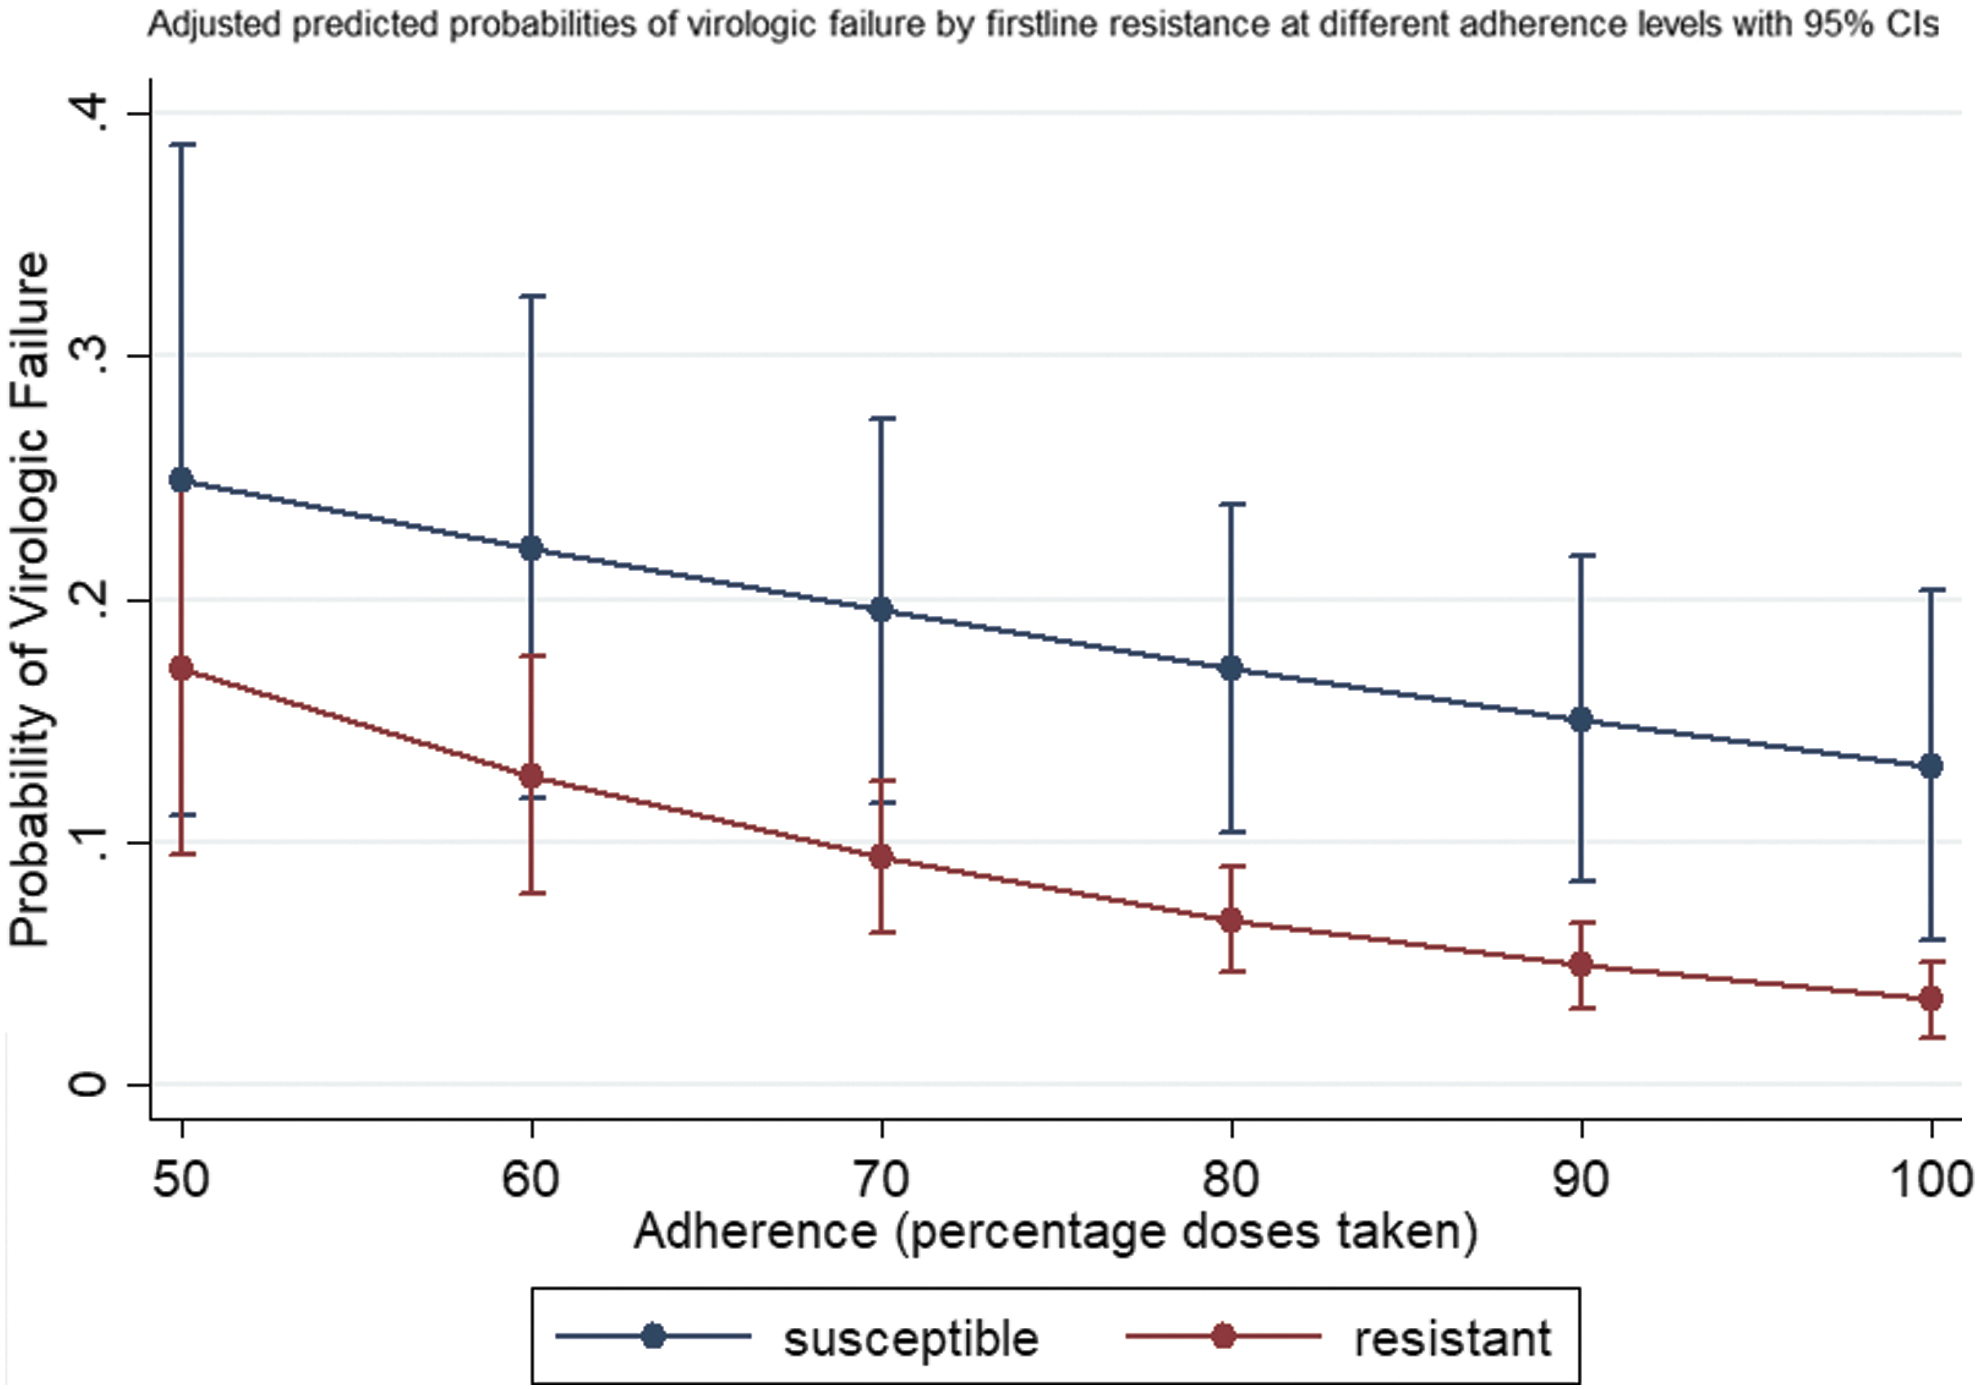
The adjusted predicted probabilities of virologic failure with 95% CIs by cumulative first-line ART resistance at different adherence levels. CIs, confidence intervals.
The graph of probabilities of failure by lamivudine resistance is displayed in Fig. 4, for comparison with Fig. 3.
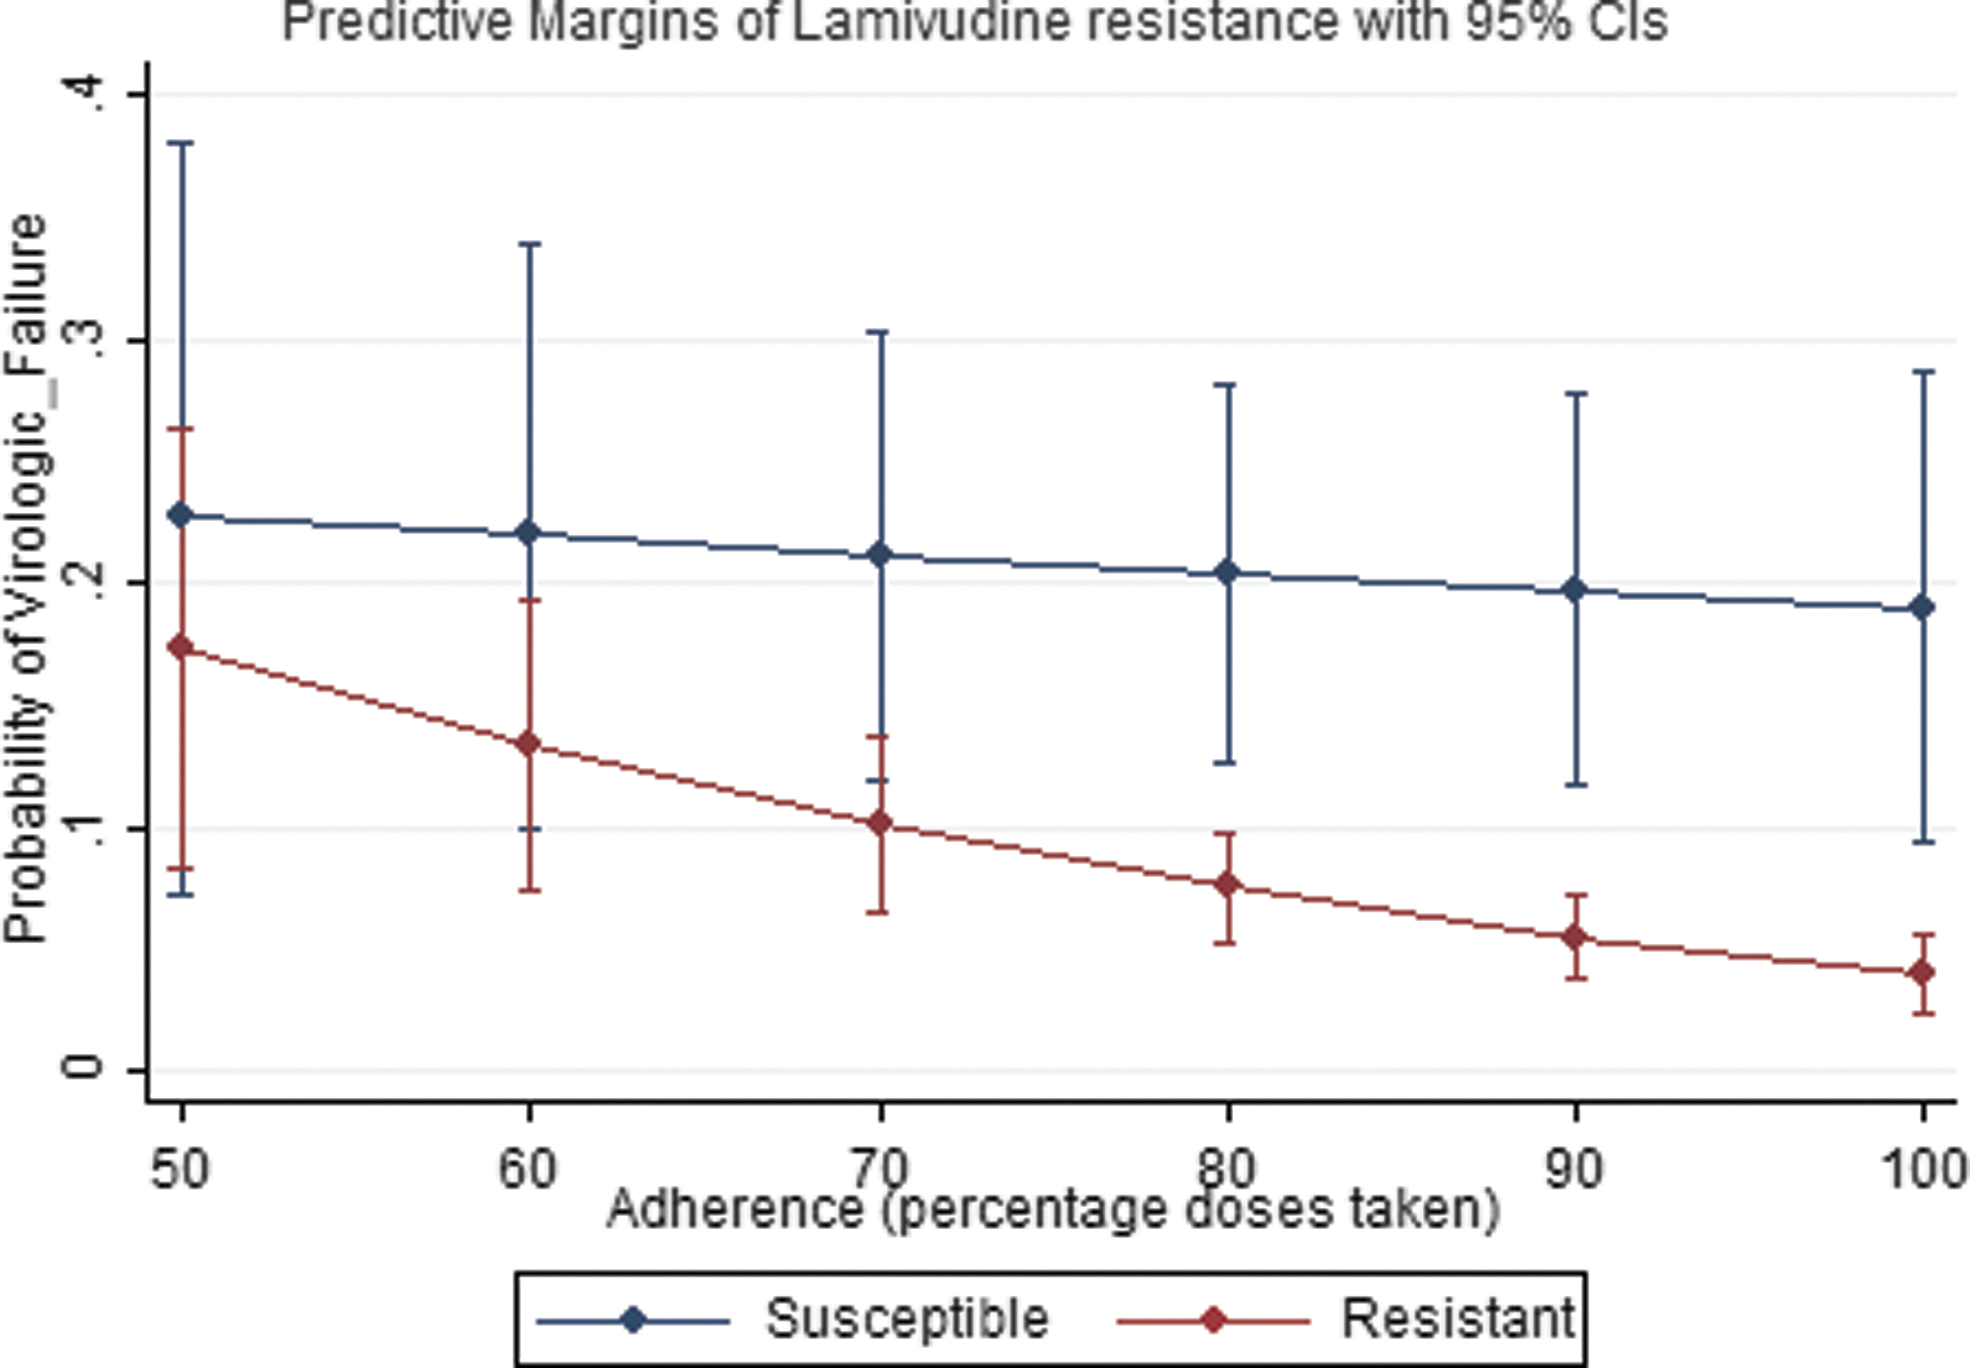
The adjusted predicted probabilities of virologic failure with 95% CIs by lamivudine (3TC) resistance at different adherence levels.
Further, since the treatment arm had received more participants with susceptible virus at entry, we tested whether this differential allocation may have biased the conclusion of the parent trial, but it was found not significant (p = 0.63 and p = 0.13, respectively), and therefore, the conclusion of the parent trial is upheld.
The goodness-of-fit tests indicated that both models fit the data well and the AUC was 89%, as displayed in Fig. 4.
Discussion
We found that participants who initiated second-line ART without first-line ART resistance adhered poorly and were more likely to experience virologic failure at second-line compared with those who switched with resistance, supporting the hypothesis that past behavior predicts future adherence behavior and suggesting that while wild-type virus in general is clinically considered a good marker, having wild-type virus at first-line failure may in fact be a negative prognostic marker for poor adherence and virologic failure at second line. Clinicians should be on high alert when dealing with such patients and prioritize them for referral to targeted, enhanced adherence interventions. The differential poor adherence may explain a higher mortality observed among participants switching to second-line ART in programmatic data even in settings where there is a low prevalence of protease inhibitor (PI) resistance. 3,4
Controlling for adherence, resulted in changes in effect estimates, but did not completely attenuate the association between resistance and virologic failure, suggesting that while better adherence played an important role on why those with resistance have better virologic outcomes, consistent with postulations of prior studies, 7,11,16,18,30,31 this paradox was not only explained by better adherence.
Comparing the predicted probabilities of virologic failure obtained using lamivudine resistance versus a cumulative resistance in sensitivity analysis supported the hypothesis that the beneficial effect of lamivudine resistance additionally explains this paradox such that adhering at very high levels >90% provided up to 11% additional protective effect from virologic failure for participants who switched with lamivudine resistance, as shown in Fig. 5. While the in vitro beneficial effect of lamivudine resistance is well documented, 20,21 this is one of the few studies to demonstrate it in vivo.
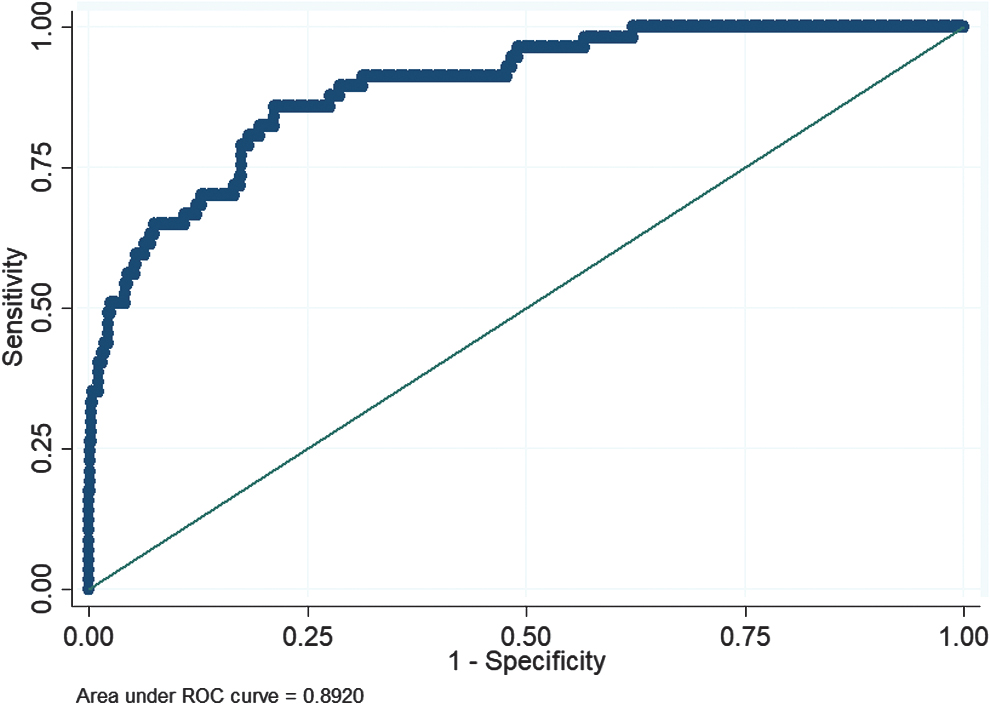
The area under the ROC curve shows that the model fit the data very well. ROC, receiver operating characteristic.
In contrast to studies in sub-Saharan Africa, 32 we did not find any adherence differences by sex in our study.
This study has two main strengths. First, unlike in other studies, adherence was carefully measured with electronic monitors as opposed to pill count and self-reports; all known to be susceptible to recall bias. 4,33,34 Electronic monitors have been proven to be highly correlated with both plasma drug concentrations and pill counts. 6,35 –37 Second, demonstrating that all three adherence metrics were associated with prior resistance increases the robustness of the findings.
The study has few limitations. We used resistance as an indicator for adherence to first line, which may not always be true since some of the RAMs detected at first-line ART failure may also be primary resistance or just polymorphisms whose occurrence was unrelated to adherence and selective pressure. However, drug surveillance studies estimate relatively low prevalence of NRTI pretreatment drug resistance in low- and middle-income countries, 12 making it less likely that transmitted drug resistance significantly affected our results.
There is potential misclassification of resistance due to enrollment of participants who had stopped taking their treatment, since viral dynamics in an individual who is not on ART results in lower concentrations of resistant variants decreasing the sensitivity of resistance tests. 6,8,38 However, this misclassification would have biased the association toward the null and is therefore unlikely to have influenced our conclusions.
Footnotes
Authors' Contributions
L.M. developed the concept, reviewed the literature, analyzed the data, and wrote the article. R.G. supervised and mentored L.M. in the protocol development, MEMS adherence data cleaning, data analysis, and article writing. M.Z.L. comentored L.M. in the proposal development and analysis of the data. J.R. was the biostatistics advisor to L.M. during proposal development, analysis, and reporting. C.L.W. carried out the laboratory genotyping and provided expertise as a virologist. K.B. provided expert advice as a virologist and reviewed the article. C.G. provided overall concept development support and coordination of research logistics. A.C. contributed to the protocol development and provided insight and expertise on HIV research in LMIC, including literature reviews. A.L. contributed to the analysis and review of the article. L.Z. reviewed the biostatistics and analysis of the study and planned specimen export to RSA for analysis. X.S. reviewed the analysis of MEMS adherence data and resistance data. All authors have read and reviewed the article.
Acknowledgments
The views expressed are those of the authors (C.G.) and should not be construed as representing those of the US Department of State.
Author Disclosure Statement
No competing financial interests exist.
Funding Information
The AIDS Clinical Trials Group (ACTG) grant provided overall general support. Support for training and mentoring was provided to Lentlametse Mantshonyane and Robert Gross by the Fogarty International Center (D43 TW009781). Support for genotyping was provided by an NIH supplement. This work was supported by the University of Pennsylvania, Center for AIDS Research (P30 AI 045008), and Penn Mental Health AIDS Research Center (P30 MH 097488).