




Abstract
The possibility of synergism between the topoisomerase inhibition by coralyne and its DNA photonicking properties being used to kill cancer cells was explored. Compared with coralyne alone, the CUVA treatment dramatically enhanced DNA damage and apoptosis in cells. Despite causing an increased p53 expression, the CUVA treatment led to p53-independent apoptosis, causing almost similar cell death in wild-type, p53 mutant, and p53-silenced tumor cells. Expression of the p53-regulated downstream proteins like p21, and DNA-damage–dependent p53 phosphorylation at serine-15 residue also was not elicited by the CUVA treatment, at a low coralyne concentration. Instead, it led to an immediate activation of the Chk2-mediated S-phase arrest, despite activating PARP protein for DNA repair. The S-phase arrest subsequently ensures apoptosis through activation of caspases-3 and -9, the latter being reflected from the results with a specific caspase-9 inhibitor. Abrogation of Chk2 activity by shRNA or by using ATM-specific inhibitor (ATMi) led to a defective S-phase checkpoint and further augmentation in apoptosis. However, at a high coralyne concentration, the CUVA-induced apoptosis followed multiple and independent pathways, involving several caspases. The CUVA treatment may represent a novel mechanism-based protocol for increasing the efficacy of coralyne in inducing apoptosis in both p53 wild-type and mutant tumor cells. Antioxid. Redox Signal. 12, 945–960.
Introduction
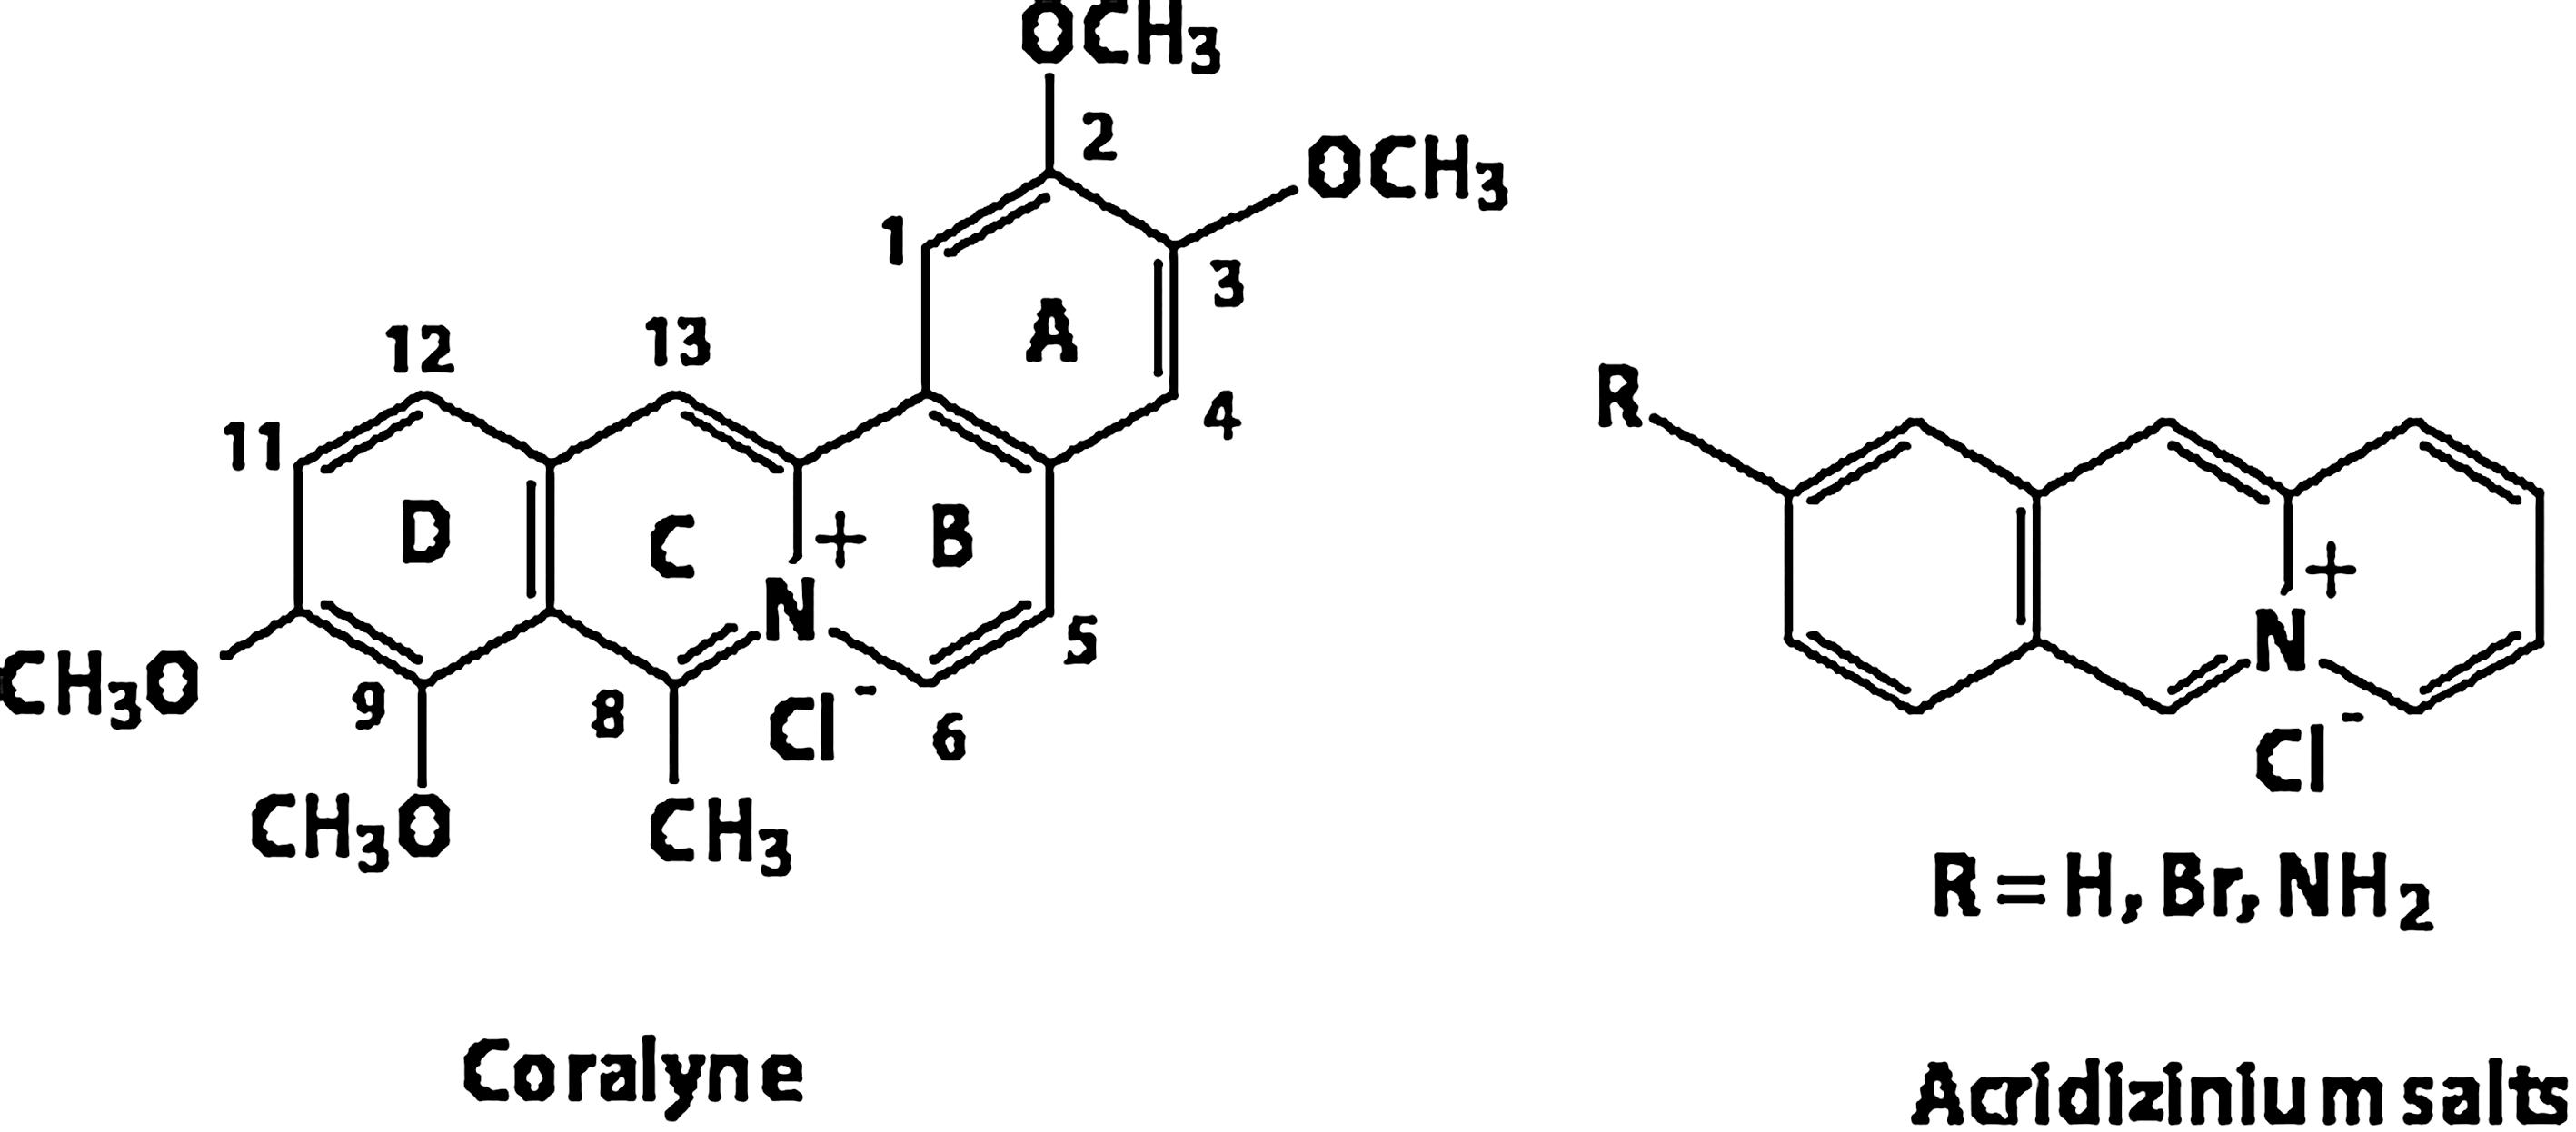
Protoberberine alkaloids and their derivatives are used as antitumor agents in traditional medicine and have been investigated in modern times (11, 35, 52). The antineoplastic activity of these alkaloids and their congeners are derived from their abilities to bind to DNA and inhibit the topoisomerase I enzyme (15, 31). However, minor alterations in their chemical structures significantly affect the relative efficacy of the analogues as topoisomerase poisons (26). Although berberine is the most studied among these alkaloids, its synthetic congener, coralyne (Fig. 1), has more-pronounced antitumor activity. Studies performed with coralyne and several of its derivatives suggested the importance of the C-8 methyl substituent and C-5, C-6 unsaturation in the protoberberines for their antitumor activity against L1210 and P388 leukemias in mice (50, 51).
Protoberberines also are known to generate various reactive oxygen species (ROS) in the presence of UV (ultraviolet) light (7), whereas coralyne and some related compounds show the DNA photonicking ability (21, 22, 45, 46). Whether the DNA-damaging property of any single drug could successfully be combined with its photochemotherapy has not even begun to be explored. Currently, two different phototherapeutic approaches, (a) photodynamic therapy (PDT) involving porphyrins and related compounds along with infrared radiation; and (b)
Very recently, a possible alternative approach of using thiothymidine along with UVA in the treatment of certain cancers has been reported (33). Also, the DNA photonicking agents, such as the acridizinium salts, have been suggested to be useful in the photochemotherapy of cancer (5). Because the acridizinium salts are structurally similar to coralyne (Fig. 1), except for the differences in the A-ring and substituents, we envisaged a similar activity of coralyne. Given that the topoisomerase inhibitors accumulate in high concentrations in and around DNA, it might be interesting to couple the bioactivity of these molecules with their photosensitizing property to perturb normal DNA functioning and to achieve synergism in killing cancer cells. This might assist in achieving therapeutic benefits of the drug, even at a lower concentration. With this hypothesis, we explored the possibility of synergism between the known topoisomerase inhibitory and the possible DNA photonicking properties of coralyne to kill cancer cells. For a better understanding of molecular mechanism, its photosensitizing ability was studied in detail in cellular conditions. The combined treatment with coralyne and UVA is referred to as CUVA throughout this study.
Materials and Methods
Materials
Coralyne (purity >99%), 8-methoxypsoralen (8-MOP), LMP agarose, fetal bovine serum (FBS), DMEM, RPMI-1640, penicillin, streptomycin, MTT [3-(4,5-dimethylthiazol-2-yl)-2,5-diphenyltetrazolium bromide], 3-AB (3-aminobenzidine), nocodazole, Z-VAD-FMK, Z-DEVD-FMK, Z-IETD-FMK, and Z-LEHD-FMK, antibodies for p21, p53, and β-actin, as well as kits for caspase-3, caspase-8, and caspase-9 were purchased from Sigma-Aldrich (St. Louis, MO). Other materials used were propidium iodide, G418 sulfate, a kit for determination of phosphorylation of the serine 15 moiety of p53, and the antibodies for phospho-Chk2 (Santa Cruz Biotechnology, Santa Cruz, CA), phospho-317-Chk1, phospho-p53, and PARP (Cell Signaling Technology, Inc., Danvers, MA), phospho-ATM (Millipore, Billerica, MA), and Chk2 (Calbiochem, San Diego, CA). [14C]Thymidine ([14C]TdR, 50 μCi) and 3H-thymidine ([3H]TdR, 50 μCi) were obtained from American Radiolabeled Chemicals, Inc., (St. Louis, MO) and Board of Radiation & Isotope Technology, Mumbai, India, respectively. All the cell lines were procured from the National Centre for Cell Science (NCCS), Pune, India. ATM-specific inhibitor (ATMi, 118500) and Chk2-specific inhibitor (Chk2i, 220485) were purchased from Calbiochem. A 20-mM stock solution of coralyne was prepared in warm water and used within 7 days. 8-MOP, ATMi, Chk2i, and camptothecin (CPT) were dissolved in dimethyl sulfoxide at 1 mg/ml.
UVA treatment
The UVA light from four Phillips lamps (each 25 W) was passed through Schott WG 335 filters and a glass shield to provide a UV wavelength >360 nm. The distance between the UV source and the surface of the irradiated solutions was kept at 5 cm to maintain the UV dose rate at 4 J/m2/s. The UV fluence was quantified with a research radiometer (IL 1700; International Light, Newburyport, MA).
Cell culture and coralyne, psoralen, CUVA, or PUVA treatment conditions
The human breast adenocarcinoma (MDA-MB-231 and MCF-7) and skin epidermoid carcinoma (A431) cell lines were cultured in DMEM medium, whereas the human lung carcinoma (A549) and human normal kidney (HEK293) cell lines were cultured in RPMI medium supplemented with 10% FBS at 37°C in a 5% CO2 atmosphere. For coralyne or CUVA treatment, the overnight-grown unsynchronized cells were treated with different concentrations of coralyne for 2 h in PBS. The cells were washed twice with PBS, and either kept in PBS for 0.5 h in case of coralyne treatment, or irradiated with the UVA set up for 0.5 h in PBS for the CUVA treatment. Subsequently, PBS was removed from the treatments, and the cells were incubated in a regular medium at 37°C in a 5% CO2 atmosphere for the time specified in the respective figure legends and text. For the psoralen or PUVA treatment, cells were treated similarly, except for using psoralen instead of coralyne.
MTT and cell-proliferation assay
The cytotoxic effects of coralyne, psoralen, CUVA, and PUVA treatment were determined by the MTT method, as described earlier (29).
Comet assay
The DNA damage in the coralyne- or CUVA-treated A549 cells was monitored with the alkaline comet assay, as described earlier (34). For each condition, the Olive-tail moments (extent of DNA damage) were measured in a total of 300 randomly chosen cells by using Comet Assay IV software (Perceptive Instruments, Suffolk, U.K.). For the DNA-repair studies, the A549 cells were incubated with PARP-1 inhibitor (3-AB, 4 mM) for 1 h before the CUVA treatment.
Measurement of apoptosis with ELISA
The apoptosis induction by coralyne or the CUVA treatment was assessed by using a Cell Death ELISAPLUS kit (Roche Molecular Biochemicals, Indianapolis, IN). The kit uses a photometric enzyme immunoassay that quantitatively determines the enrichment of cytoplasmic histone-associated DNA fragments (mono- and oligosomes) after apoptotic cell death.
Measurement of caspase activities and their inhibition
The assays of the caspase activity were based on spectrophotometric detection of the chromophore pNA after its cleavage from the labeled substrate Ac-LEHD-pNA, Ac-DEVD-pNA, and Ac-IETD-pNA by caspase-9, caspase-3, and caspase-8 proteases, respectively. Assays were performed with the caspase-3 and caspase-8 colorimetric kits (Sigma-Aldrich) or caspase-9 substrate (Sigma-Aldrich) according to the manufacturer's protocol. For the caspase-inhibition studies, cells were treated with inhibitory peptides Z-DEVD-FMK (a cell-permeable inhibitor of caspase 3, 6, 7, 8, and 10), Z-VAD-FMK (caspase-3 inhibitor), Z-IETD-FMK (caspase-8 inhibitor), or Z-LEHD-FMK (caspase-9 inhibitor). The inhibitors were present throughout the experiment, including the 2-h preincubation period before coralyne or CUVA treatment.
Western blot analysis
Preparations of protein samples and Western blots were performed as described previously (19). The bands were quantified with respect to β-actin bands, by using Kodak Gelquant software. The values (arbitrary unit, mean ± SEM) are the density-scanning results of three independent experiments, considering that of untreated control cells as 1.
Assay of DNA synthesis by [3H]thymidine incorporation
A549 cells were prelabeled for 48 h with [14C]TdR (10 nCi/ml) and pulse-labeled for the last 10 min with [3H]TdR (1 μCi/ml) during the respective recovery periods from coralyne and CUVA treatments. Further incorporation was stopped by washing the cells twice with cold PBS. Subsequently, the cells were scraped into 2 ml cold PBS; aliquots were precipitated with 100% trichloroacetic acid in triplicate. Every 10 min, samples were vigorously vortexed for 2 h. After centrifugation at 9,400 g for 10 min at 4°C, 0.5 ml of 0.4 M NaOH was added to the pellets and kept overnight at 37°C to dissolve the precipitates. Samples were counted by using dual-label liquid scintillation, and the DPM of [3H]TdR was normalized to that of [14C]TdR in each sample. DNA synthesis was measured in terms of 3H/14C in the treated samples divided by 3H/14C in the untreated controls (36).
Transfection of A549 cells
The A549 cells were transfected with plasmids purchased from Imgenex (San Diego, CA) encoding short-hairpin RNA (shRNA) specific for p53 (pSuppressorNeo-p53), Chk2 (pSuppressorNeo-Chk2), or the nonspecific control plasmid (pSuppressorNeo-con). The nonspecific control plasmid is identical to pSuppressorNeo-Chk2 and pSuppressorNeo-p53, except that it contains a scrambled sequence with no significant homology to rat, mouse, and human gene sequences. The A549 cells were transfected with a pSuppressorNeo-con, pSuppressorNeo-Chk2, or pSuppressorNeo-p53 plasmid by using DOTAP liposomal transfection reagent (Roche Molecular Biochemicals, Indianapolis, IN), as described in the manufacturer's protocol. The transfected cells were grown for 3 weeks in a medium containing 800 μg G418/ml. Several G418-resistant clones were expanded and screened for the p53 and Chk2 proteins. The clone with the lowest expression was selected for the studies and was maintained further in the presence of 500-μg G418/ml.
Flow-cytometry analysis
Cells were treated with coralyne or CUVA at a 0.2 μM concentration of coralyne. In a separate set, cells were pretreated with Chk2-specific inhibitor (Chk2i, 100 nM) for 2 h, and subsequently, Chk2i was included throughout the experiment. The untreated and treated cells were allowed to recover in complete medium containing nocodazole (0.25 μg/ml) for 24 h. Cells were trypsinized, washed with PBS, and single cells were fixed with chilled 80% ethanol for at least 3 h at −20°C. The staining was performed for 30 min at room temperature in PBS containing 20 μg/ml propidium iodide and 50 μg/ml RNase. Data were collected with a Becton Dickinson FACS machine (Mountain View, CA). Cell-cycle analysis was performed by using FlowJo software, in which doublets and debris were excluded by software algorithms.
Clonogenic survival assay
Reproductive cell death was assayed by measuring colony formation with and without coralyne, psoralen, CUVA, or PUVA treatment, as described earlier (2).
Statistical analyses
For all the tests, the level of statistical significance was set at p < 0.05. When needed, the data were transformed to achieve a normal distribution. The one-way ANOVA was used to test the significance of differences in measured variables between the control and the treated groups.
Results
Photosensitizing effect of CUVA treatment on different cancer cells
The photosensitizing ability of the CUVA treatment on two p53 wild-type (A549 and MCF7) and two p53 mutant (A431 and MDA-MB-231) cells was studied with the MTT assay. This assay was carried out by using different UVA exposure times (0 to 14 kJ/m2) and various concentrations of coralyne. The representative results obtained for 7 kJ/m2 of UVA are shown in Fig. 2A through D. Irrespective of the cell lines used, various combinations of CUVA showed better cell killing compared with the treatment with coralyne alone. UVA exposure alone (7 kJ/m2) did not cause any appreciable loss in cell survival of all the four cell lines (data not shown). The CUVA protocol (up to 2 μM) did not show significant toxicity to the HEK293 (human normal kidney) cell lines in the MTT assay.
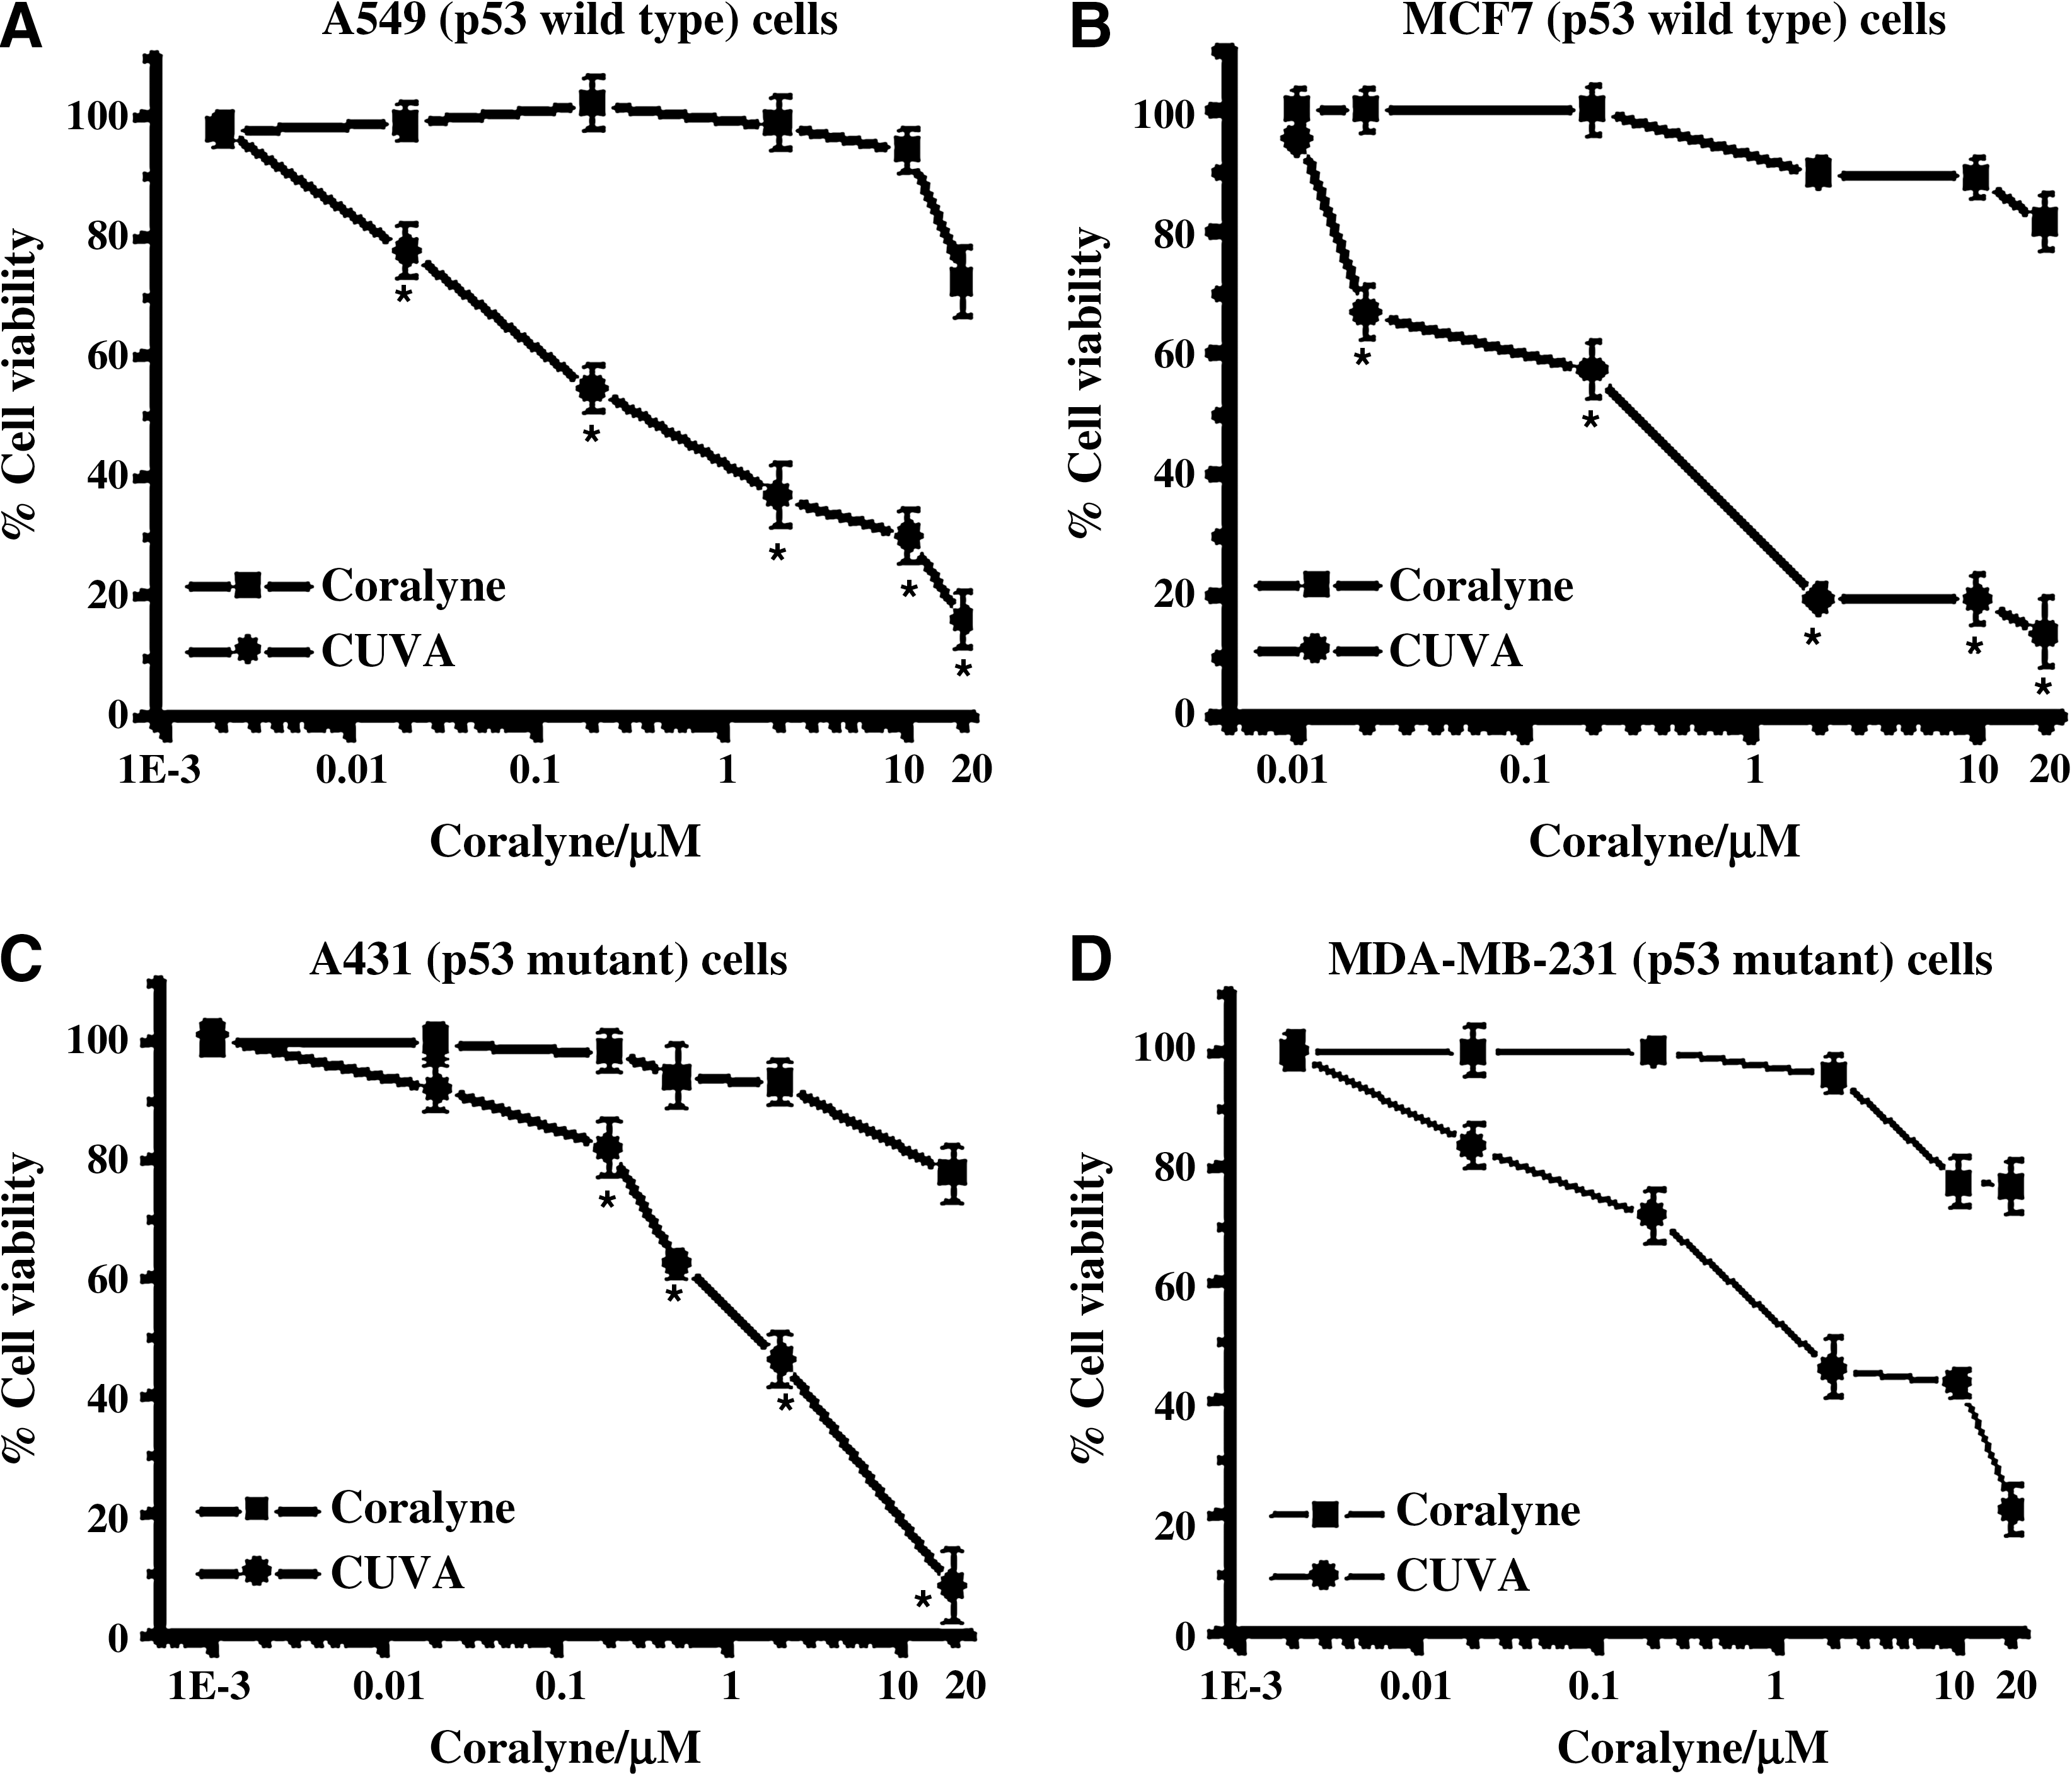
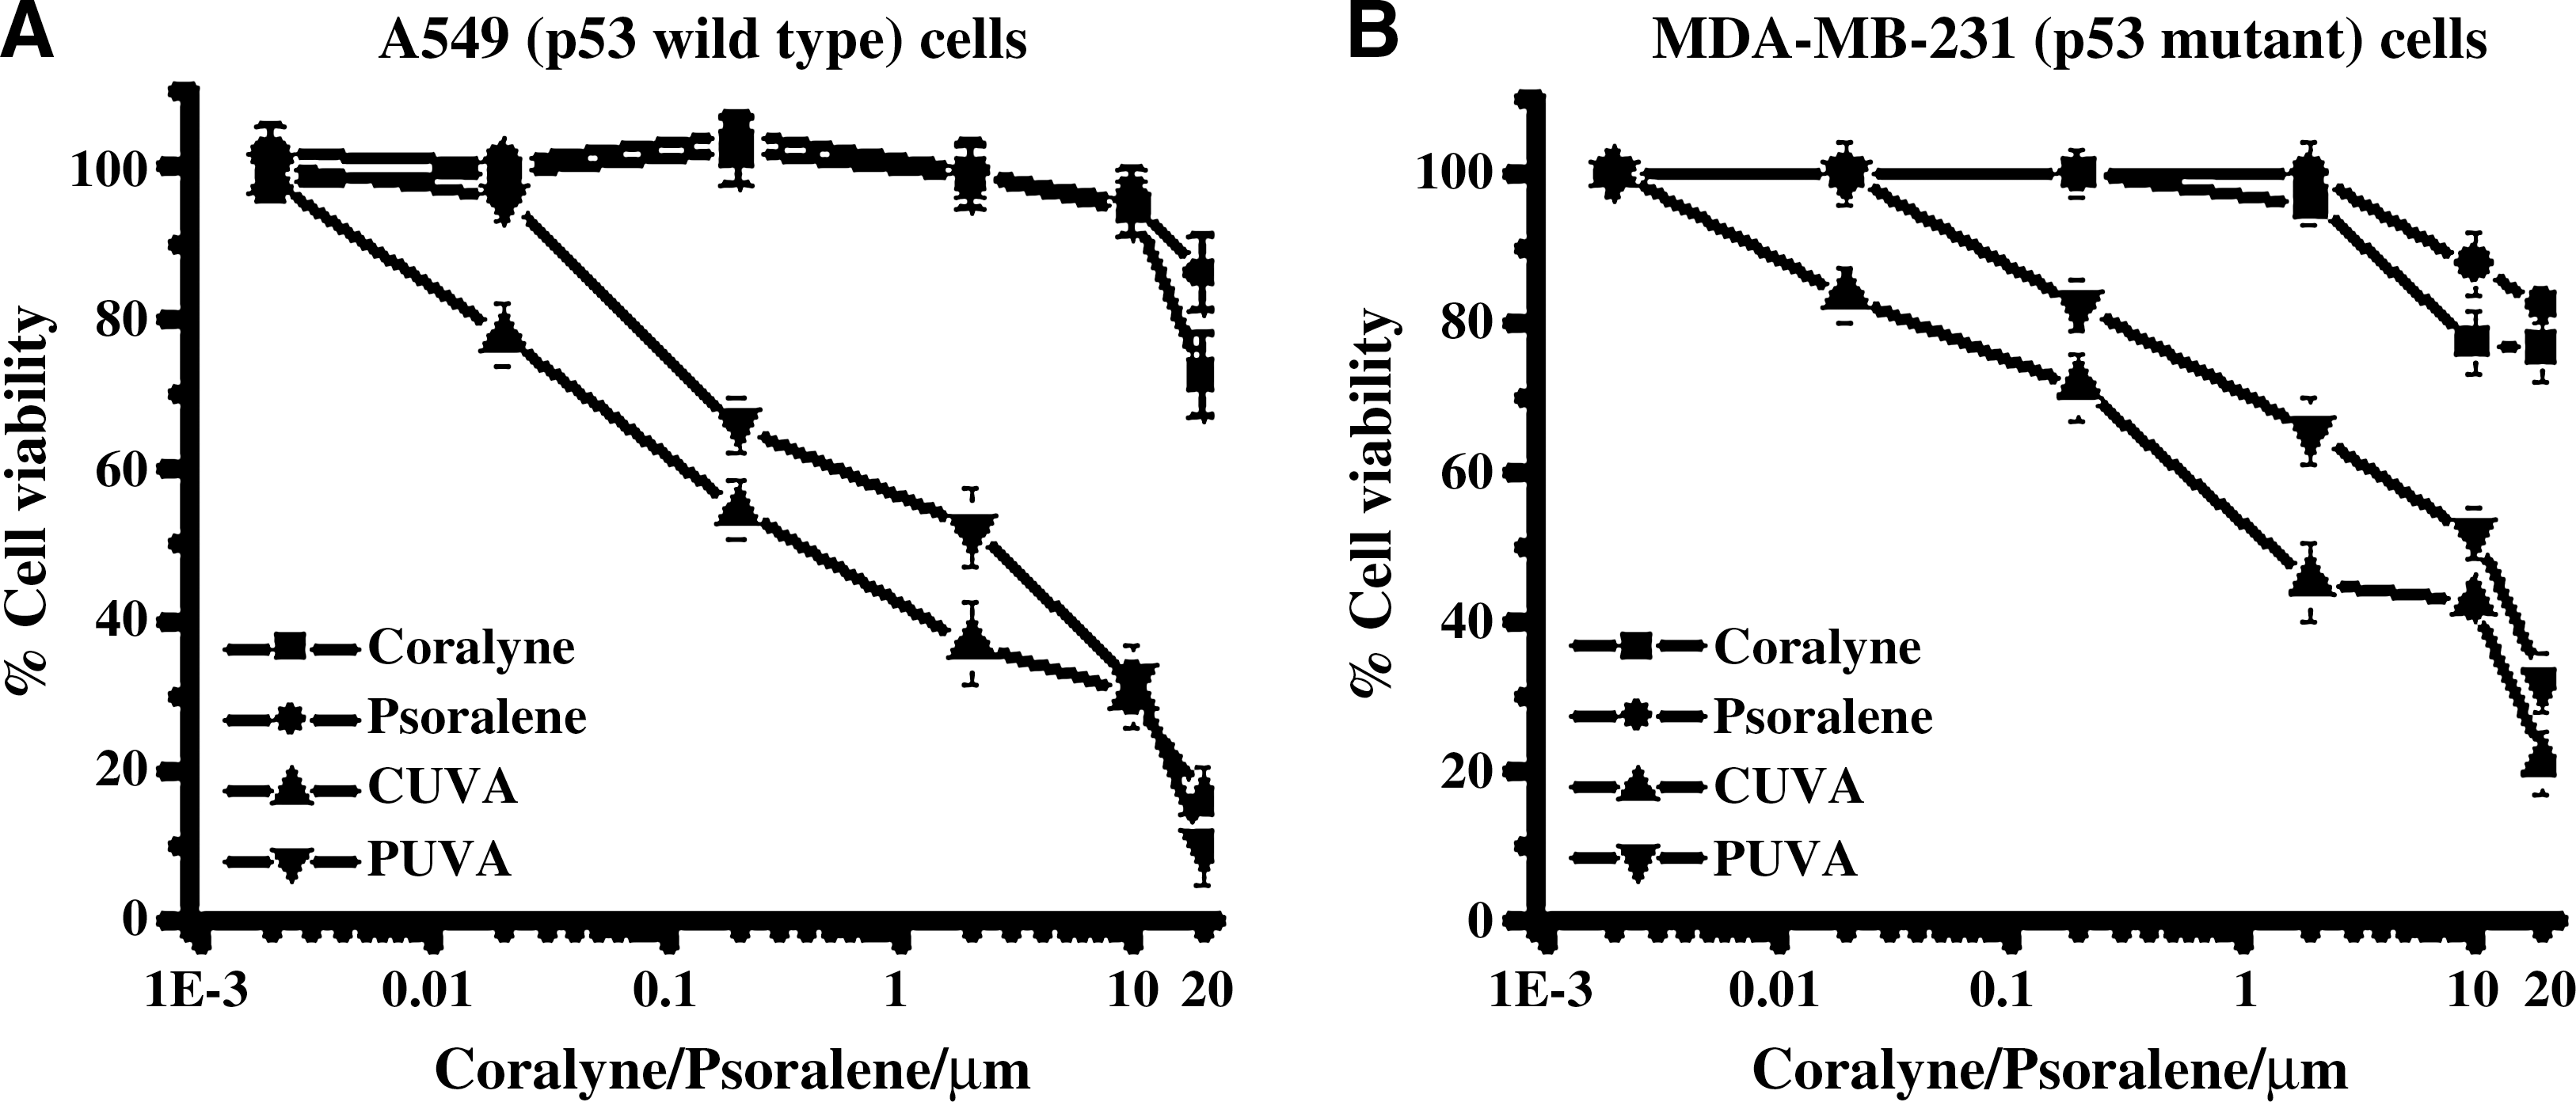
In the p53 wild-type A549 and MCF7 cancer cells, the SF80 values (coralyne concentration at which 80% cells survived) for the CUVA treatment were 0.015 and 0.014 μM, whereas those for coralyne treatment were 15.86 and 21.15 μM, respectively (Fig. 2A and B). With the p53 mutant A431 and MDA-MB-231 cancer cells, the SF80 values for CUVA treatment were 0.4 and 0.04 μM, and for coralyne treatment were 12.36 and 24.17 μM (Fig. 2C and D). Notably, these represent about 1,057-, 1,510-, 31-, and 604-fold enhanced sensitivity of A549, MCF7, A431, and MDA-MB-231 cells to the CUVA treatment compared with treatment with coralyne alone. In control experiments, coralyne did not sensitize the cells when added after UVA exposure (data not shown), revealing that the photosensitization effect requires the prior presence of coralyne in the system. Comparison of the photosensitizing efficacies of the CUVA and PUVA treatments revealed the former to be about10- to 15-fold more effective in reducing the viability of A549 and MDA-MB-231 cells (Fig. 3A and B).
Role of p53 in the CUVA-induced cell death
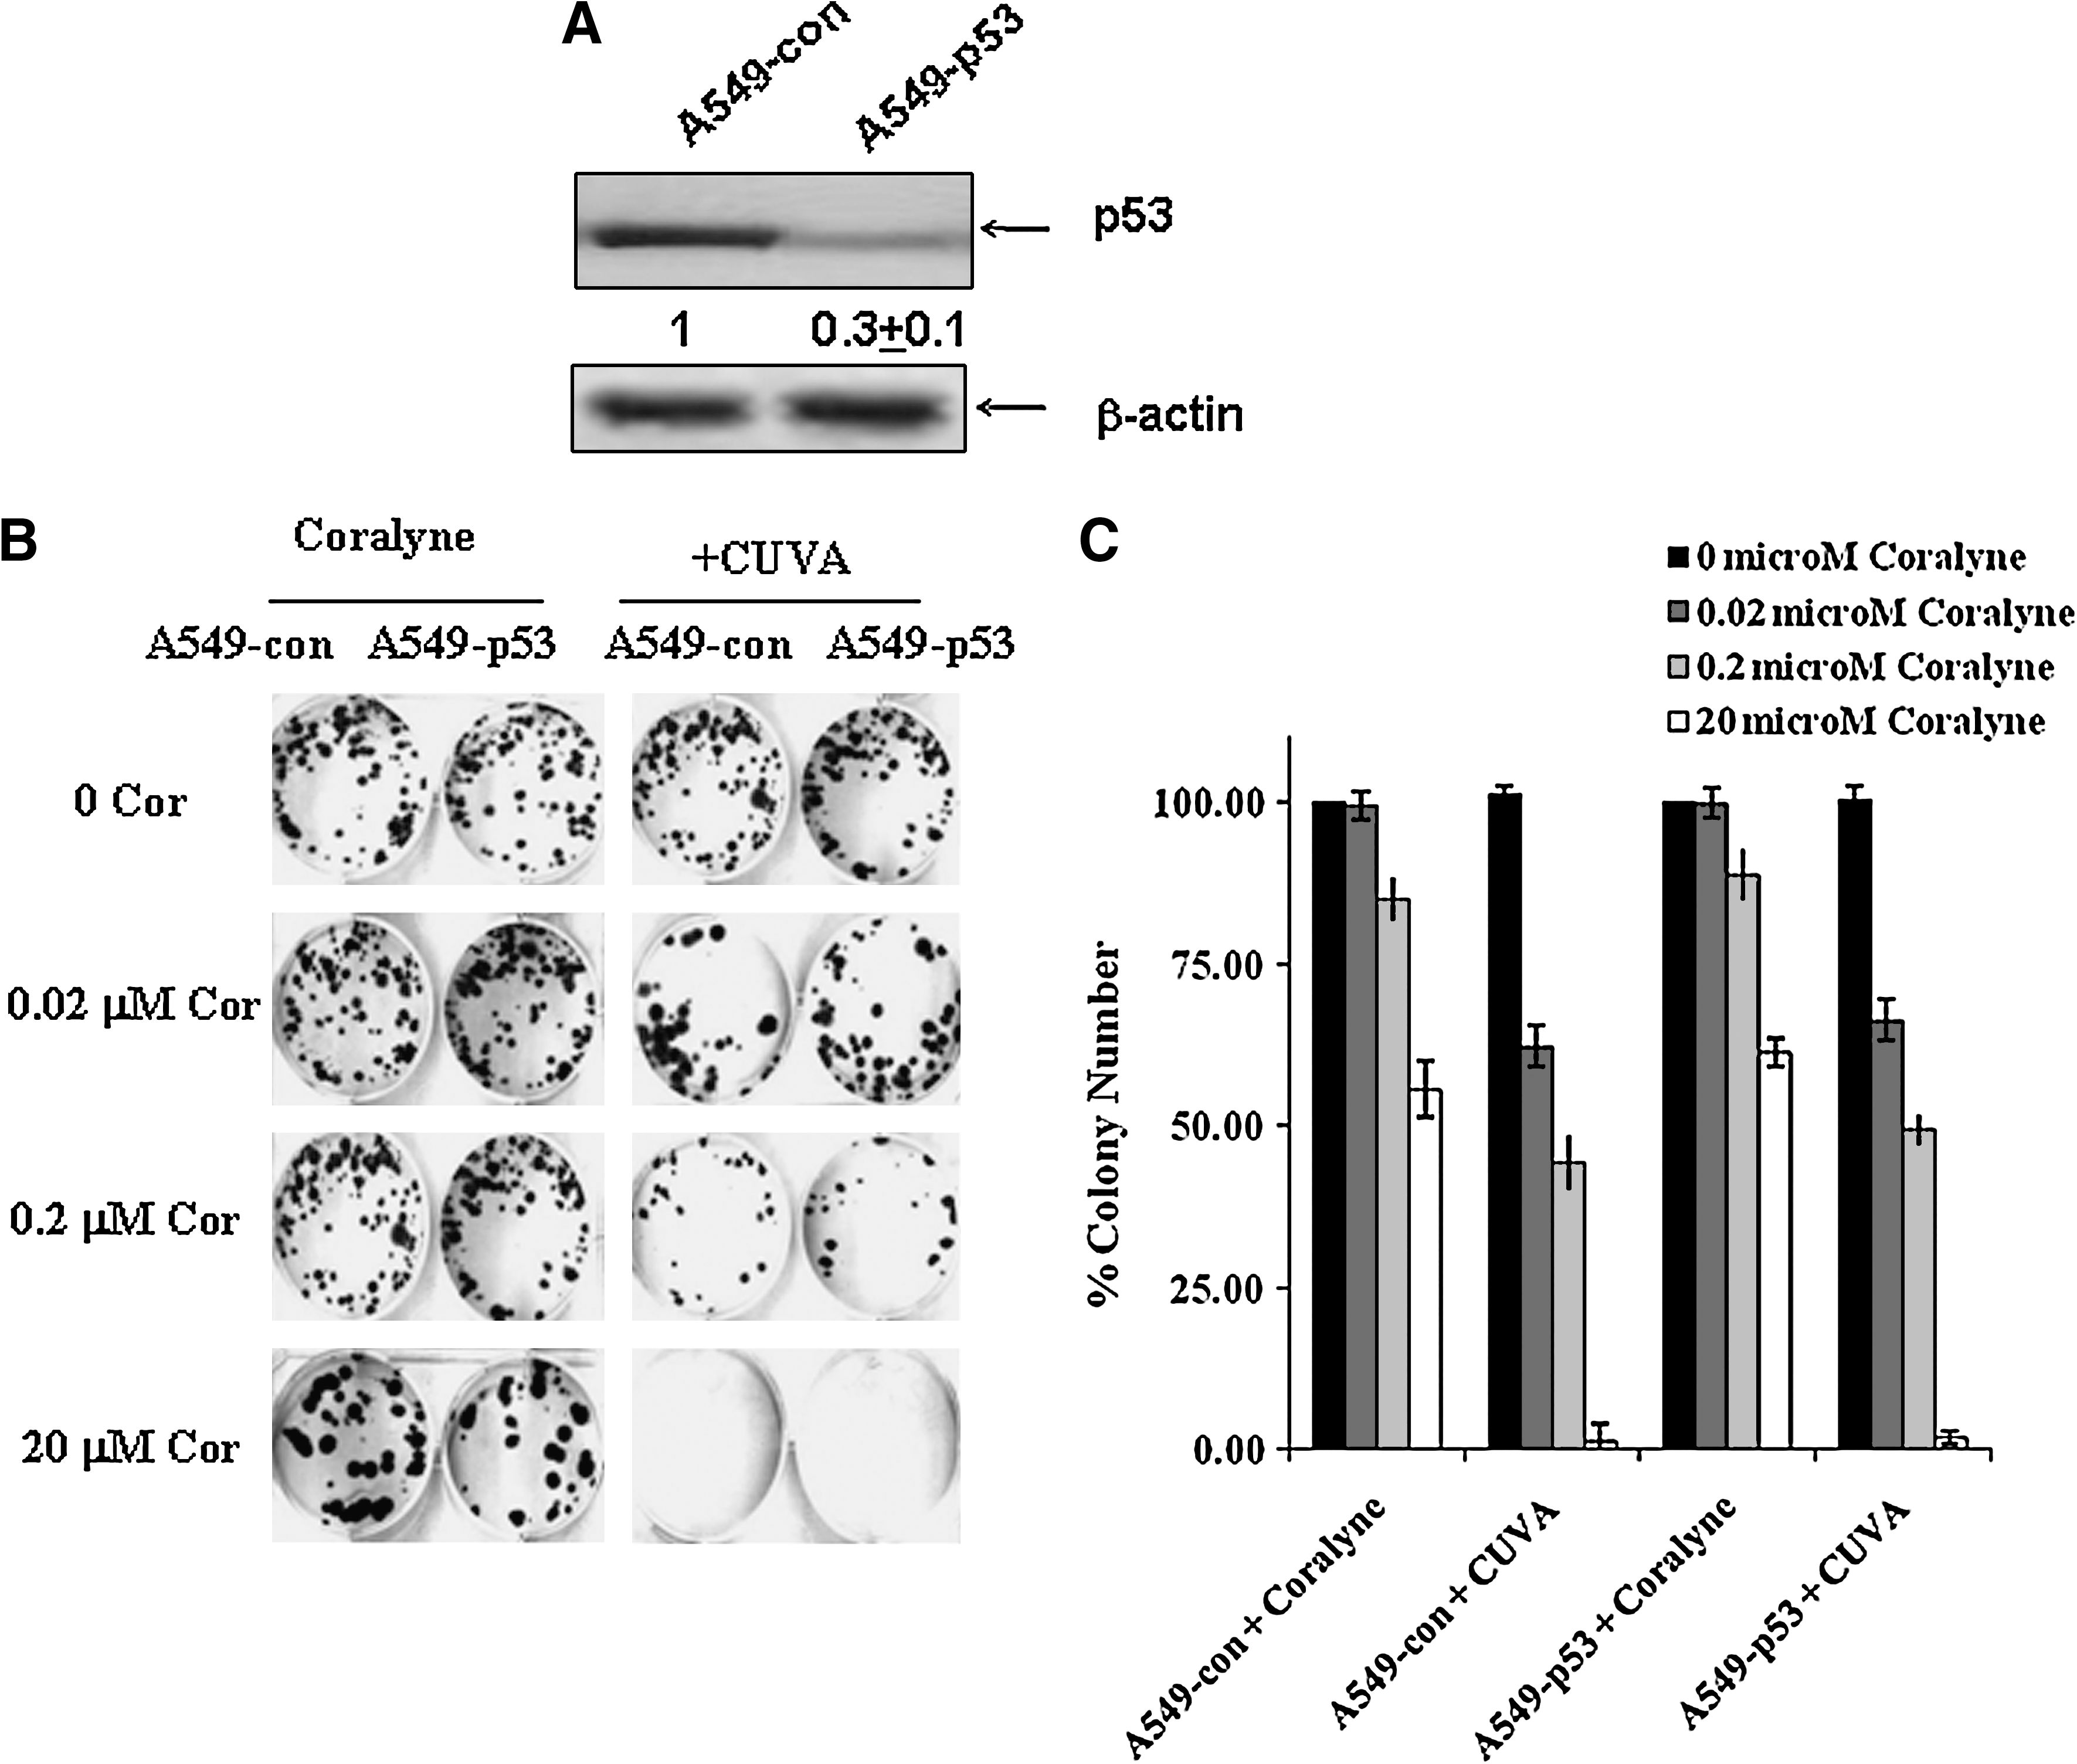
To confirm the actual role of p53 in the CUVA-induced death process, we depleted p53 mRNA in the A549 cells by RNA interference. The respective A549 cells expressing antisense p53 or scrambled negative control product are designated as A549-p53 or A549-con cells throughout this report. The p53 depletion in the A549-p53 cells was confirmed with immunoblot (Fig. 4A). Subsequently, the effects of coralyne and CUVA treatment on long-term survival of A549 and A549-p53 cells was assessed with the clonogenic assay. Compared with that of the untreated A549-con cells, treatment with coralyne (0.02, 0.2, and 20 μM) inhibited the colony formation to 99%, 85%, and 55%, respectively on day 12. The CUVA treatment (7 kJ/m2 UVA) at the same concentrations of coralyne reduced it to about 62%, 44%, and 1%, respectively, clearly revealing its supremacy over coralyne-alone treatment in inducing the death of the A549 cells (Fig. 4B). With A549-p53 cells, similar results were observed (Fig. 4B and C).
Next, the A549, A549-con, and A549-p53 cells were treated with different concentrations (0, 0.02, 0.2, and 20 μM) of coralyne alone or CUVA, and the induction of p53 expression was measured with ELISA. Treatment of A549 cells with coralyne or CUVA increased the p53 expression by 1.2- to 1.6-fold, at 3 h after treatment, and the effect was dependent on coralyne concentrations. At 12 h after treatment with coralyne, the p53 expression was increased further to 1.5- to 1.9-fold, whereas the same for the CUVA treatment was 2.0- to 2.6-fold (Fig. 5A). Our Western blot results (Fig. 5C) were in good correlation with the ELISA data. A similar trend of p53 expression also was observed with A549-con cells (data not shown). However, the dose- and time-dependent increase in p53 expression was almost abolished in the A549-p53 cells (Fig. 5B).
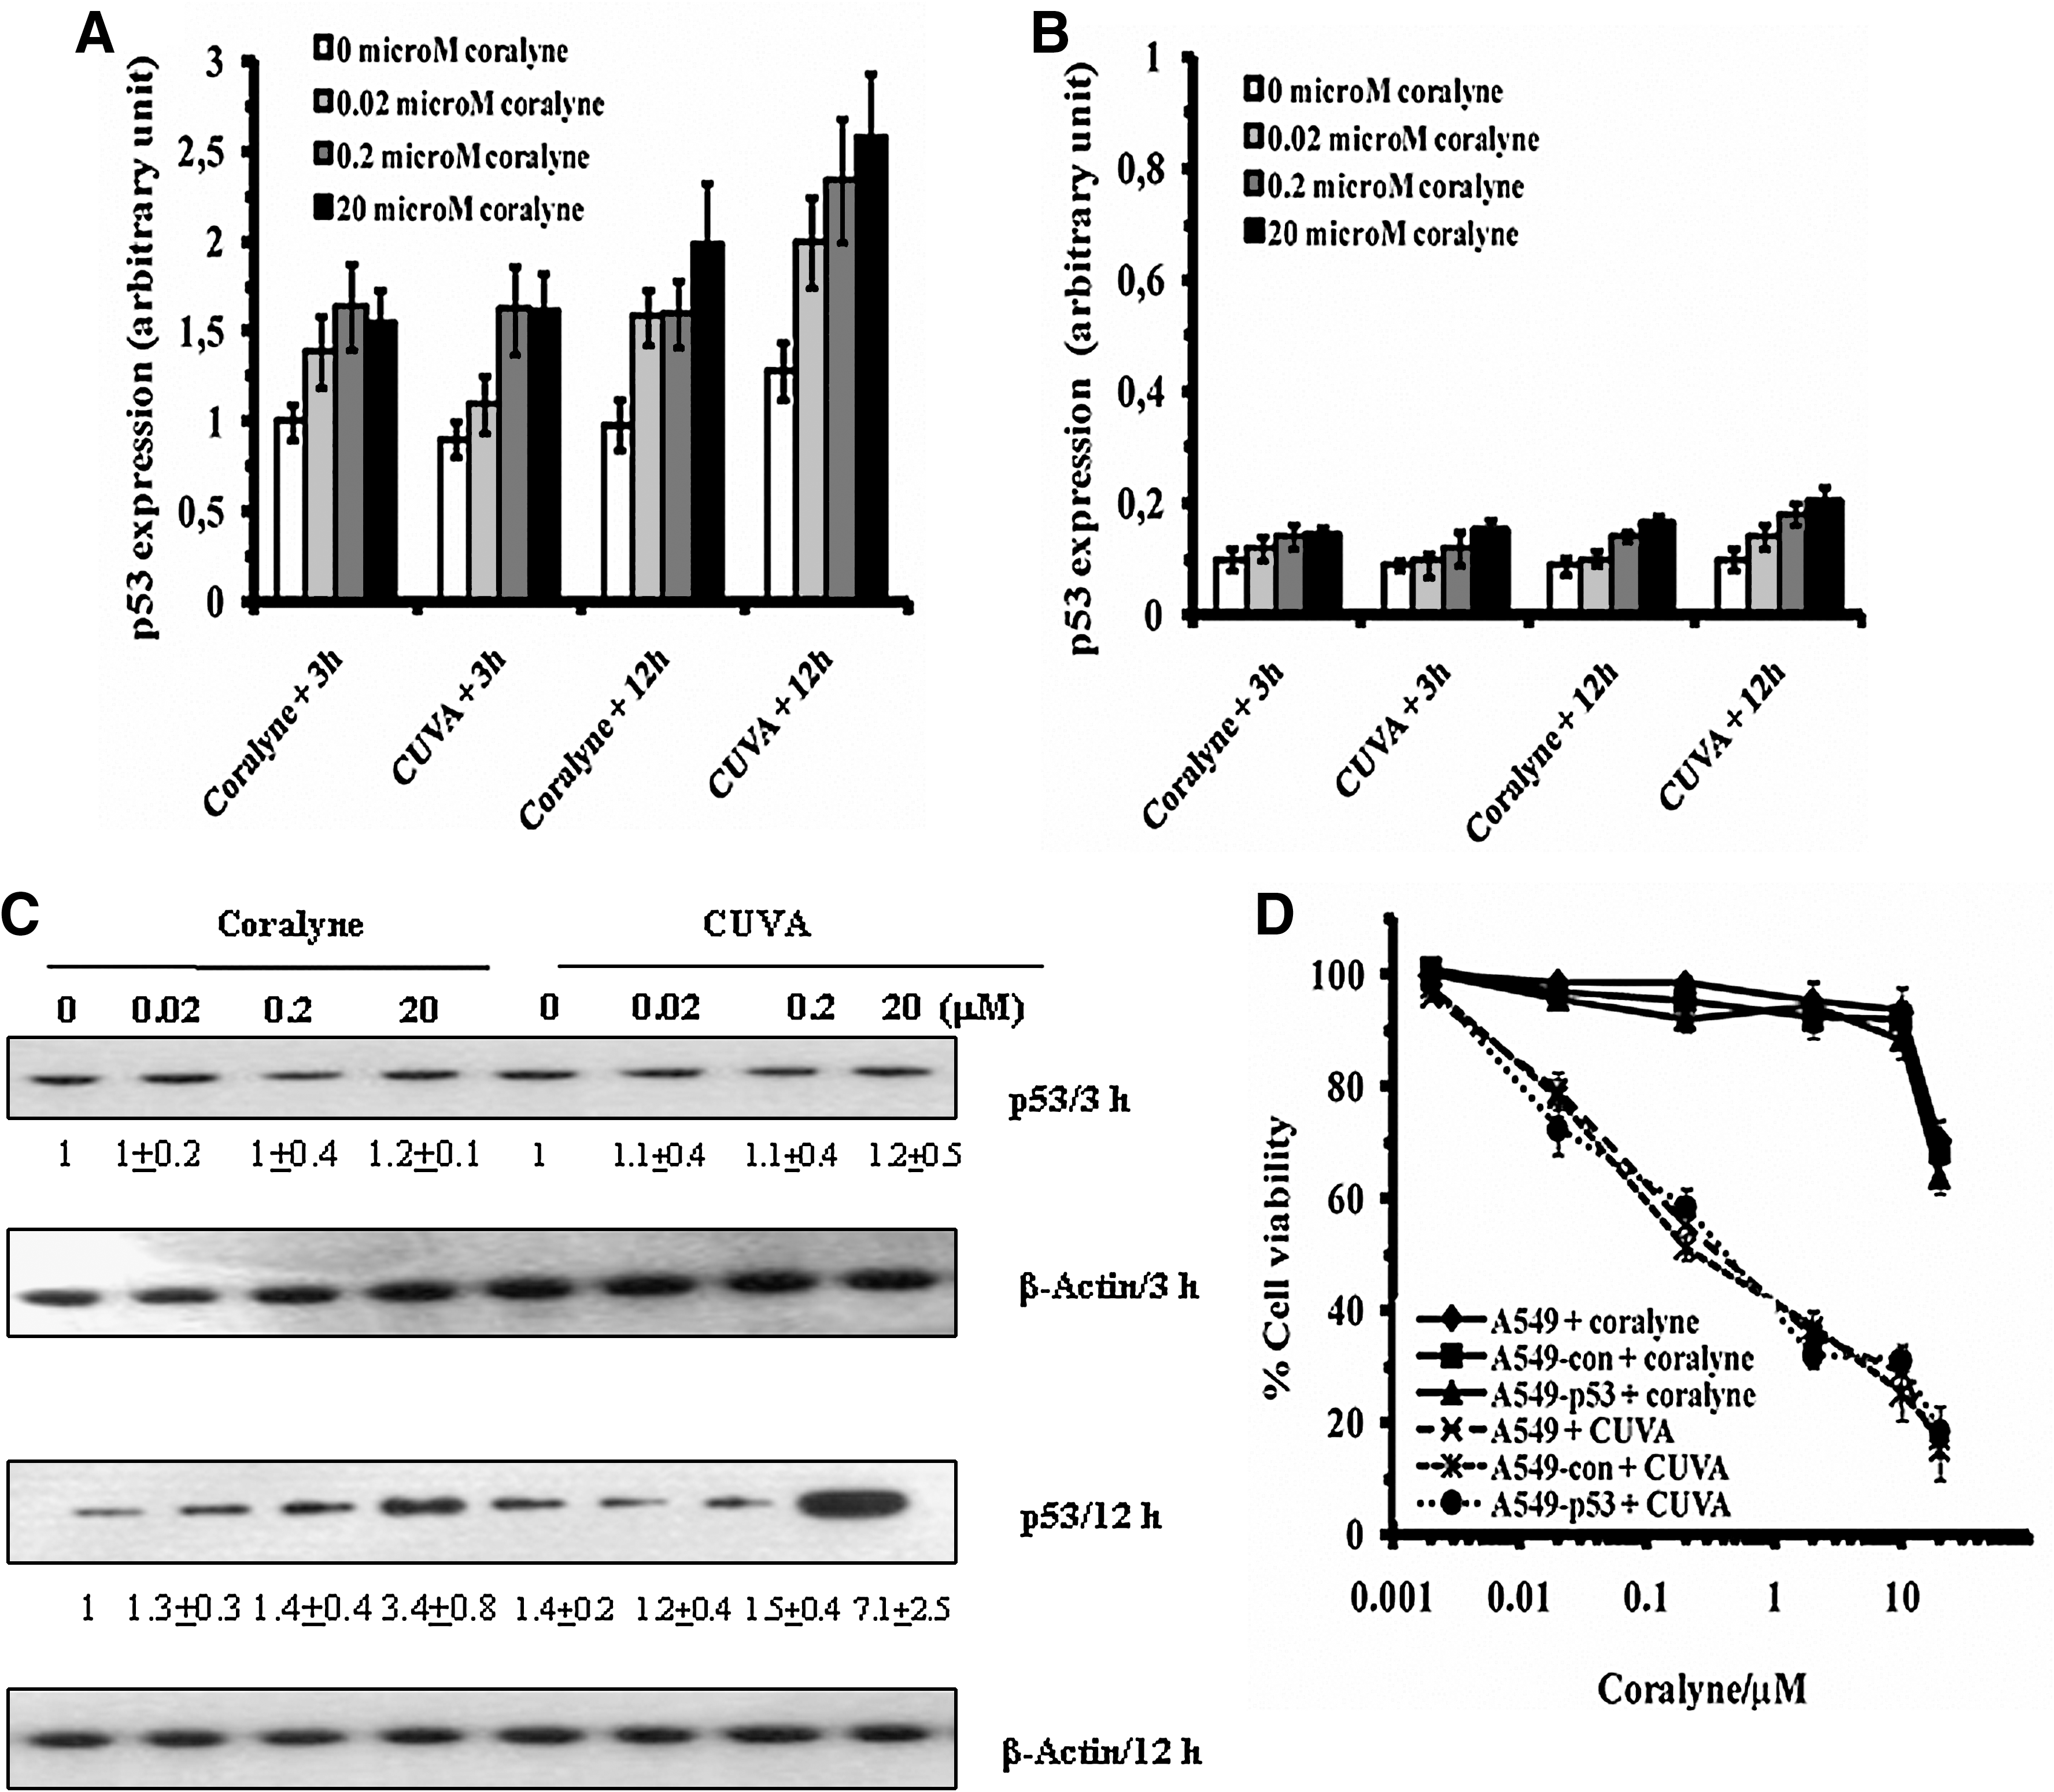
Subsequently, the differential sensitivity of the A549, A549-con, and A549-p53 cells to the CUVA treatment was checked by comparing their survival losses. CUVA treatment reduced the cell survival of the A549-con, A549-p53, and the untransfected A549 cells to the same extent. The SF80 doses for A549, A549-con, and A549-p53 cells in coralyne-alone treatment were about 16.56, 14.88, and 14.17 μM, whereas those for the CUVA treatment were about 0.016, 0.014, and 0.013 μM, respectively (Fig. 5D). These revealed that the A549, A549-con, and A549-p53 cells were 1,035-, 1,063-, and 1,090-fold more sensitive to the CUVA treatment than to that with coralyne alone.
CUVA treatment induces apoptosis through activation of caspases
To assess whether the cell death induced by the CUVA treatment involves apoptosis, we looked for (a) enrichment of nucleosomes in the cytoplasm, (b) poly(ADP-ribose) polymerase (PARP) cleavage, (c) activation of caspases, and (d) effects of the caspase inhibitors on apoptosis. Treatment of the A549 cells with coralyne (0.002, 0.02, 0.2, and 20 μM) alone increased the accumulation of nucleosomes in the cytoplasm by factors of about 1.0, 0.9, 1.0, and 2.6, respectively, revealing apoptotic killing of the A549 cells by coralyne. In comparison, the CUVA treatment at the same concentrations of coralyne showed enrichment factors of about 0.9, 3.4, 3.9, and 9.2, respectively (Fig. 6A). Thus, the CUVA treatment with even a 1,000-fold less coralyne concentration (0.02 μM) induced more apoptosis than treatment with coralyne (20 μM) alone. Similar results were obtained with the MCF7 and MDA-MB-231 cells (data not shown).

In many systems, the final execution of apoptosis is mediated through caspase-8 and caspase-9 as the initiators, and caspase-3 as the effector. Because PARP is a substrate of caspase-3, we also analyzed the protein level with Western blot. The level of cleaved PARP was also markedly increased by the CUVA treatment, but much less by coralyne alone (Fig. 6B). Next, we assessed the activities and expressions of the caspases-3, -8, and -9 in the coralyne- and CUVA-treated A549 cells. Coralyne (0.2 and 20 μM) alone did not cause any appreciable change in the caspase-3 activity, whereas the CUVA treatment at the same concentrations of coralyne increased it by 1.2- and 2.1-fold, respectively, at 6 h, and by 7.7- and 1.9-fold at 24 h (Fig. 7A). Both coralyne alone and CUVA, at a coralyne concentration of 0.2 μM, did not induce caspase-9 activation until 24 h. However, at a concentration of 20 μM, coralyne alone increased the caspase-9 activity marginally (1.5-fold) at 24 h, whereas the CUVA treatment increased the same by 4- and 1.5-fold at 6 h and 24 h, respectively (Fig. 7C). Likewise, when the A549 cells were treated with 0.2 or 20 μM coralyne, the caspase-8 activity did not change significantly. Even the CUVA treatment with 0.2 μM coralyne was ineffective, but it increased the caspase-8 activity by 4.5-fold (6 h) and 6.0-fold (24 h), respectively, at a coralyne concentration of 20 μM (Fig. 7E). The expressions of the individual caspases (Fig. 7B, D, and F) were consistent with their activation by the respective treatments.
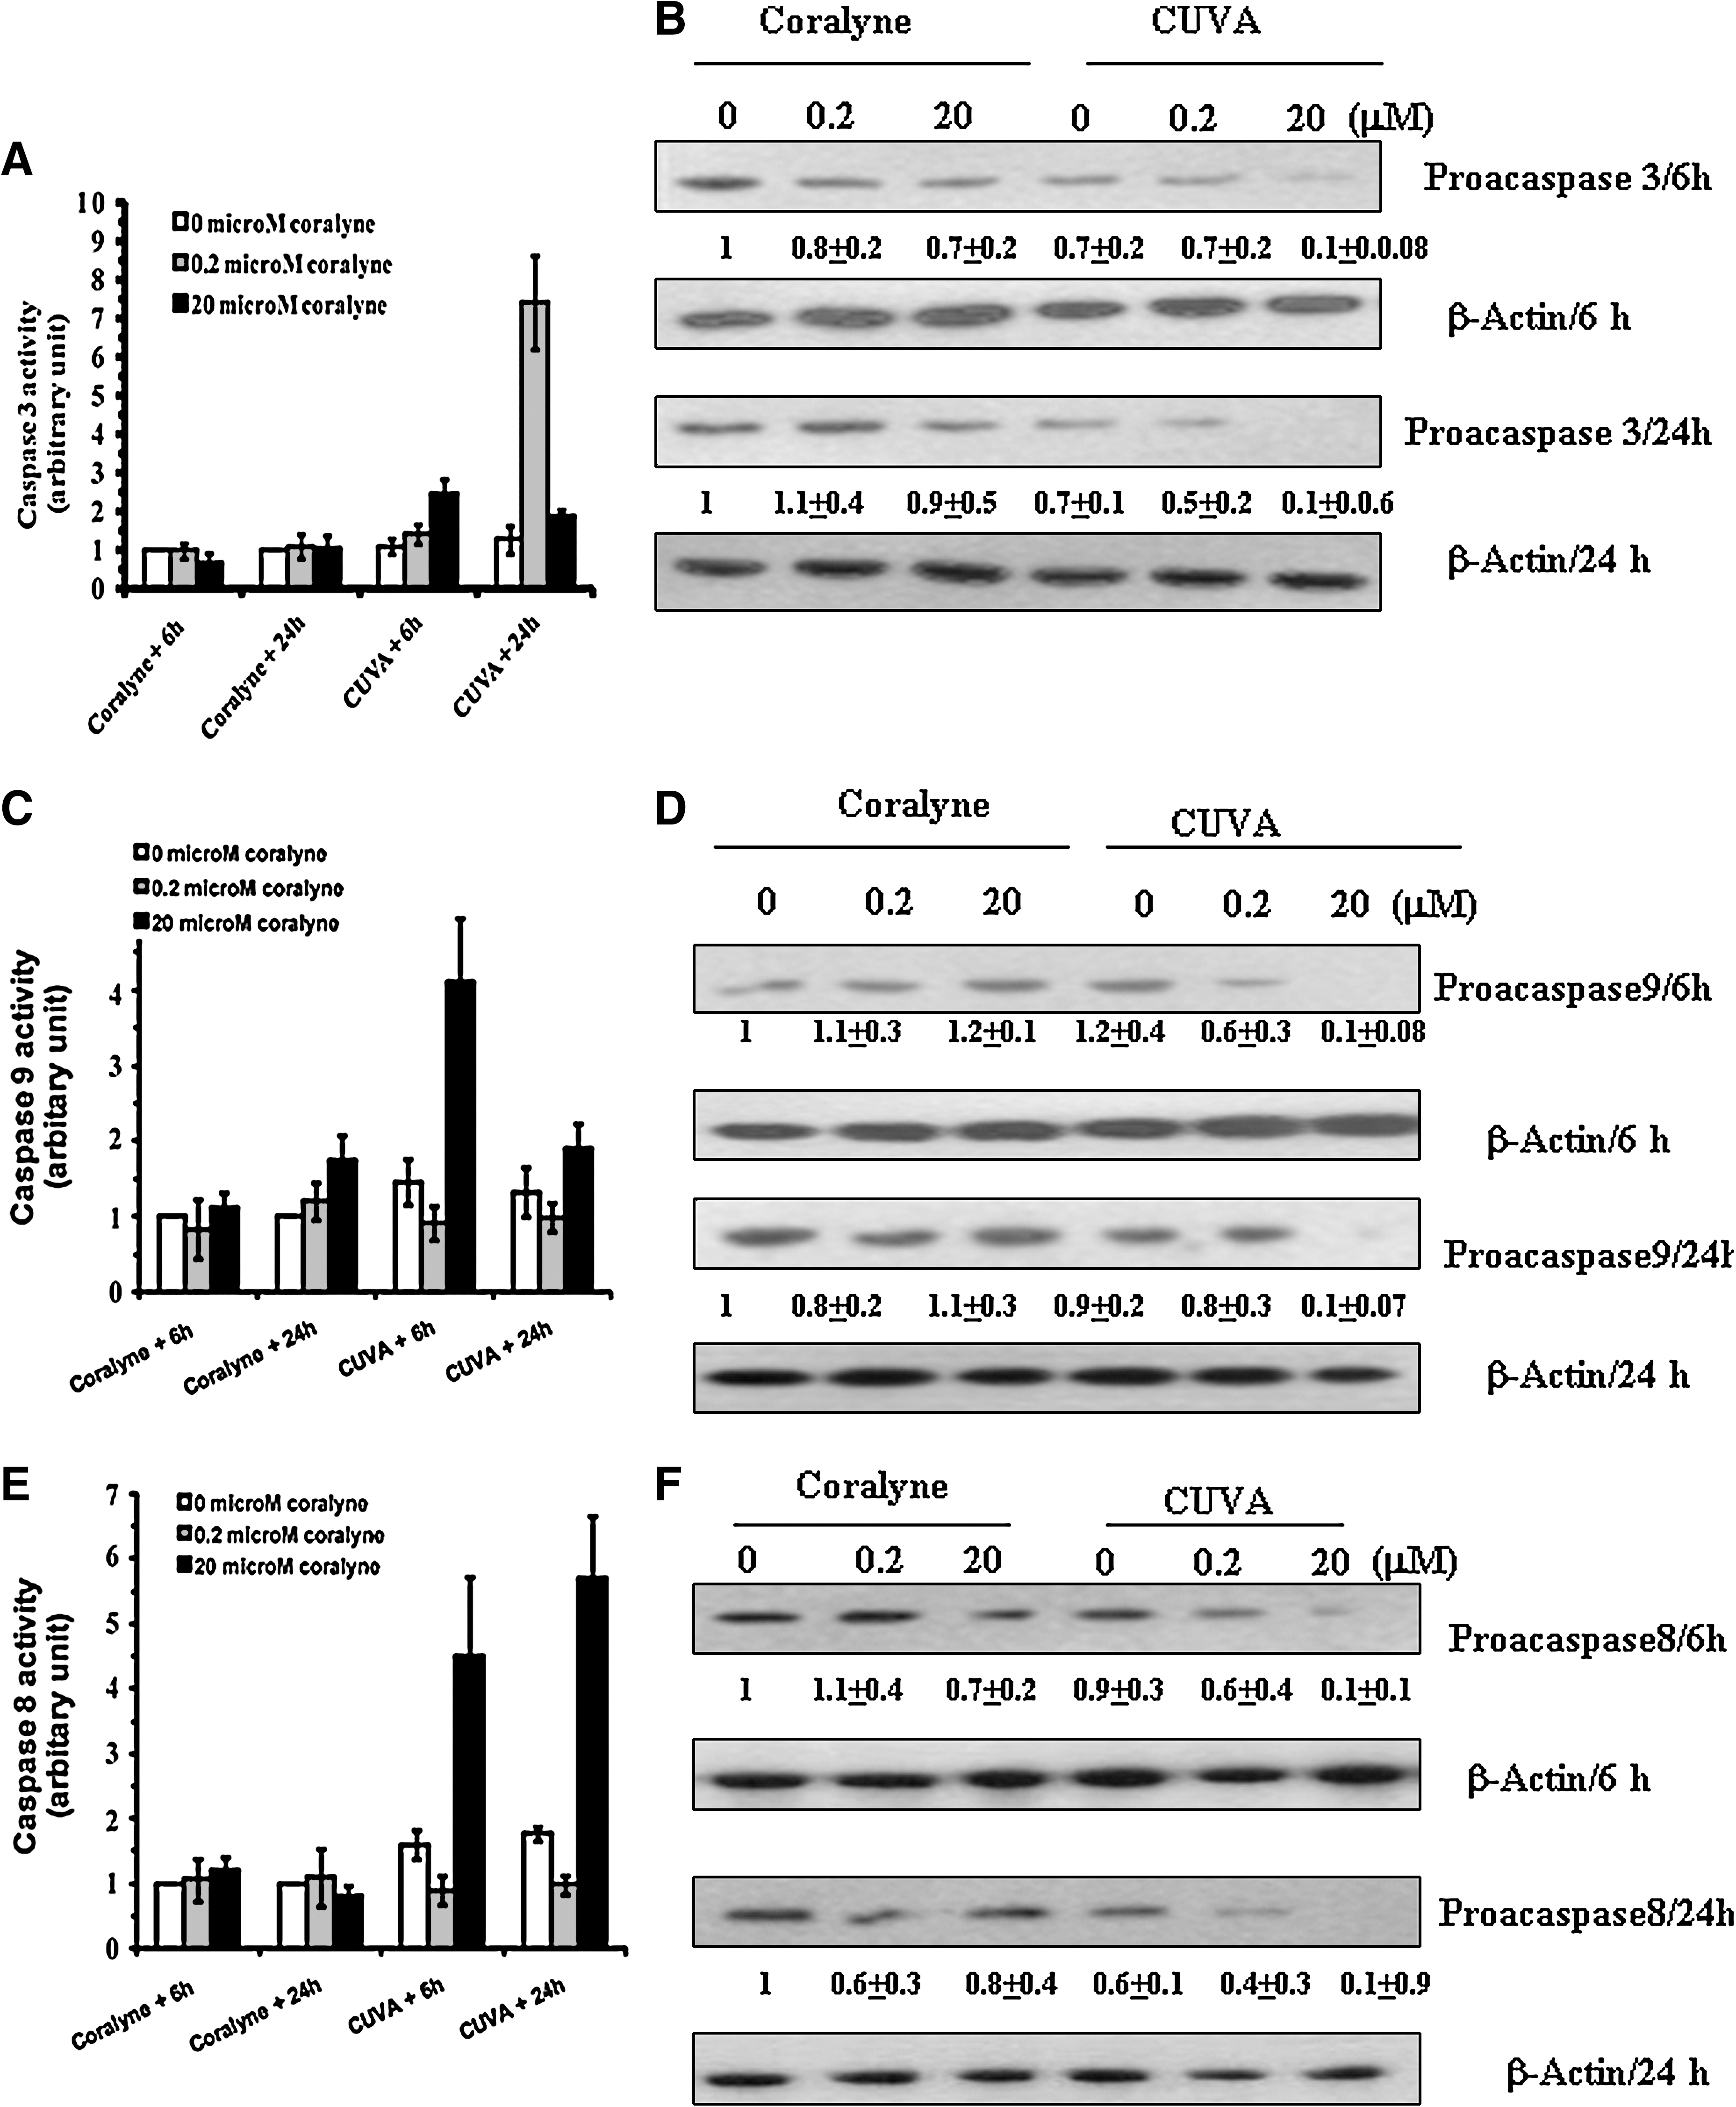
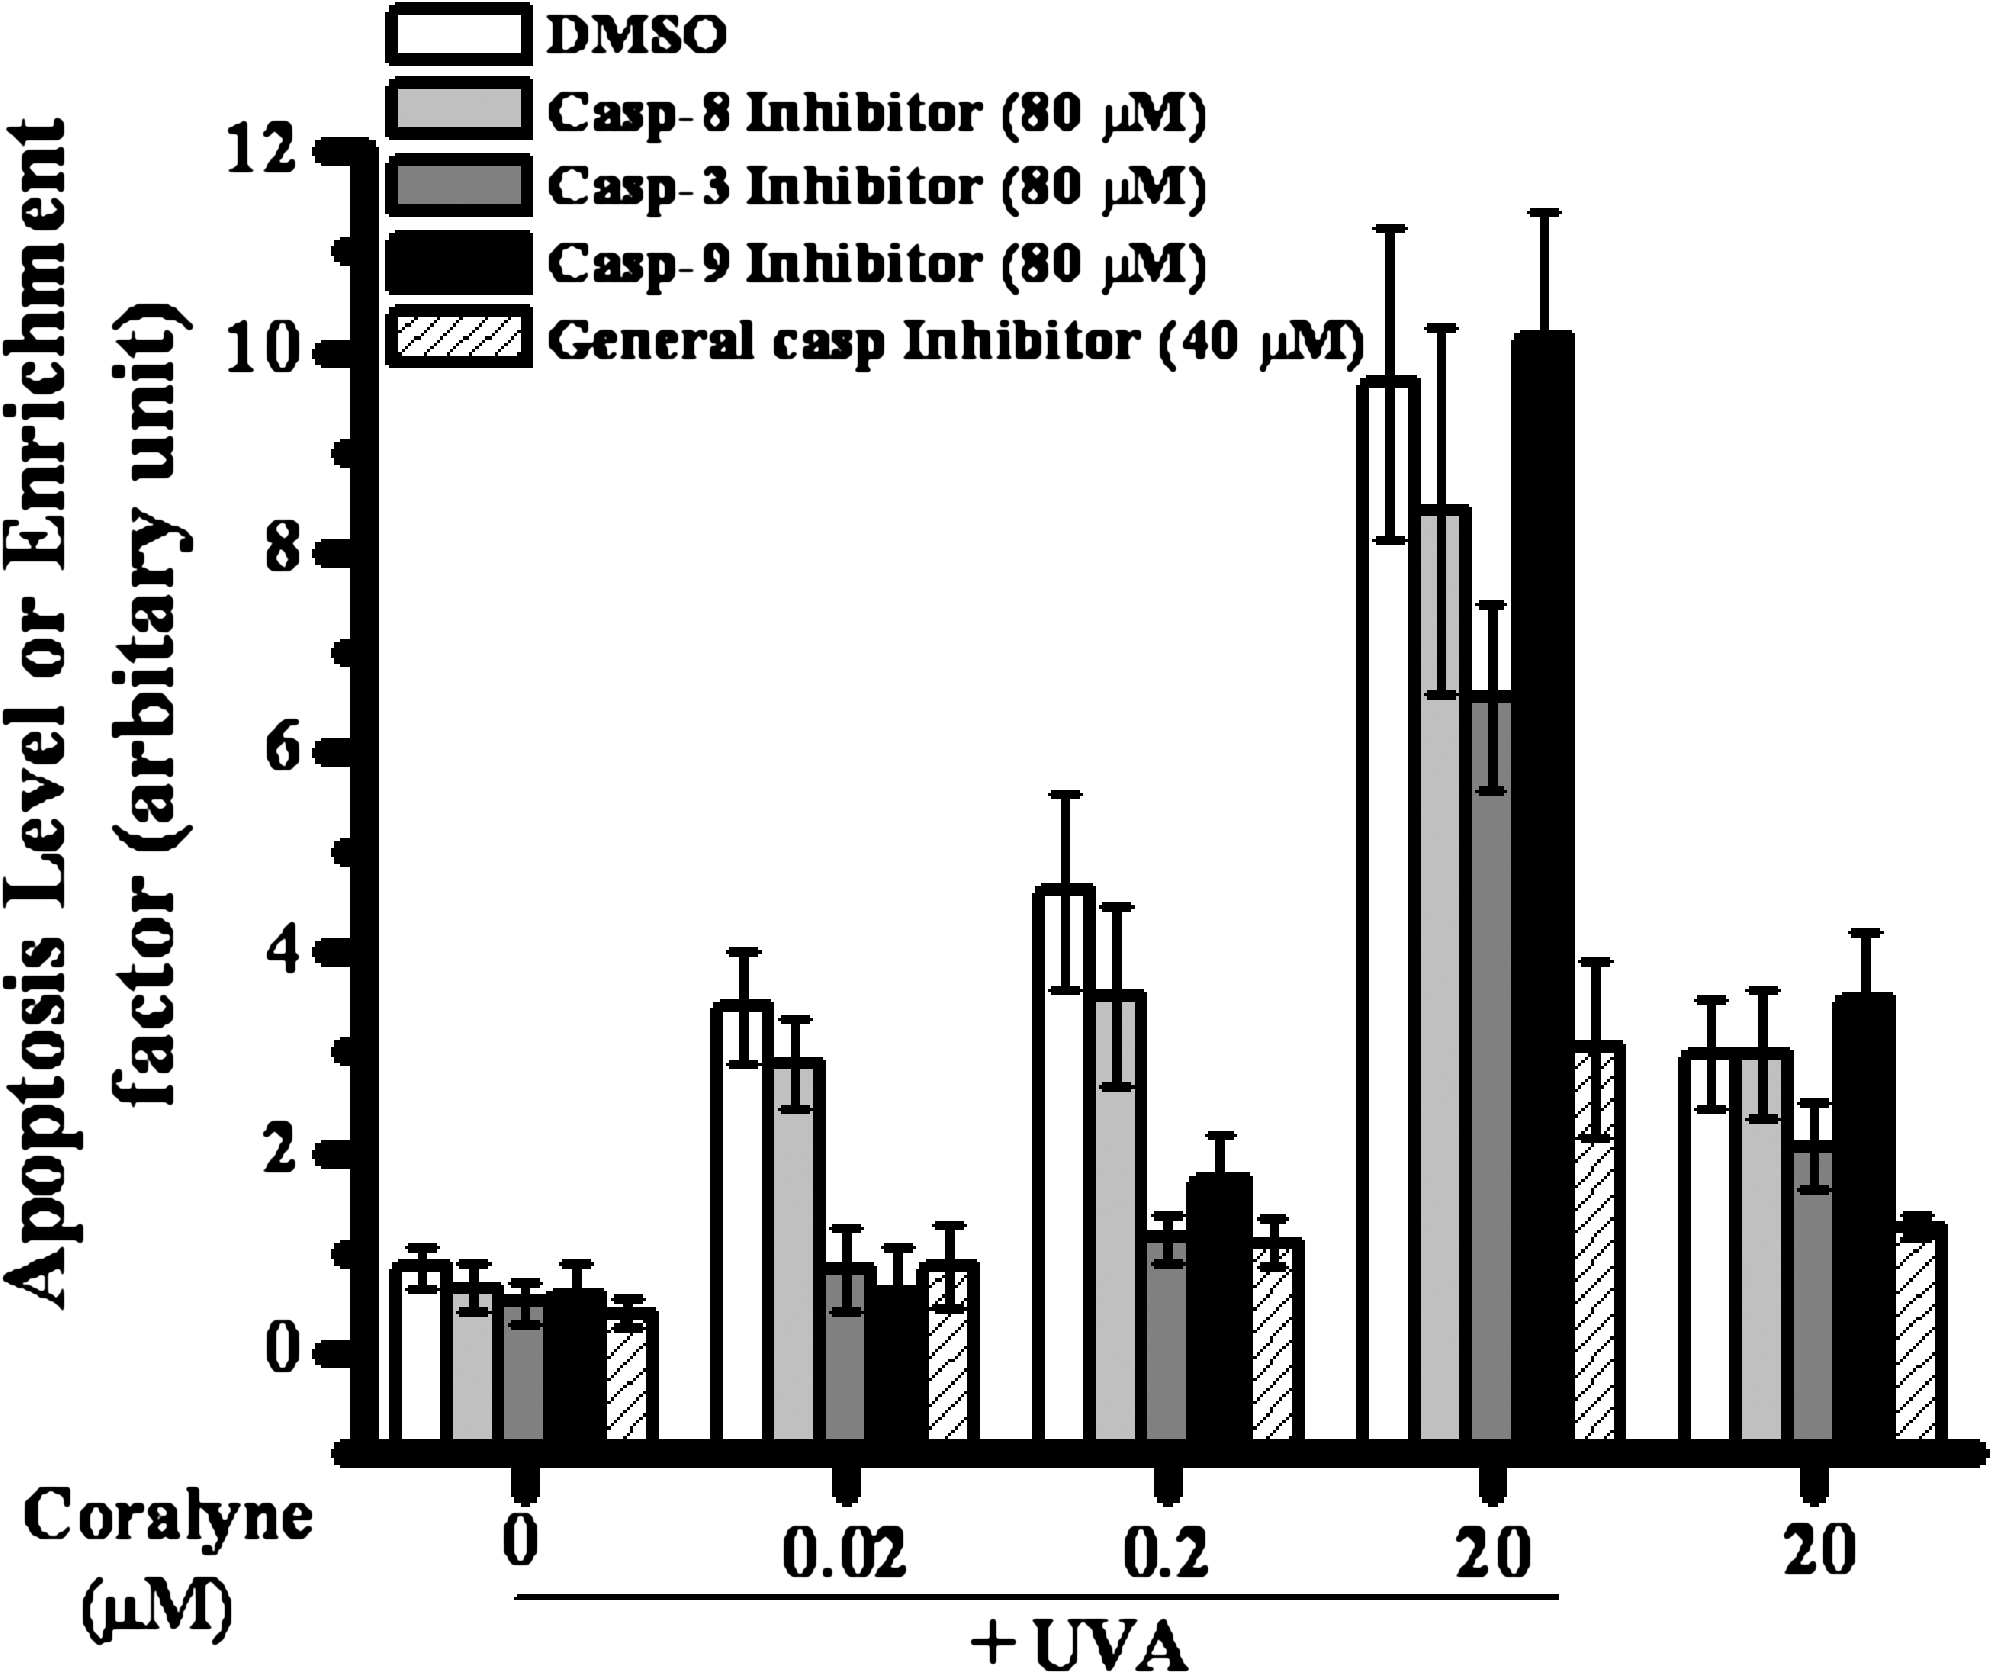
For further confirmation of apoptosis in the CUVA-mediated death of A549 cells, the effect of specific caspase inhibitors or a general caspase inhibitor on the frequency of apoptosis (Fig. 8) was monitored 24 h after treating the cells with coralyne or CUVA. For this, the highest nontoxic concentrations of the specific caspases inhibitors (80 μM) and general caspase inhibitor (40 μM) were used. Previously, similar concentrations of caspase inhibitors were used for A549 cells by several groups for this type of study (20, 37). The specific caspase-3 and caspase-9 inhibitors almost completely inhibited the CUVA-induced apoptosis at the lower concentrations (0.02 and 0.2 μM) of coralyne. However, the CUVA-induced apoptosis observed with 20 μM coralyne was partially (about 21%) abrogated by the caspase-9 inhibitor, but not by the caspase-3 inhibitor. This correlates with the observation that CUVA treatment (20 μM coralyne) activated caspase-9, but not caspase-3. In contrast, the caspase-8 inhibitor resulted in only a partial (about 11 to 20%) inhibition of the CUVA-induced apoptosis at all the test concentrations (0.02, 0.2, and 20 μM) of coralyne. Interestingly, the general caspase inhibitor (Z-DEVD-FMK) was more effective than the specific inhibitors in protecting A549 cells against the CUVA-induced apoptosis, irrespective of the coralyne concentrations. As mentioned earlier, coralyne alone could induce appreciable apoptosis in the A549 cells only at a concentration of 20 μM. This was partially inhibited by the caspase-3 and general caspase inhibitors, but not by the caspase-8 and caspase-9 inhibitors. Collectively, the results suggest that caspase-3 and caspase-9 play critical roles at lower coralyne concentration (0.02 and 0.2 μM) of the CUVA treatment. At a higher concentration of coralyne (20 μM), several caspases including caspases-3, -8, and -9 are activated through multiple and mostly independent pathways in the CUVA-induced apoptosis in the A549 cells.
DNA damage is the initial key event of apoptosis induction
The involvement of DNA SSB formation in the CUVA-induced apoptosis was studied with the comet assay. Treatment of the A549 cells with coralyne or UVA alone did not result in significant numbers of comet tails, which were observed immediately at 0 h in the CUVA-treated cells. The Olive comet tails moments increased progressively with the increase in the coralyne concentrations (0.02, 0.2, and 20 μM) in the CUVA treatment (Fig. 9A).
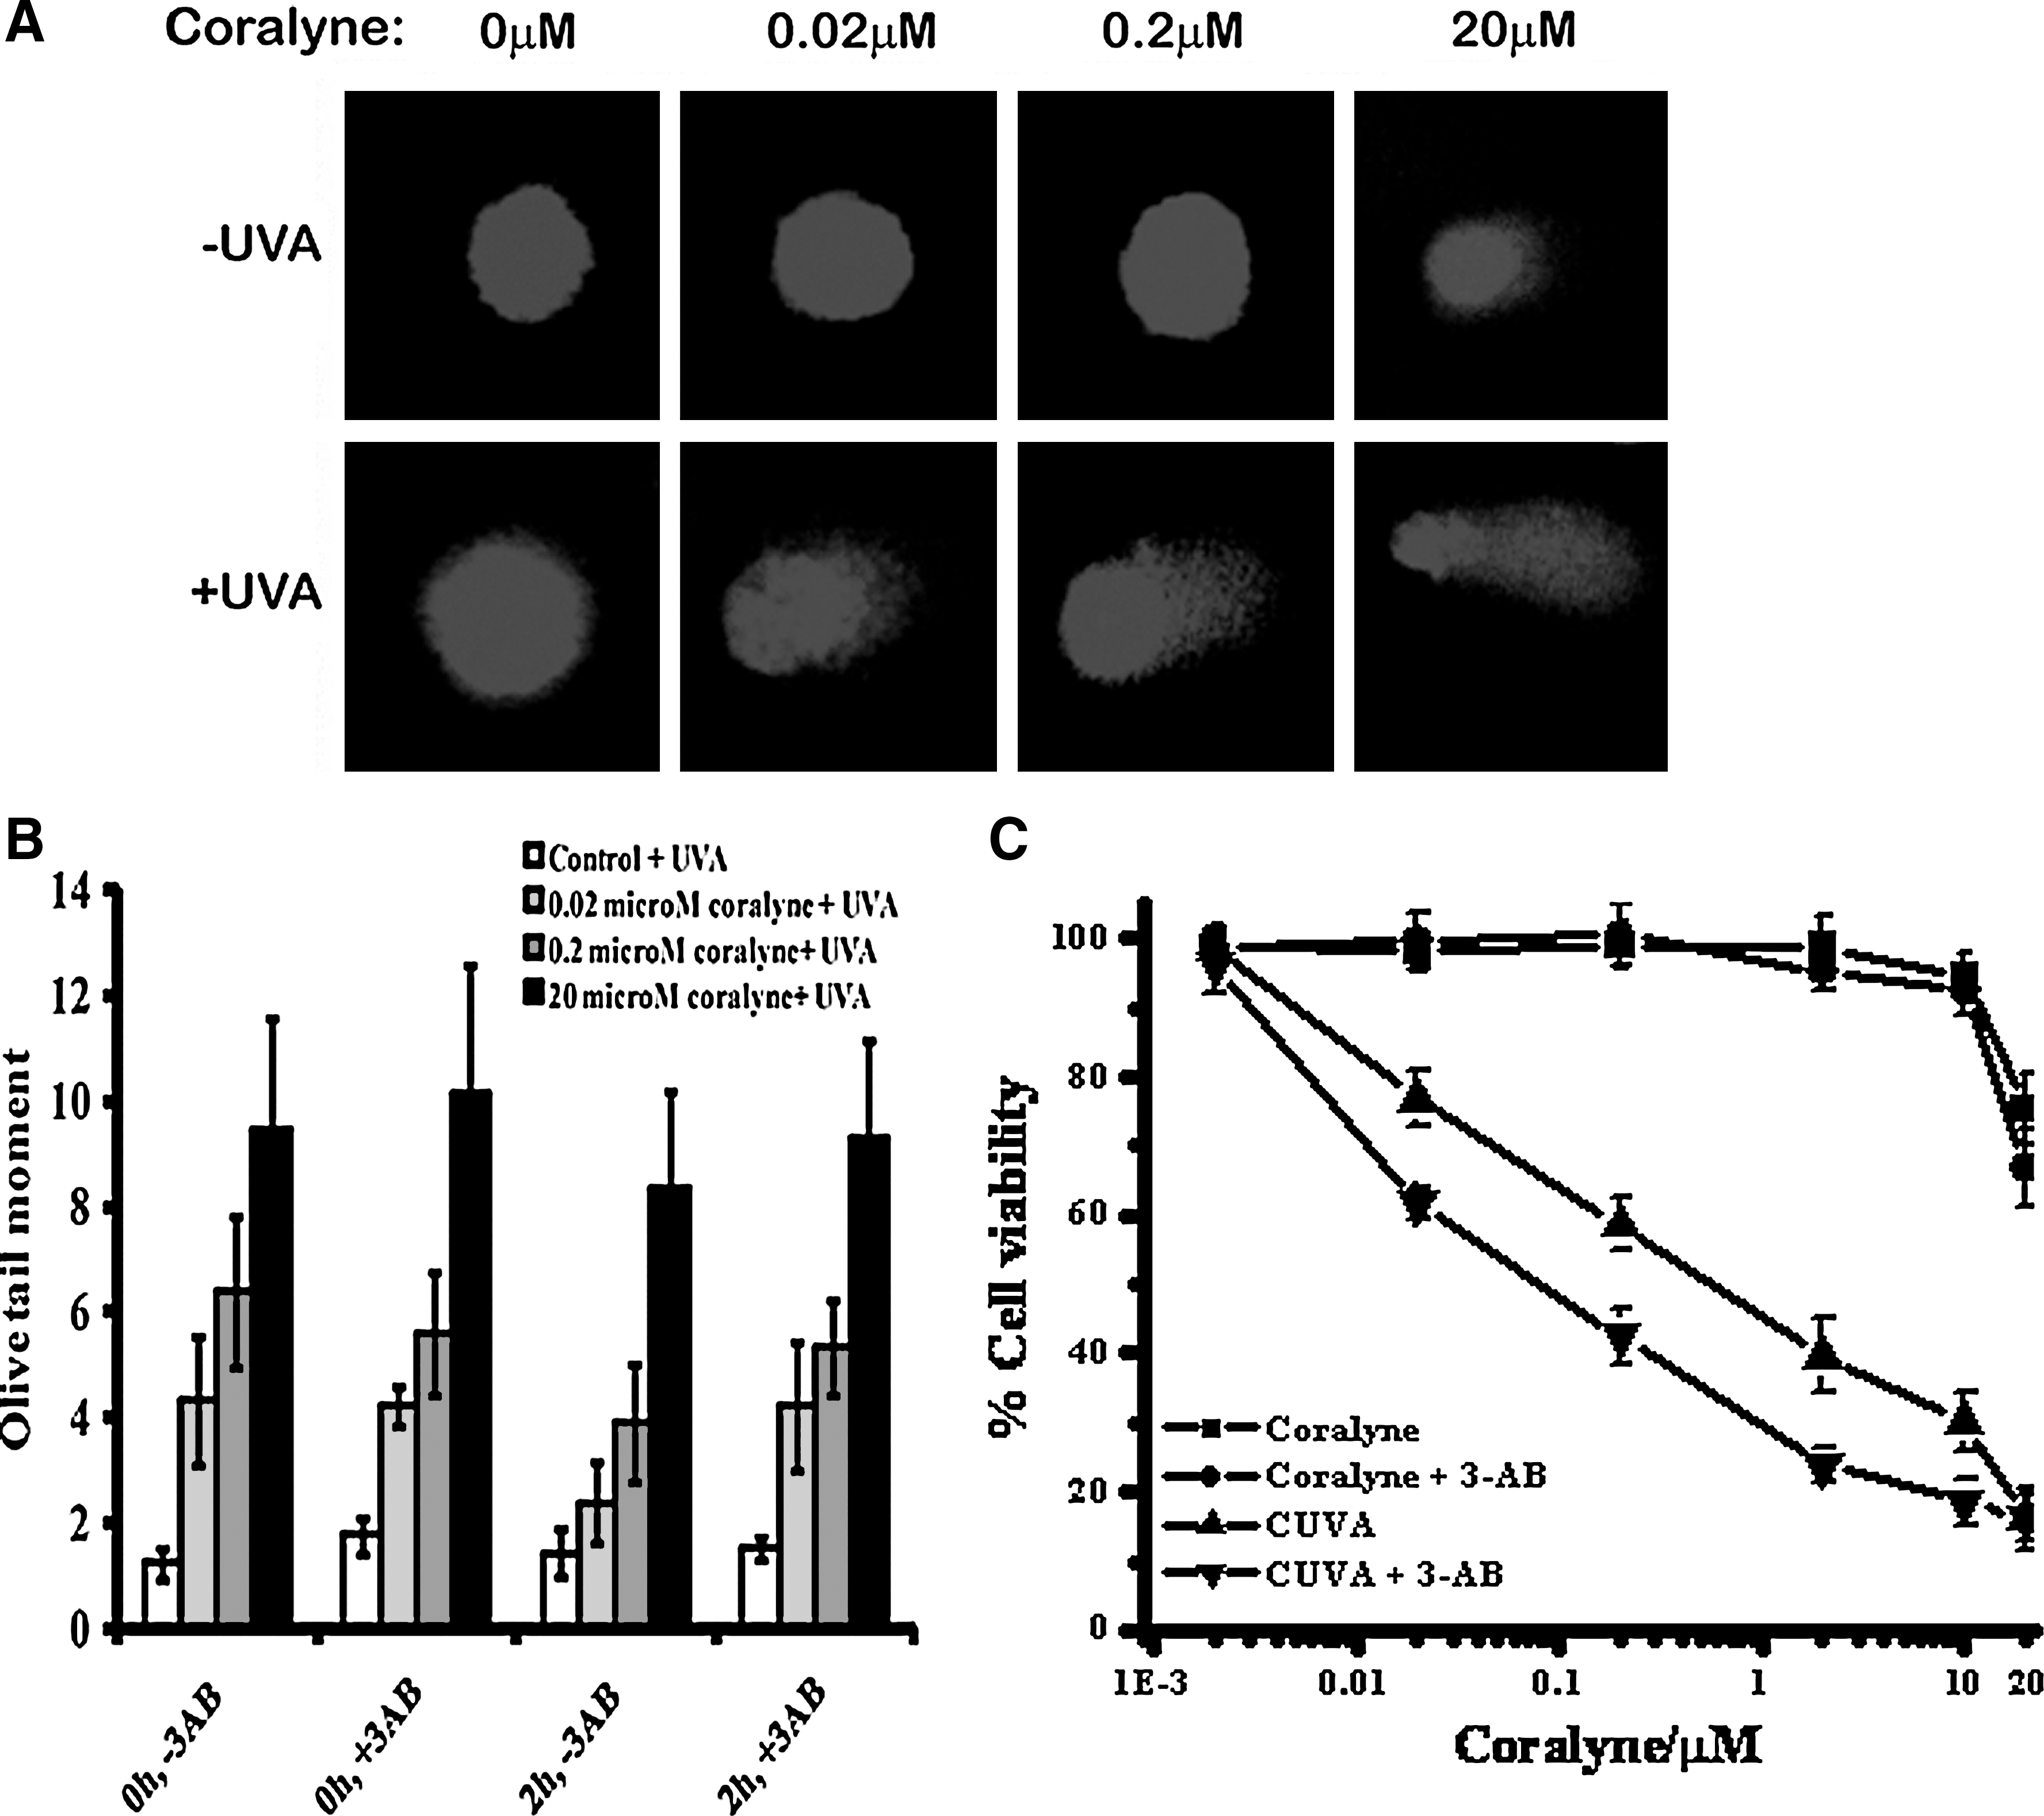
The DNA-repair response plays a pivotal role in recovering cells from the DNA damage–induced apoptosis. The conserved nuclear protein, PARP-1, a principal member of a family of DNA-repair enzymes, binds rapidly and directly to both single- and double-strand breaks. PARP-1 inhibition by compounds like 3-aminobenzidine (3-AB) and 4-amino-1,8-naphthalimide (ANI) have been reported to increase the sensitivity of various DNA damage–inducing factors (28, 44). Hence, the possible role of PARP-1 was investigated by studying the effect of 3-AB on CUVA treatment. 3-AB (4 mM), by itself, did not lead to any DNA damage or apoptosis in the A549 cells. However, compared with the untreated cells, a significant amount of DNA damage was still retained in the 3-AB (4 mM)-treated cells after 2 h of the CUVA treatment (Fig. 9B). In correlation with the DNA-damage results, the CUVA treatment also led to more viability loss in the 3-AB–treated A549 cells than those untreated (Fig. 9C).
CUVA treatment elicits S-phase checkpoint response, and its abrogation by chemical inhibitor or shRNA leads to CUVA-resistance DNA synthesis
Next we investigated whether the CUVA-induced DNA damage results in elicitation of S-phase checkpoints for DNA repair. For this, we measured [3H]thymidine incorporation during DNA synthesis soon after the CUVA treatment in the A549 cells. Treatment with coralyne (0.02 and 0.2 μM) induces a marginal increase in S-phase arrest in the A549 cells up to 2 h. However, when the cells were treated with coralyne (20 μM), the DNA synthesis ([3H]thymidine incorporation) was reduced to about 71% and 66% after 1 h and 2 h, respectively, compared with the untreated cells. In comparison, reduction of the DNA synthesis in the CUVA-treated A549 cells was significantly more even at the lower concentrations of coralyne. At 0.02, 0.2, and 20 μM coralyne, the CUVA treatment reduced DNA synthesis to about 80, 61, and 35% at 1 h, compared with the untreated cells. The corresponding values at 2 h were about 75, 51, and 33%, respectively (Fig. 10A).
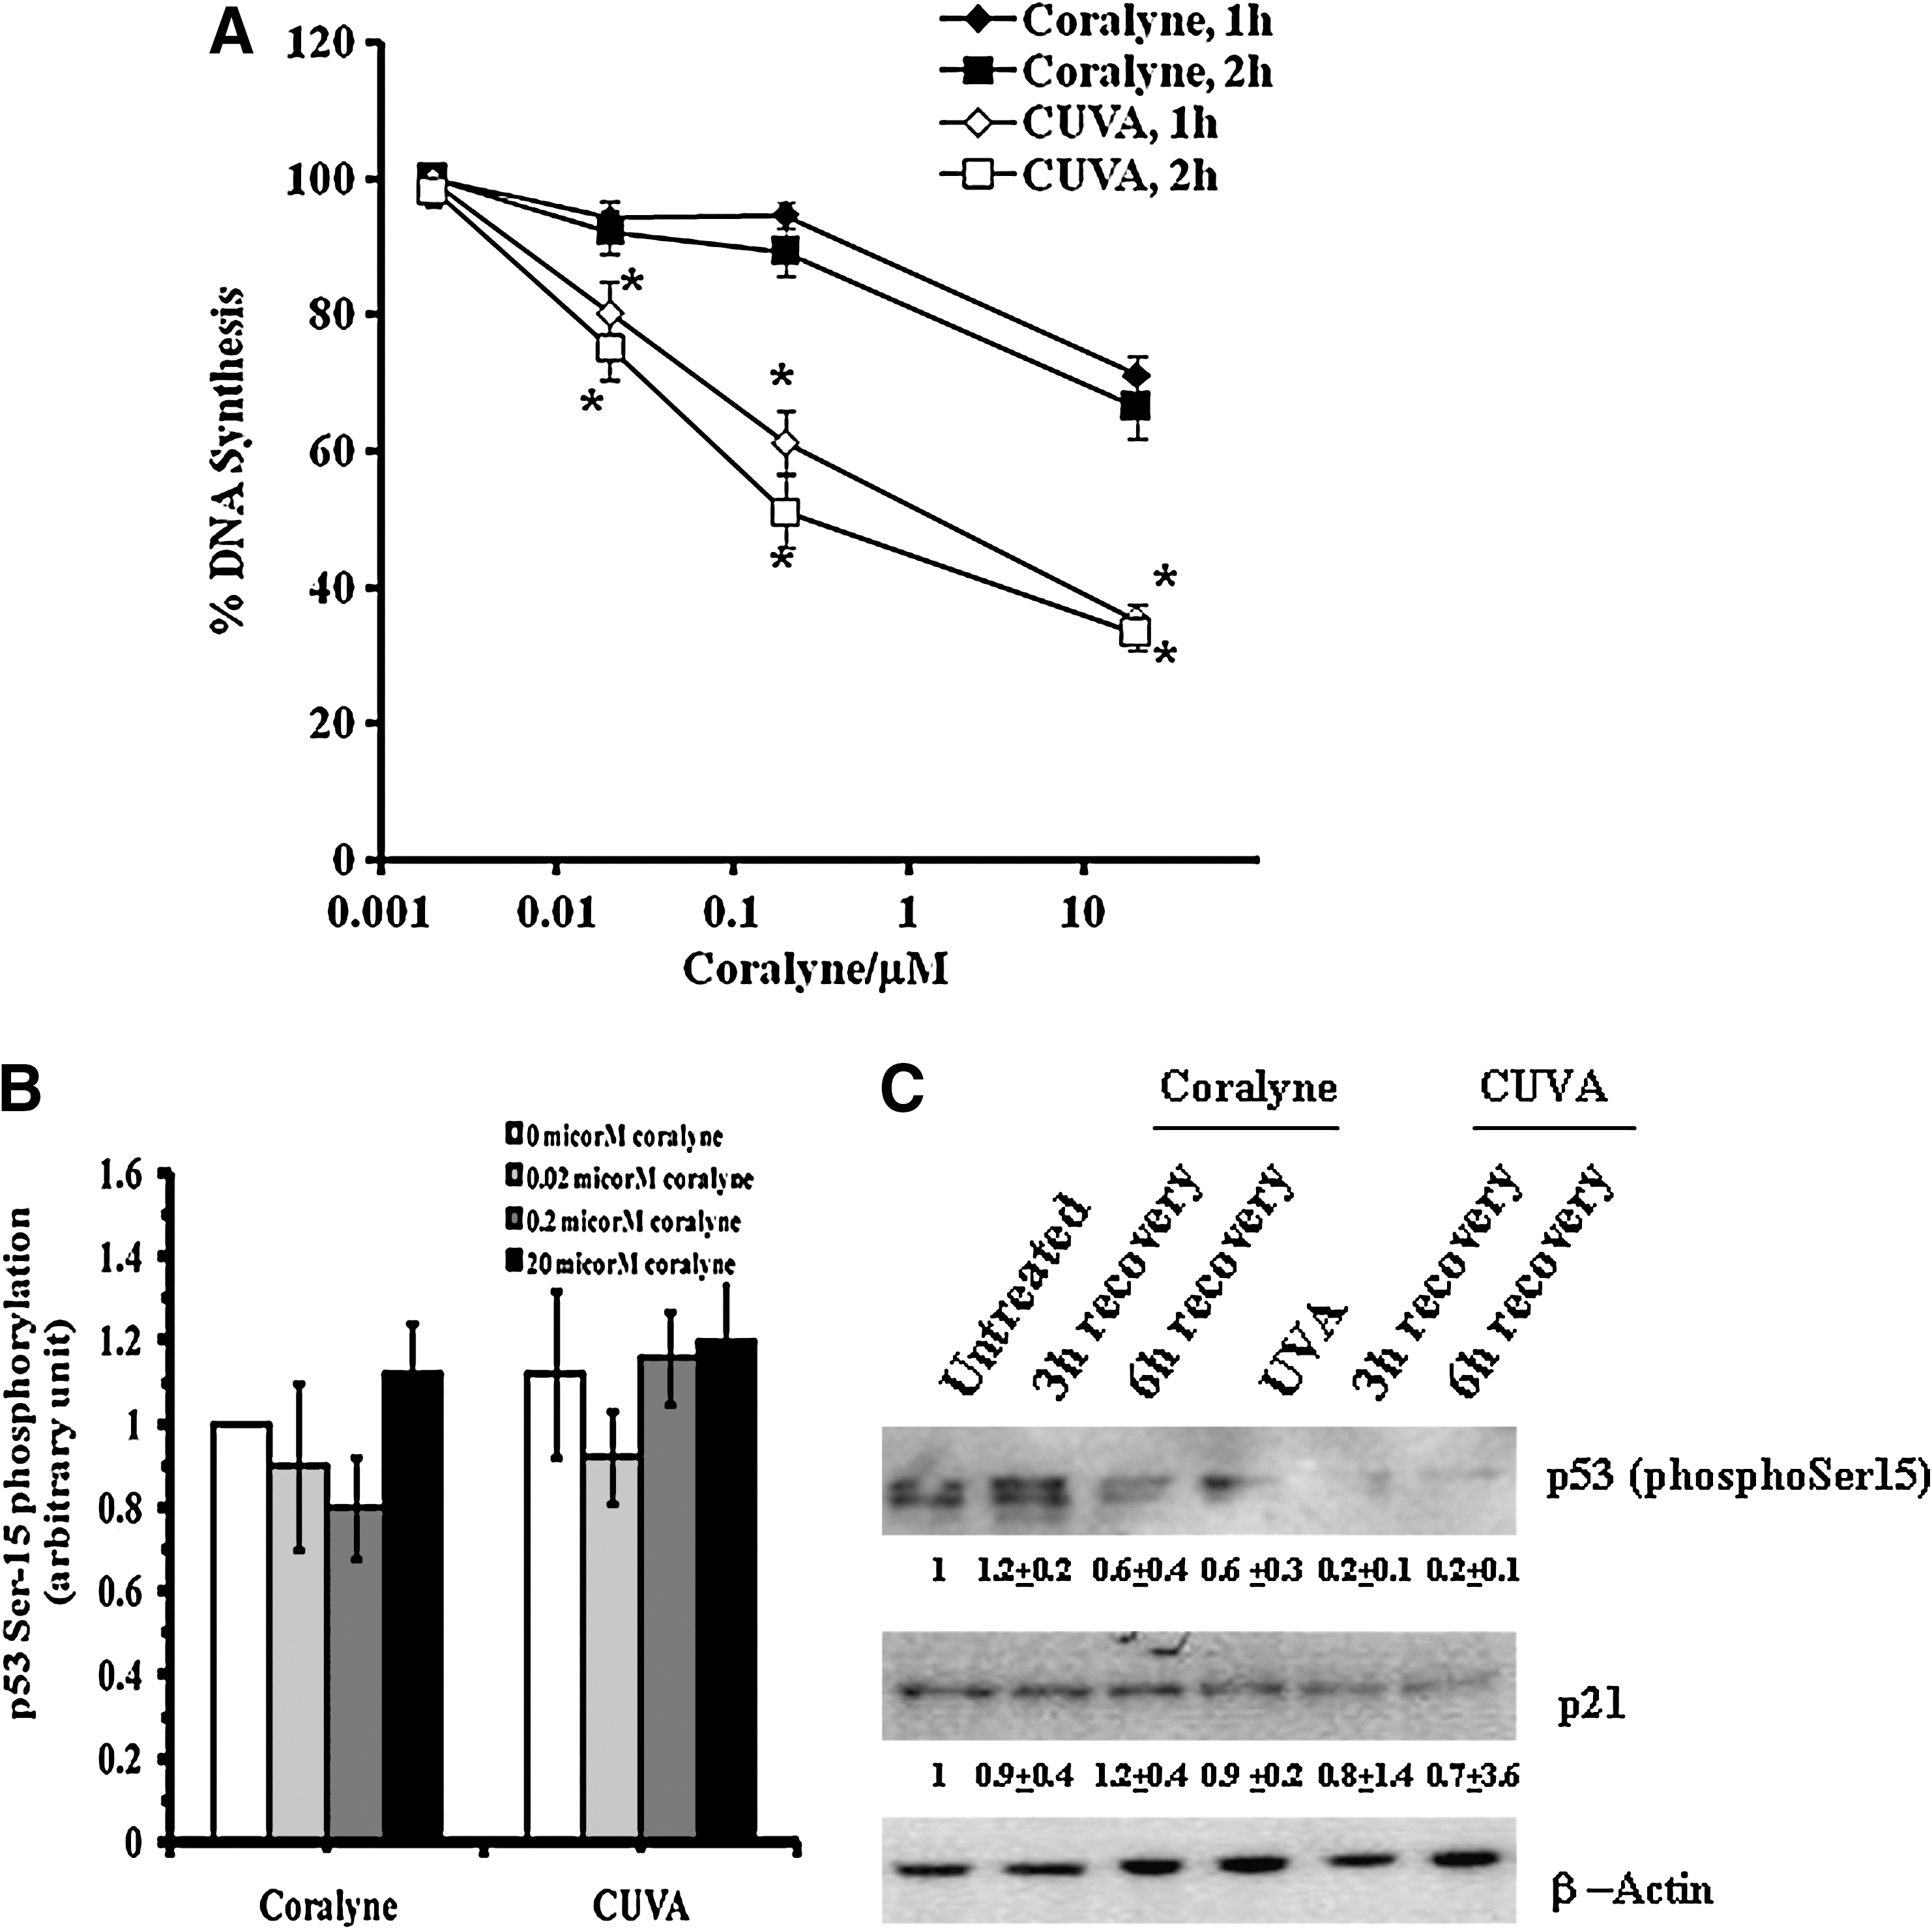
For confirming the intra–S-phase arrest as a direct effect of the CUVA rather an indirect and eventual S-phase arrest through sequential activation of p53-p53ser15-p21–mediated G1 arrest, we monitored DNA synthesis in A549-p53 (p53 silenced) and MDA-MB-231 (p53 mutated) cells, immediately (1 h) after the CUVA treatment. These showed results similar to that of the A549 cells (data not shown). No detectable increase in p53 phosphorylation at serine-15 and its downstream target, p21, were observed in the CUVA-treated A549 cells (Fig. 10B and C). Thus, the CUVA treatment arrested the DNA synthesis even in the cells devoid of p53 protein, suggesting its direct role in S-phase arrest without affecting the G1-phase progress.
Subsequently, the role of CUVA in inducing direct intra–S-phase arrest was probed. Because ATM and ATR kinases play critical roles in inducing intra–S-phase arrest in response to various DNA-damaging agents, we were further interested in knowing the role of ATM or ATR or both in CUVA-induced S-phase arrest. For this, ATM autophosphorylation and Chk2 phosphorylation were checked as a measure of ATM activation. ATR activation was monitored by measuring ATR-specific phosphorylation of Chk1. In response to coralyne (0.2 μM) treatment, the ATM autophosphorylation level increased to 1.3, 1.7, and 1.9 fold after 2 h, 4 h, and 6 h recovery (Fig. 11A). In contrast, CUVA treatment at the same concentration of coralyne caused 3.4-, 2.9-, and 2.7-fold increase in ATM autophosphorylation (Fig. 11A). Similar to these results, Chk2 phosphorylation was also greater in CUVA treatment vis-à-vis coralyne-alone treatment (Fig. 11A). Interestingly, although ATR-specific phosphorylation of Chk1 remained unaltered in response to coralyne or CUVA treatment (coralyne, 0.2 μM), the positive control CPT induced ATR-mediated Chk1 phosphorylation (Fig. 11B). These results suggest that the ATM-Chk2 pathway might be critical for the CUVA-induced S-phase arrest.
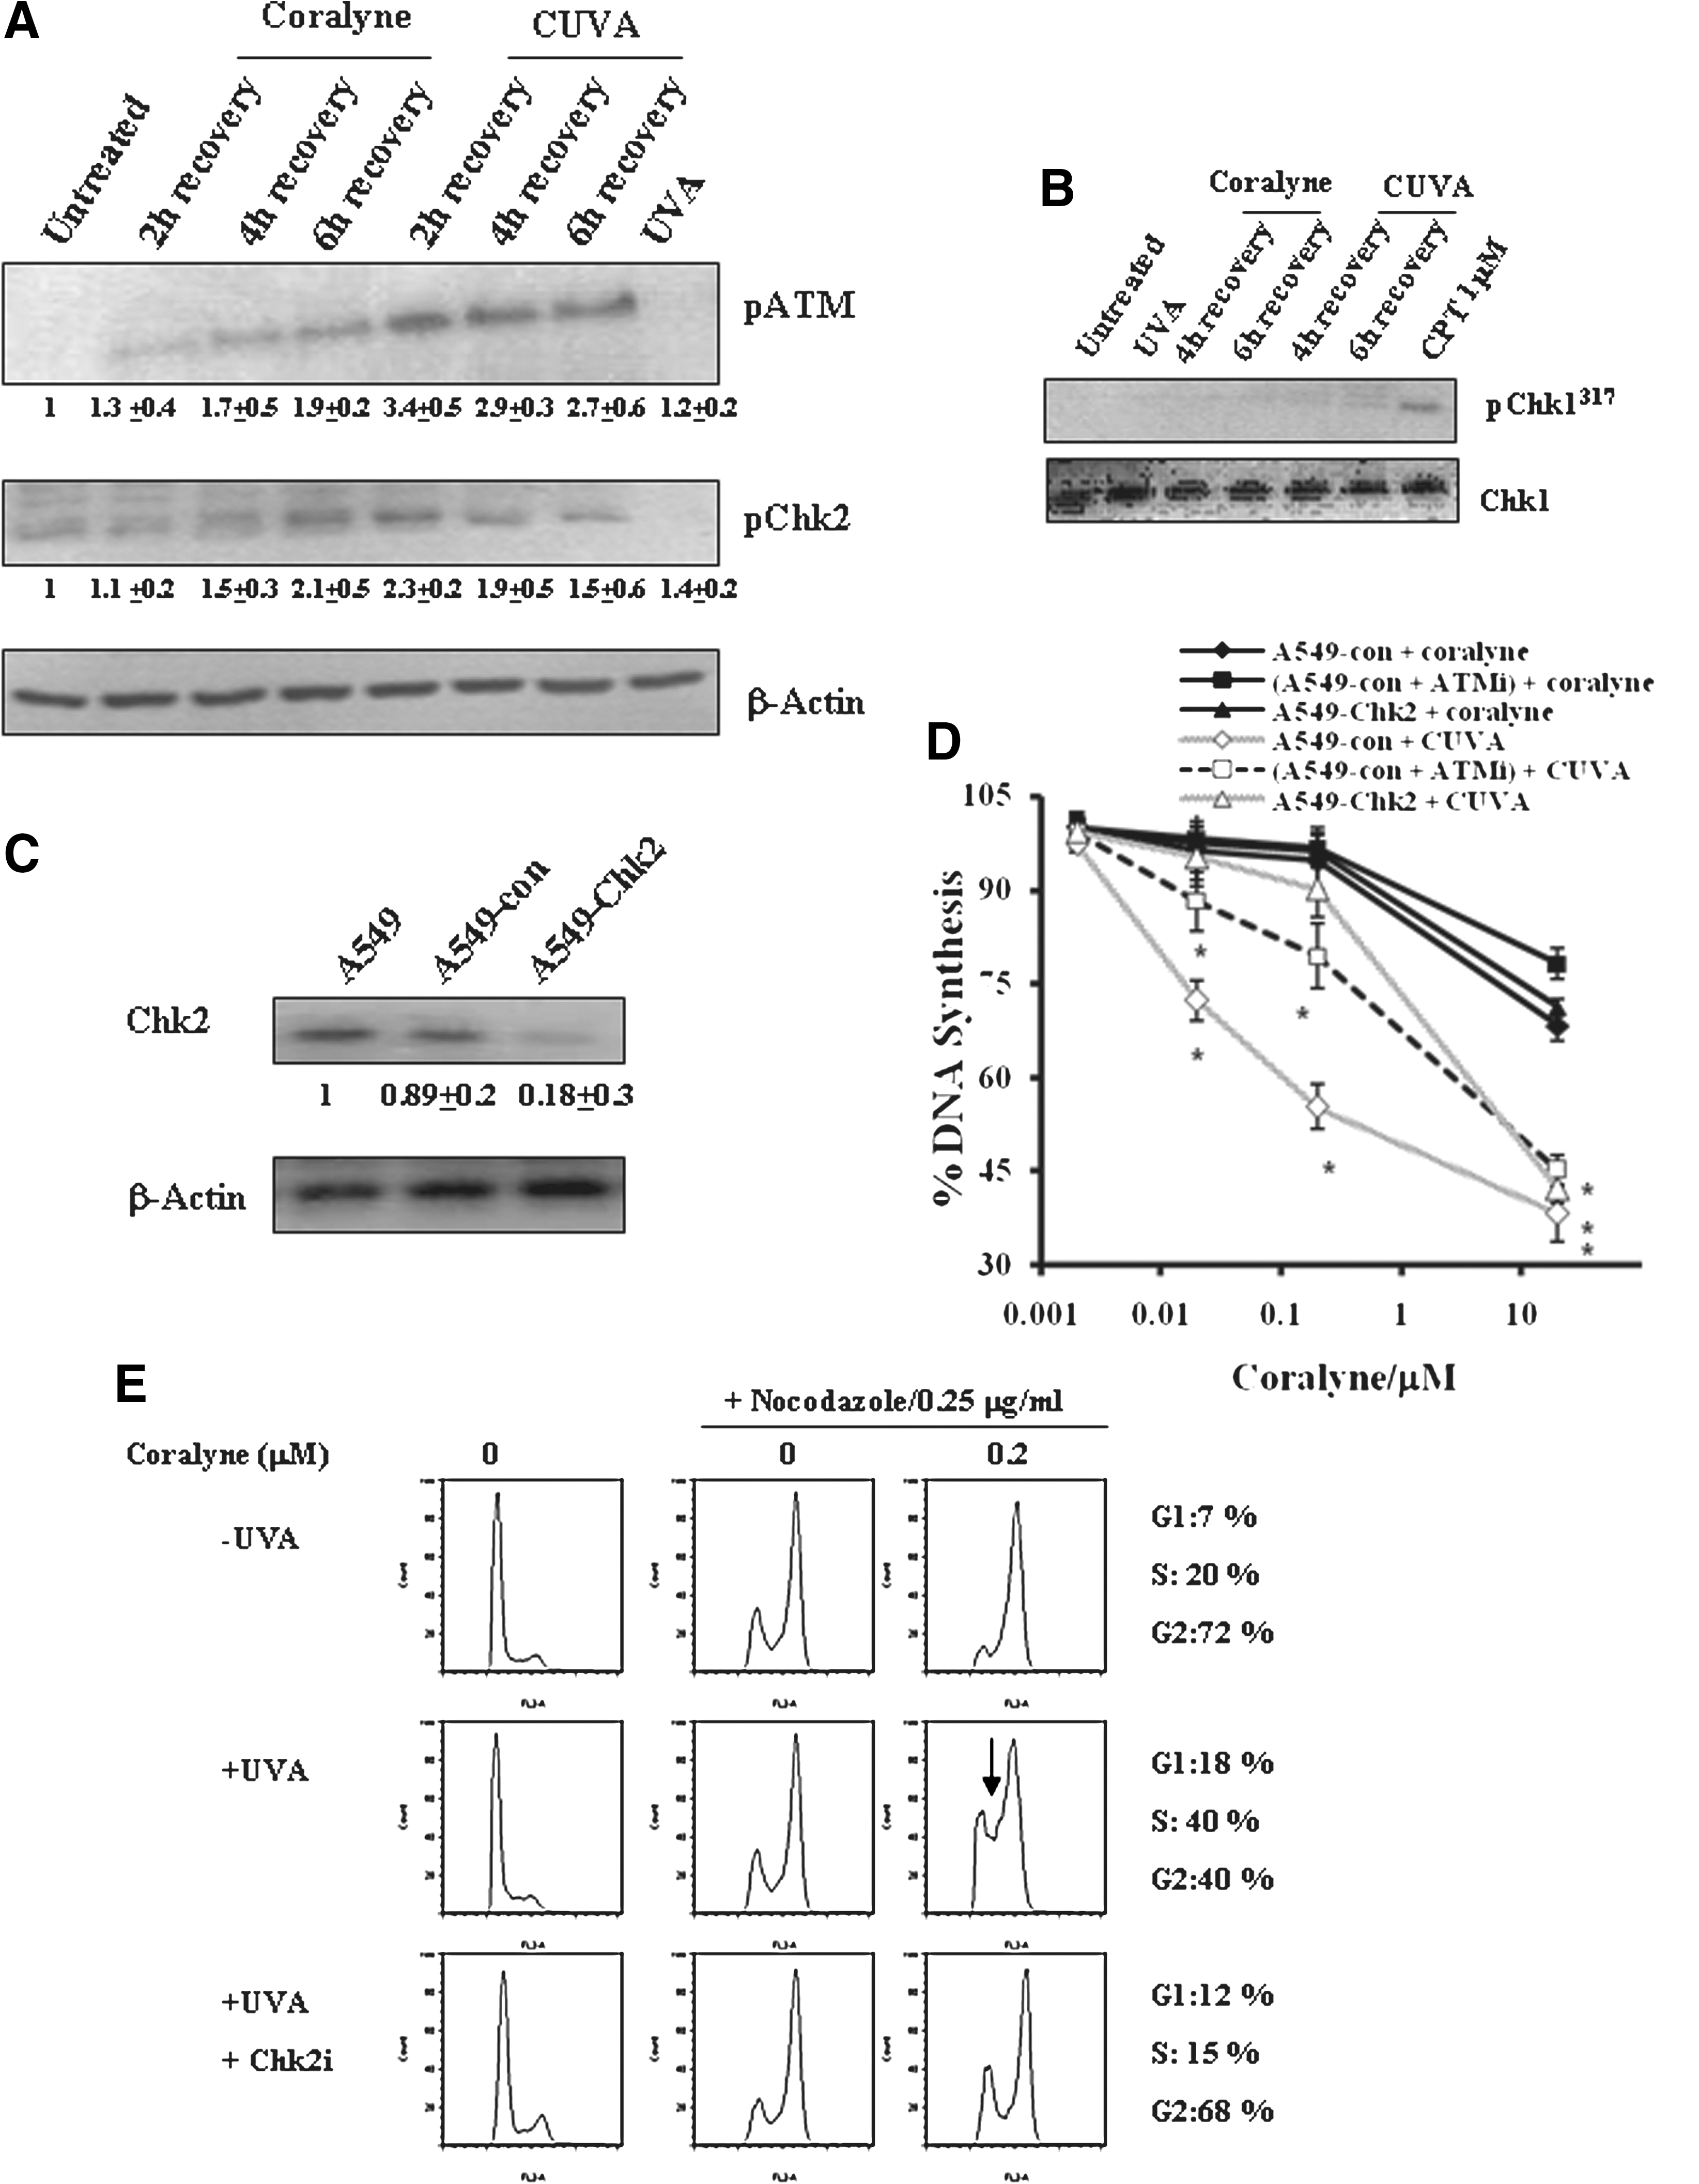
To ascertain the role of ATM-Chk2 in the CUVA-induced S-phase arrest, A549 cells were treated with ATM-specific inhibitor (ATMi) to reduce the ATM function, or the Chk2 expression was knocked down, and the DNA synthesis in these cells was assessed. For Chk2 silencing, the A549 cells were stably transfected with either the negative control vector or Chk2 shRNA-expressing vector (Fig. 11C). The A549 cells that express antisense Chk2 or scrambled negative control product are designated A549-Chk2 or A549-con cells throughout this report. Western blot experiments showed about 82% depletion of Chk2 protein in the clones of A549-Chk2 cells (selected by G418) compared with that in the parental as well as A549-con cells (Fig. 11C). At the lower concentrations (0.02 and 0.2 μM) of coralyne, the CUVA treatment led to considerable S-phase arrest in the A549-con cells (Fig. 11D), as was observed with A549 cells (Fig. 10A). In contrast, a significant reduction in S-phase arrest was observed in the ATMi-treated and A549-Chk2 cells, under similar conditions (Fig. 11D). Instead, CUVA-resistant DNA synthesis (CUVADS) was observed in these cells (Fig. 11D). This indicated that Chk2 or ATM downregulation enabled the A549 cells to progress through the S phase and to synthesize DNA in response to the CUVA treatment. However, the intra–S-phase arrest, induced by the CUVA treatment at higher concentration of coralyne (20 μM) was not recovered in the ATMi-treated A549-con or A549-Chk2 cells (Fig. 11D). Overall, the CUVA-induced S-phase arrest is ATM and Chk2 dependent at the lower concentrations of coralyne (0.02 and 0.2 μM), and independent at its higher concentration (20 μM).
Further to confirm the CUVA-induced S-phase arrest, we analyzed the cell-cycle profile of A549 cells with flow cytometry. For this, cells were also treated with nocodazole to collect all the cells in the G2/M phase. This treatment is specifically helpful to monitor S-phase progress in one cell-cycle time (49). In the absence or presence of coralyne (0.2 μM), nocodazole treatment (24 h) did not alter the progress of A549 cells through the S phase (Fig. 11E). However, a significant number of cells were arrested in S phase with CUVA treatment (40.0 + 7.64%) compared with that (20.32 + 5.64%) with coralyne-alone treatment, both with 0.2 μM coralyne (Fig. 11E). Further, Chk2 inhibition by Chk2i led the cells to escape from the CUVA-induced S-phase checkpoint (Fig. 11E). These observations conclusively proved that Chk2 plays an important role in CUVA-induced S-phase arrest.
Depletion of Chk2 Protein Results in Enhanced Apoptosis in A549 Cells
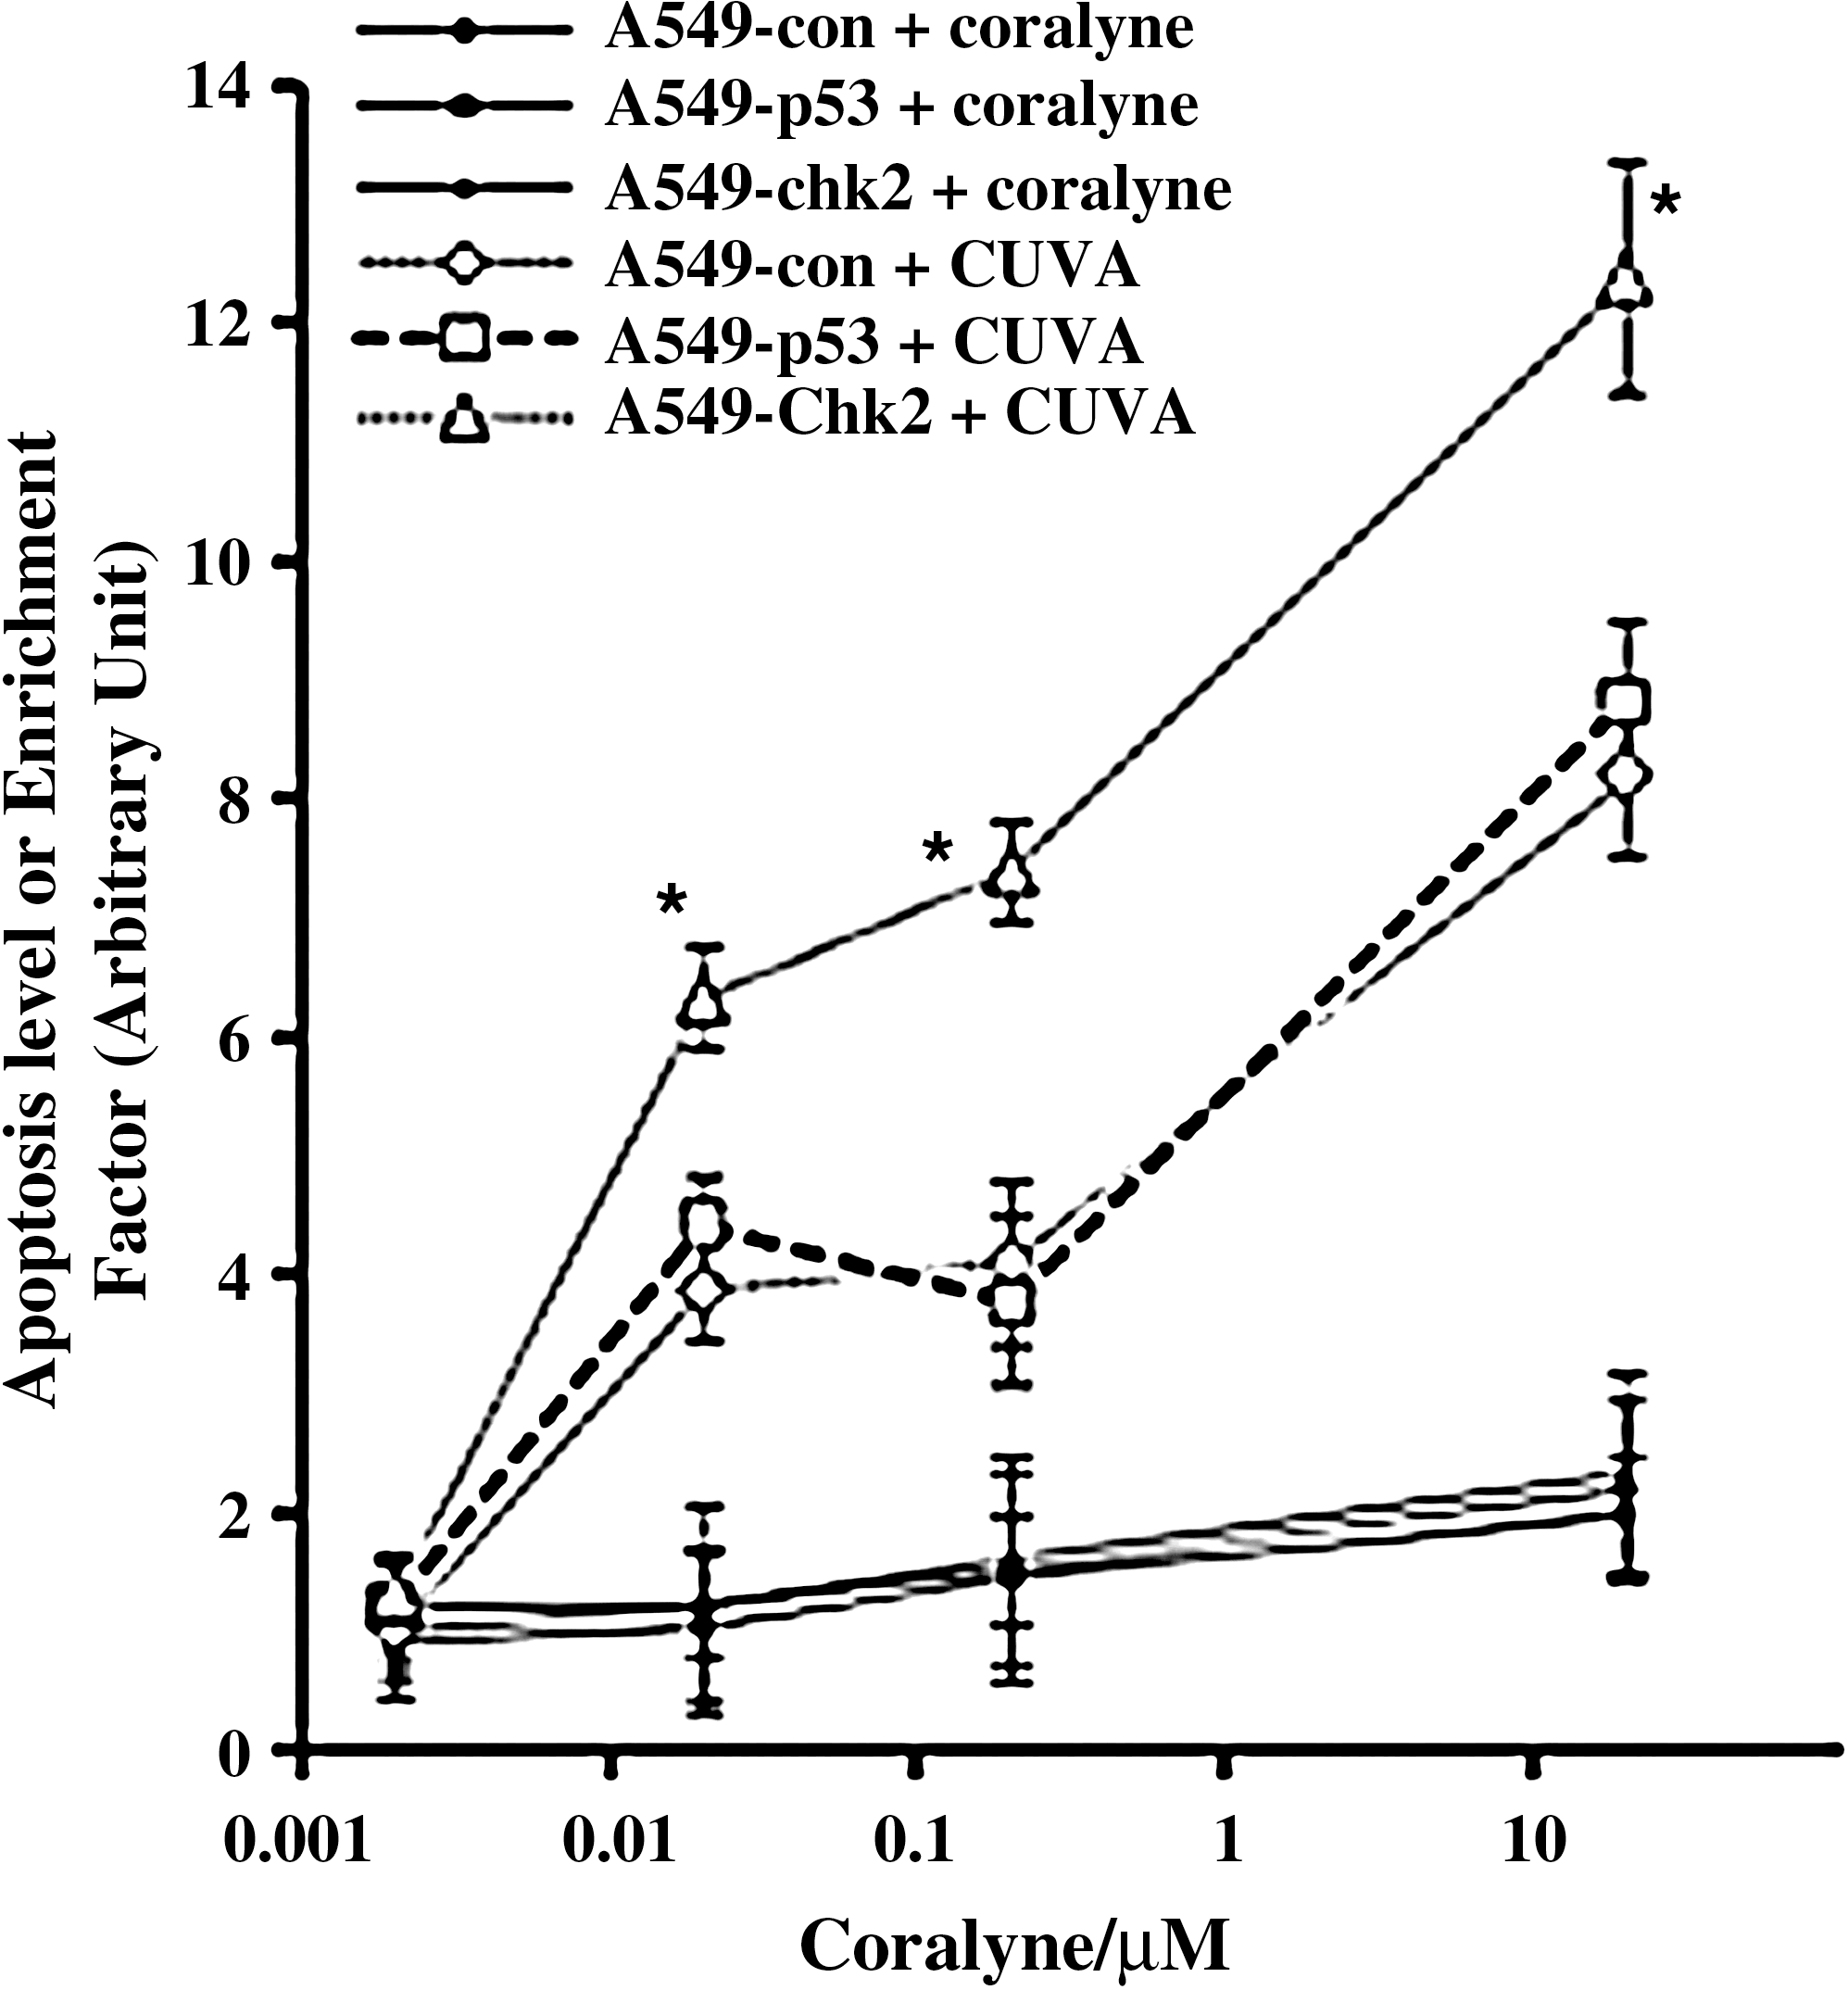
Since loss of checkpoints in cells harboring DNA damage can lead to increased cell death (49), the A549-con, A549-p53 and A549-Chk2 cells were subjected to treatment with coralyne alone or CUVA, and the apoptosis was measured after 24 h. The results showed no significant difference in the coralyne-induced apoptosis in the designated cells. Interestingly, when the cells were treated with CUVA, at 0, 0.002, 0.02, 0.2, and 20 μM coralyne, silencing of Chk2 led to a significant increase in the apoptosis in the A549-Chk2 cells vis-à-vis the A549-con and A549-p53 cells (Fig. 12). Taken together, all these results confirmed that the Chk2 protein plays a major role in the CUVA-mediated killing of the A549 cells.
Discussion
The p53 protein is known to be responsible for apoptosis triggered by oncogenes, ionizing radiation, and certain anticancer drugs (39). Patients who have tumors with p53 mutations often have a worse prognosis than do those who have tumors with wild-type p53 (27), resulting in drug resistance (1, 4, 16, 23). Thus, sensitizing cancer cells through the p53-independent pathway is of fundamental importance. Here, we studied the efficacy of CUVA in killing cancer cells both through p53-dependent and -independent pathways, and rationalized its photosensitizing and cytotoxic properties in terms of underlying molecular signaling mechanisms.
With regard to the anticancer property of CUVA, our results with two p53 wild-type and two p53 mutant carcinoma cells established its significantly enhanced cell-killing ability compared with coralyne or UVA treatment alone (Fig. 2). Our initial results, with the p53 mutant (MDA-MB-231 cells) apparently indicated better sensitivity of CUVA toward the p53 wild-type cells. However, the efficacy of the CUVA treatment for the p53 wild-type cells (A549 and MCF7) was only marginally (1.5- to 2.5-fold) better than that for the MDA-MB-231 cells. The poor result with the A431 cells may be due to a low cellular uptake of coralyne. This was also substantiated by the fact that the CUVA treatment caused almost equal and extensive viability loss (Fig. 5D) in both A549 and A549-p53 cells (with 70% less p53 expression than A549 cells), and also reduced the reproductive potential of the A549-con and A549-p53 (p53 silenced) almost equally (Fig. 4B and C). The superiority of CUVA over PUVA was also evident from our results with A549 (p53 wild-type) and MDA-MB-231 (p53 mutated) cells (Fig. 3A and B). However, given that CUVA increased the p53 expression in all the different A549 cells, its partial role in the modulation of the CUVA-induced cell death could not be excluded.
Many studies have demonstrated that apoptosis induction plays the most vital role in cancer treatment with chemotherapy and radiation therapy (13). Hence, we established the involvement of an apoptotic pathway in the CUVA-mediated killing of the A549 cells by the histone-release assay. It is well known that activation of caspases is instrumental in programmed cell death (3). The caspase cascade is initiated by the proteolysis of inactive procaspases and propagated by the cleavage of downstream caspases and substrates, such as PARP (17). Caspase-9 is a member of the CED-3 family and bears high similarity to caspase-3, one of the key executors of apoptosis. Cleavage of procaspase-3 by caspase-9 produces an active enzyme that is capable of cleaving PARP. PARP is a chromatin-bound enzyme that, on activation by DNA-strand breaks, catalyzes the successive transfer of ADP-ribose units from NAD to nuclear proteins. Cleavage of PARP results in its inactivation, thereby slowing the DNA-repair process and enhancing apoptosis.
Our results showed that the CUVA-induced apoptosis, at the lower concentrations of coralyne (up to 0.2 μM), was controlled through activation of caspase-3 and caspase-9, with minimal effect from caspase-8. This excluded the operation of a Fas-mediated pathway. Our immunoblots, showing reduced levels of pro-caspase-3 and pro-caspase-9 due to CUVA treatment, were concurrent with the increased activities of the respective caspases (the protein activation is represented by the loss of its pro-form). The cleavage of PARP protein by CUVA also confirmed caspase-3 activation, as PARP is a substrate of caspase-3. Apparently, CUVA first enhances caspase-9 activity in the early apoptotic cascade, which then stimulates the proteolytic activity of other downstream caspases, including caspase-3 (Fig. 7). This, in turn, leads to the cleavage of numerous proteins, including PARP-1. The cleaved product of PARP-1 would enhance the apoptosis process. Although CUVA treatment led to a reduced level of pro-caspase-8 and activation of caspase-8, this may not play a central role in the cytotoxicity of CUVA. Our apoptosis data in the presence of different caspase inhibitors (Fig. 8) also support this. The cytotoxicity of CUVA with coralyne (20 μM) was too high and may involve multiple pathways also involving other caspases. This was evident from the activation of caspase-8 and also the redundancy of the specific caspase inhibitors under this condition.
To address the question of the p53-independent mechanism in the CUVA-induced apoptotic pathway, we envisaged a putative role of in vivo DNA photodamage by CUVA. This initial photo event may accumulate DNA lesions, eliciting growth arrest and DNA-repair processes. Failure in the later events would lead to apoptosis. In this respect, our results showed that the CUVA treatment, at all the concentrations of coralyne, led to an instant induction of DNA damage in the A549 cancer cells (Fig. 9A). Besides, pretreatment of the A549 cells with 3-AB (a PARP-1 inhibitor) enhanced the CUVA-mediated cell death (Fig. 9B and C) compared with the untreated cells, possibly because of accumulation of DNA SSBs. These demonstrated that the CUVA treatment could induce cellular DNA lesions in cancer cells, which were not efficiently repaired. This switched the signaling to apoptosis. Cells that are damaged when they are already in the middle of DNA synthesis or replication (S phase) can still elicit intra–S-phase checkpoint signaling events for probable benefit from halting or slowing DNA replication until the damage has been repaired (23). Although the G1 checkpoint also reduces DNA synthesis, the S-phase checkpoint is a distinct process (23, 40). DNA-synthesis blocks immediately after γ-irradiation is characterized as S-phase arrest, as it reflects the arrest of those cells that are already in S phase rather than an indirect S-phase arrest from the p53-p21–mediated G1 blocks (8, 24). The possibility of elicitation of intra S-phase checkpoints by CUVA was assessed with [3H]thymidine incorporation into DNA in the A549 cells soon after the CUVA treatment. Coralyne alone could reduce the DNA synthesis only at 20 μM. However, in combination with UVA, its efficacy was seen even at 1,000 times less concentration (Fig. 10A).
One of the first abnormalities to be characterized in cells from cancer-prone individuals affected with ataxia telangiectasia (AT) or Nijmegen breakage syndrome (NBS) is a failure to arrest DNA synthesis even after exposure to ionizing radiation (23, 40). This phenomenon is called “radioresistant DNA synthesis” (RDS). Several lines of evidence implicate the association of AT mutated (ATM) (30), Chk2 (14), NBS1 (25), MRE11 (42), and ATR-Chk1 (36) proteins in the intra–S-phase checkpoint pathway. Our results showed clear evidence that ATR-Chk1 has no role in the CUVA-induced S-phase arrest (Fig. 11A). In the absence of ATR-Chk1 activation, experimental evidence indicates that DNA damage activates the S-phase checkpoints through at least two parallel branches, both being regulated by ATM. It causes sequential activation of several gene products in the order of ATM-Chk2-Cdc25A or ATM-Chk2-(NBS1-MRE11-RAD50), leading to S-phase arrest (23, 40). Because ATM and Chk2 are the key proteins in both the pathways, we envisaged that abrogation of ATM or Chk2 may lead to failure in S-phase arrest, after the CUVA treatment, leading to CUVA-resistant DNA synthesis (CUVADS). Interestingly, ATM autophosphorylation and Chk2 phosphorylation were upregulated severalfold in response to CUVA treatment. Furthermore, Chk2 silencing or ATM protein inhibition resulted in CUVADS and consequent abrogation of S-phase checkpoints in response to the CUVA treatment (at 0.02 and 0.2 μM coralyne). In correlation with these observations, the cell-cycle analyses also showed that CUVA treatment induces S phase, which was defective when Chk2 was inhibited by Chk2-specific inhibitor (Fig. 11E). These results clearly suggested that the CUVA-induced DNA damage elicits S-phase checkpoints by activating the ATM-Chk2 pathway.
Several reports suggested a central role of p53 in determining the sensitivity to apoptosis only when Chk2 is functional (18, 49). Downregulation of Chk2 in cells with functional p53 exhibits resistance to apoptosis in response to DNA damage due to loss of p53 activation. However, because we did not find any change in the sensitivity of A549-p53 cells in response to CUVA (Figs. 5C and 12), this pathway could be excluded. It is generally believed that the p53-defcient cells lacking G1 arrest enter S and G2 phases with more-damaged DNA compared with the p53 wild-type cells. Thus, these cells would be dependent more on intact S and G2 checkpoints to repair DNA damage. However, if the damage is not repairable, Chk2 can activate p53-independent, but p73-dependent apoptosis in response to DNA damage (43). It is of future interest to determine whether the Chk2-mediated p73 pathway is required for CUVA-induced apoptosis.
Conversely, abrogation of S and G2 checkpoints by downregulating Chk2 or by using G2 checkpoint abrogators, such as caffeine or UCN-01, is known selectively to sensitize p53-deficient cells to radiation or chemotherapeutic agents (6, 9, 32, 38, 49). Hence, it was of interest to see the role of Chk2, if any, in the p53-independent apoptosis of A549 cells having fully functional p53. Surprisingly, we found that the CUVA treatment results in pronounced apoptosis in the A549-chk2 vis-à-vis A549-con and A549-p53 cells (Fig. 12). The results were unexpected but interesting, as A549-chk2 cells have an aborted S-phase checkpoint and showed the CUVADS. This may lead to collision of the replication fork with unrepaired DNA lesions, leading to the formation of DSBs and the consequent death of the cells. Thus, contrary to γ-radiation (18), our results demonstrated, for the first time, that the abrogation of Chk2 could further lead to the CUVA-induced sensitization of p53 wild-type cells.
Besides helping to clarify the action of a novel approach of sensitizing various human cancer cells by CUVA, the results presented here may also be of clinical relevance. Because approximately 50% tumors have defects in the p53 pathway (41), the ability of CUVA to sensitize cells regardless of the p53 status makes the CUVA treatment very potent against a wide range of tumors. Furthermore, CUVA treatment sensitizes cancer cells at extremely low doses of coralyne and UVA, well below the UVA dose required to cause death or mutation if given without the sensitizer (10). Also, its superior efficiency compared with PUVA, and the results of the clonogenic survival assay are very promising. Because coralyne does not absorb in the visible region, UVA light was used for its activation. However, this may not be of much concern because UVA is often used for phototherapy, wherein the laser light is delivered to areas inside the body through fiberoptic cables with an endoscope. This is used to treat even lungs or esophageal cancers. However, issues related to (a) its efficacy in animal models, (b) strategies to deliver coralyne and UVA to internal tumors, as well as (c) the putative mechanism of generation of DSBs and its role in the CUVA-induced apoptosis warrants further investigation.
Footnotes
Author Disclosure Statement
No competing financial interests exist.