
Abstract
To test the hypothesis that the inducible nitric oxide synthase (iNOS) is involved in mediating the toll-like receptor 4-dependent effects on the liver in the onset of fructose-induced steatosis, wild-type and iNOS knockout (iNOS−/−) mice were either fed tap water or 30% fructose solution for 8 weeks. Chronic consumption of 30% fructose solution led to a significant increase in hepatic steatosis and inflammation as well as plasma alanine-aminotransferase levels in wild-type mice. This effect of fructose feeding was markedly attenuated in iNOS−/− mice. Hepatic lipidperoxidation, concentration of phospho-IκB, nuclear factor κB activity, and tumor necrosis factor-α mRNA level were significantly increased in fructose-fed wild-type mice, whereas in livers of fructose-fed iNOS−/− mice, lipidperoxidation, phospho-IκB, nuclear factor κB activity, and tumor necrosis factor-α expression were almost at the level of controls. However, portal endotoxin levels and hepatic myeloid differentiation factor 88 expression were significantly higher in both fructose-fed groups compared to controls. Taken together, these data suggest that (i) the formation of reactive oxygen species in liver is a key factor in the onset of fatty liver and (ii) iNOS is involved in mediating the endotoxin/toll-like receptor 4-dependent effects in the development of fructose-induced fatty liver. Antioxid. Redox Signal. 14, 2121–2135.
Introduction
Besides a general overnutrition, a diet rich in carbohydrates and herein particularly in fructose has been discussed to be critically involved in the development of NAFLD. Indeed, results of several human studies suggest that patients with NAFLD (e.g., with simple steatosis and steatohepatitis with beginning fibrosis) consume markedly more fructose in their diet than controls (1, 28, 38). Further, it has been suggested by the results of Solga et al. (35) that a high intake of carbohydrates can increase the odds of developing later, more severe stages of the disease (e.g., nonalcoholic steatohepatitis [NASH]). In line with these human findings it has been shown in several animal studies that an increased consumption of fructose (e.g., as chow or drinking solution) may result in hepatic steatosis accompanied by insulin resistance, elevated plasma triglyceride levels, and oxidative stress in the liver (2, 5, 9, 19). Our own group showed recently that already the onset of fructose-induced NAFLD (e.g., steatosis) resulting from an 8-week-long fructose feeding period is associated with an increased translocation of intestinal bacterial endotoxin, formation of 4-hydroxynonenal (4-HNE) adducts, and expression of tumor necrosis factor (TNF)-α in the liver, whereas similar changes were not found in mice fed glucose for 8 weeks (9). Interestingly, in mice concomitantly treated with antibiotics (9) or mice without a functional toll-like receptor 4 (TLR-4), this effect of fructose on the liver was attenuated by ∼50% (37). Further, in these mice, the formation of reactive oxygen species (ROS) and the induction of iNOS found in wild-type mice chronically exposed to fructose were markedly reduced.
There is a growing body of evidence implicating that the excessive generation of ROS and herein particularly of nitric oxide (NO) and other reactive nitrogen species is involved in the development of various types of liver diseases (e.g., alcoholic liver disease, postischemic liver injury, viral hepatitis, and NASH) (14, 15, 18, 26, 41). Indeed, an induction of iNOS mRNA expression and protein levels as well as increased generation of 3-nitrotyrosine (3-NT) has been demonstrated in a number of different animal models of NASH (e.g., ob/ob, fructose feeding) (25, 34, 37). However, contrary to these reports, Chen et al. (12) reported that iNOS may attenuate the progression of steatohepatitis to liver fibrosis in mice fed a high-fat diet. Whether ROS and herein particularly reactive nitrite species and enzymes associated with the formation of ROS are also causally involved in the onset of fructose-induced fatty liver remains to be determined. In the present study we tested the hypothesis that iNOS is (1) involved in the onset of fructose-induced steatosis and (2) mediating, at least in part, the effects of the increased translocation of the endotoxin and subsequent activation of TLR-4-dependent signalling cascades found in chronically fructose-fed animals in a mouse model.
Materials and Methods
Animals and treatments
Eight-week-old C57BL/6J and iNOS−/− mice (B6.129P2-NOS2tm1Lau/J) (Jackson Laboratories, Maine) were housed in a pathogen-free barrier facility in individually ventilated cages, accredited by the Association for Assessment and Accreditation of Laboratory Animal Care (AAALAC). All knockout mice used in this study were backcrossed at least 10 times onto C57BL/6J, avoiding concerns regarding differences between wild-type and knockout mice at nonspecific loci. All procedures were approved by the local Institutional Animal Care and Use Committee (IACUC). For 8 weeks, C57BL/6J and iNOS−/− mice (n = 4–6 per group) were either fed plain tap water or water containing 30% fructose ad libitum. Throughout the feeding period body weight was assessed weekly. Animals were anesthetized with 80 mg ketamin/kg and 6 mg xylazin/kg body weight by intraperitoneal injection, and blood was collected just before sacrifice. While portions of liver were either frozen immediately in liquid nitrogen, or fixed in neutral-buffered formalin, others were frozen-fixed in OCT mounting media (medite).
Cell culture and treatment
AML-12 cells (alpha mouse liver 12; American Type Culture Collection) were grown in Dulbecco's modified Eagle's medium (DMEM)/F12 (Gibco) supplemented with 10% fetal calf serum, 40 ng/ml dexamethasone, 0.005 mg/ml insulin, and 5 ng/ml selenium (Gibco) in 6-well plates in a humidified 5% CO2 atmosphere at 37°C until they were 70% confluent. Cells were serum starved for 18 h, and some cells were preincubated with the iNOS inhibitor L-NAME (10 mM; Sigma) for 1 h. The medium was subsequently removed and replaced with fresh DMEM/F12 containing fructose (0–50 mM) ± L-NAME (25–50 mM), and cells were incubated for another 24 h.
Murine RAW 264.7 macrophage-like cells (mouse leukaemic monocyte macrophage cell line; American Type Culture Collection) were grown in DMEM supplemented with 10% fetal calf serum in a humidified 5% CO2 atmosphere at 37°C. At 70% confluency cells were preincubated with the TLR-4 inhibitor OxPAPC (120 μg/ml; InvivoGen) for 1 h in serum-free media. Then, the cells were stimulated with 50 ng lipopolysaccharide (LPS)/ml in the presence or absence of the TLR-4 inhibitor for 18 h.
After treatment, the medium was taken from both AML-12 as well as RAW 264.7 for later nitrite measurements, and cells were then rinsed with phosphate-buffered saline (PBS), and lysed with peqGOLD TriFast™ (PEQLAB) for later RNA isolation and analysis by real-time reverse transcriptase (RT)–polymerase chain reaction (PCR; see below).
Coculture model and treatment
To investigate the effect of fructose and LPS on Kupffer cells and hepatocytes, a coculture model was developed, in which RAW 264.7 macrophages and AML-12 cells being models of Kupffer cells and murine hepatocytes, respectively, were concomitantly exposed to fructose or LPS in the presence of L-NAME. RAW 264.7 cells were grown on transwell cell culture chambers until ∼70% confluence. AML-12 cells were grown in normal six-well plates until ∼70% confluence followed by an 18 h serum starvation. Meanwhile, RAW 264.7 cells were challenged with either LPS (50 mg/ml) or fructose (50 mM) either in the presence or in the absence of L-NAME (10 mM) in DMEM/F12 containing 0.1% bovine serum albumin (BSA) for 1 h. RAW 264.7 cells were then carefully rinsed twice with PBS to wash off excessive LPS or fructose and transwells were placed into the six-well plates, in which AML-12 cells were grown. Fresh starvation medium (DMEM/F12 media [Gibco] supplemented with 0.1% BSA) was added. Some of the cells were additionally treated with L-NAME. After incubation AML-12 as well as RAW cells were harvested separately, rinsed with PBS, and lysed with peqGOLD TriFast™ (PEQLAB) for later RNA isolation and analysis by real-time RT-PCR (see below).
Detection of nitrite
Nitrite levels were deterimend in cell culture media using a commercially available Griess reagent kit (Promega) as detailed before (21).
Clinical chemistry, pathologic evaluation, and ELISAs
Using a commercially available kit (Randox) activity of alanine-aminotransferase (ALT) was determined in plasma of mice. For assessment of liver histology, paraffin-embedded sections of liver (5 μm) were stained with hematoxylin and eosin. Representative photomicrographs were captured at a 400 × magnification using a system incorporated in a microscope (Axio Vert 200M) (Zeiss). Further, retinol binding protein (RBP) 4 and TNFα concentration was measured in plasma and concentration of reduced (GSH) as well as oxidized (GSSG) glutathione was determined in liver homogenate of mice using commercially available ELISA kits (GSH and GSSG: Cayman Chemical Company; RBP4: immune diagnostik; TNFα: R&D Systems, respectively). Using a TransAM™ ELISA-based kit (Active Motif) activity of the nuclear factor κB (NFκB) was measured in nuclear extract isolated from liver samples with a lysis buffer (1 M HEPES, 50% Glycerol, 5 M NaCl, 0.5 M EDTA, and 1 M DTT) containing a protease and phosphatase inhibitors mix (Sigma) following the instructions of the company.
Hepatic triglyceride determination
Hepatic lipid accumulation was determined as described previously (37) in sections of mouse liver tissue and representative photomicrographs were captured at 400 × magnification using a Zeiss microscope (see above). For determination of hepatic triglycerides 2 × PBS was used to homogenize frozen liver tissue of mice. After extracting tissue lipids with methanol/chloroform (1:2), lipids were dried and resuspended in 5% fat-free bovine serum albumin. Using a commercially available kit (Randox) triglyceride levels were measured and values were normalized to protein concentration in liver homogenate determined by Bradford assay (Bio Rad Laboratories).
Isolation of RNA and real-time RT-PCR
Using peqGOLD TriFast™ (PEQLAB), total RNA was extracted from liver tissue, and AML-12 and RAW cells, and the concentration of RNA was determined spectrophotometrically. One microgram total RNA was reverse transcribed after a DNase digestion step using MuLV reverse transcriptase and oligo dT primers (Fermentas). PCR primers for myeloid differentiation factor 88 (MyD88) (forward: 5′-CAA AAG TGG GGT GCC TTT GC-3′; reverse: 5′-AAA TCC ACA GTG CCC CCA GA-3′), TNFα (forward: 5′-CCA GGC GGT GCC TAT GTC TC-3′; reverse: 5′-CAG CCA CTC CAG CTG CTC CT-3′), iNOS (forward: 5′-CAG CTG GGC TGT ACA AAC CTT-3′; reverse: 5′-CAG GTC AAC ATC GGC AAT CA-3′), chemokine (C-C motif) ligand 2 (CCL2) (forward: 5′-GCC AGA CGG GAG GAA GGC CA-3′; reverse: 5′-TGG ATG CTC CAG CCG GCA AC-3′), CCL19 (forward: 5′-GTC GGA GCC TCG GCC TCT CA-3′; reverse: 5′-TGG ATG CTC CAG CCG GCA AC-3′), fructokinase (forward: 5′-GGG AGC AGC CTC ATG GAA GA-3′; reverse: 5′-AGA GCC CAT GAA GGC ACA GC-3′), plasminogen activator inhibitor-1 (PAI-1) (forward: 5′-TCC AAG GGG CAA CGG ATA GA-3′; reverse: 5′-GAC GAA GAG CCA GGC ACA CA-3′), and 18S (forward: 5′-GTA ACC CGT TGA ACC CCA TT-3′; reverse: 5′-CCA TCC AAT CGG TAG TAG CG-3′) were designed using the Primer 3 software (Whitehead Institute for Biomedical Research). For preparation of the PCR mix, Sybr®Green Universal PCR Master Mix (Applied Biosystems) was used. Amplification reactions were carried out in an iCycler (Bio-Rad Laboratories) with an initial hold step (95°C for 3 min) and 50 cycles of a three-step PCR (95°C for 15 s, 60°C for 15 s, and 72°C for 30 s). To monitor amplification of the target gene, the fluorescence intensity of each sample was measured at each temperature change. The amount of target gene, which was normalized to an endogenous reference (18S), was calculated by the comparative CT method and relative to a calibrator (2−ΔΔCt). The purity of PCR products was verified by melting curves and gel electrophoresis.
Western blot
To prepare cytosolic protein lysates liver tissue was homogenized in a lysis buffer (1 M HEPES, 1 M MgCl2, 2 M KCl, and 1 M DTT) containing a protease and phosphatase inhibitors mix (Sigma). Proteins were separated in a 10% sodium dodecyl sulphate–polyacrylamide gel and transferred onto Hybond™-P polyvinylidene difluoride membranes (Amersham Biosciences). Blots were then probed with antibodies against phospho-IκB, total IκB, iNOS, and β-actin (IκB, total IκB, and β-actin [Cell Signaling Technology]; iNOS [Santa Cruz Biotechnology]). Bands were detected using Super Signal Western Dura kit (Thermo Scientific). To ascertain equal loading, all blots were stained with Ponceau red. Protein bands were densitometrically analyzed using the Flurochem Software (Alpha Innotech).
Immunohistochemical staining for MyD88, 4-HNE, 3-NT adducts, and NFκB protein
To determine MyD88, 4-HNE-, 3-NT-protein adducts, and NFκB p65 protein paraffin-embedded liver sections (5 μm) were deparaffinated and rehydrated in ethanol solutions with decreasing concentrations. Liver tissue was stained for MyD88 by blocking slides with 8% BSA in PBS containing 0.1% Tween for 45 min, washing with 2% BSA in PBS containing 0.1% Tween, and an overnight incubation with a polyclonal primary antibody solution (Santa Cruz Biotechnology) in a humidified chamber at 4°C. Liver sections were washed and MyD88 was detected by incubating slides with a peroxidase-linked secondary antibody and diaminobenzidine (Peroxidase Envision Kit; DAKO). 4-HNE adduct staining was performed as previously described (9) using a polyclonal primary antibody (AG Scientific). For determination of 3-NT adducts as well as NFκB p65 protein stainings were performed as described previously (7) using polyclonal primary antibodies (3-NT [Cell Signaling Technology]; NFκB [Santa Cruz Biotechnology]). Finally, 3-NT adducts and NFκB protein were detected by using a commercially available kit (Peroxidase Envision Kit; DAKO). The extent of labeling in liver lobules was defined as percent of the field area within the default color range determined by the software using an image acquisition and analysis system incorporated in the microscope. Data from eight fields (630 × with oil immersion for MyD88 and NFκB p65, 200 × for 4-HNE and 3-NT) of each tissue section were used to determine means. A negative control of each staining was provided by processing staining procedures like the usual staining but incubating a slide with antibody diluent instead of polyclonal primary antibodies. All sections used for staining (n = 4–6 per group) were prepared in parallel and sections for densitometric analyses were stained at the same time. Furthermore, analyses were performed simultaneously.
Endotoxin assay
Plasma samples were heated at 70°C for 20 min to assess endotoxin levels. Using a commercially available limulus amebocyte lysate assay (Charles River) with a concentration range of 0.015–1.2 EU/ml, concentration of endotoxin in plasma of mice was determined.
Statistical analyses
All results are reported as means ± standard error of the mean (n = 4–6 per group). One-way ANOVA with Turkey's post hoc test was used for the determination of statistical significance among treatment groups. Significance between two groups was determined using the Mann–Whitney test. A p-value <0.05 was selected as the level of significance before the study.
Results
Effect of chronic consumption of fructose-sweetened drinking water on the onset of liver steatosis and insulin resistance
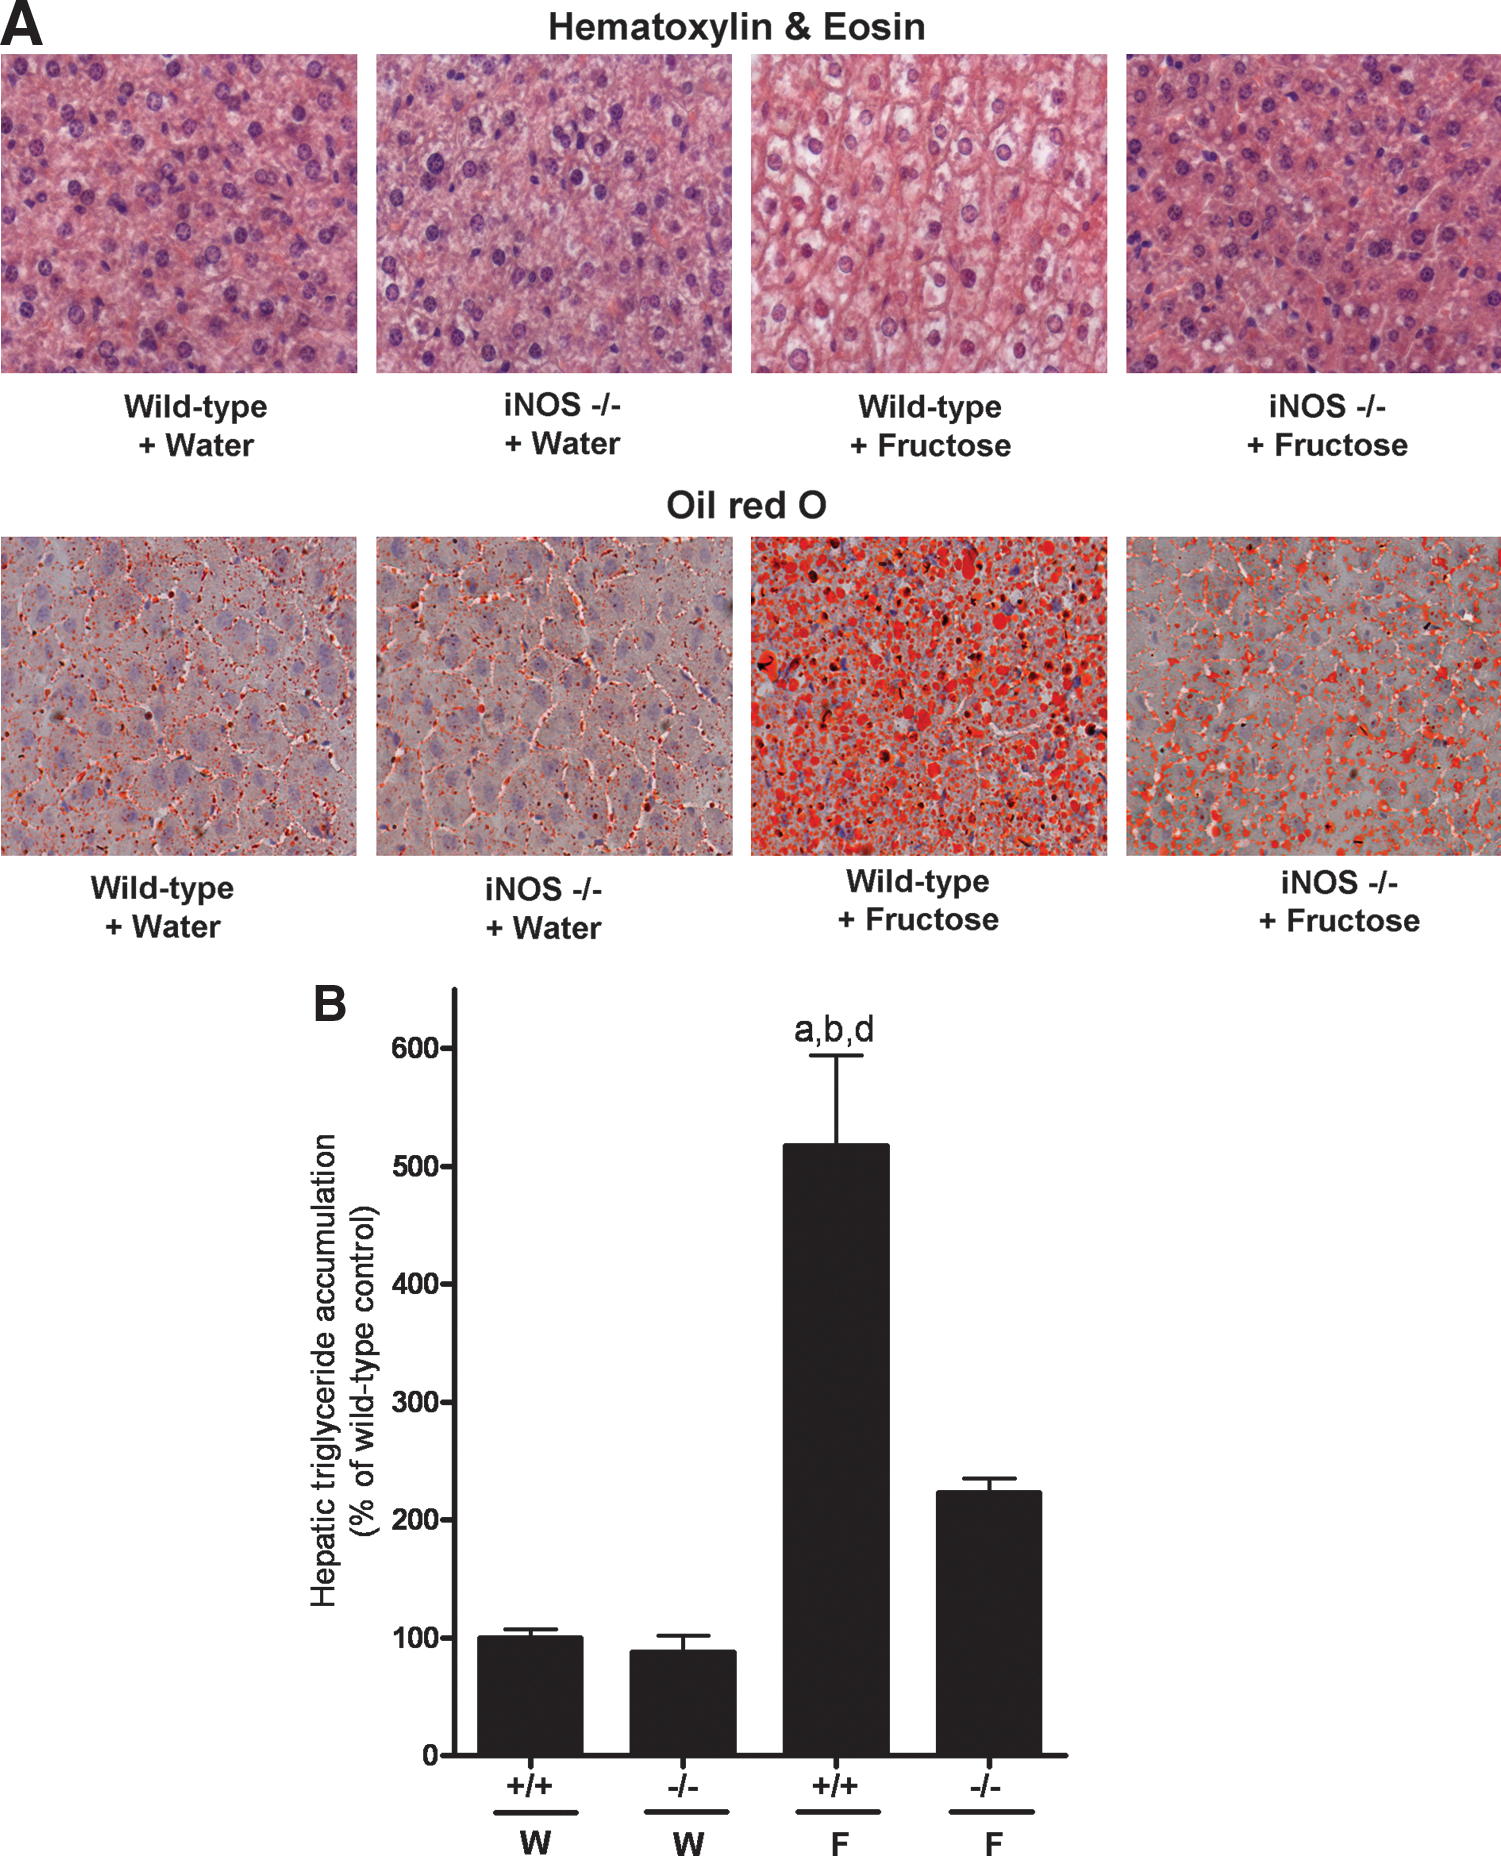
Representative pictures of hematoxylin and eosin as well as oil red O staining of livers are shown in Figure 1A and hepatic triglyceride levels of animals are summarized in Figure 1B. No pathological changes were found in water-fed wild-type or iNOS−/− mice. Triglyceride concentrations in livers of water-fed wild-type and iNOS−/− mice were minimal and did not differ. Chronic intake of 30% fructose solution resulted in a significant ∼5-fold increase in hepatic triglyceride accumulation in wild-type mice compared to water-fed groups, an effect also found in histological slides and by oil red O staining. Further, plasma ALT levels of wild-type mice fed fructose were ∼5.8-fold higher than those of water-fed controls (Table 1). Despite a similar average fructose intake per gram body weight, triglyceride levels in fructose-fed iNOS−/− mice were only ∼2-fold higher than those of water-fed iNOS−/− and wild-type controls (not significant). In line with these findings, neither ALT levels in plasma nor absolute liver weight or liver-to-body-weight ratio of wild-type mice and iNOS−/− mice fed water or fructose differed (Table 1); however, body weight gain did not differ between the two fructose-fed groups (Table 1). Further, markers of hepatic inflammation (e.g., neutrophil infiltration and mRNA expression of chemokine [C-C motif] ligand-2 and −19) were significantly higher in livers of fructose-fed wild-type mice than in water controls. Again, a similar effect of fructose feeding was not detected in livers of iNOS−/− mice.
Feeding of 30% fructose solution is described in Materials and Methods. Data are means ± standard error of the mean (n = 4–5 per group).
p < 0.05 compared with iNOS wild-type mice fed water.
p < 0.05 compared with iNOS−/− mice fed water.
p < 0.05 compared with iNOS−/− mice fed 30% fructose solution.
Normal range: <35 U/L as reported by Tiegs et al. (39) before.
iNOS, inducible nitric oxide synthase; iNOS−/−, iNOS knockout.
To determine if the loss of iNOS protected mice from fructose-induced insulin resistance, plasma RBP4 and TNFα levels were determined (Table 1). Indeed, in line with earlier reports of our own group and those of other groups (9, 37), chronic intake of fructose solution resulted in a significant increase of plasma RBP4 and TNFα levels in wild-type mice fed with fructose solution in comparison to water-fed controls. A similar effect of the fructose feeding was not found in iNOS−/− mice.
Hepatic lipid peroxidation, concentration of glutathione, and iNOS protein after chronic consumption of fructose-sweetened drinking water
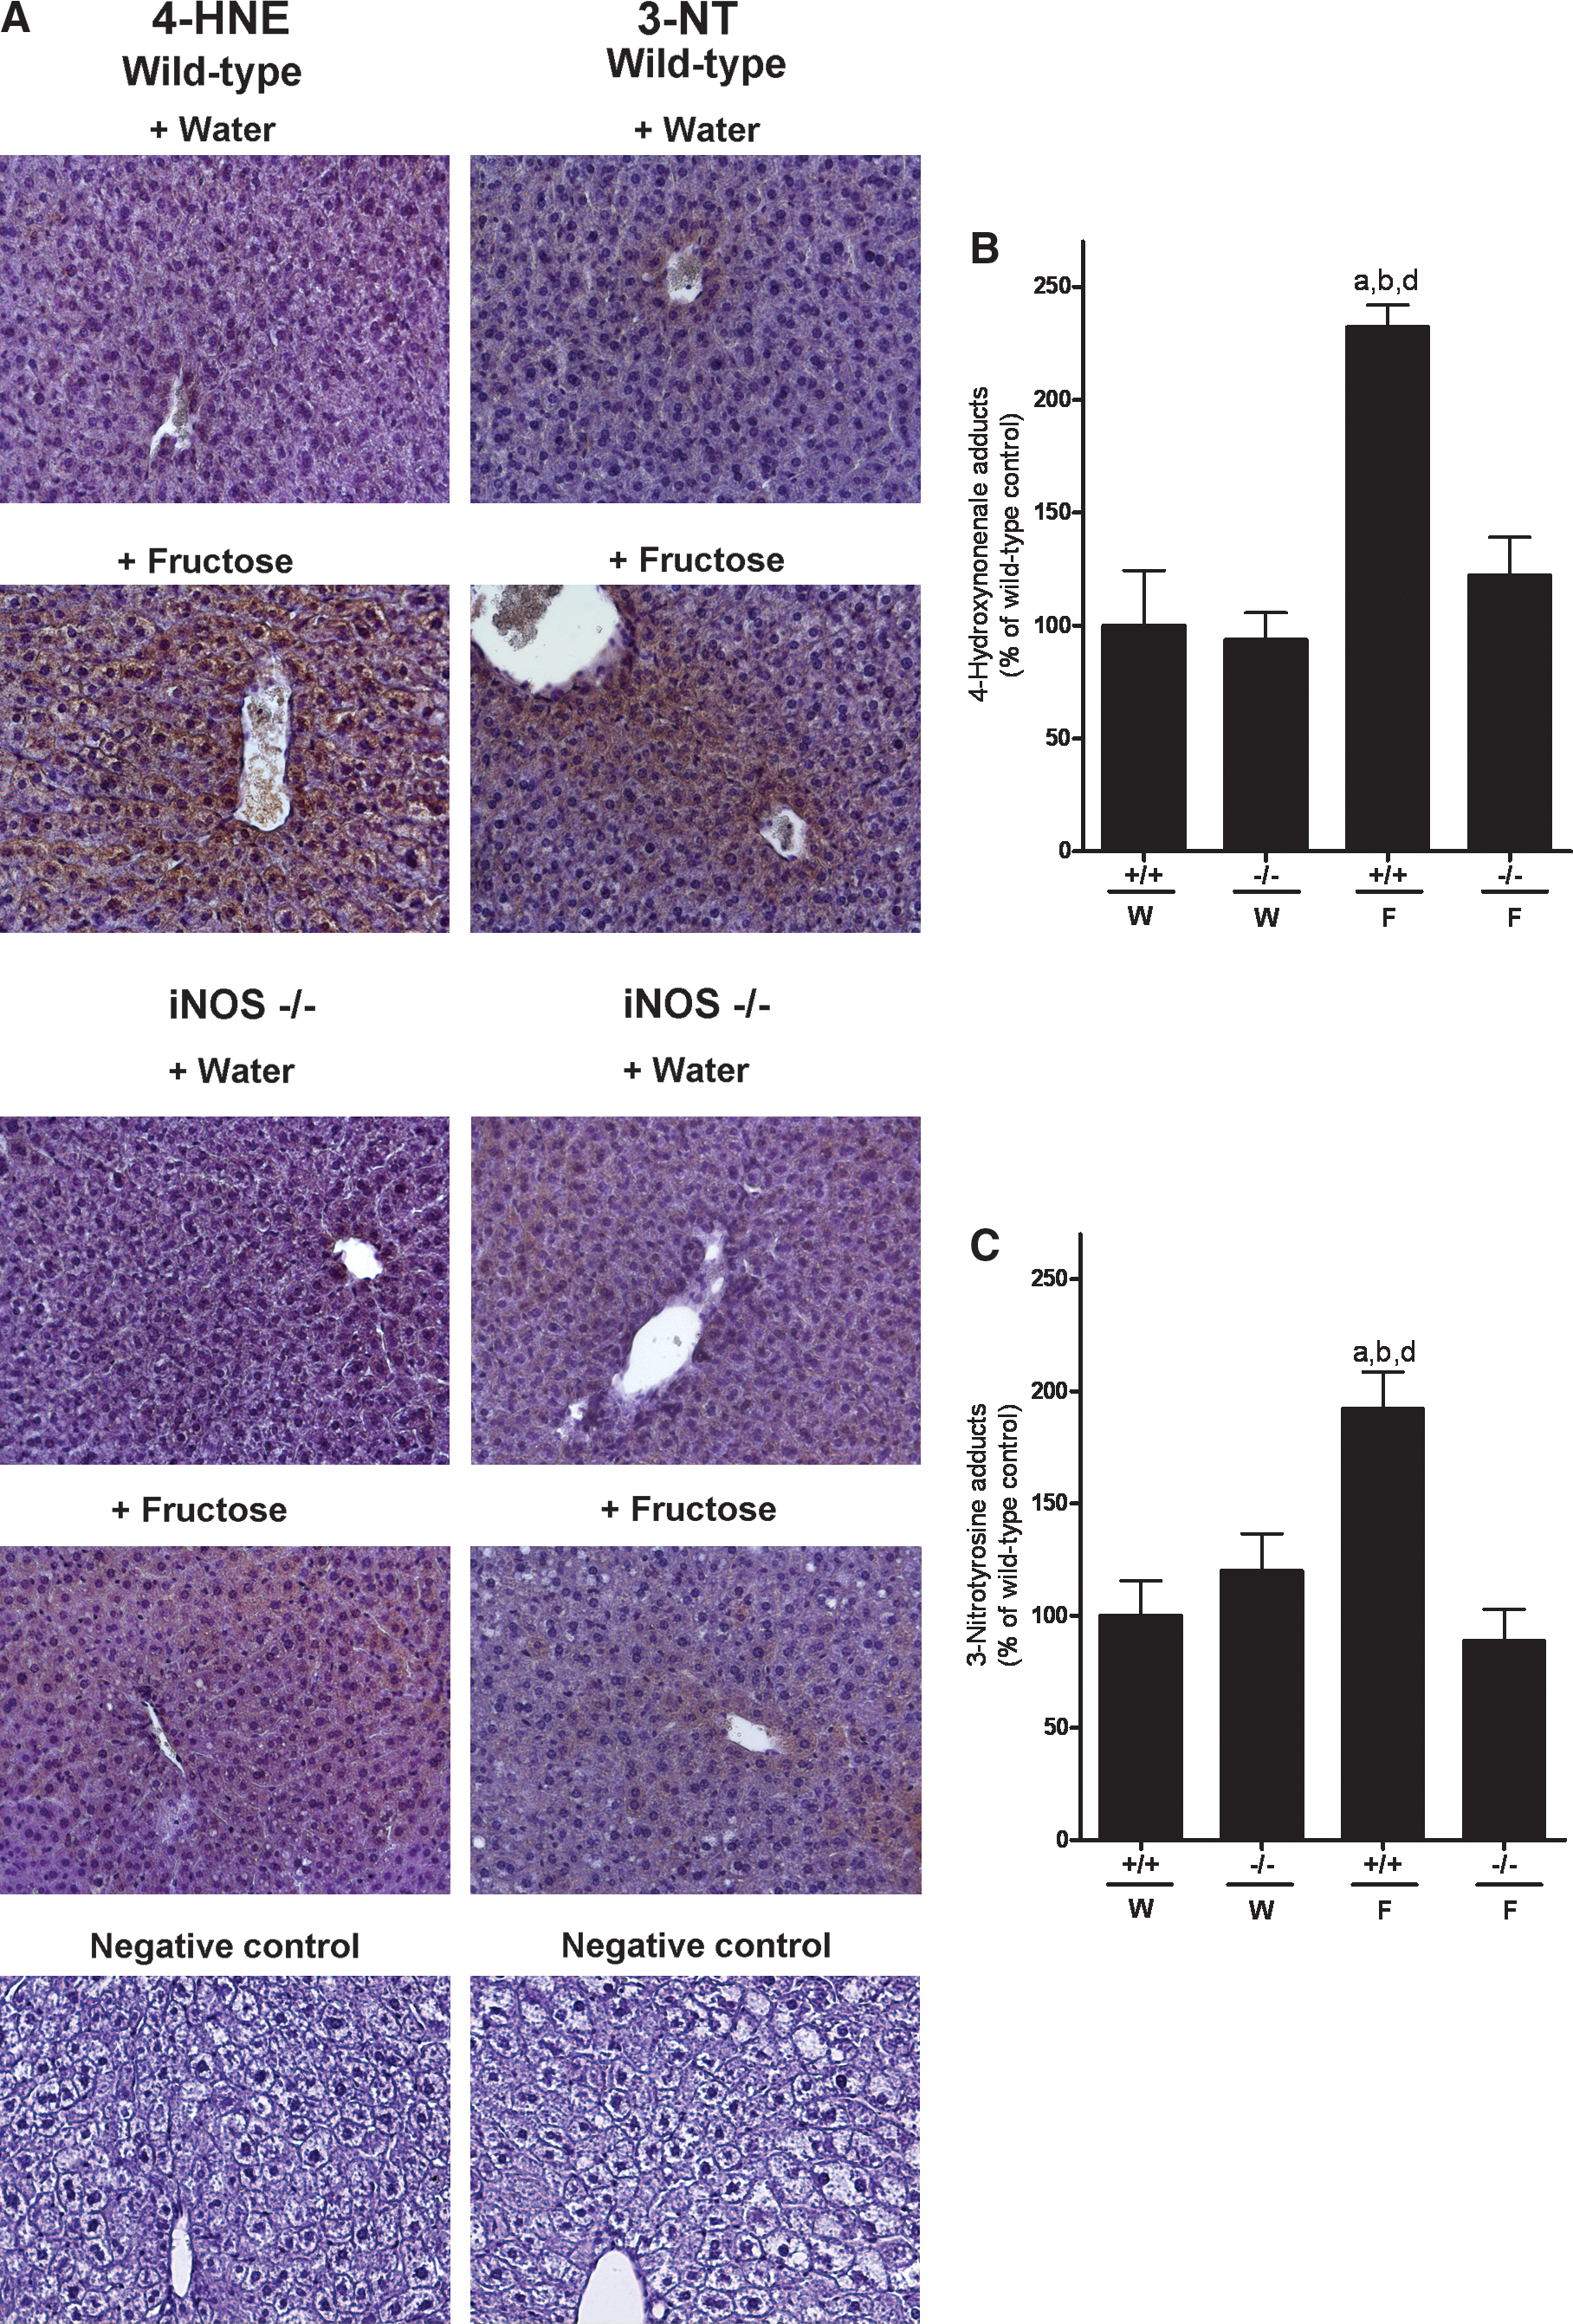
Concentration of 4-HNE adducts in livers of water-fed animals was minimal and did not differ between substrains (Fig. 2A, B). In livers of wild-type mice chronically exposed to fructose, levels of 4-HNE adducts were significantly higher by ∼2.3-fold in comparison to both water-fed wild-type and iNOS−/− mice. In contrast, in iNOS−/− mice fed 30% fructose solution, levels of 4-HNE adducts were reduced almost to the level of controls. In line with these findings, concentration of 3-NT was also found to be significantly higher in livers of fructose-fed wild-type mice (∼1.9-fold) than in all other groups (Fig. 2A, C).
GSH and GSSG in whole-liver homogenate did not differ between groups (Fig. 3A, B); however, concentrations varied considerably between animals. In line with our earlier findings, mRNA levels of iNOS were markedly higher in livers of fructose-fed mice than in water-fed controls (Fig. 3C). As to be expected, iNOS protein was not detected in liver samples obtained from iNOS−/− mice regardless of additional treatments (Fig. 3D).

Activation of IκB and NFκB, as well as TNFα mRNA expression in livers of mice after chronic consumption of fructose solution
As it has been suggested by the results of our own group and those of other groups that the development of fructose-induced NAFLD is associated with an increased activation of the redox-sensitive NFκB and an induction of the mRNA expression of TNFα in the liver (9, 30), phosphorylation of IκB, NFκB, and TNFα mRNA expression was determined. Phosphorylation of IκB was significantly higher (∼2.4-fold) in wild-type mice fed fructose solution compared to both water-fed groups (Fig. 4A). In contrast, concentration of phospho-IκB in livers of iNOS−/− mice did not differ from that of water controls. In line with these findings, NFκB p65 activity was markedly higher in livers of fructose-fed wild-type mice in comparison to all other groups (Fig. 4B). Further, in livers of fructose-fed wild-type mice NFκB staining was more prominent in Kupffer cells than in all other feeding groups regardless of substrain and treatment. Representative pictures of staining are shown in Figure 4C. In line with these findings, mRNA expression of TNFα mRNA was only found to be induced in livers of wild-type mice fed fructose (+∼5-fold in comparison to water controls, p < 0.05), whereas in livers of iNOS−/− expression of TNFα, mRNA was at the level of controls (Fig. 4D).

Effect of chronic consumption of fructose solution on portal endotoxin concentration and hepatic MyD88 levels
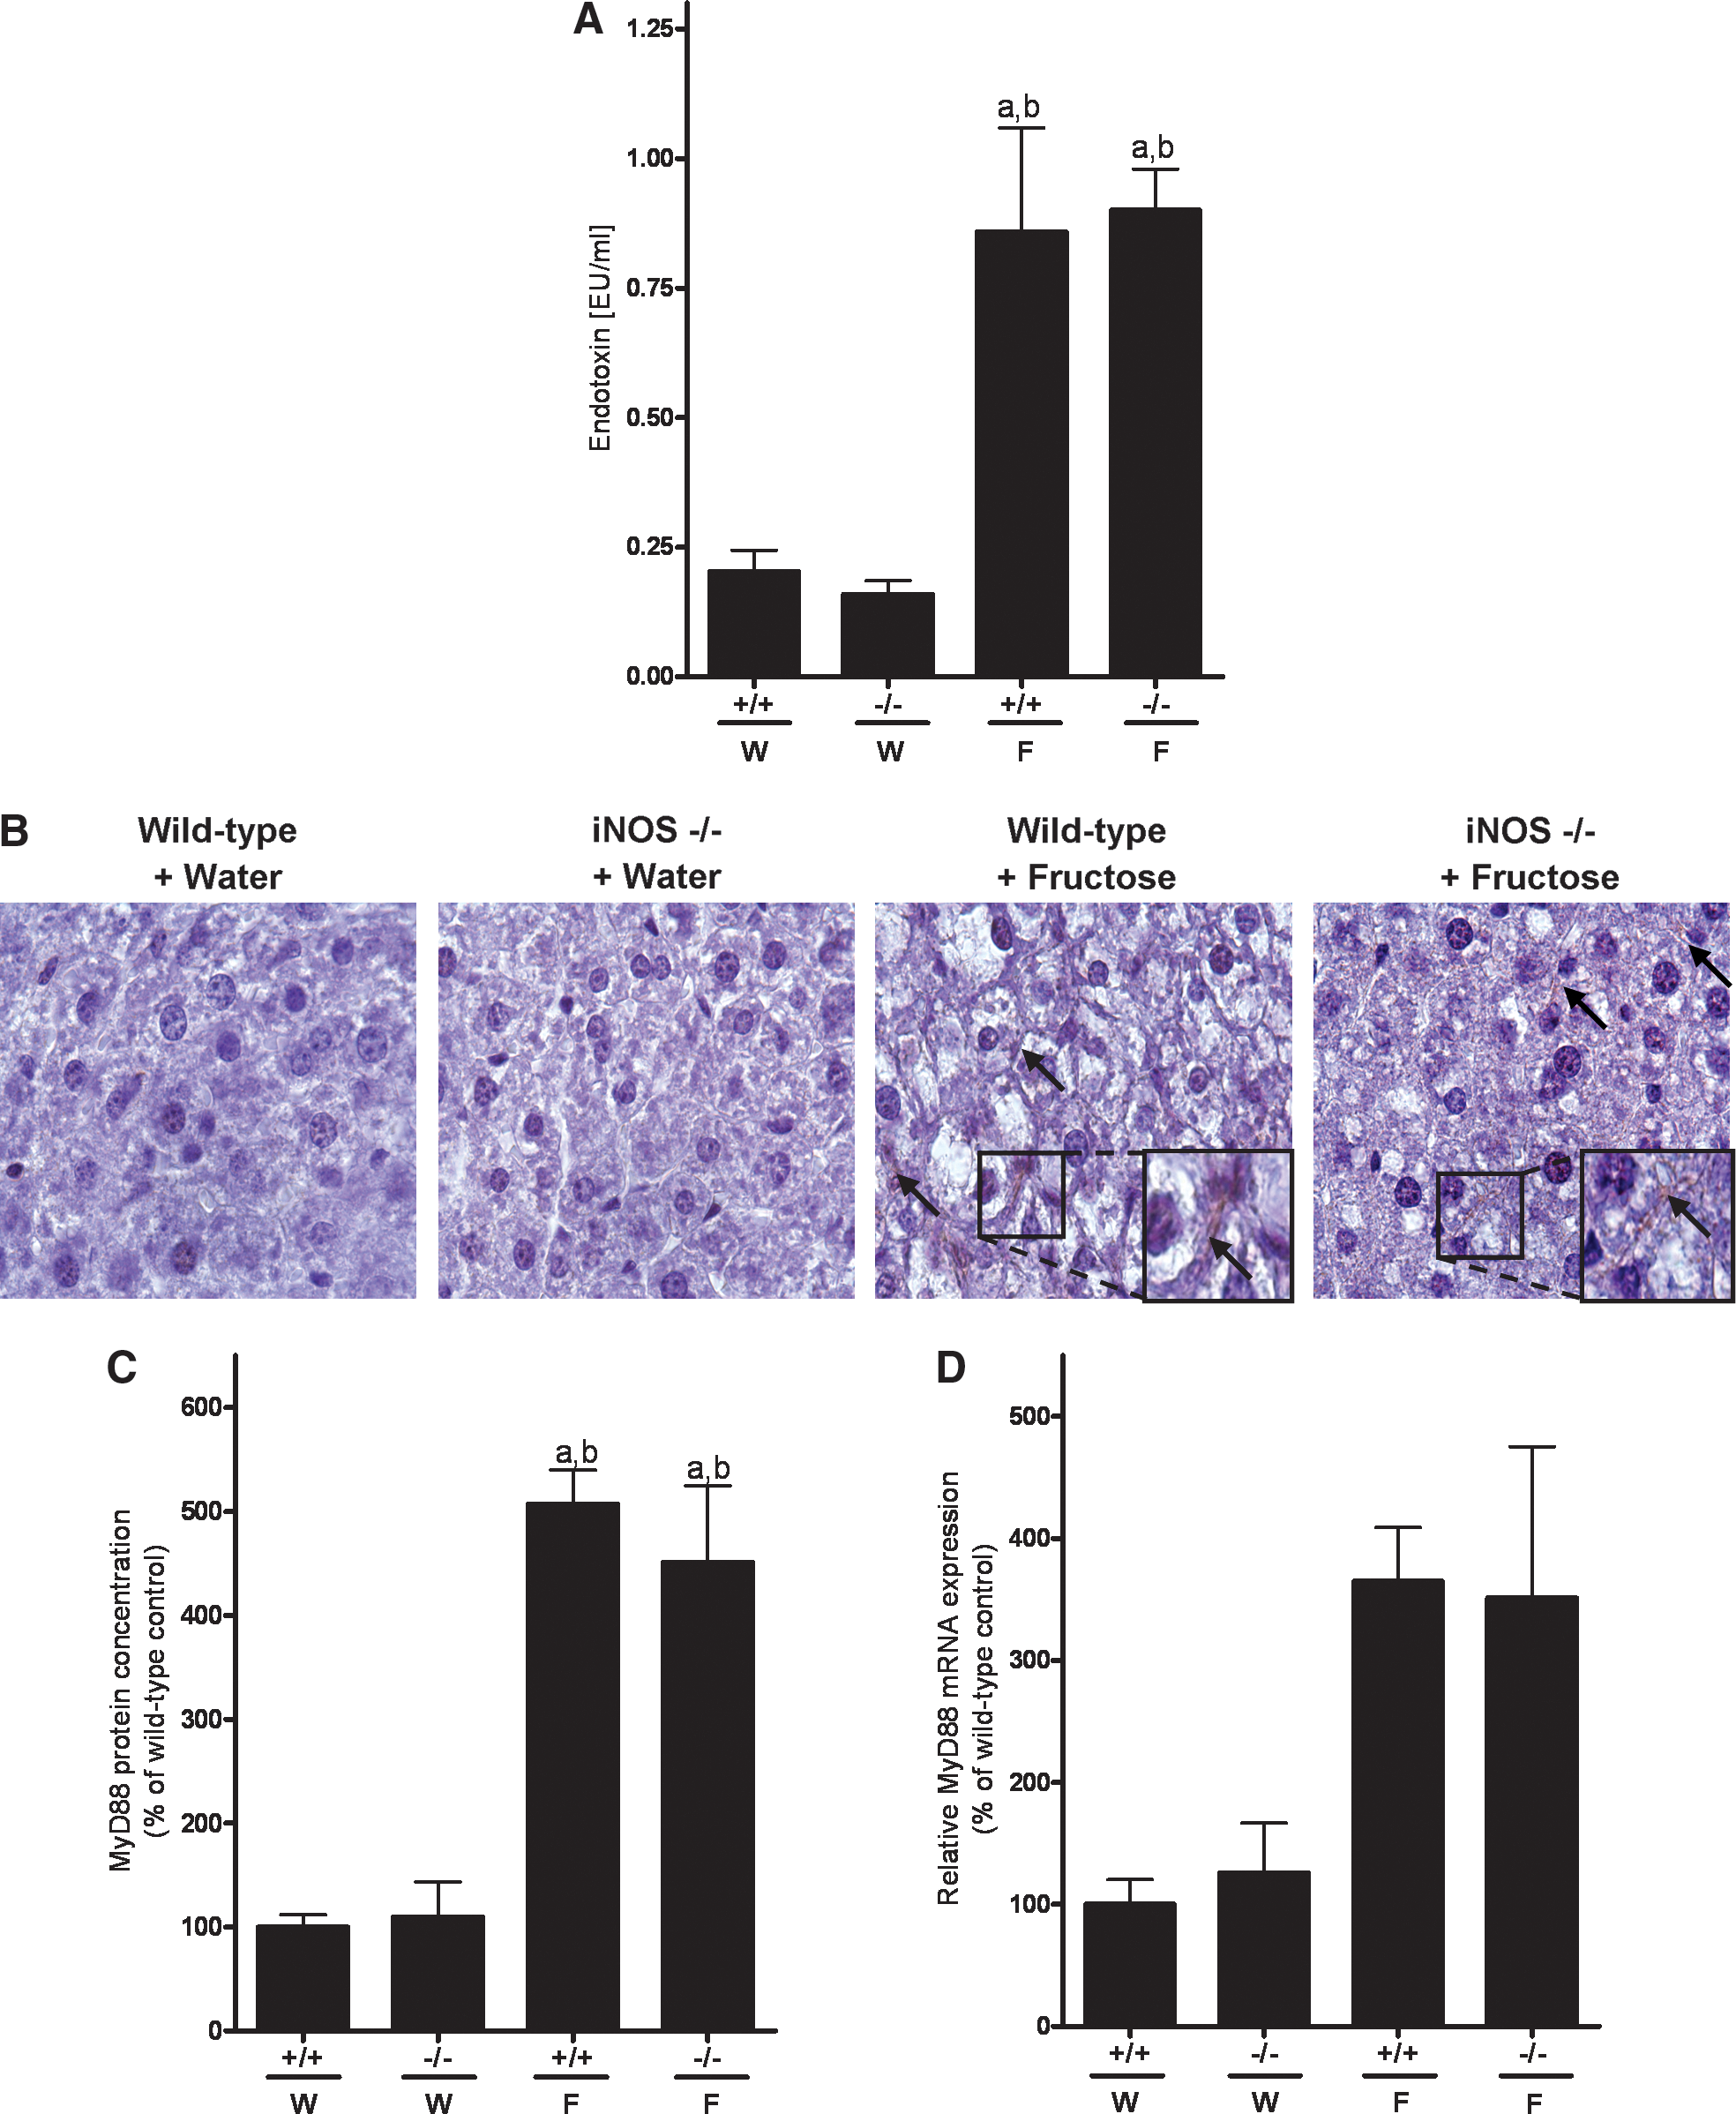
As it has been suggested by the results of animals studies of our own group that the development of fructose-induced NAFLD and the increased formation of ROS as well as induction of iNOS in the liver is associated with an increased intestinal translocation of bacterial endotoxin and induction of the TLR-4 adaptor protein MyD88 in the liver (9, 17, 21, 37), levels of endotoxin in portal plasma and mRNA expression as well as protein levels of MyD88 in the liver were determined (Fig. 5). Endotoxin levels in portal plasma of wild-type and iNOS−/− mice fed with plain water were minimal and did not differ between groups (Fig. 5A). In contrast, plasma endotoxin levels in portal plasma of both wild-type and iNOS−/− mice fed chronically with 30% fructose solution were significantly increased by ∼330% and 460%, respectively, in comparison to water-fed controls. In line with these findings, hepatic protein levels of MyD88 were markedly higher in fructose-fed mice irrespective of substrain in comparison to water controls (∼5-fold) (Fig. 5B, C). Similar results were also found when determining MyD88 mRNA expression levels; however, as expression levels varied considerably, only a trend was found (p = 0.08) (Fig. 5D).
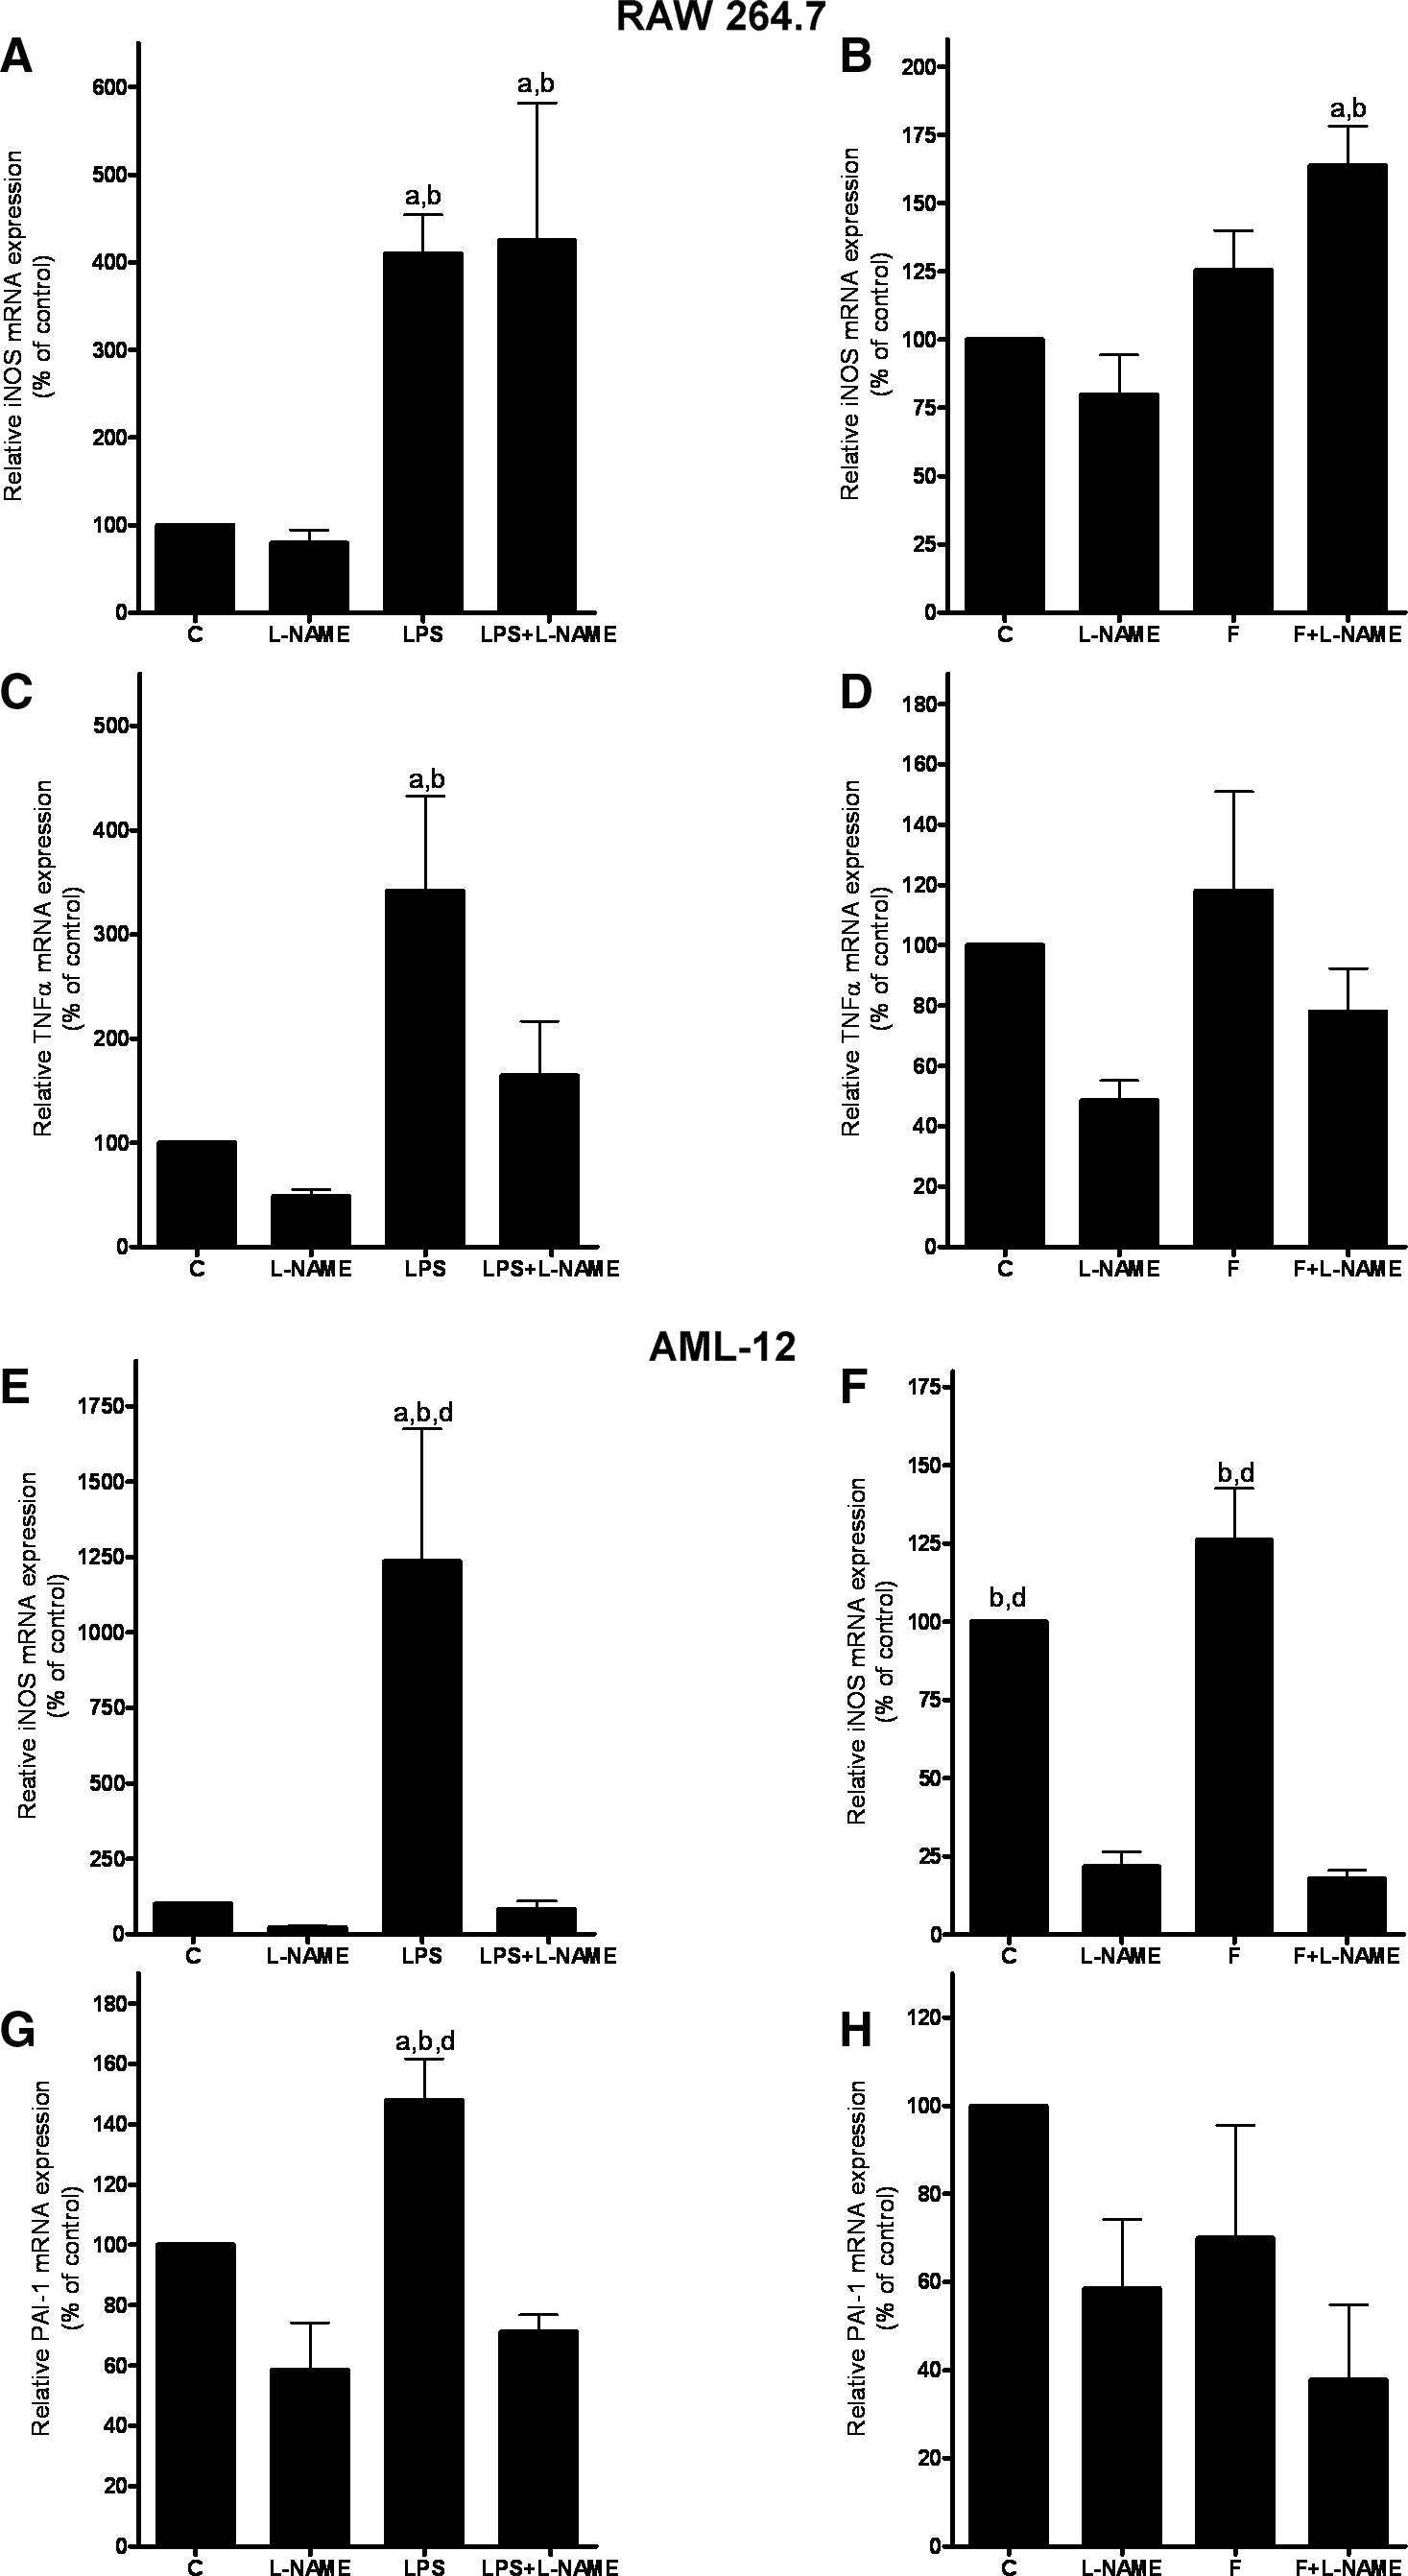
Effect of endotoxin on iNOS mRNA expression and nitrite formation in RAW 264.7 macrophages
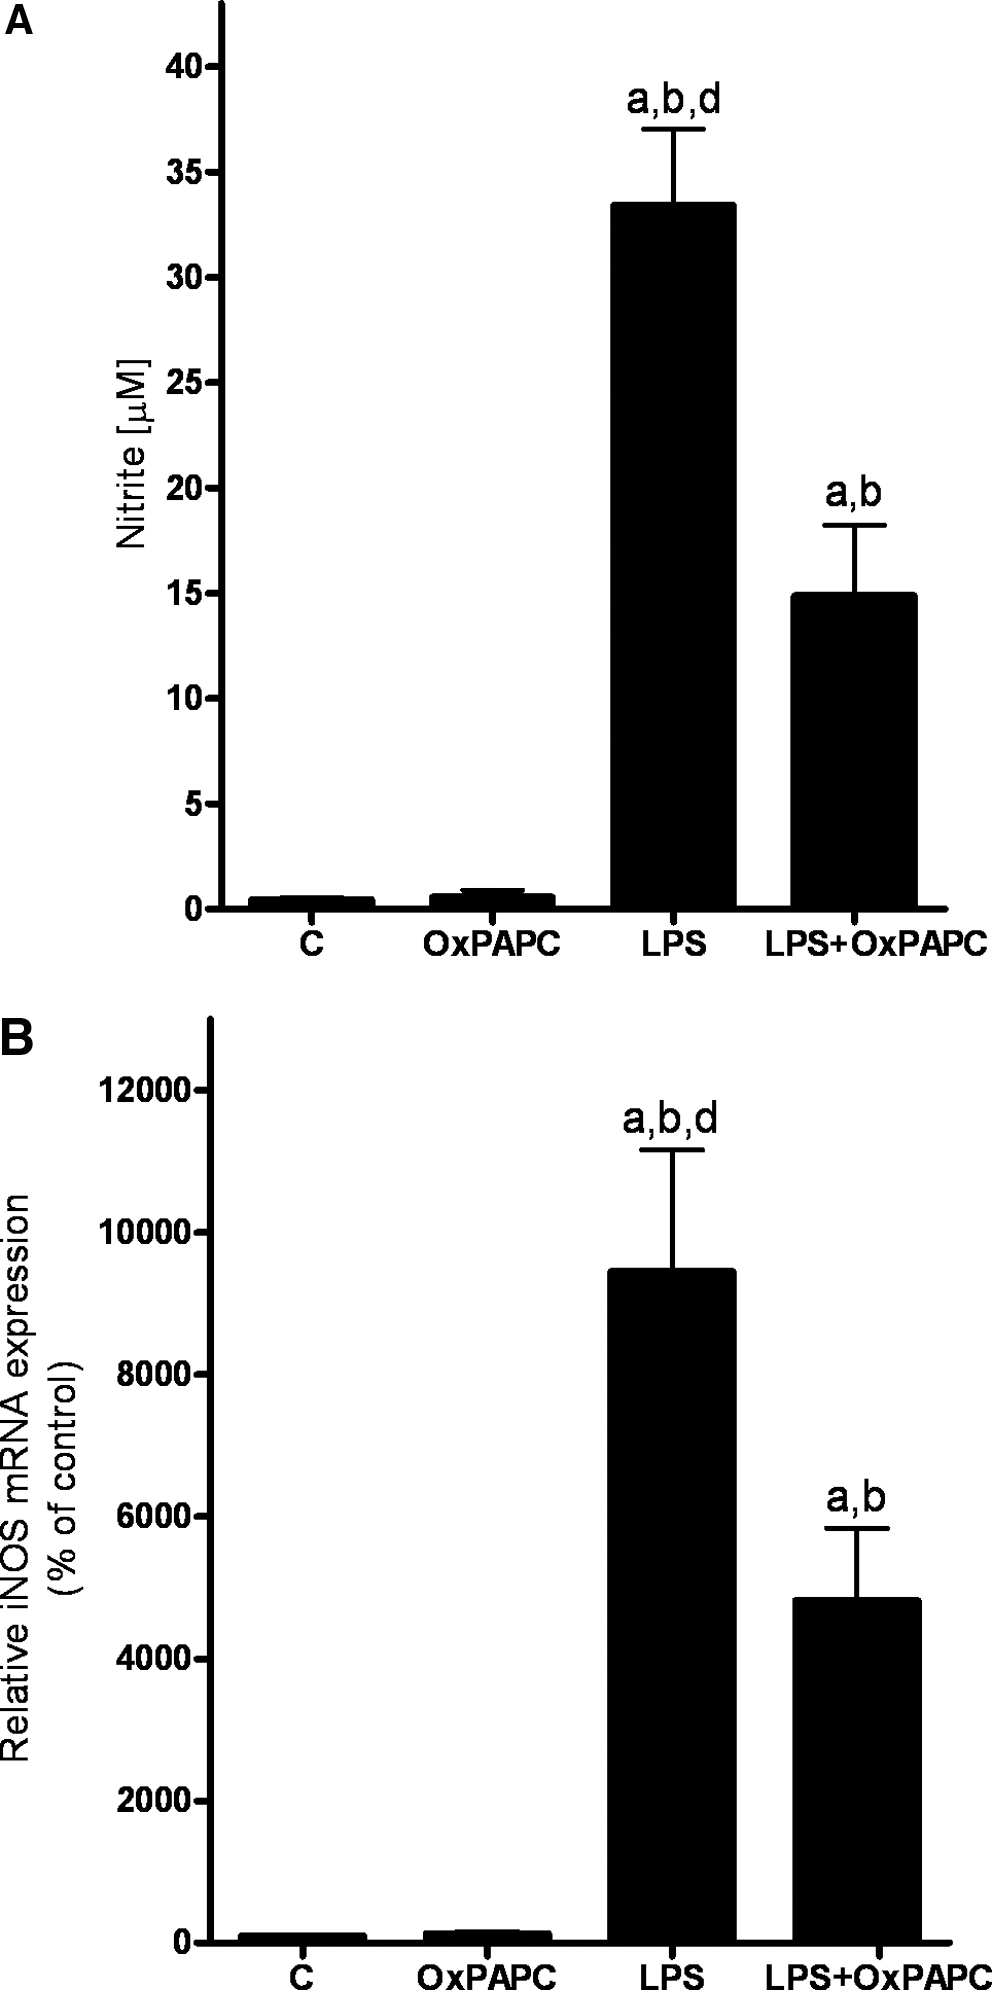
To further determine if endotoxin is involved in the induction of iNOS expression and formation of ROS in Kupffer cells, murine RAW 264.7 macrophages, a cell line used repeatedly by us and others before as a model of hepatic Kupffer cells (21, 29), were challenged with endotoxin for 18 h. Stimulation of RAW 264.7 cells with endotoxin (LPS) resulted in a significant ∼30-fold induction of nitrite concentration. This effect of endotoxin was significantly attenuated by ∼60% when cells were treated concomitantly with the TLR-4 inhibitor OxPAPC while being exposed to endotoxin (Fig. 6A). Similar results were also found when determining iNOS expression levels in these cells (Fig. 6B)
Effect of fructose on nitrite formation and on expression of fructokinase in AML-12 cells
To further delineate if fructose itself may cause lipid peroxidation, we challenged AML-12 cells, a model of murine hepatocytes, with fructose at concentrations ranging from 0 to 50 mM for 24 h in the presence or absence of the iNOS inhibitor L-NAME. Nitrite levels, used as a marker of iNOS activity, were higher in media obtained from AML-12 cells exposed to L-NAME than in those obtained from naïve cells. However, the presence of 25–50 mM fructose in the media had no effect on nitrite formation of cells (Fig. 7A).
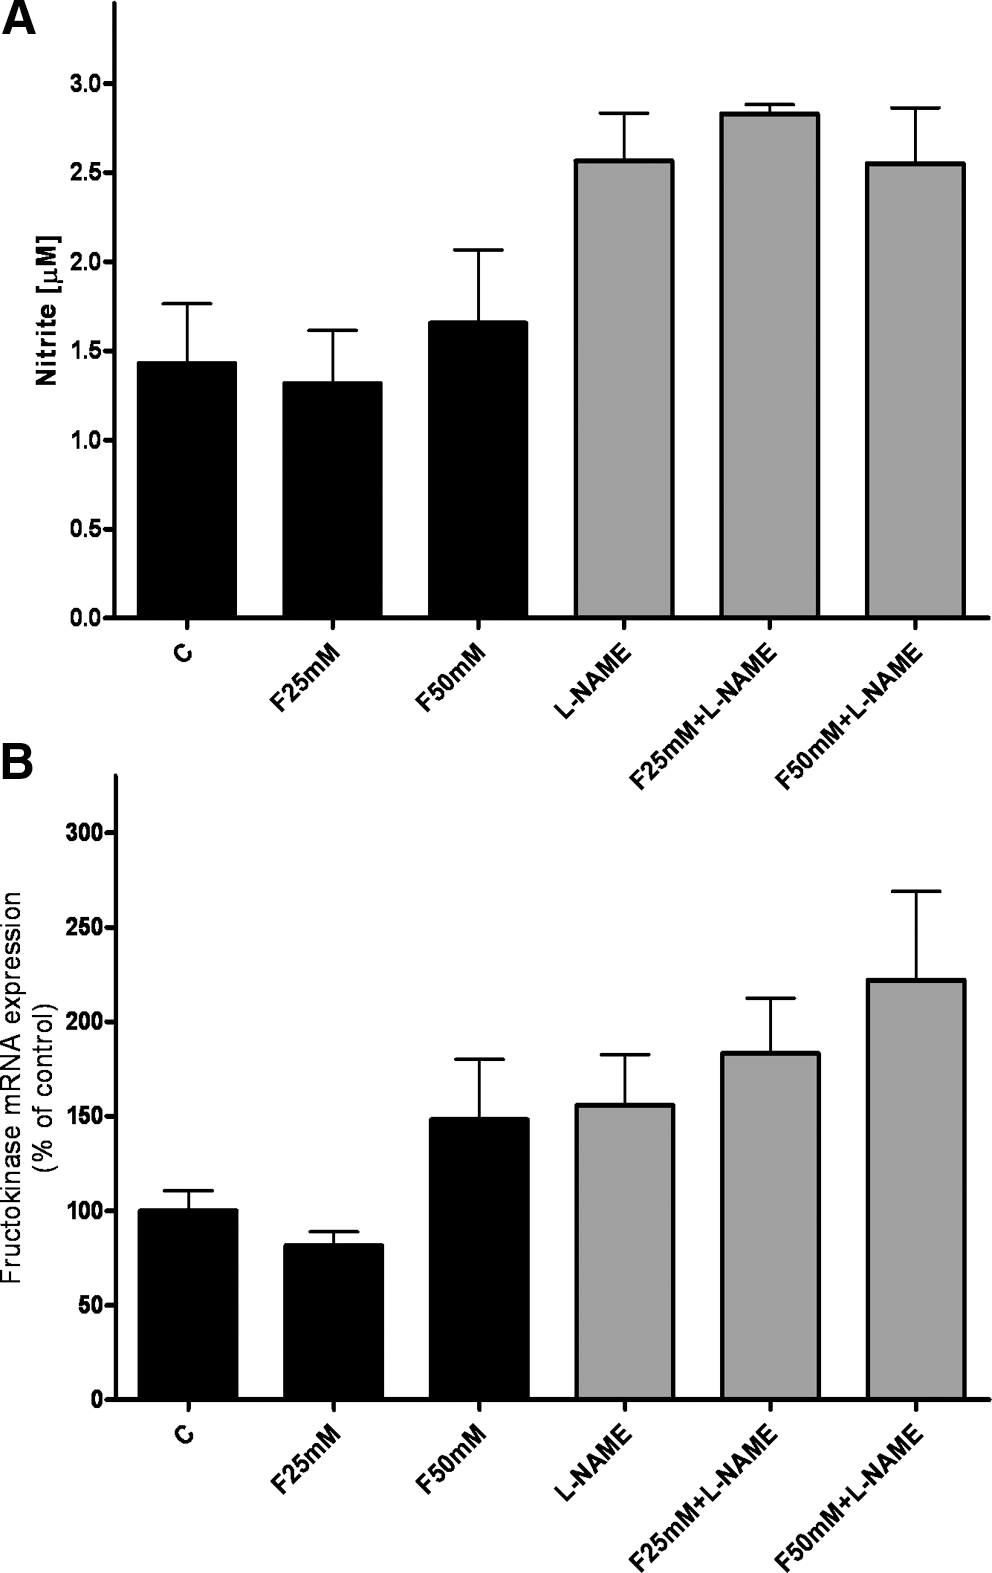
In addition, we investigated if iNOS had an effect on fructose metabolism by determining expression of fructokinase mRNA in AML-12 cells exposed to fructose (0–50 mM) in the presence or absence of the iNOS inhibitor L-NAME (Fig. 7B). Expression of fructokinase was slightly higher in AML-12 cells exposed to 50 mM fructose (+∼50%; n.s.); however, L-NAME had no additional effect on fructokinase mRNA expression.
Effect of fructose and endotoxin, respectively, on iNOS, TNFα, and PAI-1 mRNA expression in a coculture model of murine RAW 264.7 and AML-12 cells
To further investigate the effect of fructose and endotoxin, respectively, on Kupffer cells and hepatocytes and herein particularly on iNOS expression, a coculture model consisting of RAW 264.7 macrophages and AML-12 cells was developed (for further details, see Materials and Methods). In this model, challenge of RAW 264.7 cells with LPS lead to a significant ∼3.5-fold induction of iNOS mRNA expression (Fig. 8A). As expected, when RAW 264.7 cells were concomitantly treated with L-NAME, this effect of LPS was not affected. However, TNFα expression, which was significantly induced in RAW 264.7 macrophages challenged with LPS (+∼3.5-fold), was attenuated in RAW 264.7 cells concomitantly treated with L-NAME (Fig. 8C). In line with these findings, PAI-1 mRNA expression, which has been shown before to be induced in livers of mice with fructose-induced steatosis in a TNFα receptor 1-dependent way (20), was only significantly induced in AML-12 cells grown in the presence of RAW 264.7 macrophages exposed to LPS (Fig. 8G). In contrast, PAI-1 mRNA expression was at the level of naïve cells in AML-12 cells that were exposed to RAW 264.7 cells concomitantly treated with L-NAME while being challenged with LPS. Further, iNOS mRNA expression was also only found to be induced in AML-12 cells that were exposed to RAW 264.7 cells exposed to LPS (Fig. 8E), whereas iNOS mRNA expression was at the level of naïve controls in AML-12 cells exposed to RAW 264.7 cells concomitantly treated with L-NAME while being challenged with LPS. Interestingly, when RAW 264.6 cells were exposed to fructose, we only found a slight induction of iNOS mRNA expression in RAW 264.7 cells (Fig. 8B), whereas all other parameters remained almost at the level of naïve control cells.
Discussion
Increased carbohydrate and in particular fructose intake has been discussed in recent years to be one of the key factors in the development of obesity, metabolic syndrome (e.g., insulin resistance and dyslipidemia), and NAFLD [for overview, also see (36)]. Further, results of animal and human studies suggest that similar to alcoholic liver disease, bacterial overgrowth and increased translocation of bacterial endotoxins across the intestinal barrier may be involved in the pathogenesis of NAFLD (10, 27, 38, 42). Indeed, our own group recently reported that chronic intake of fructose but not glucose causes liver steatosis, which was associated with increased portal endotoxin levels, lipid peroxidation, and an induction of TNFα expression in the liver (9). In these studies we further showed that treatment with nonresorbable antibiotics (9) or the loss of a functional TLR-4 (37) protected the liver from the development of steatosis caused by chronic intake of fructose. However, the exact mechanisms involved in sugar and herein particularly fructose-induced NAFLD are still poorly understood. Here, by feeding mice lacking iNOS chronically with a moderate fructose-enhanced diet (30% fructose in drinking solutions), we further tested the hypothesis that an induction of iNOS associated with chronic intake of fructose is critically involved in the onset of fructose-induced NAFLD. The feeding model employed in the present study, which was developed by our group some years ago on the basis of the study of Jurgens et al. (19) to test the effect of different mono- and disaccharides in drinking solutions on the liver (9), has been repeatedly used by us to induce and study the early onset of hepatic steatosis and the metabolic syndrome; however, this model by no means resembles the histology of a steatohepatitis. In line with our earlier findings (37) chronic intake of fructose causes a marked induction of iNOS mRNA expression in livers of wild-type mice. Interestingly, despite similarly elevated portal endotoxin levels and an induction of the TLR-adaptor protein MyD88, which has been shown before by us to be involved in mediating the effects of endotoxin on iNOS mRNA expression in Kupffer cells (21) in livers of iNOS−/− mice fed with fructose solution, hepatic steatosis and markers of inflammation as well as plasma ALT levels were markedly lower than in wild-type controls exposed to fructose. Moreover, the magnitude of protection (∼−50%) against fructose-induced hepatic steatosis found in livers of iNOS−/− mice fed fructose was similar to that reported earlier by our group for livers of fructose-fed mice treated with nonresorbable antibiotics or mice lacking TLR-4 (9, 37). Further, our results obtained when stimulating RAW 264.7 macrophages with LPS suggest that LPS may lead to an induction of iNOS mRNA expression and nitrite formation but subsequently may also lead to an induction of TNFα and maybe other cytokines (not determined in the present study). Our results further suggest that this may lead to an increased expression of PAI-1 but also iNOS in hepatocytes. A similar effect was not found when RAW 264.7 or AML-12 cells were challenged with fructose, adding further support to the hypothesis that the induction of iNOS found in the present study in livers of wild-type mice exposed to fructose may have resulted from the increased translocation of bacterial endotoxin and subsequent activation of TLR-4-dependent signaling pathways in the liver rather than from direct effects of fructose. Whether the harmful effects of the induction of iNOS result primarily from an induction of this enzyme in Kupffer cells or hepatocytes remains to be determined; however, the results of the present study suggest that an induction of iNOS in Kupffer cells may trigger the induction of iNOS in other cell types in the liver (e.g., hepatocytes). Results of other groups also suggested that an increased formation of ROS is a critical factor in the onset but also in the progression of NAFLD (3, 5, 22). Further, it has been shown in animal studies that by using antioxidants (e.g., silymarin, curcumin, and flavonoid-enriched plant extracts) not only the level of oxidative stress but also liver pathologies can be improved in various models of diet-induced liver damage (e.g., methionine-choline-deficient diet, high-fat diet, and Western-style diet) (14, 15, 23, 26, 32, 40). In the present study, both the significant increase in hepatic 4-HNE and 3-NT adducts found in livers of wild-type mice fed fructose was almost completely blocked iNOS−/− mice fed with fructose. However, levels of GSH and GSSG determined in whole liver homogenate did not differ between strains and feeding groups as levels varied considerable between animals.
Taken together, these data lend further support to the hypothesis that ROS and herein particularly those derived from an induction of iNOS in the liver may be a critical factor in the onset of NAFLD and are with this in line with most other reports studying the role of iNOS in the onset and progression of metabolic liver diseases (e.g., alcoholic and nonalcoholic fatty liver disease) (25, 34, 37). However, the results of the present study stand in contrast to those of Rai et al. (31) and Chen et al. (13), who found that a deletion of iNOS may lead to an impaired liver regeneration and may exacerbate diet-induced liver damage. Differences between these studies and the results of the present study may have resulted from the differences of the cause of liver damage (e.g., fructose enriched diet vs. fat and carbohydrate rich diet or partial hepatectomy) or the status of the liver (recovery vs. onset and progression of damage). Further, the results of the present study also lend further support to the hypothesis that fructose may not only contribute to the development of NAFLD through mechanisms depending on its insulin-independent metabolism (e.g., through bypassing the main rate-limiting step of glycolysis [for overview, see (36)] but also that an increased translocation of bacterial endotoxin across the intestinal barrier, activation of TLR-4-dependent signalling cascades, and subsequently an induction of the iNOS in the liver may be involved in the beginning of fructose-induced NAFLD (also see Fig. 5). Indeed, in our earlier studies we were able to show that the induction of iNOS and increased levels of 4-HNE adducts found in wild-type mice, which displayed a marked accumulation of lipids after being fed 30% fructose solution for 8 weeks, was markedly attenuated in fructose-fed TLR-4 mutant mice (37).
Results of several studies indicate that TNFα might play a critical role in the pathogenesis of NAFLD. Further, in models of alcoholic liver disease bacterial endotoxins have been shown to induce TNFα in the liver through mechanisms depending on an increased generation of ROS and activation of the redox-sensitive NFκB [for overview, see (6)]. In the present study, both TNFα mRNA expression in the liver and plasma TNFα levels was markedly increased. A similar effect of the chronic feeding of fructose was not found in iNOS−/− mice. Further, the induction of TNFα mRNA expression found in the livers of wild-type mice was associated with an increased phosphorylation of IκB and activation of NFκB. Again, a similar effect of chronic fructose intake was not found in livers of iNOS−/− mice. Interestingly, in livers of fructose-fed wild-type mice NFκB staining was more prominent in Kupffer cells than in iNOS−/− mice fed with fructose. A loss of insulin sensitivity has been claimed to be a key factor in the development of NAFLD [for overview, see (24)]. Further, Charbonneau et al. (11) recently reported that iNOS may cause hepatic insulin resistance through tyrosine nitration of key insulin signaling proteins. However, iNOS has also been shown before to be an important factor in liver regeneration, in that after partial hepatectomy hepatic steatosis was much more pronounced in mice lacking iNOS than in controls (31). In the present study, not only plasma TNFα levels but also RBP4 plasma concentration, both parameters indicating insulin resistance (16, 33, 43), were markedly higher in wild-type mice chronically fed fructose, whereas these parameters were at the levels of controls in iNOS−/− mice. Further, using a cell culture model of murine hepatocytes we were able to show that iNOS seems not to alter fructose metabolism directly. Taken together, these data further add support to the hypothesis that the deletion of iNOS may have protected mice from fructose-induced steatosis and insulin resistance through interfering with the endotoxin/TLR-4-dependent activation of NFκB and subsequently the induction of TNFα rather than through altering fructose metabolism directly (also see Fig. 9).
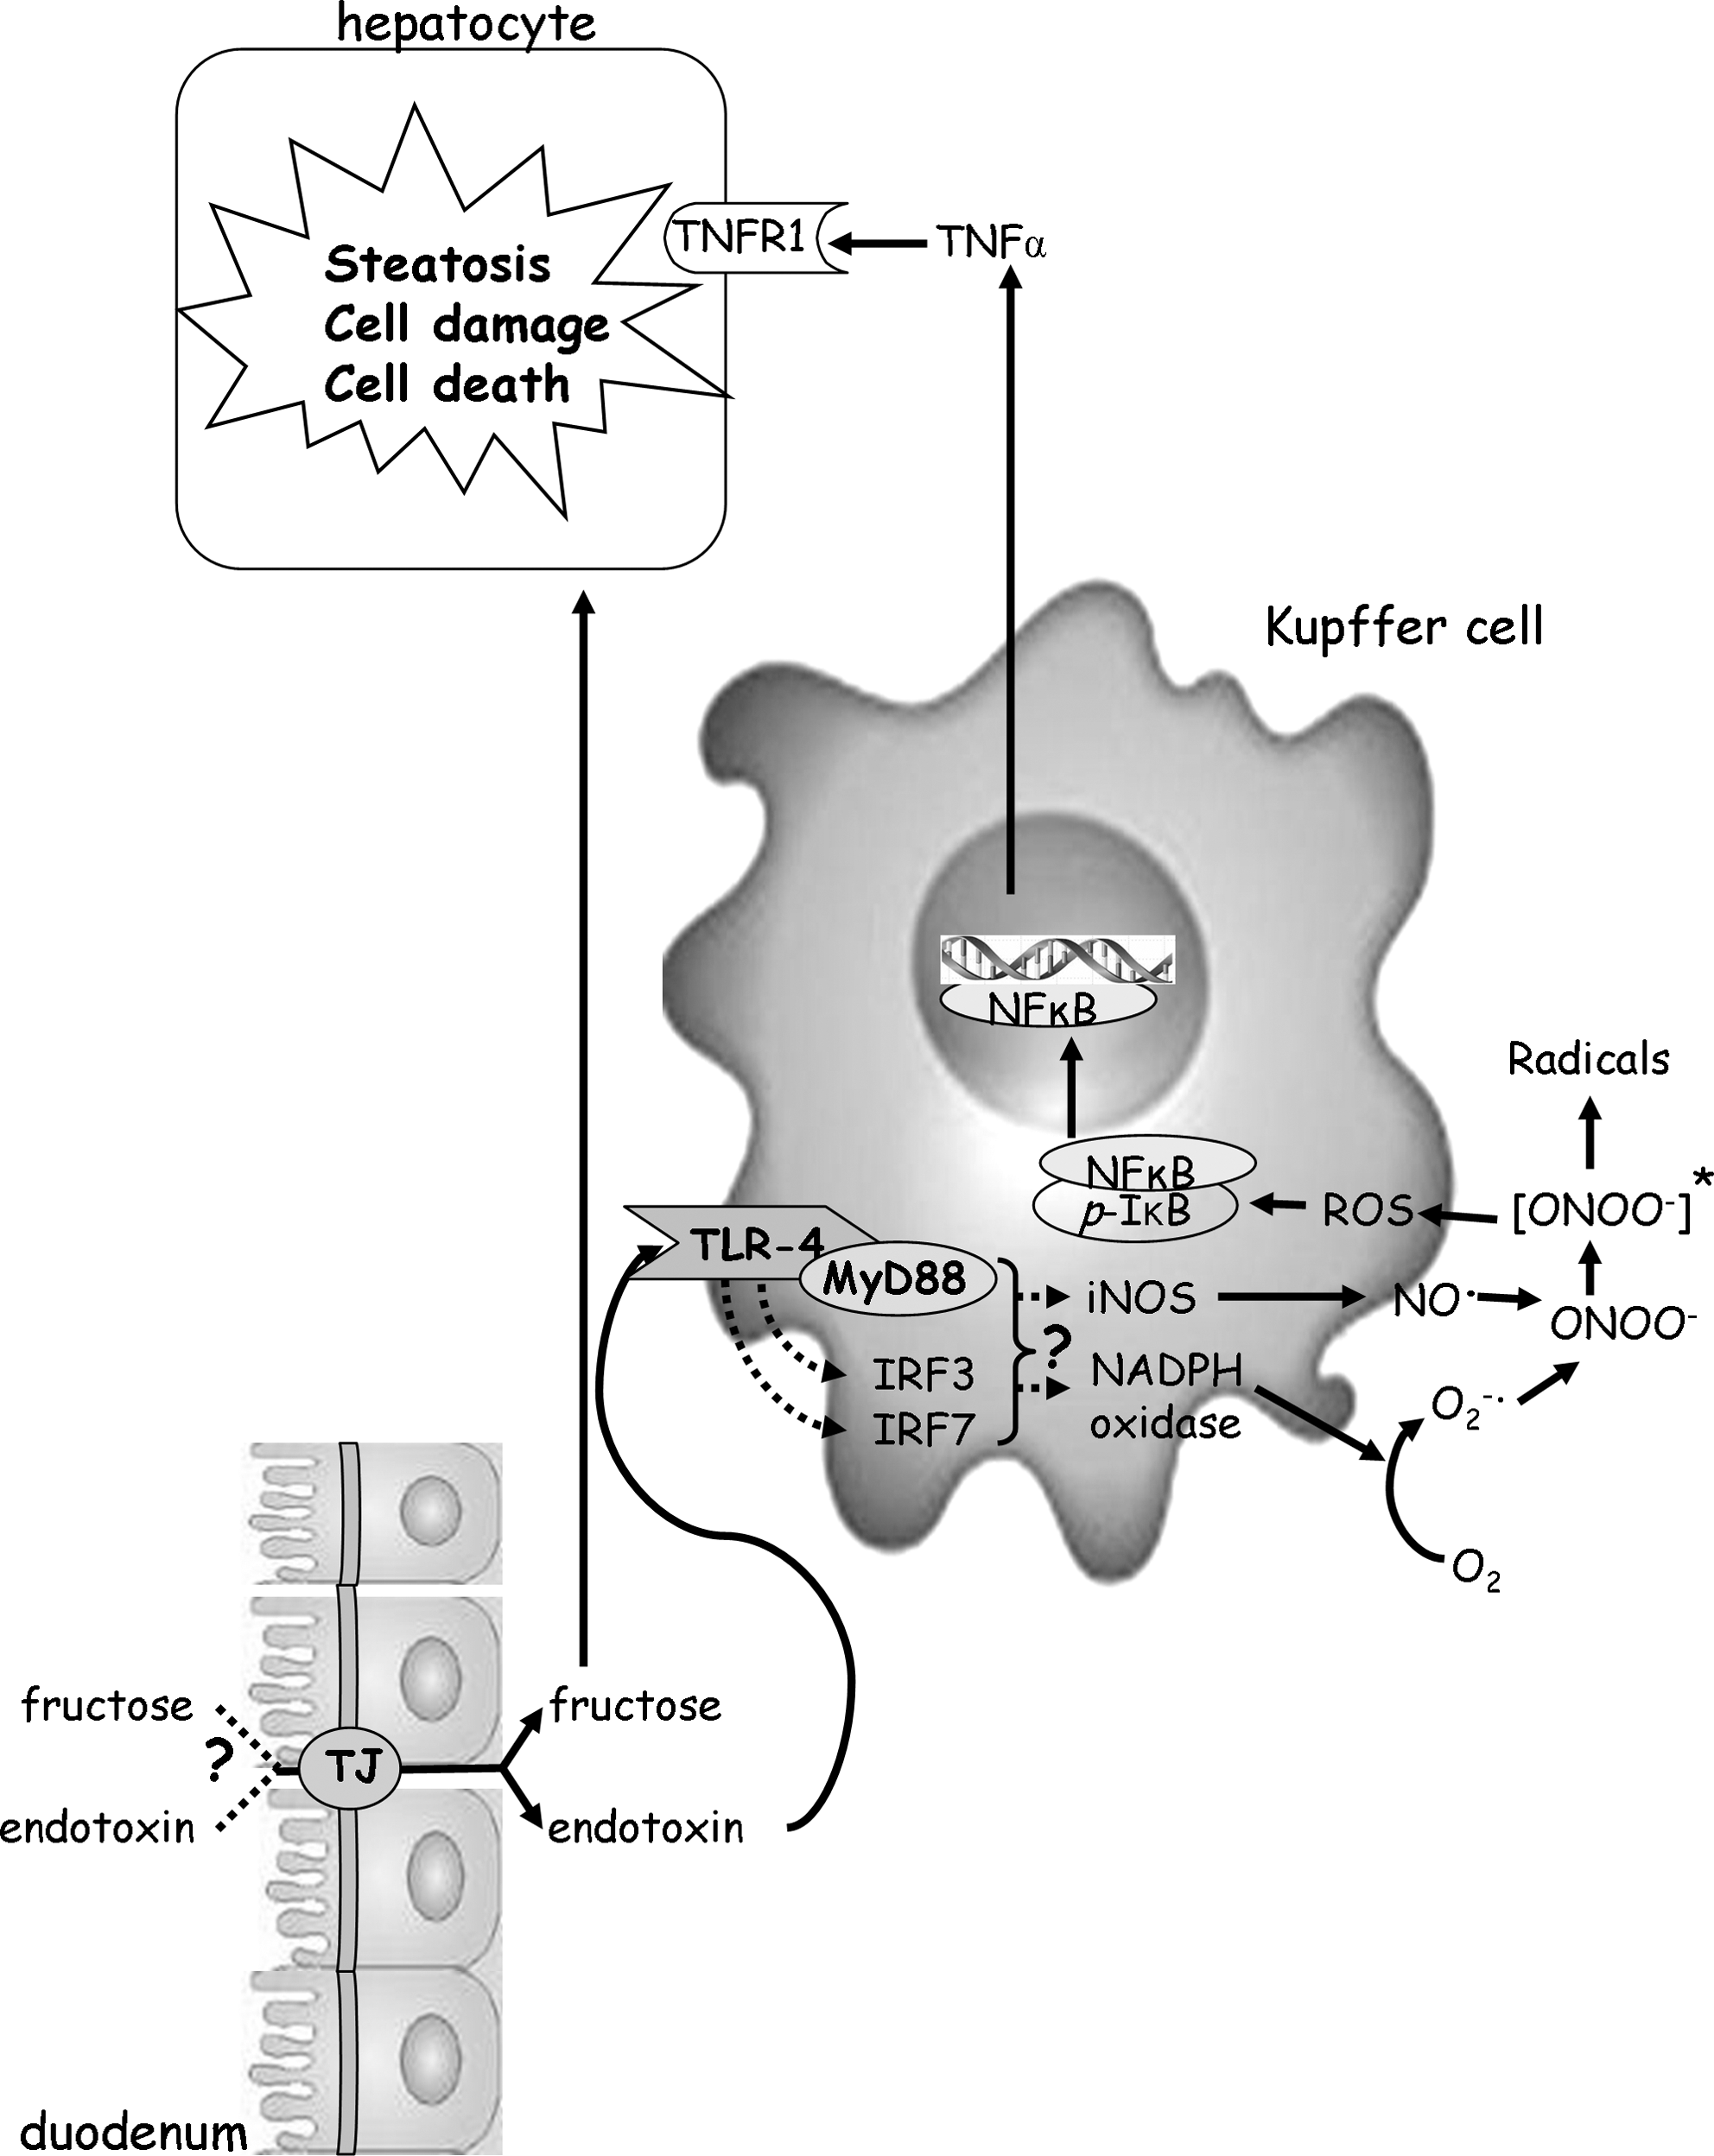
Taken together, the results of the present study add further weight to the hypothesis that the damaging effects of chronic fructose consumption may not solely be a result of an increased de novo lipogenesis. Rather, our results suggest that an increased formation of ROS is a key event in the onset of fructose-induced fatty liver. Our data further suggest that the activation of iNOS, probably resulting from the increased translocation of bacterial endotoxin and the subsequent induction of TLR-4-dependent signalling pathway, may at least in part be responsible for the increased formation of ROS found in onset of fructose-induced fatty livers. However, whether similar mechanisms are also applicable in the human situation remains to be determined.
Footnotes
Acknowledgments
This work was supported in part by grants from the German Research Foundation and the Federal Ministry of Education and Research (Grants BE 2376/4-1 [to I.B.] and 03105084 [to I.B.]).
Author Disclosure Statement
No competing financial interests exist.