




Abstract
Introduction
Innovation
Although apelin is expressed in hypothalamic neurons, nothing is known concerning its central effect in the control of glucose homeostasis. We demonstrate that apelin can modify hypothalamic neuron activity via an NO pathway and then control peripheral glycemia. Our results clearly show that central apelin has dose-dependent and pleiotropic effects depending on the nutritional state. Despite its beneficial effect observed at a low-dose level on glucose homeostasis, we suggest that a high dose of central apelin could be considered as a novel candidate for the transition from normal to diabetic state.
The receptor APJ is expressed in several hypothalamic structures (10, 32, 33), including major targets of hormonal, nervous, and metabolic signals (22) that can modify hypothalamic activity. Apelinergic neuronal cell bodies are located in the preoptic region, the hypothalamic supraoptic and paraventricular nuclei, and at highest density in the arcuate nucleus (33). Apelinergic nerve fibers are also found in hypothalamic structures including the ventromedial and dorsomedial hypothalamic nuclei (VMH, DM), arcuate nucleus (ARC), and median eminence (33). Interestingly, intracerebroventricular (i.c.v.) insulin injection has been shown to modify two major peripheral apelin signaling mediators, AMPK (31) and eNOS (5), leading to an increase in peripheral glucose utilization. Although the localization of apelinergic neurons is well documented, the role of brain apelin/APJ system on glucose metabolism remains unknown.
The objective of this study was to investigate the role of brain apelin in the control of whole body glucose homeostasis. Using acute i.c.v. injection, we show that central apelin controls peripheral glycemia, insulin secretion, and glucose and insulin tolerance in mice. Using amperometric nitric oxide (NO) real-time measurement in the hypothalamus, pharmacological and transgenic approaches, we demonstrate that the beneficial effects of i.c.v. apelin are mediated through a NO-dependent signaling pathway that is altered in both HFD obese/diabetic mice and after administration of an acute high dose of i.c.v. apelin. In accordance with these data, we show that chronic i.c.v. perfusion of a high dose of apelin triggers the onset of metabolic alterations associated with type 2 diabetes, including a decrease in insulin tolerance. Thus, our data provide novel insight into the role of apelin in the central regulation of glucose homeostasis, and identify apelin as a novel central factor mediating the transition from a normal to insulin resistant state at high levels.
Results
Dose-response effect on glycemia in response to i.c.v. apelin in fasted or fed mice
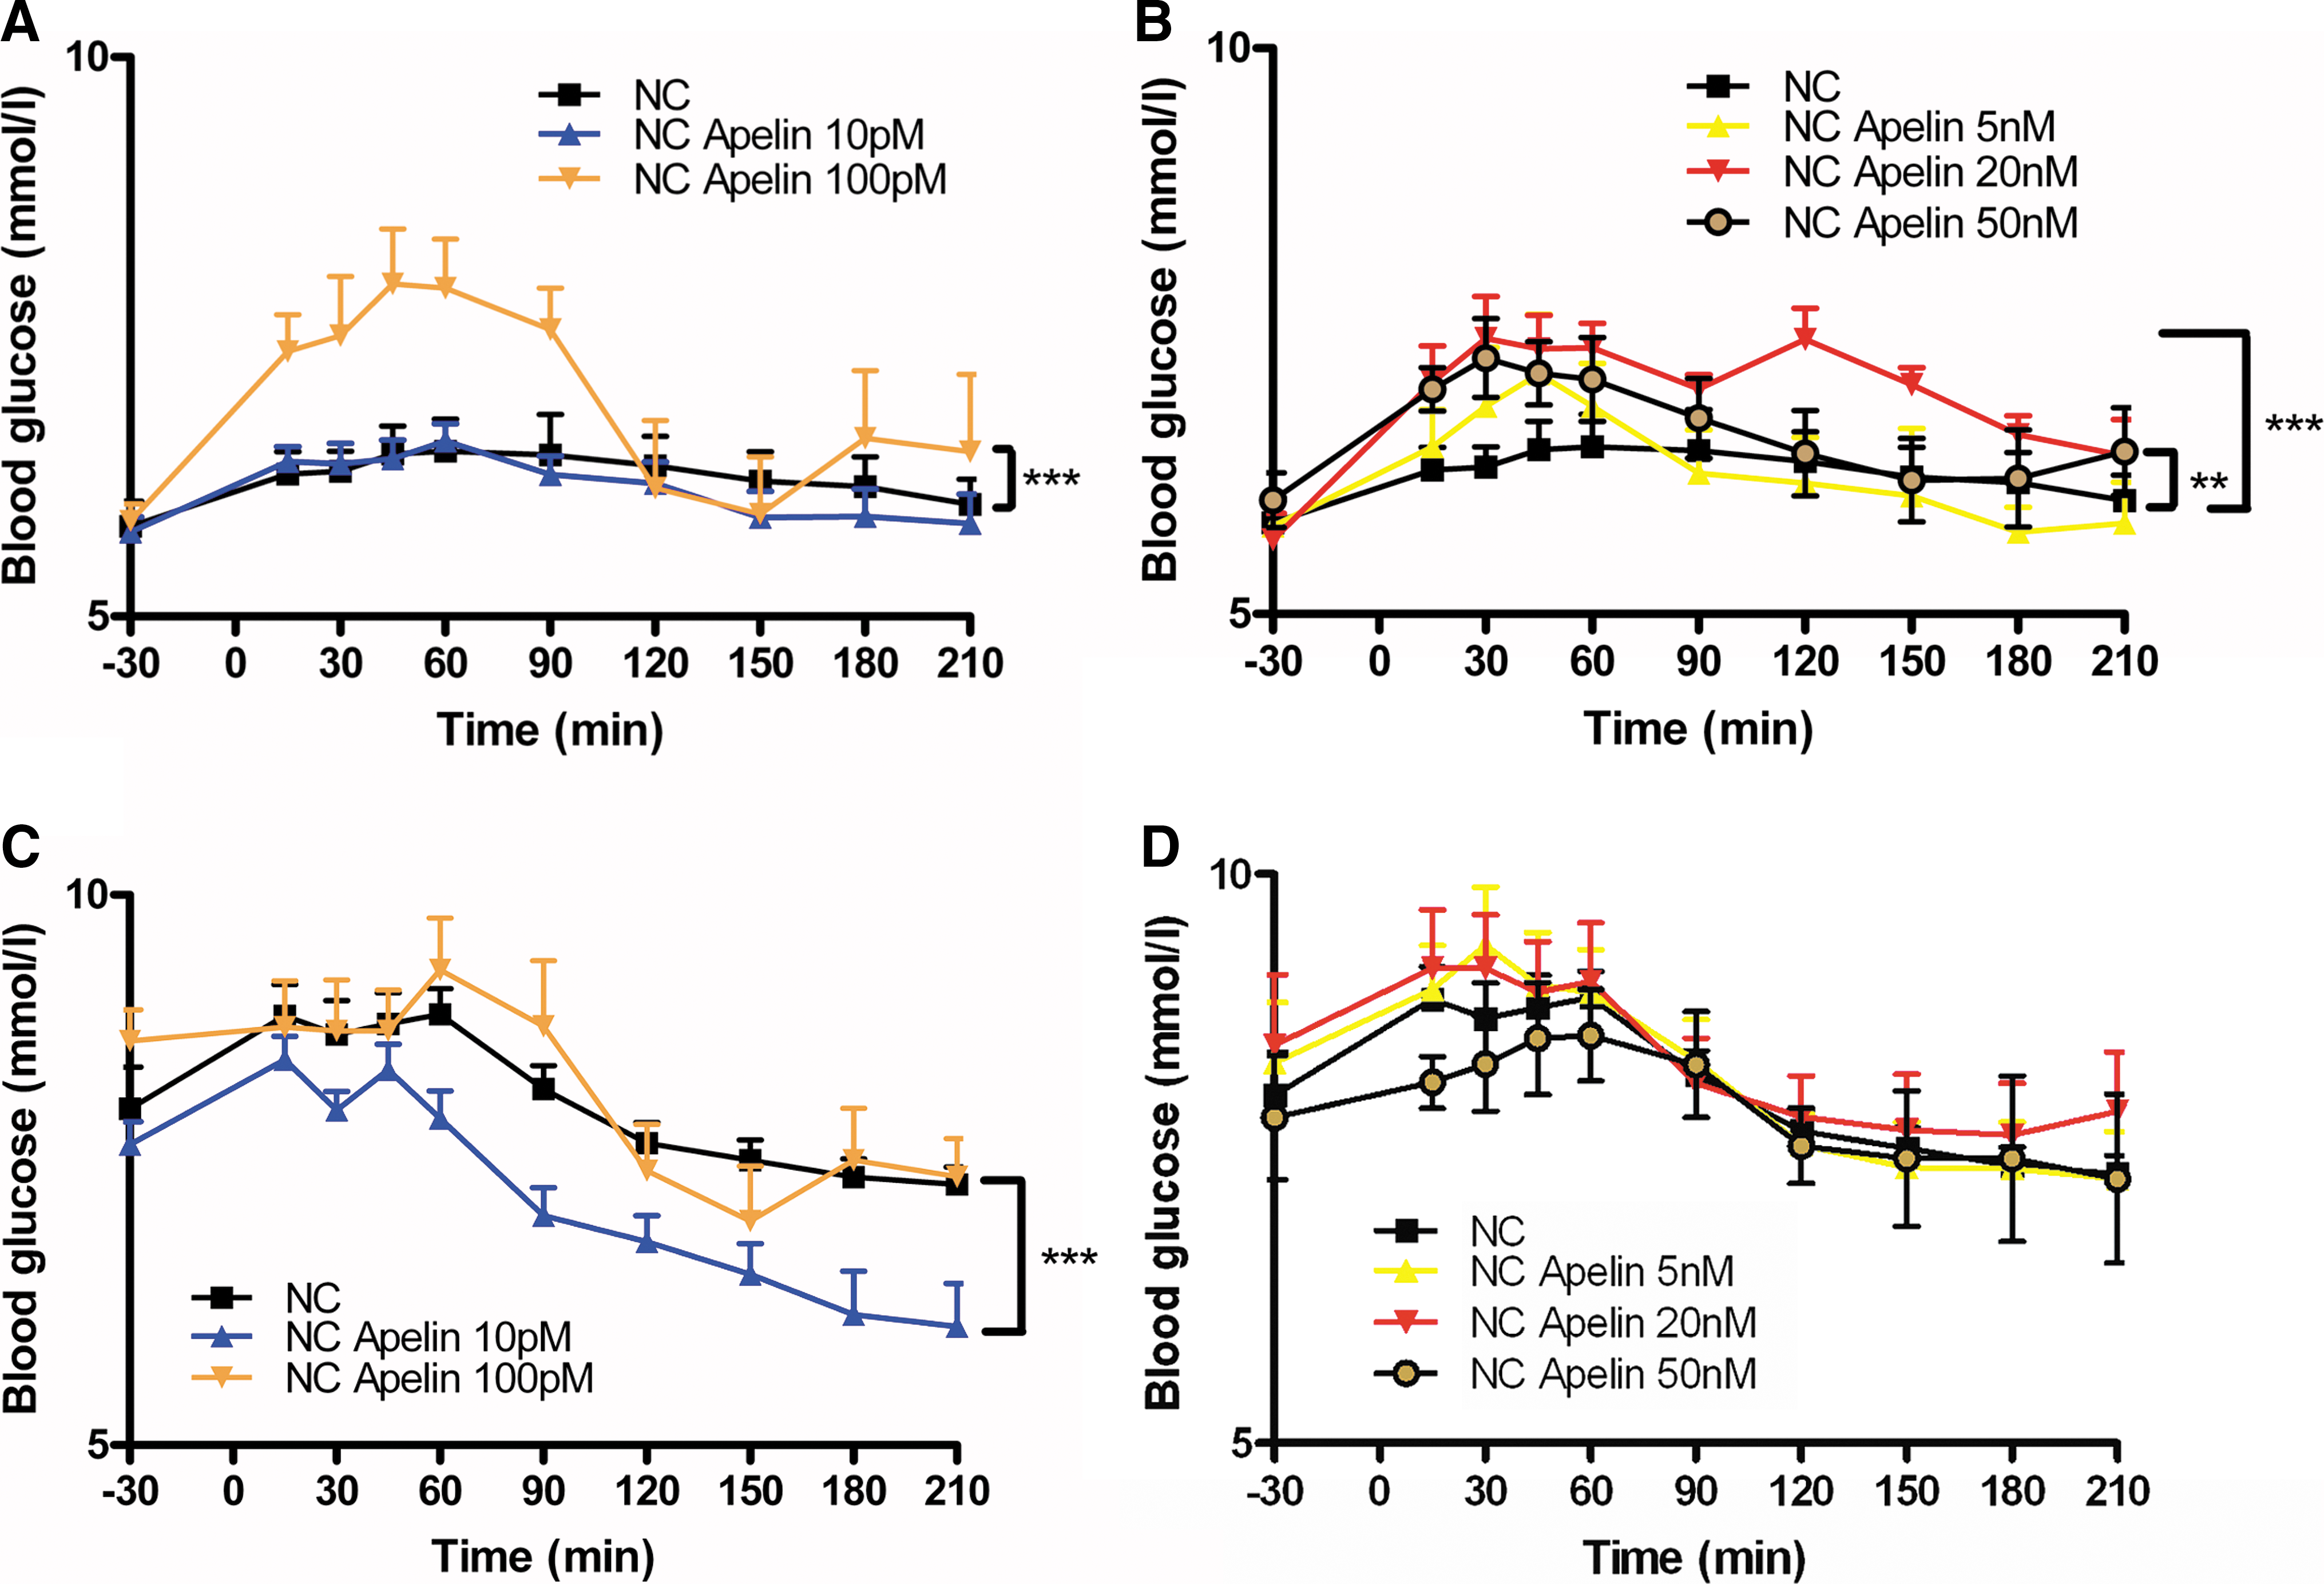
Several hormones, such as the incretin glucagon-like peptide 1, exert their action only in hyperglycemic but not in euglycemic conditions (4). Based on this physiological finding, we speculate that apelin may exert an effect depending of the nutritional state. In accordance with this hypothesis, we found that high-dose of i.c.v. apelin increased glycemia in the fasted state (Figs. 1A and 1B) but not in the fed state (Figs. 1C and 1D). At the opposite, low-dose of i.c.v. apelin had no effect on fasted state (Fig. 1A), but decreased glycemia in fed conditions (Fig. 1C). Two doses (2 μl of 10 pM corresponding to 20.10−3 fmol, or 2 μl of 20 nM corresponding to 40 fmol) were selected for this study in respect to their effects on glycemia (Fig. 1). The first one (called “low-dose (LD)” in the text) was selected for its effect on fed glycemia, whereas the second one (called “high-dose (HD)”) for its fasted hyperglycemic effect. The high dose (HD) of apelin (2 μl of 20 nM) corresponds approximately to half the quantity of total tissue apelin found in C57bl6 mouse hypothalamus (74±4 fmoles per hypothalamus). These doses of apelin-13 injected iv did not modify blood glucose or insulin concentration (unpublished personal data).
Effect of acute i.c.v. LD apelin injection on peripheral glucose metabolism in physiological and pathophysiological conditions
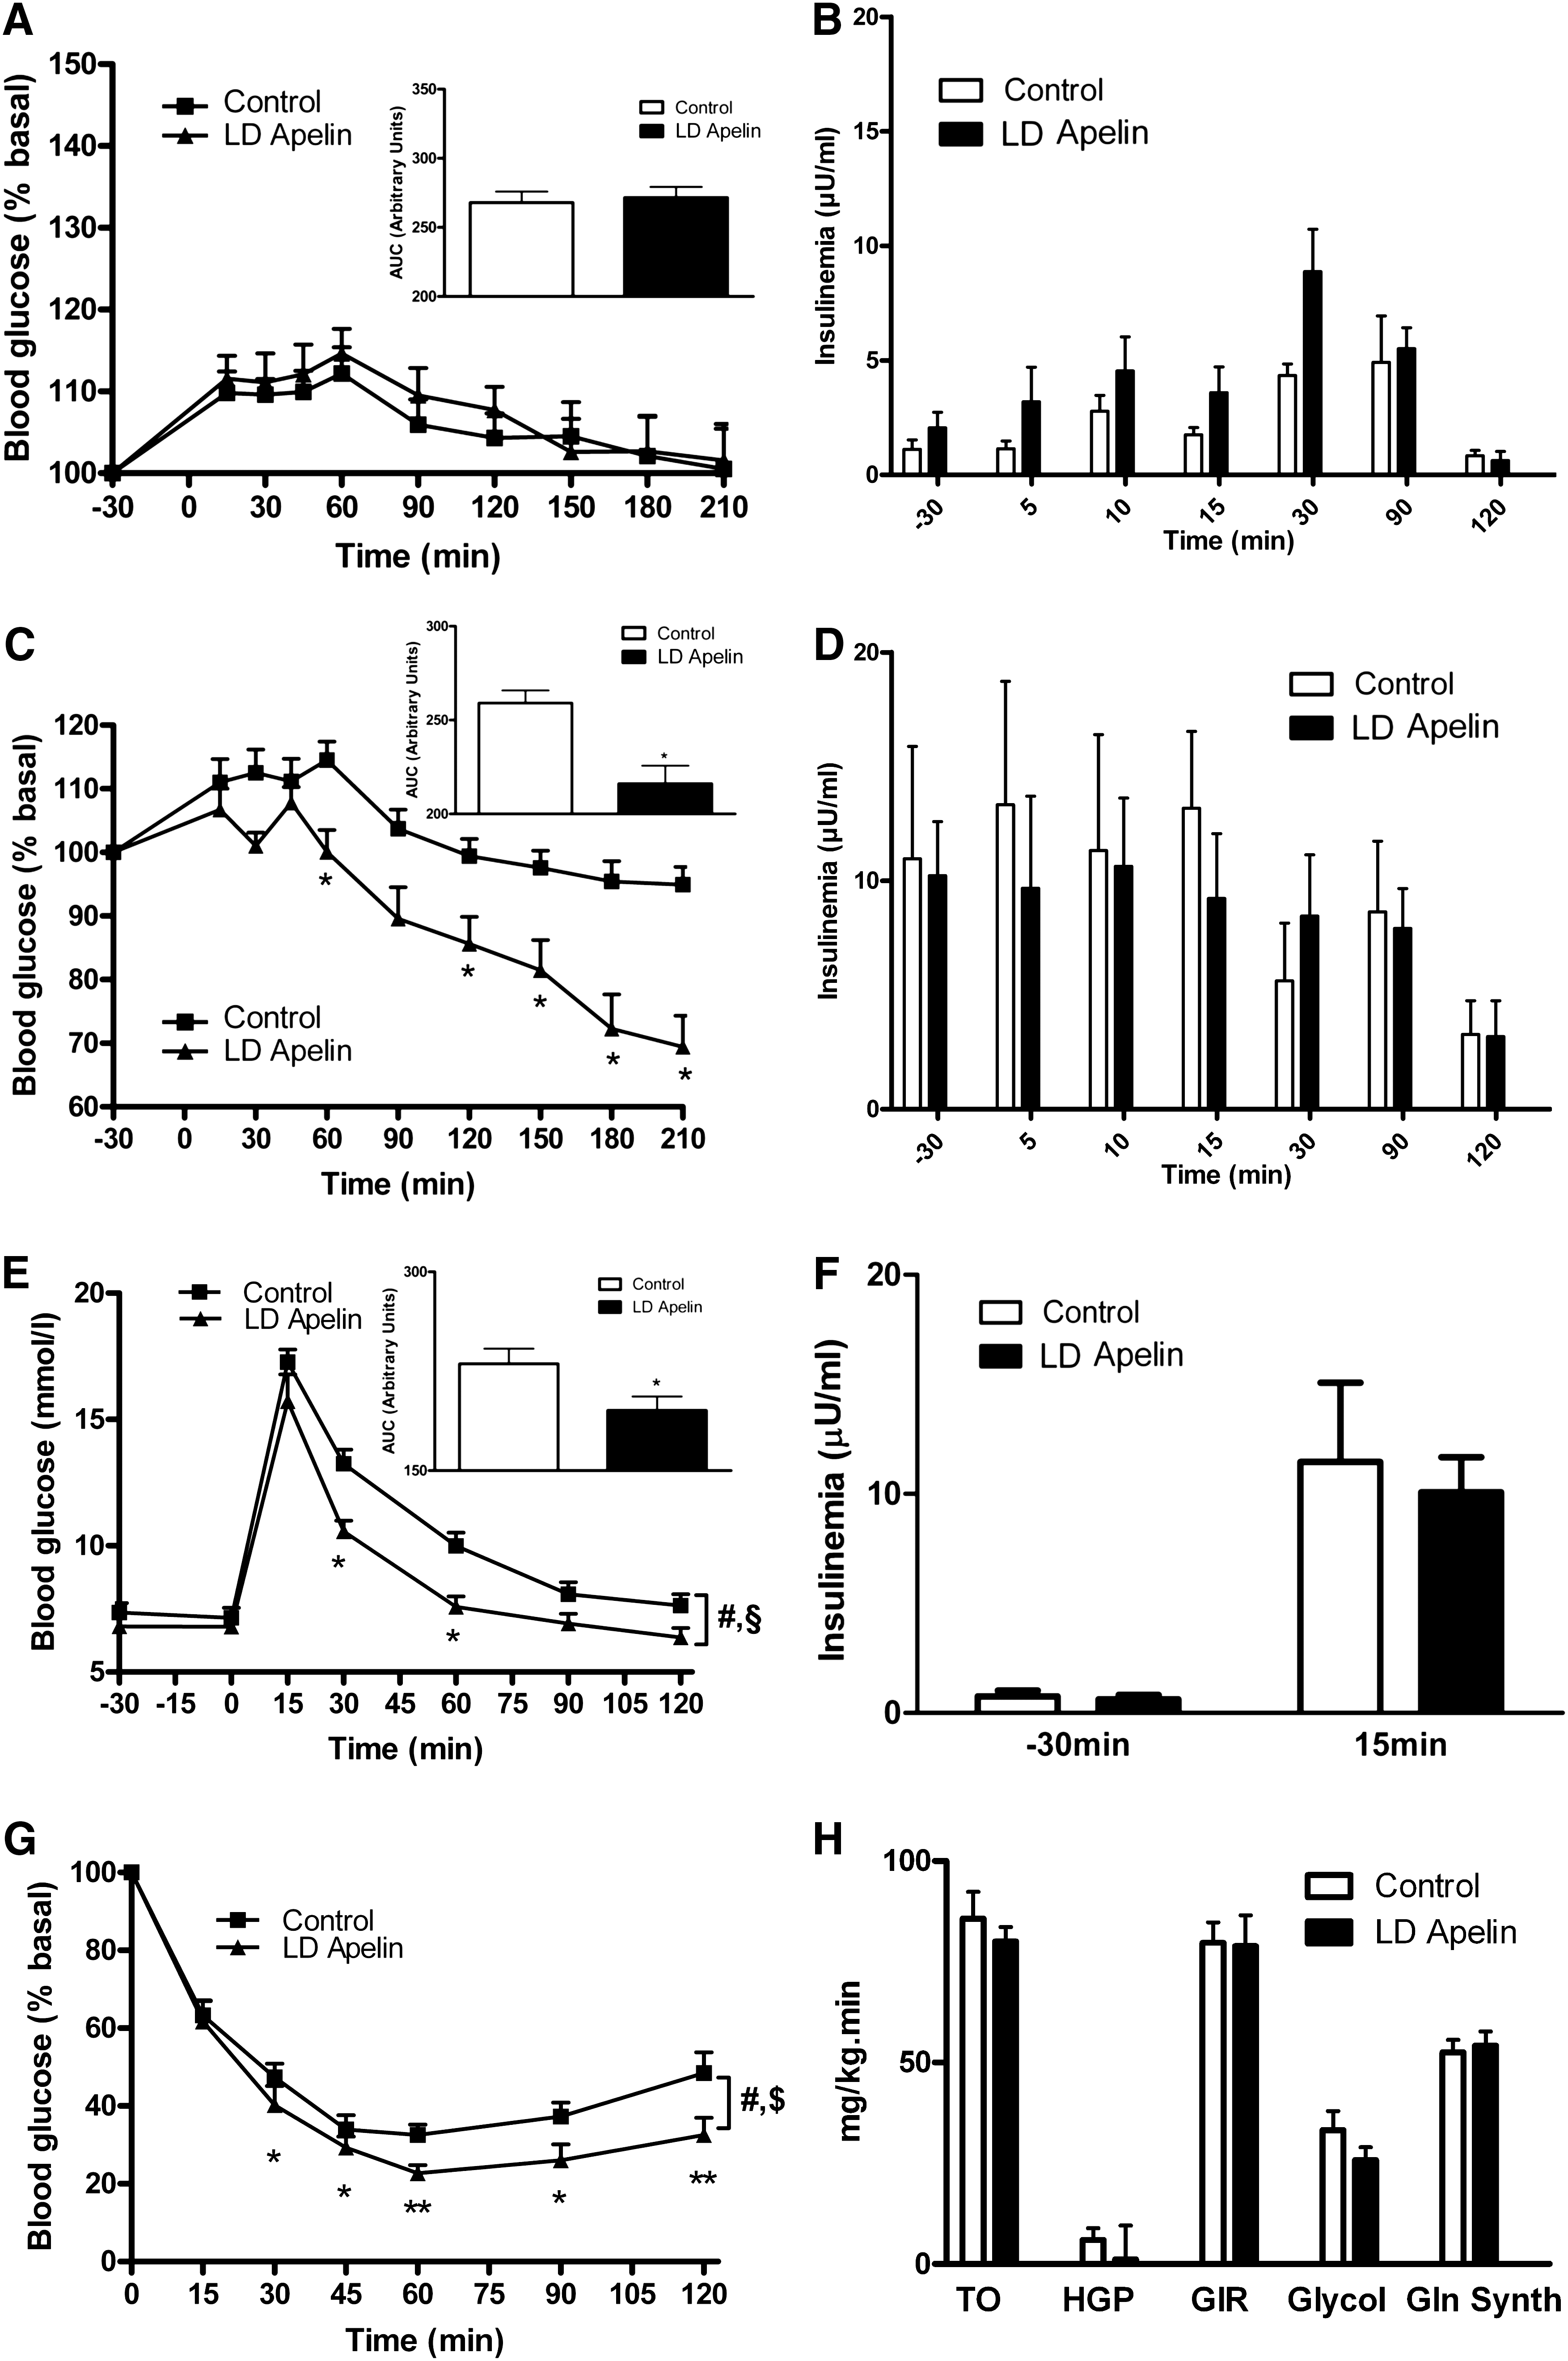
In the fasted state, i.c.v. LD apelin injection did not significantly affect glycemia (Fig. 2A) and insulinemia (Fig. 2B). In the fed state, i.c.v. LD apelin induced a significant decrease in glycemia from 60 to 210 min (Fig. 2C), without altering insulin profiles (Fig. 2D). Further, LD apelin treatment significantly improved glucose tolerance in response to an oral glucose bolus (Fig. 2E). In keeping with the measures made during the fed state, insulin levels remained unchanged (Fig. 2F). Then, we performed an insulin tolerance test (ITT) at supraphysiological insulin dose (1 mU/g) and found that i.c.v. LD apelin-treated mice were more insulin tolerant compared to control (Fig. 2G). Nevertheless, euglycemic hyperinsulinemic clamp studies performed at physiological insulin levels (2.5 mU/kg/min) did not show any modification of the peripheral insulin sensitivity. Indeed, no modification of glucose turnover, hepatic glucose production, glucose infusion rate, glycolysis and glycogen synthesis (Fig. 2H) were observed in i.c.v. LD apelin-treated mice.
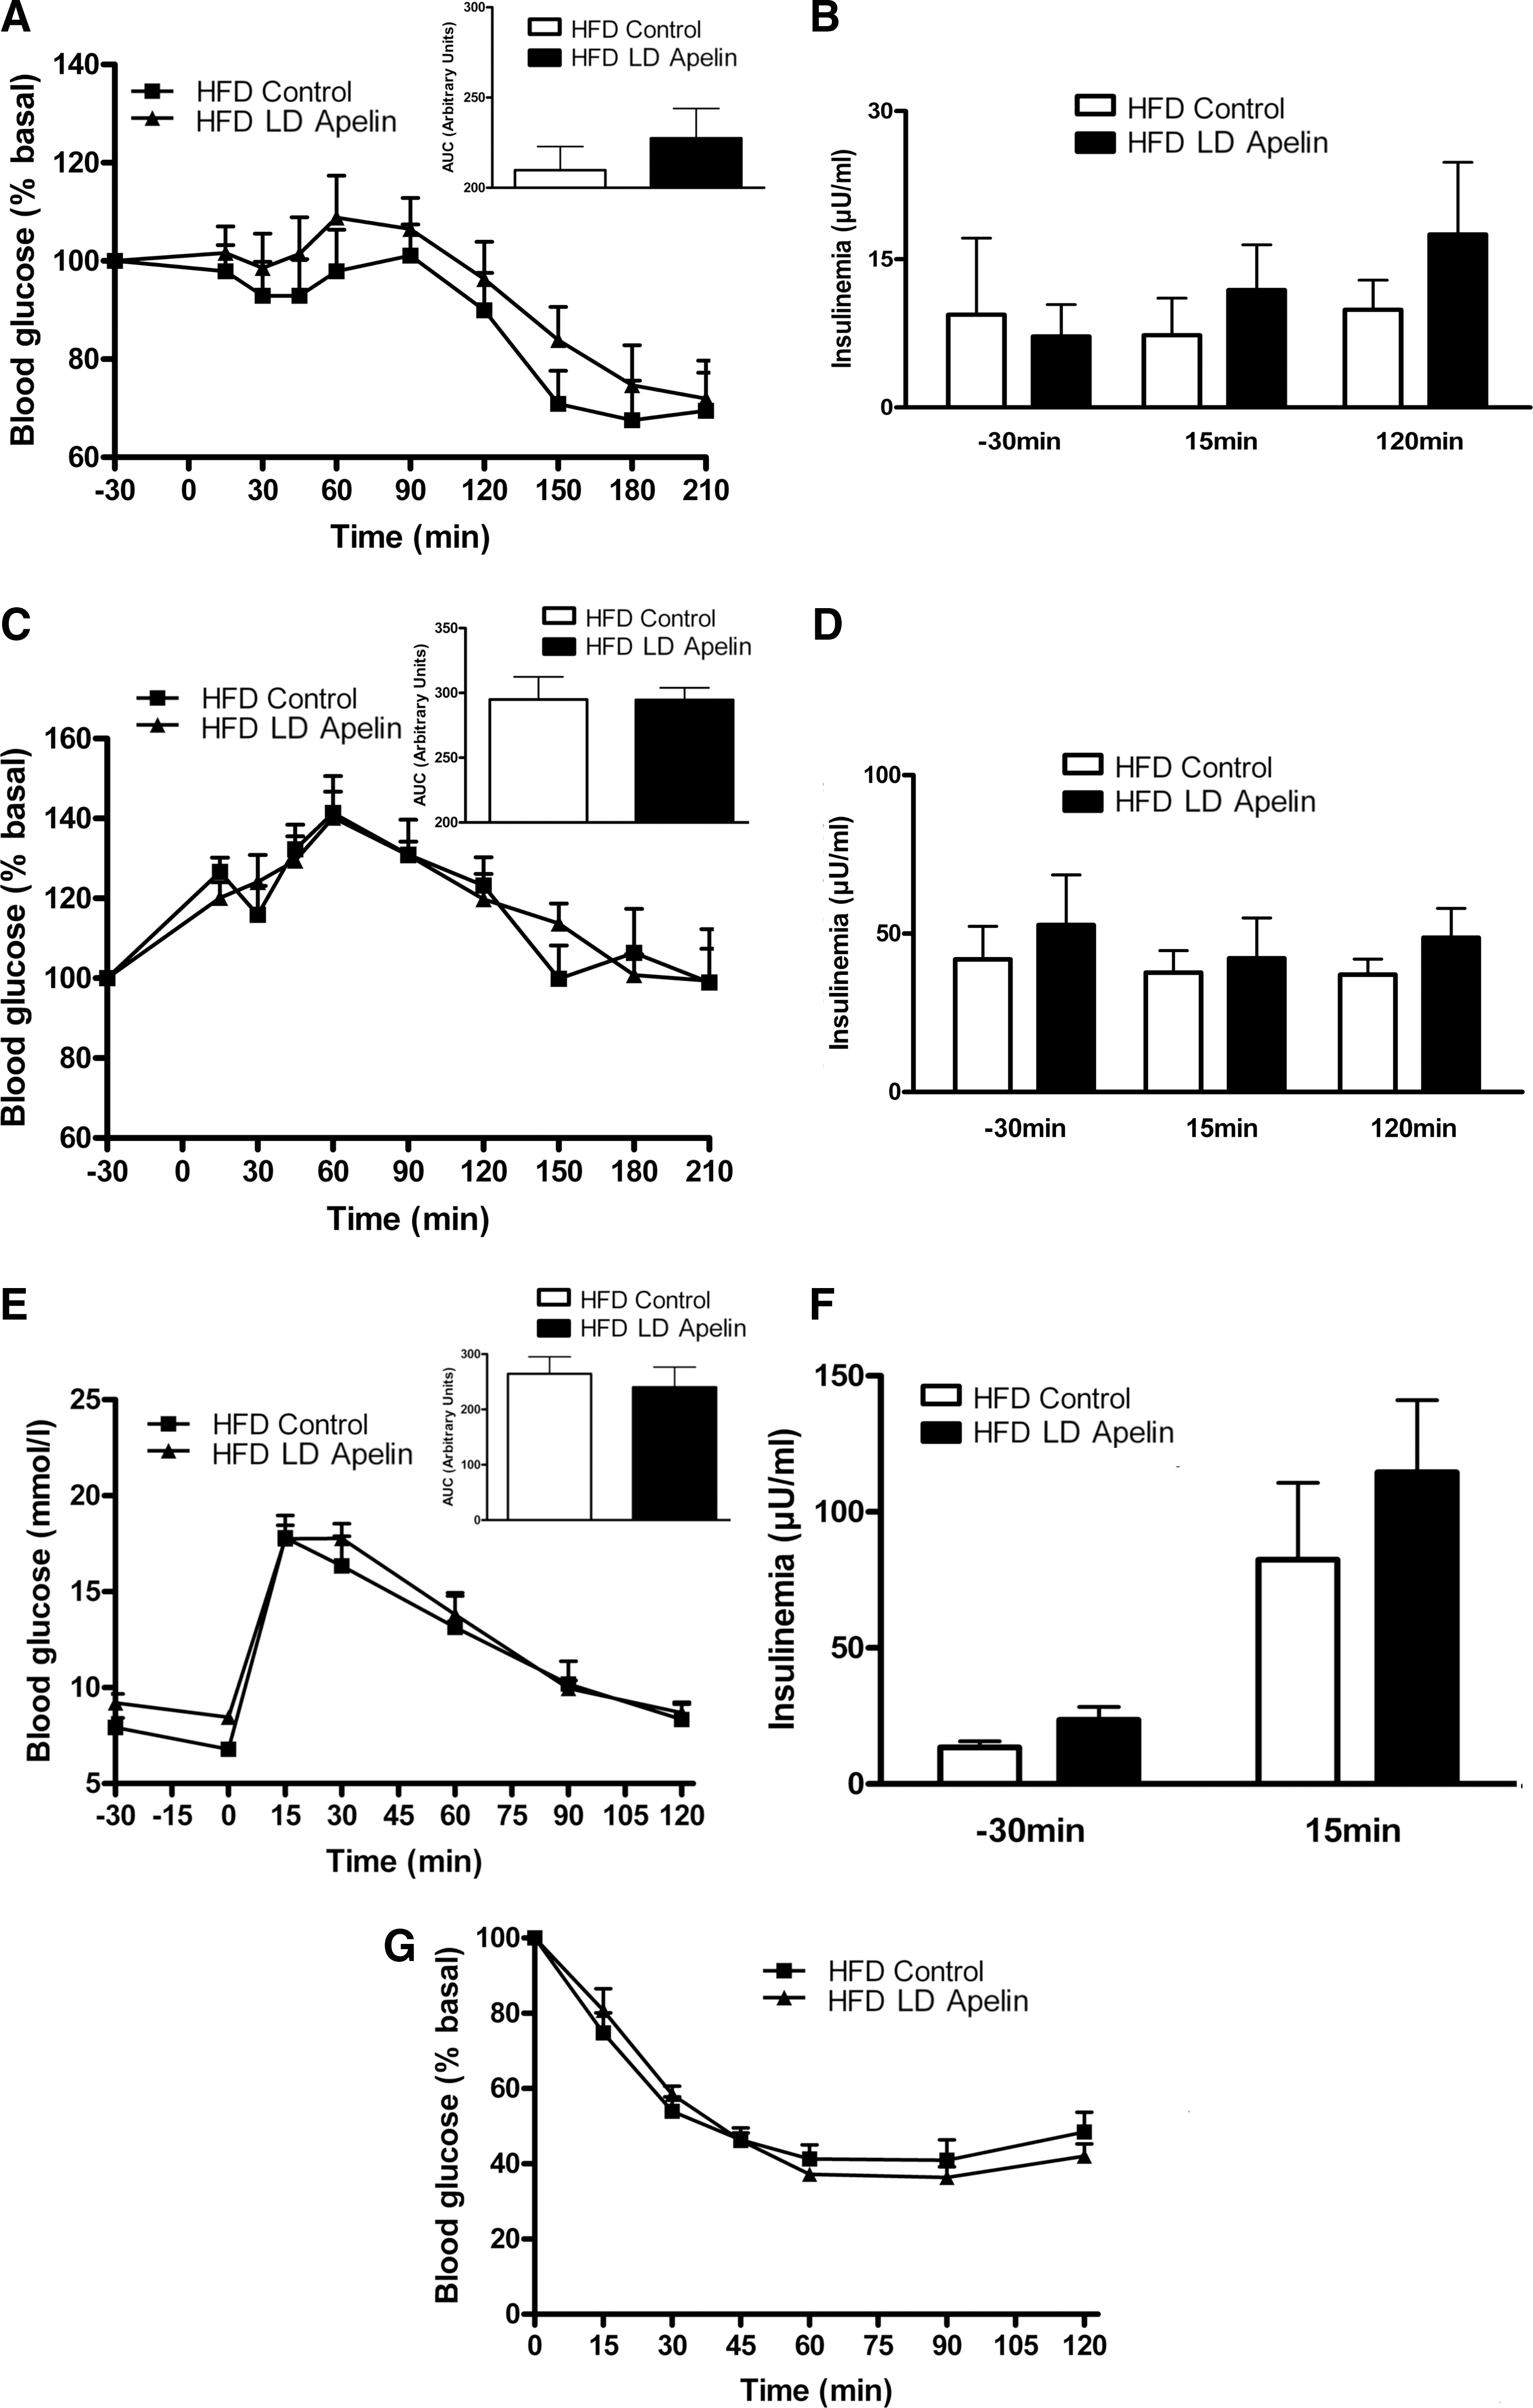
Given that during obese/diabetic states, resistance to central regulators of metabolism is often observed (30), we perfused i.c.v. LD apelin in HFD obese/diabetic mice. In the fasted state, i.c.v. LD apelin injection did not modify glycemia (Fig. 3A) and insulinemia (Fig. 3B). The potential improvement of glucose homeostasis of i.c.v. LD apelin was completely abolished in HFD conditions. Indeed, fed glycemia (Fig. 3C) and insulinemia (Fig. 3D), glucose tolerance (Figs. 3E and 3F) and insulin tolerance (Fig. 3G) of HFD i.c.v. treated LD apelin mice were similar to HFD control mice.
Circadian variations of plasma apelin levels in NC and HFD mice
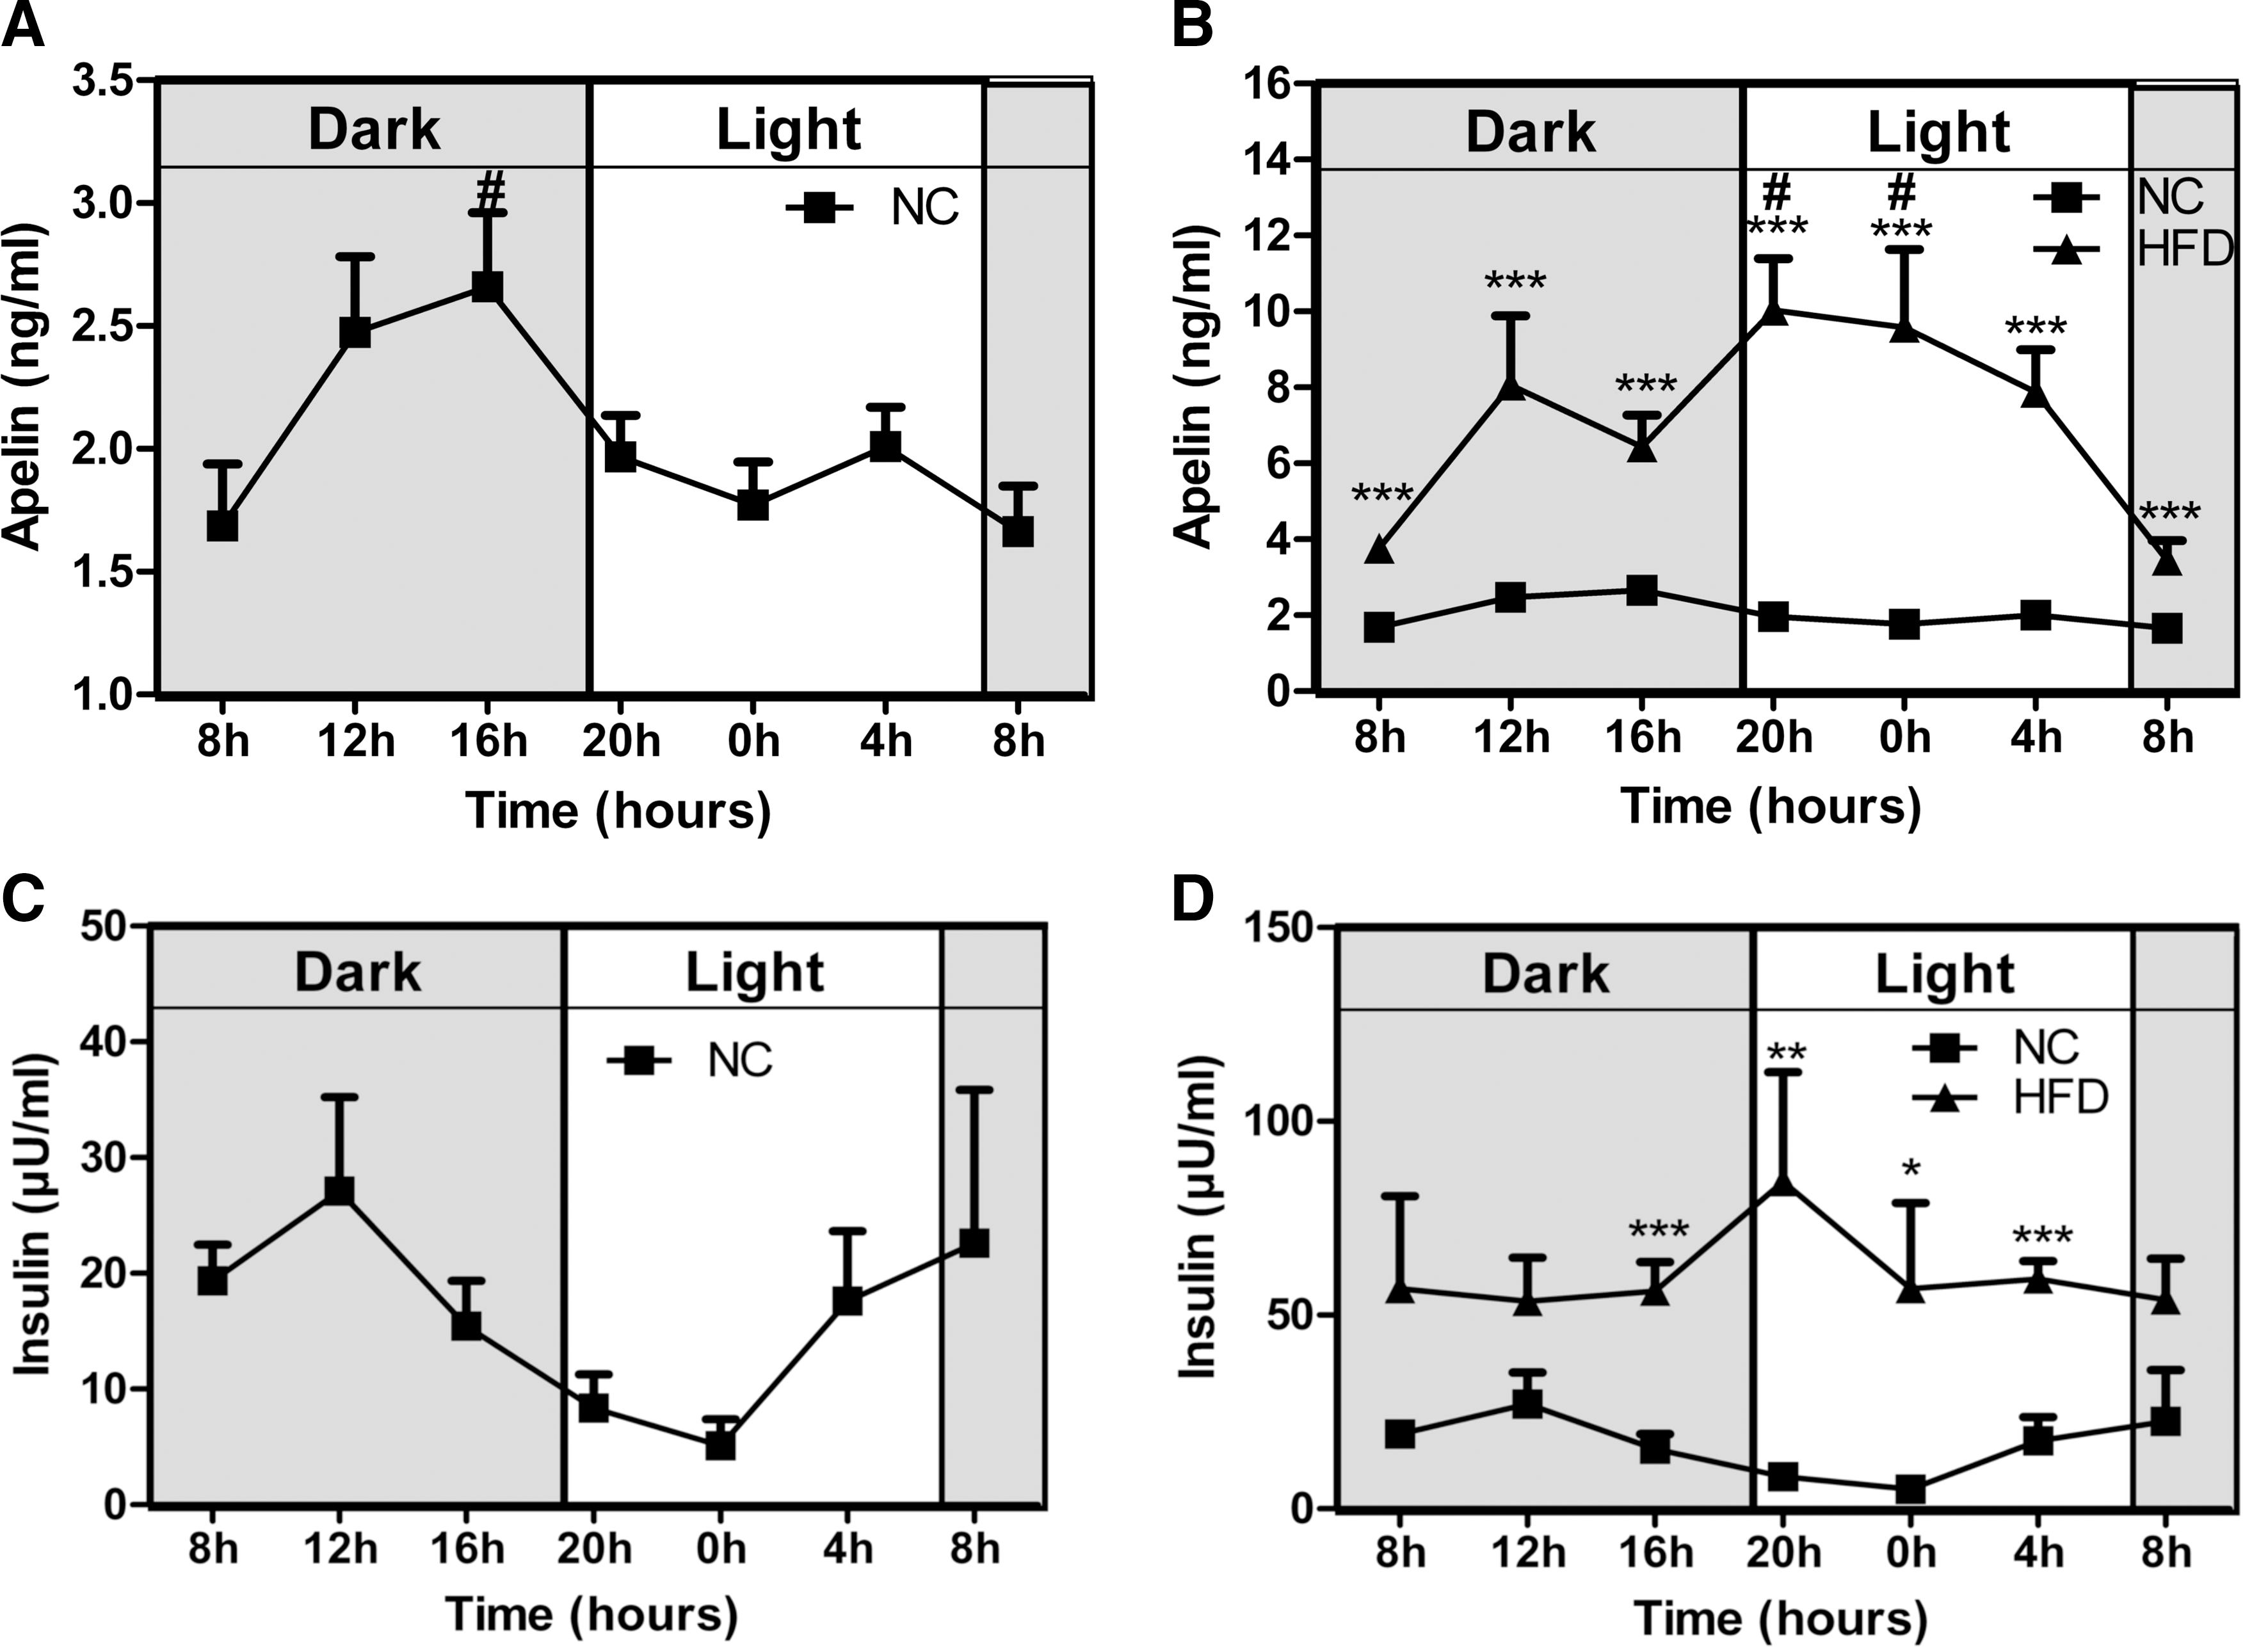
We observed that i.c.v. LD apelin failed to improve glucose homeostasis parameters in HFD mice. One explanation for this result could be that hypothalamus, a circumventricular structure where the blood–brain barrier displays physiological modifications (35), may be differentially stimulated by circulating apelin. In accordance with this hypothesis, we measured circadian variations of plasma apelin levels in physiological and physiopathological states. Plasma apelin levels in NC mice followed a circadian rhythm with an increase during the dark period (corresponding to the fed period) (Fig. 4A). In contrast to NC mice, HFD mice showed a deregulation of this rhythm since apelin plasma levels increased significantly during the entire day (Fig. 4B). As expected, plasma insulin levels follow a similar profile to those of apelin (Figs. 4C and 4D). This set of experiments supports the hypothesis that high levels of plasma apelin could contribute to brain neuronal alterations observed in obese/diabetic state.
Effect of acute i.c.v. of HD apelin injection on peripheral glucose metabolism in physiological and physiopathological conditions
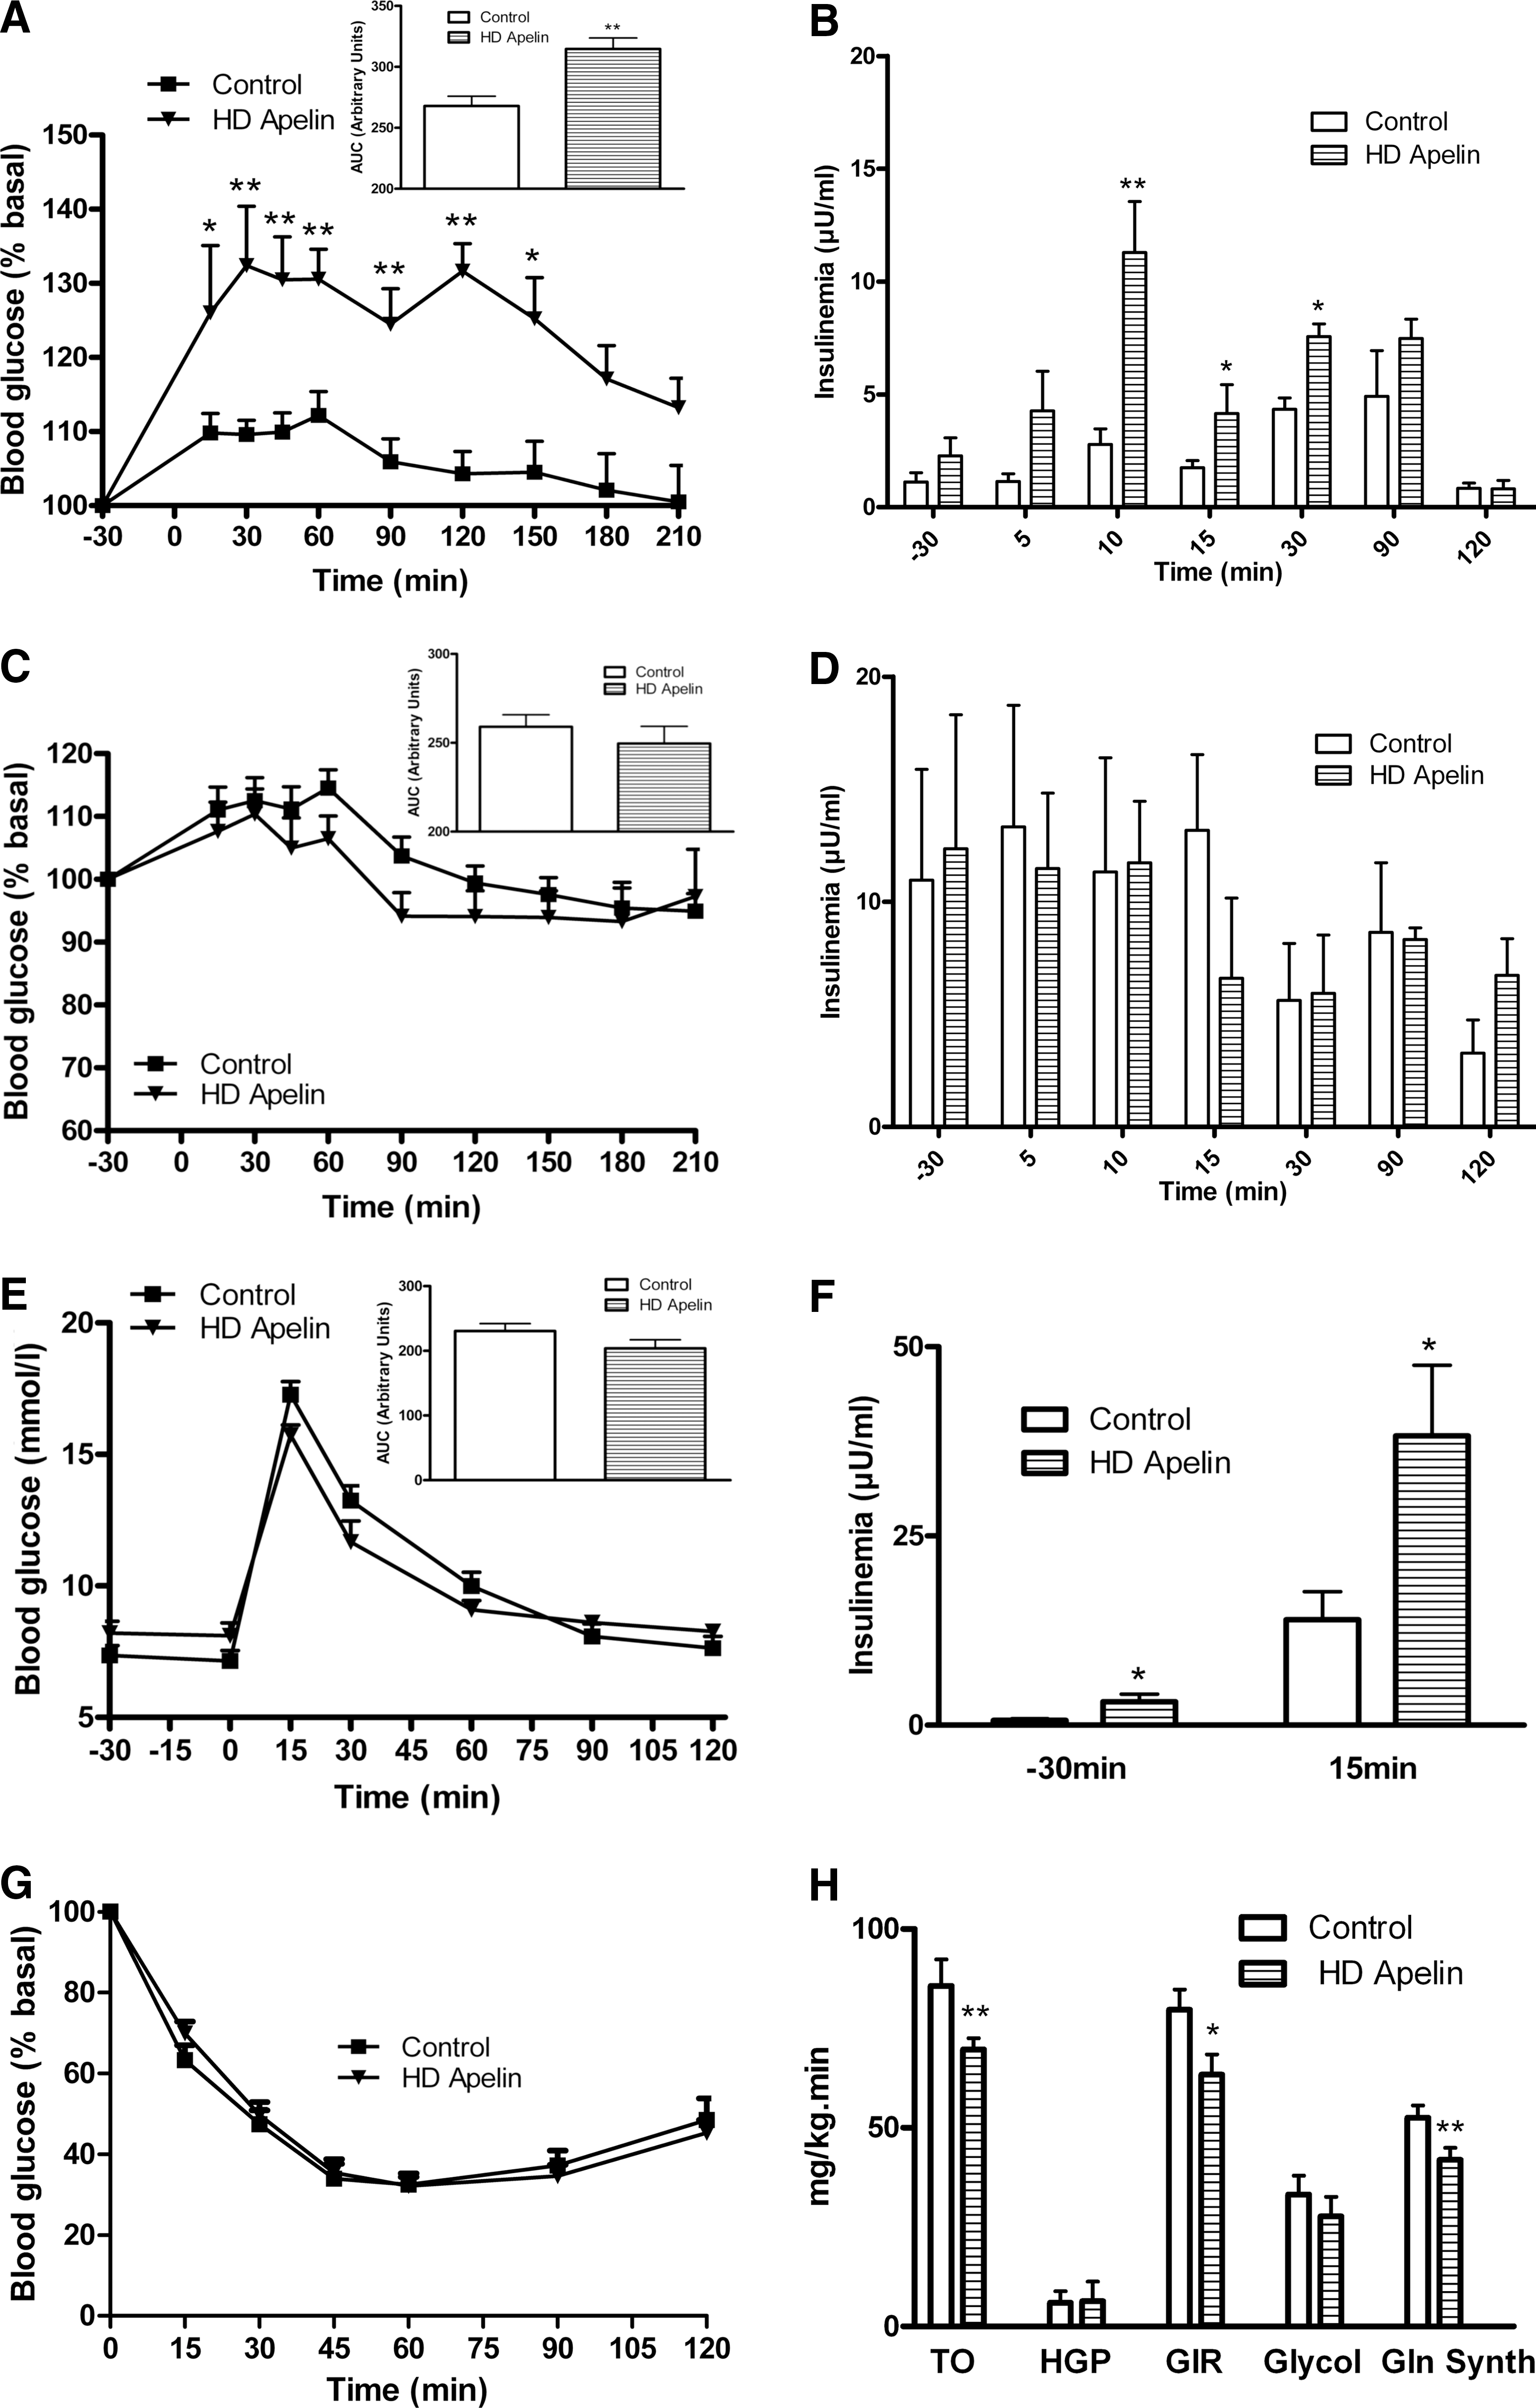
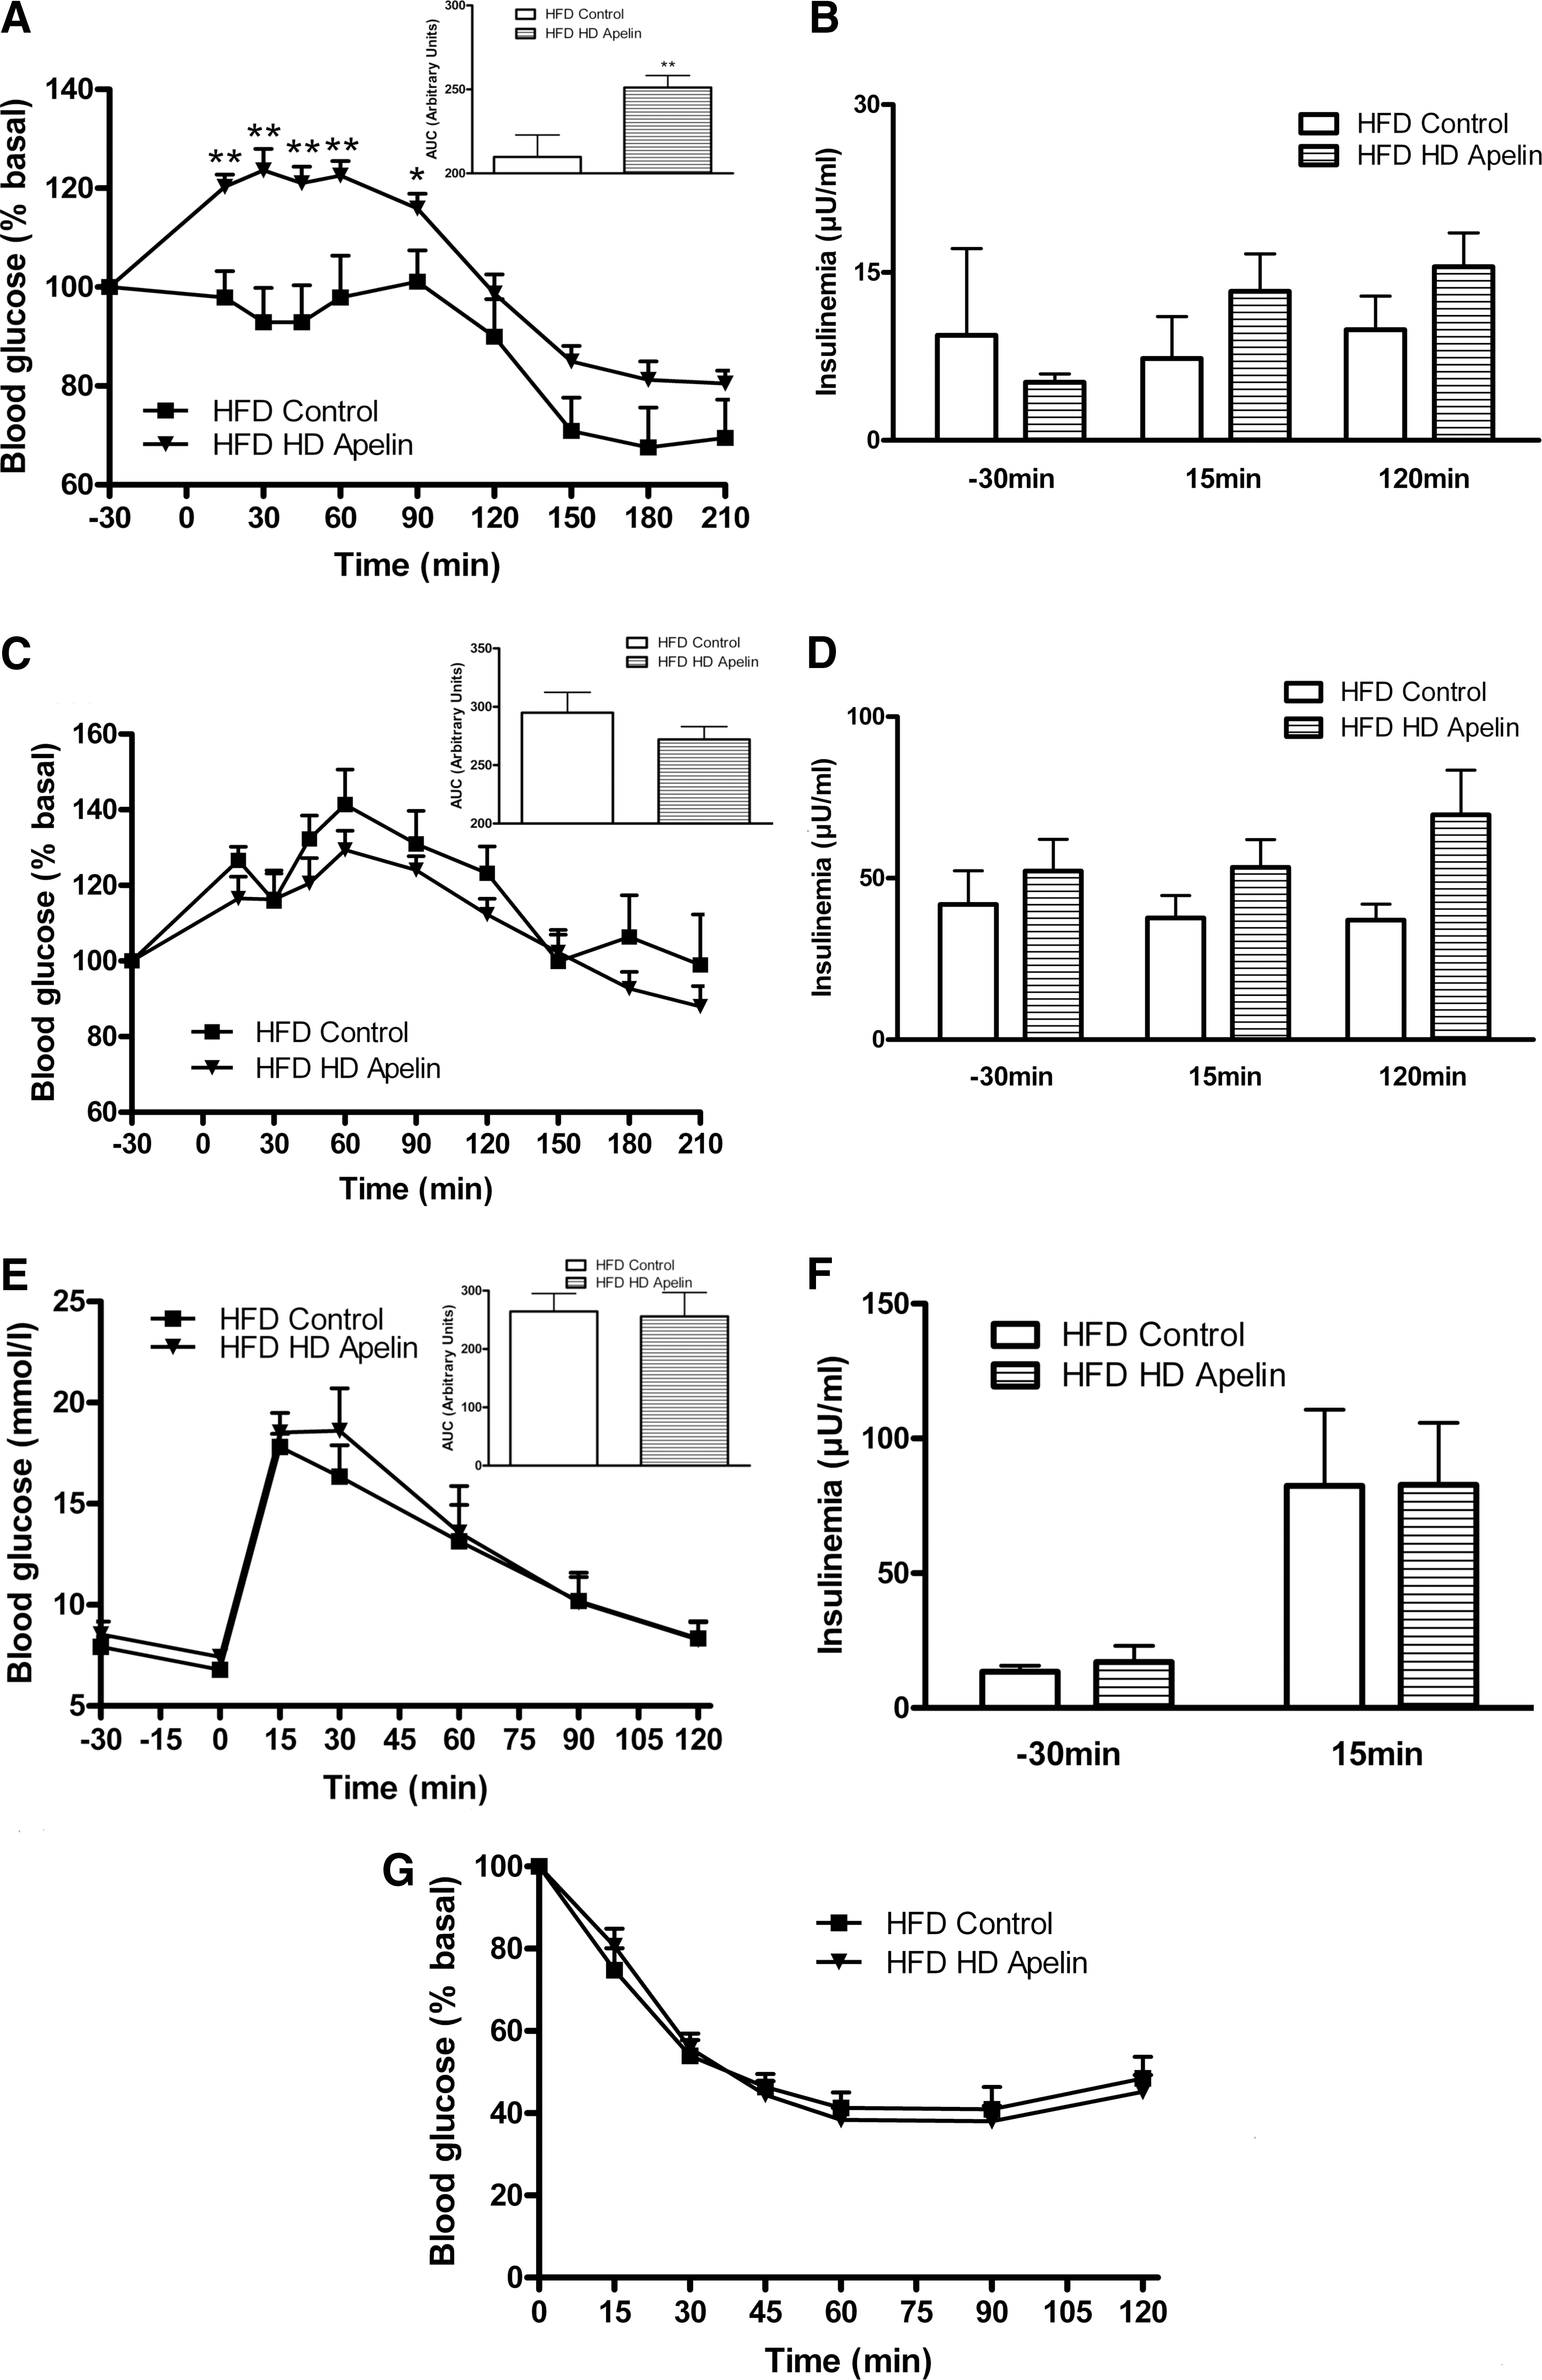
As HFD mice showed altered circadian plasma apelin concentrations, we speculated that HD apelin could modify the physiological response of the brain. Acute i.c.v. HD apelin increased peripheral glycemia (Fig. 5A) and insulinemia (Fig. 5B) in fasting normal mice. No significant variation of glycemia (Fig. 5C) and insulinemia (Fig. 5D) were observed in the fed state in response to i.c.v. HD apelin. Glucose tolerance was not modified in i.c.v. HD apelin treated mice compared to control (Fig. 5E), but was associated with a significant increase in insulinemia (Fig. 5F), suggesting a moderate insulin resistance state. Besides the fact that we did not observe any modification of the insulin tolerance upon supraphysiological insulin administration during ITT (Fig. 5G), euglycemic hyperinsulinemic clamp performed at physiological insulin dose confirmed that i.c.v. HD apelin promotes insulin resistance. Indeed, i.c.v. HD apelin decreased whole-body insulin sensitivity, as shown by the reduced glucose infusion rate and glucose turnover. This phenomenon was associated with a lower glycogen synthesis (Fig. 5H), whereas the other parameters were not affected. Because plasma apelin levels were increased during obesity and since we observed that injection of i.c.v. HD apelin induced hyperglycemia and hyperinsulinemia in NC mice, we investigated the effect of HD apelin i.c.v. injection in a HFD diabetic/obese mice model (12). In response to HD apelin, glycemia was significantly increased during fasting (Fig. 6A) without modification of insulinemia (Fig. 6B). Fed glycemia/insulinemia (Figs. 6C and 6D), glucose/insulin tolerance (Figs. 6E–6G) were not modified by acute i.c.v. HD apelin in HFD mice.
Variation of c-Fos expression in the hypothalamus in response to acute apelin injection in physiological conditions
Modifications of glycemia/insulinemia in response to acute i.c.v. apelin varied according to the injected dose and the nutritional state, raising the possibility that distinct hypothalamic regions were responsible for these effects. To test this hypothesis, we measured c-Fos expression in three major hypothalamic regions implicated in glucose metabolism under the previously tested conditions (22). I.c.v. bolus injection of LD apelin significantly increased c-Fos expression in the VMH and DM under fasting conditions, and only in the DM in the fed state in NC mice (Figs. 7A and 7B). c-Fos expression is significantly increased in the VMH and decreased in the ARC of HD apelin-treated mice in the fasted state (Fig. 7A). I.c.v. bolus injection of HD apelin did not modify c-Fos expression in studied hypothalamic regions (Fig. 7B). These data suggest that beneficial vs. deleterious effects of apelin may be explained by differential activation of hypothalamic regions. Thus, high quantity of apelin in the hypothalamus may be a crucial element to the establishment of a diabetic state.

Hypothalamic NO as a potential target to brain LD apelin
Given that hypothalamic NO is implicated in the control of glucose homeostasis (36) and NO is a major effector of apelin signaling in the periphery (12), we measured real-time NO release ex vivo in the hypothalamus in response to LD apelin. No significant variation on NO release was observed in hypothalamic slices removed from fasting animals (Fig. 8A). Delta variation of NO release from basal are similar to that observed previously (16). In fed state, LD apelin rapidly increased NO release from hypothalamic slices from 2 to 15 minutes (Fig. 8B). On hypothalamic explants, HD apelin did not increase NO release in fasting conditions (Fig. 8C), and failed to increase continuously NO release during the 20 minutes of the experiment in fed states as opposed to LD apelin (Fig. 8D). To explain such differences according to the nutritional state and apelin concentrations, we studied variations of eNOS expression on ex vivo hypothalamus stimulated by either LD or HD apelin. Contrary to HD apelin, which did not modify the ratio of phospho/total eNOS expression in all experimental conditions (Figs. 8E and 8F), LD apelin increased the active phosphorylated form of eNOS in fed (Fig. 8F) but not in fasted state (Fig. 8E). These results suggest that NO release from stimulated-LD apelin hypothalamus implicated an increase of eNOS activity. As we observed in HFD mice that 1) beneficial effect of LD apelin was impaired and, 2) hypothalamic eNOS pathway was seriously blunted in pathophysiological conditions (6), we studied the impact of LD or HD apelin on NO release from hypothalamic slices taken from HFD fed mice. No significant variation on NO release was observed in response to LD or HD apelin in fed state (Figs. 8G and 8H), and similar results were obtained in fasted conditions (data not shown).
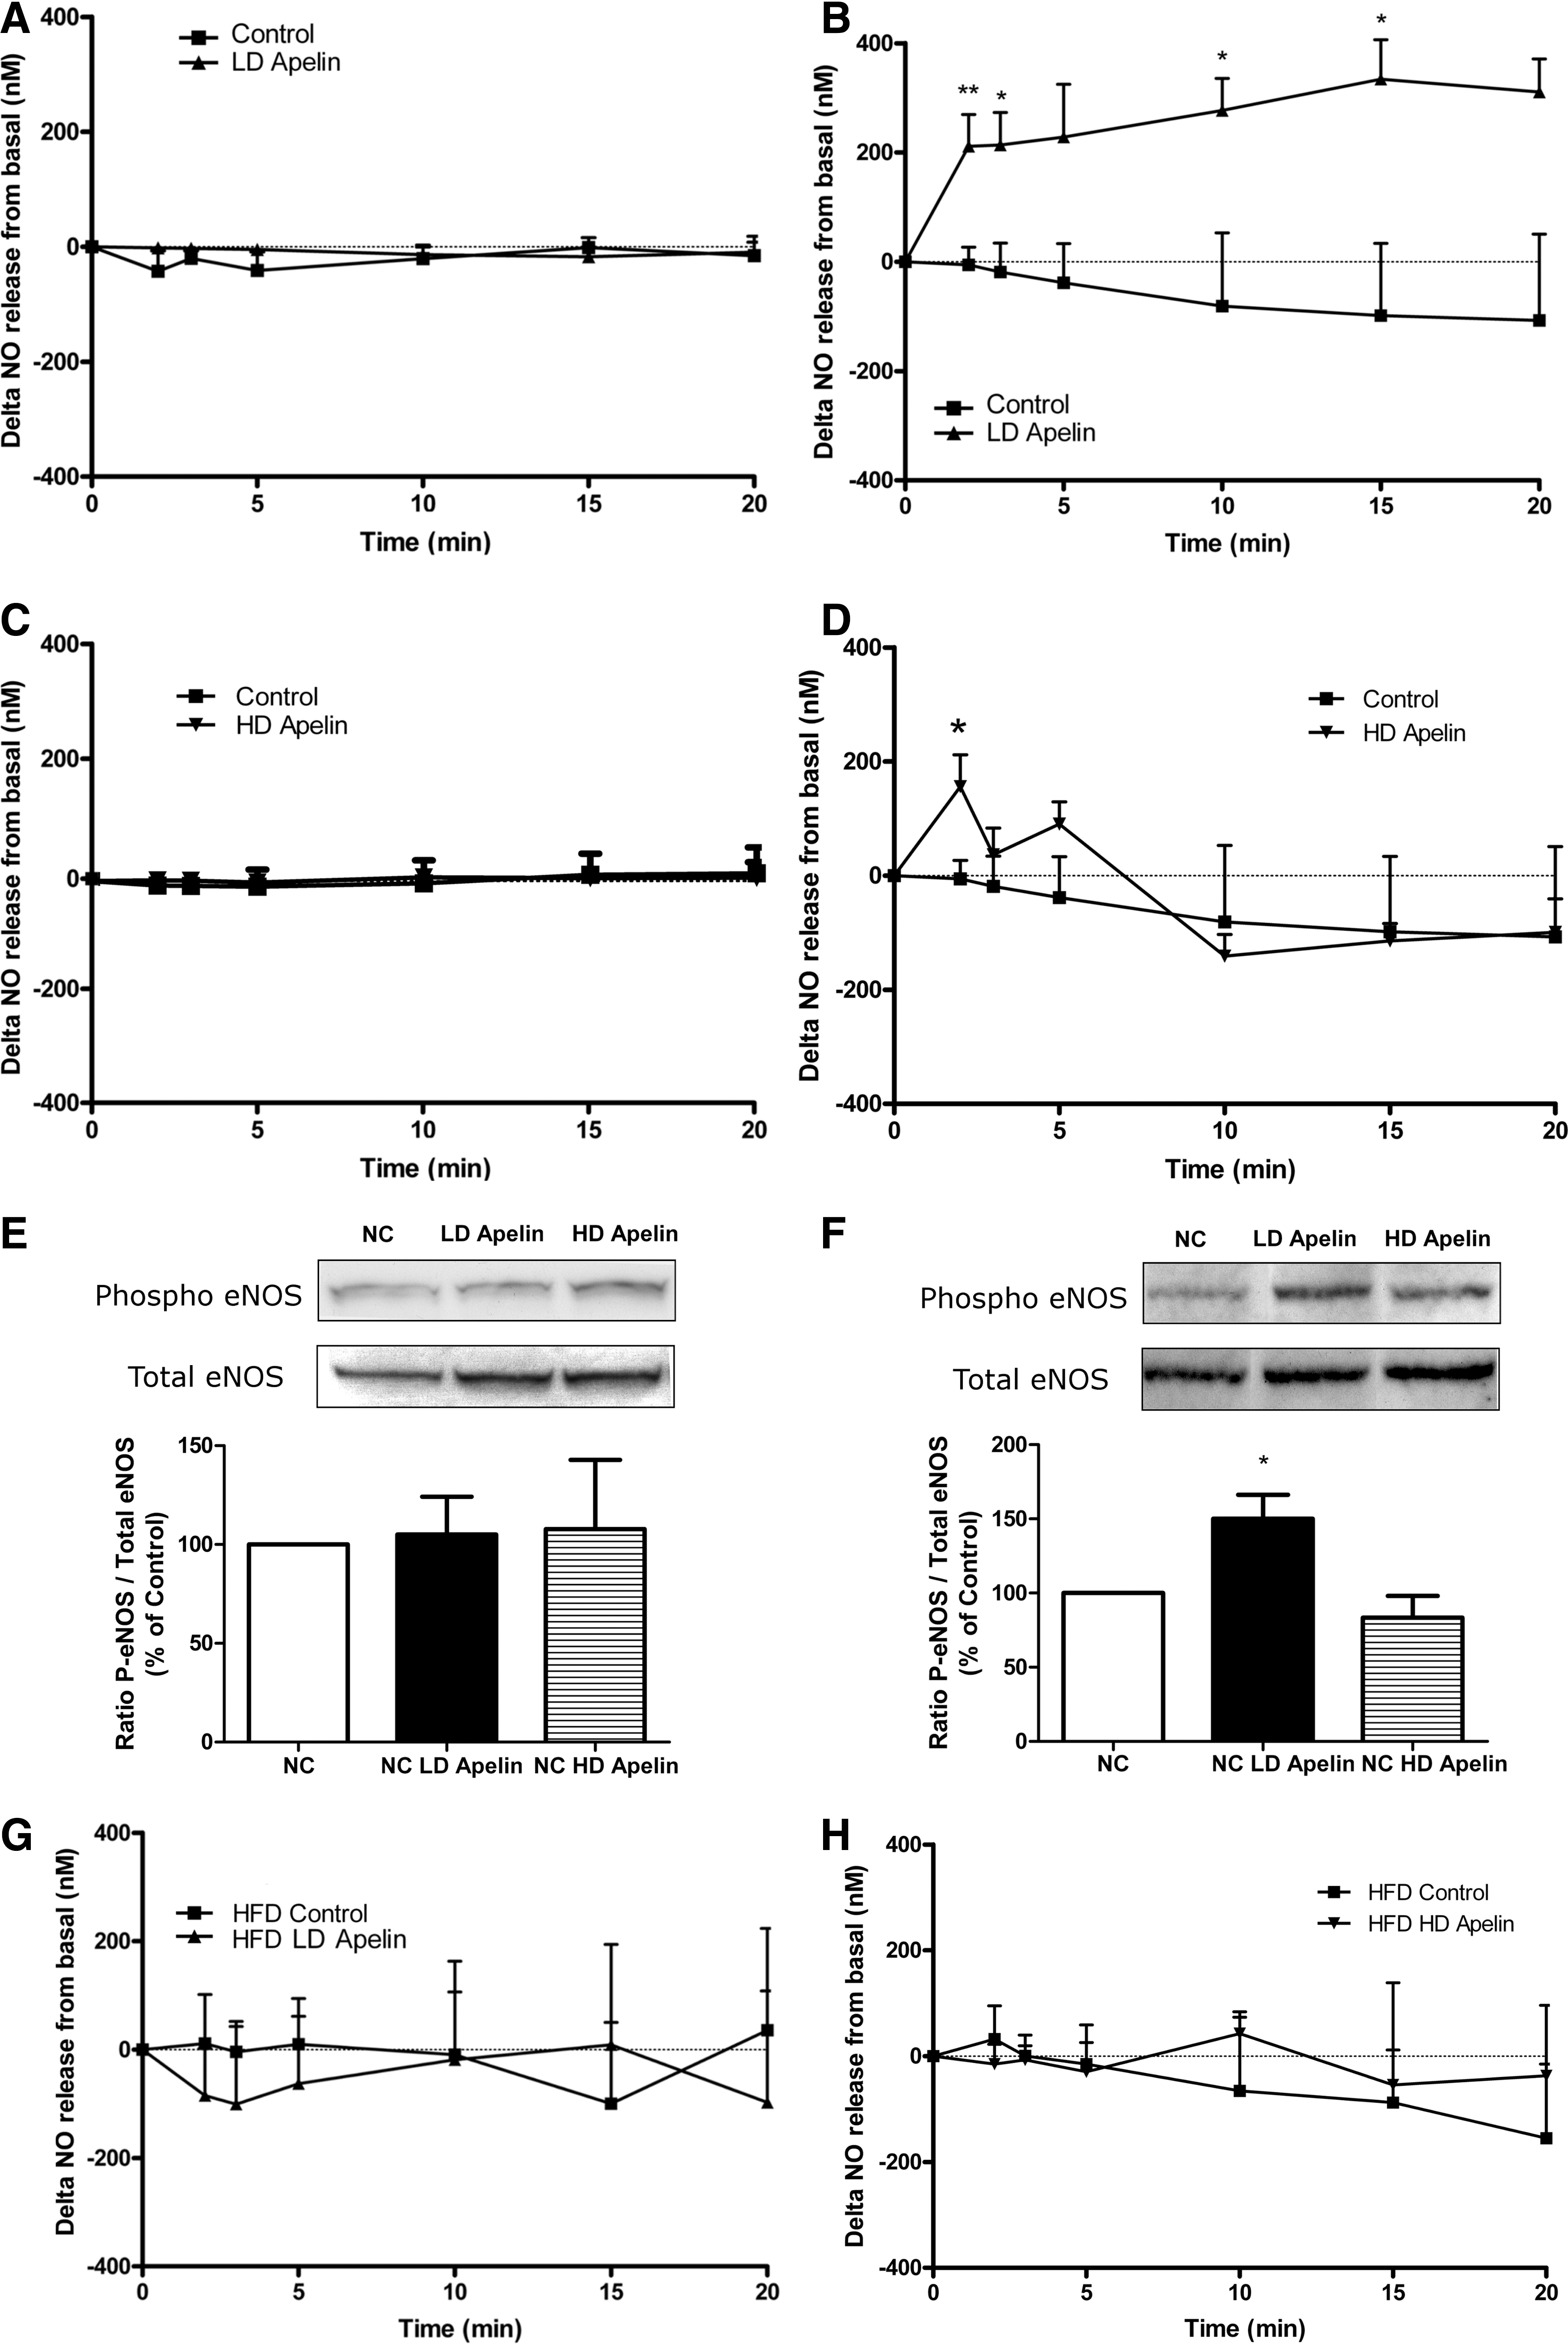
Altogether these results suggest that obesity and insulin-resistant state participate to the disruption of the apelin-NO-dependent hypothalamic response.
Effect of acute i.c.v. LD or HD apelin on peripheral glucose metabolism in total eNOS KO and L-NMMA i.c.v. control treated mice
To address the dependence of the observed central apelin effects on the generation of NO, we repeated the above experiments in total eNOS KO mice. All beneficial effects of apelin on glucose homeostasis were lost in eNOS KO mice, including glucose tolerance (Figs. 9A and 9B) and fed glycemia (AUC: eNOS KO Control=224.8±14.9 vs. eNOS KO Apelin=205.5±12.3). eNOS KO mice perfused with i.c.v. NO donor did not present modification of glucose tolerance (except a slight decrease of glycemia at t60 and t90 following SNAP i.c.v. administration in eNOS KO mice) (Fig. 9A) associated with a drastic increase in insulin release (Fig. 9B). This suggests that 1) the lack of response to LD apelin could be at least in part due to the absence of a functional hypothalamic eNOS, and 2) insulin resistance is one major characteristic of eNOS KO mice (37). In accordance with these findings, pharmacological blockade of NOS using L-NMMA administration in wild-type mice completely abolished the beneficial effects of apelin observed on glucose homeostasis (Figs. 9C and 9D). Then we found that LD apelin did not increase NO release from ex vivo hypothalamus taken from eNOS KO mice (Fig. 9E) or from ex vivo control hypothalamus incubated with L-NMMA (Fig. 9F).

As we observed that beneficial effect of LD apelin on fed glycemia in NC mice requires a functional hypothalamic NO pathway as opposed to HD apelin, we investigated the effect of HD apelin in eNOS KO mice or L-NMMA i.c.v. treated normal NC mice. In fed eNOS KO mice, i.c.v. HD apelin increased peripheral glycemia (Fig. 9G) without modification of plasma insulin (15.7±4.0 vs. 22.9±6.0 μU/mL at t30; 9.8±1.7 vs. 14.3±4.2 μU/mL at t15; 7.6±1.4 vs. 11.7±4.3 μU/mL at t120; control vs HD apelin; n=12 vs. n=6, respectively). Glucose and insulin tolerance were not modified by acute i.c.v. HD apelin in eNOS KO mice and NO release in fed conditions was unchanged (data not shown). This suggests first that the hyperglycemic effects are NO-independent, and second, that in the fed state basal hypothalamic NO is sufficient to counteract the hyperglycemic effects of HD apelin in normal mice. Importantly, and in agreement with measurements made in the eNOS KO mice, HD apelin moderately increased peripheral glycemia in L-NMMA i.c.v. treated fed mice (Fig. 9H) without modification of plasma insulin (10.2±2.3 vs. 5.1±0.7 μU/mL at t30; 8.3±1.4 vs. 8.3±1.5 μU/mL at t15; 5.7±1.0 vs. 9.3±1.6 μU/mL at t120; control vs HD apelin; n=5 vs. n=11, respectively), corroborating the existence of a second, distinct NO-independent pathway mediating the HD apelin effects. All other parameters (glucose/Insulin tolerance, NO release in fed conditions) were not modified by acute i.c.v. HD apelin (data not shown).
Effect of i.c.v. chronic HD apelin injection on peripheral glucose metabolism in physiological conditions
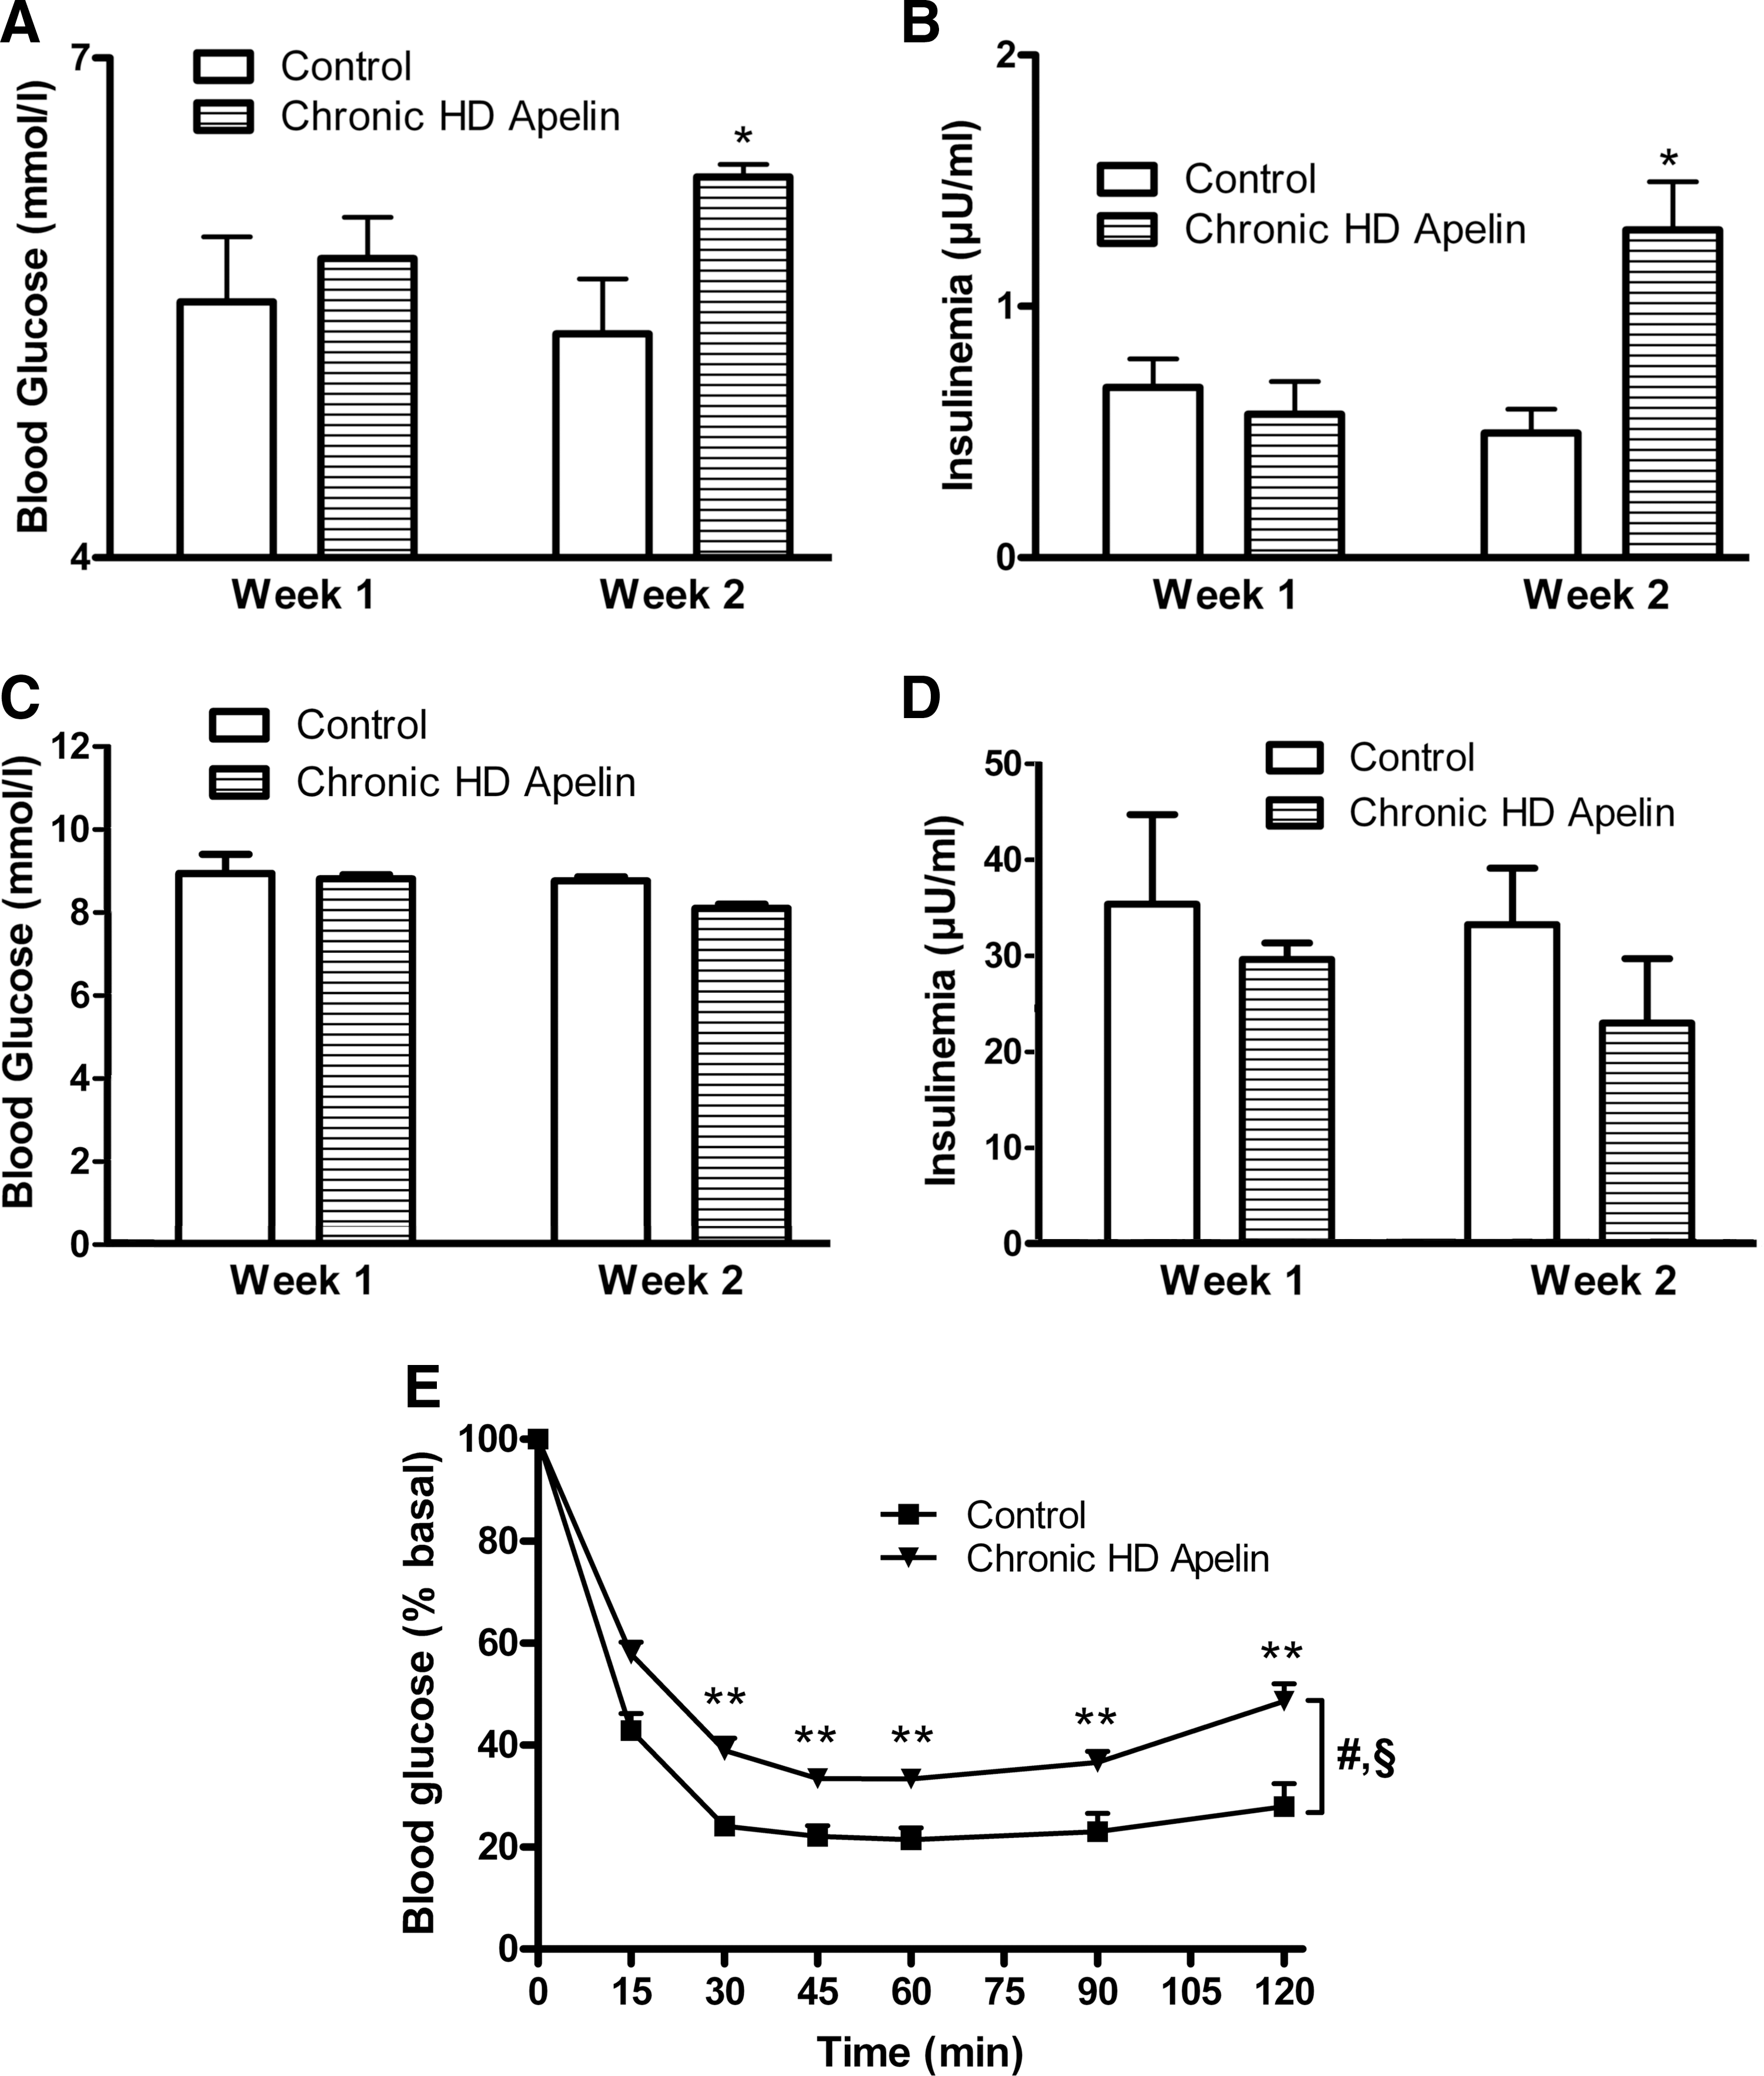
Marked elevations in the circulating concentrations of insulin and leptin are considered hallmarks of the obese and diabetic condition. Diet-induced obese mice exhibit a parallel and marked increase in plasma apelin and obese/diabetic state was associated with a chronic administration of apelin (Fig. 4). In order to assess the potential effects of a continuous priming of apelin in the brain, we assessed the effect of a 2-week continuous i.c.v. HD apelin perfusion on glucose homeostasis parameters. Body weight (26.0±0.4 vs. 26.4±0.3 g at week 1; 26.5±0.4 vs. 26.4±0.4 g at week 2, control vs chronic HD apelin; n=6 vs. n=7, respectively) and food intake (13.9±0.4 vs. 14.2±0.2 kcal/day/mouse at week 1; 15.7±0.3 vs. 16.1±0.6 kcal/day/mouse at week 2, control vs chronic HD apelin; n=6 vs. n=7, respectively) did not vary in chronic HD apelin-treated mice. In fasted state, glycemia and insulinemia significantly increased at week 2 of chronic HD apelin treatment (Figs. 10A and 10B). Fed glycemia and insulinemia did not change during the 2-weeks of experiment (Figs. 10C and 10D), corroborating the acute effect previously observed on fed state. Mice treated with HD apelin showed a significant decrease in insulin tolerance compared to control mice (Fig, 10F), reinforcing the negative impact of HD apelin in the brain.
Discussion
The brain, and more precisely the hypothalamus, is perhaps the primary orchestrator of whole body fuel sensing (26). We demonstrate here for the first time that hypothalamic apelin controls glucose homeostasis in physiological and physiopathological states. The beneficial effects of LD apelin in the hypothalamus are NO dependent, as opposed to HD apelin. In fact, our results exhibit a dose-dependent divergence in net metabolic consequence. Thus, our data suggest elevated hypothalamic apelin as a potential mediator of the diabetic state (Fig. 11).
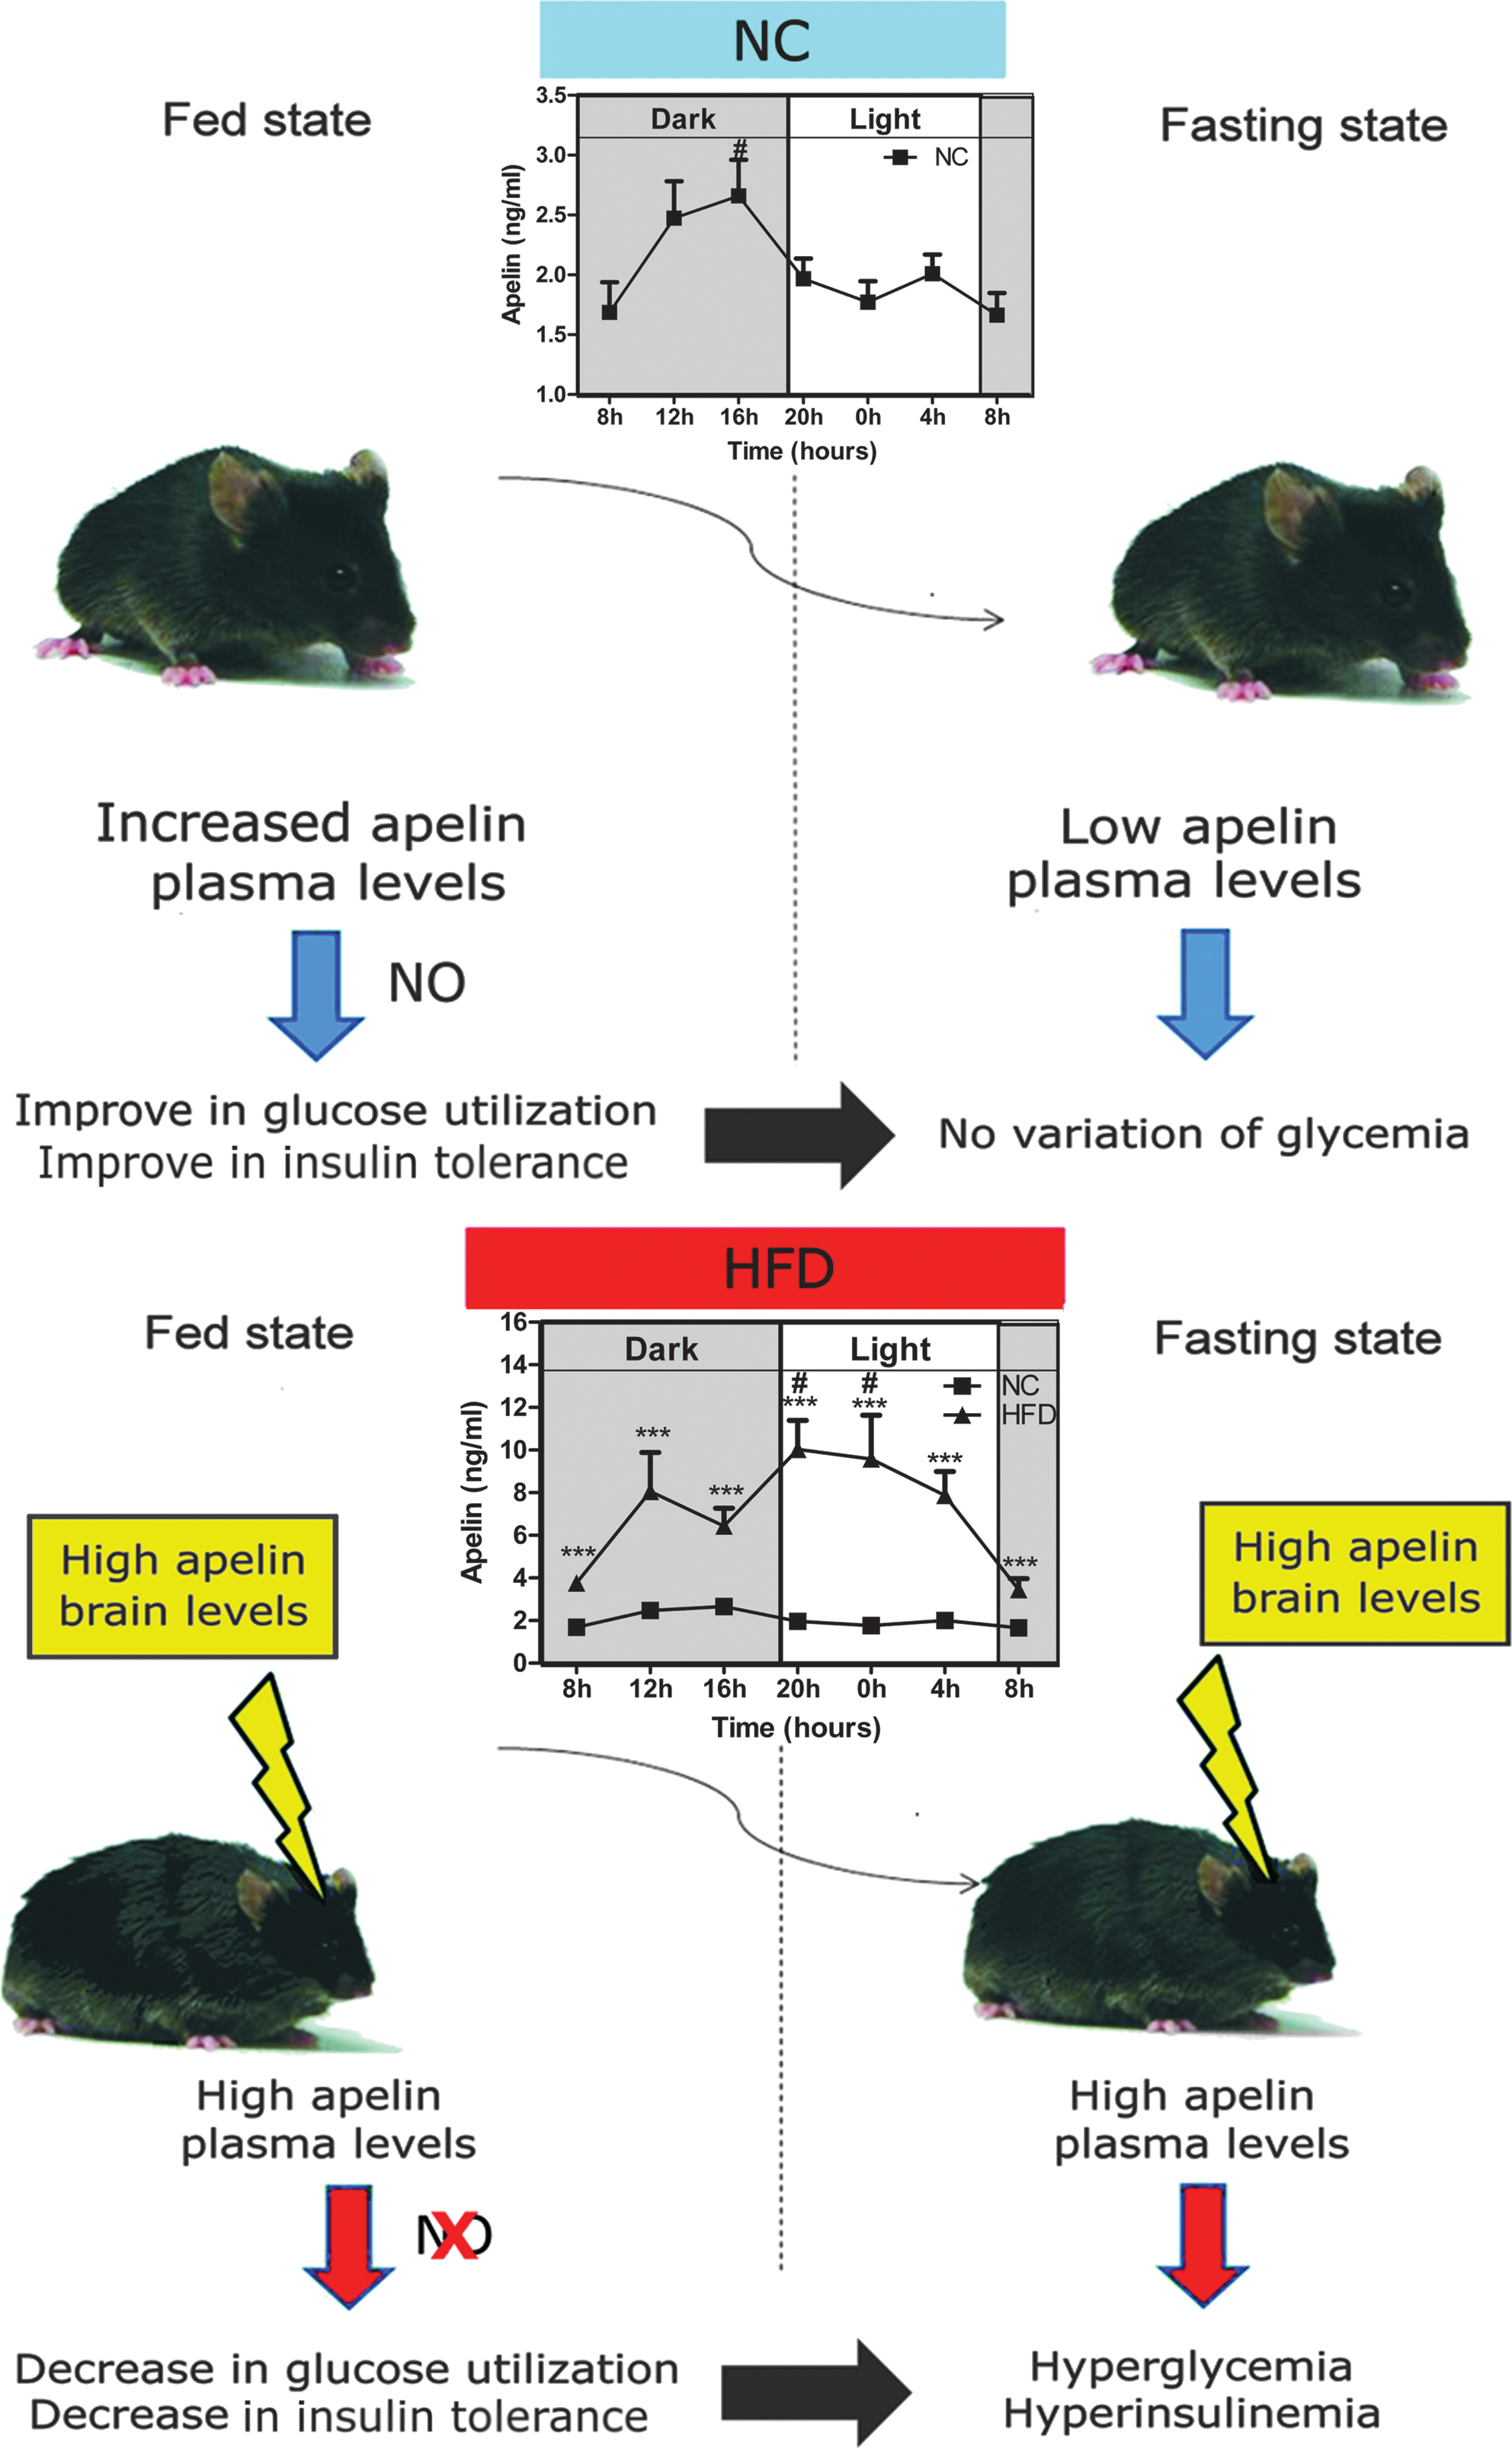
One of the major peripheral effectors of apelin function is eNOS. The apelin/eNOS axis is represented in numerous physiological processes including vascular functions (45, 50) and peripheral glucose utilization (12), and not surprising perturbation of the axis is associated with both hypertension and diabetes, respectively. Using pharmacological and transgenic approaches, we demonstrate that NO is implicated in hypothalamic LD apelin-driven signaling effects. The observed NO release measurements (nanomolar concentrations) lie within the physiological range and are consistent with previously published functions of NO (29). Consistent with the observed effects, both constitutively expressed forms of NOS (nNOS and eNOS) are found in the hypothalamus. Also, both forms have previously been shown to be capable of modulating the central tone of glucose homeostasis (6, 16). Here, we demonstrate that beneficial effect of i.c.v. LD apelin implies an increase phosphorylation of eNOS only in fed conditions. Moreover, our finding that eNOS KO mice do not respond to i.c.v. LD apelin supports a dominant role for the eNOS isoform in the apelin-driven effects. We cannot rule out the fact that one characteristic of eNOS KO mice is to present a clear insulin-resistant state and the absence of i.c.v. LD apelin effect could be related to peripheral disturbance. Conversely to this hypothesis, eNOS KO mice are still able to response to i.c.v. SNAP by an increase in insulinemia as previously observed in a rat model in which hypothalamus is stimulated by intracarotid NO donor (27). In spite of a lack of clear amelioration of glucose tolerance, eNOS KO mice present a more rapid return to normal glycemia (from t60 to t120, Fig. 9A). All these data suggest that the brain of eNOS KO mice can response to NO donor with peripheral physiological changes. We can speculate that these modifications can be amplifying in response to higher (supraphysiological) doses of i.c.v. NO donor.
Interestingly, when challenged with HD central apelin, both eNOS KO and L-NMMA treated mice present an increase in glycemia in the fed state. These findings suggest that a basal tone of NO in the hypothalamus is crucial for the maintenance of a physiological glycemia, and NO from endothelial origin is implicated in the hypoglycemic effect of apelin. This hypothesis is supported by the work of Shankar et al. (36) demonstrating that i.c.v. L-NMMA injection in the rat increases insulin resistance. Finally, ex vivo hypothalami treated with HD apelin did not exhibit increased NO release throughout the 20 minutes of exposure, suggesting that HD apelin activates inhibitory signals for NO. In contrast to LD apelin, we hypothesize that HD apelin may decrease NO release in hypothalamic explants, as observed with leptin on pituitary cells (25). This hypothesis supposes that high levels of hypothalamic apelin are able to stimulate inhibitory factors of NOS activity such as beta-endorphin (15) or of eNOS cofactors such as reactive oxygen species (20). In support of such a mechanism, we have observed that HD apelin stimulates hydrogen peroxide release from ex vivo hypothalamus (data not shown). The fact that HD apelin did not increase the phosphorylation of eNOS in fed conditions as opposed to LD apelin, further reinforce this hypothesis. An equally plausible hypothesis would be that the APJ receptor-induced signaling cascade exhibits desensitization in response to HD apelin. Indeed, i.c.v. apelin has been shown to induce a downregulation of the receptor itself in the hypothalamus of HFD mice (8).
We hypothesized that elevated levels of central apelin might impair glucose homeostasis since obese/diabetic mice, which are sensitive to peripheral apelin (12), present increased plasma apelin levels. Both the finding of abolished circadian apelin regulation in HFD-treated mice (Fig. 4) and that of chronic apelin triggering insulin intolerance (Fig. 9) are consistent with this hypothesis. Interestingly, the finding that HD central apelin increases blood glucose during fasting (Fig. 5) suggests a link between central apelin and the control of hepatic glucose production. Although hepatic glucose production was not significantly modified during the clamp, a link between central apelin and liver could be suggested since HD apelin increases blood glucose during fasting. Numerous studies have implicated the autonomous nervous system in the central control of liver glucose metabolism. Indeed, hepatic denervation (48) and electrical stimulation (38) modify glycogen liver content. Also, the stimulation of the VMH produces hyperglycemia by increasing glycogenolysis and gluconeogenesis (9) which are mediated by sympathetic efferents. Importantly, the previously described kinetics of sympathetic gluco-regulation (glycogenolysis within minutes; gluconeogenesis within hours) (39 –41) clearly fits with our observation of two waves of increased glucose release after HD apelin. While these hepatic gluco-regulatory effects and the c-Fos staining profiles (Fig. 7) clearly highlight an activity of apelin at the VMH, the concurrent capacity of apelin to initiate insulin release suggests the additional involvement of parasympathetic regulation and thus of additional hypothalamic nuclei (the lateral hypothalamus and periventricular hypothalamic nucleus). Such a concept could explain the dose dependency of apelin action and places the apelin/APJ axis as a novel central regulator of glucose homeostasis. In accordance with this hypothesis, we found that i.c.v. apelin differentially affects glucose metabolism. LD apelin improve fed glycemia and glucose tolerance. In fasted state, LD apelin did not changes glycemia, while supraphysiological insulin stimulation increased insulin tolerance. To verify this hypothesis, we performed euglycemic-hyperinsulinemic clamp studies and did not find any modification of glucose turnover. Therefore, this suggests that in the fasted state, the brain cannot adequately respond to LD apelin as opposed to a hyperglycemic state. Interestingly, HD apelin markedly increased plasma insulin secretion during fasted state and oral glucose load. This last observation suggests that HD apelin promotes a moderate insulin resistance state. Nonetheless, we did not find any changes of insulin tolerance upon ITT, however, we may not rule out that the supraphysiological dose of insulin used exceeds the physiological impact of i.c.v. HD apelin, thereby jeopardizing the real assessment of insulin sensitivity. Therefore, we decided to investigate insulin sensitivity by using the gold standard method, namely the euglycemic-hyperinsulinemic clamp studies. Importantly, by using this method, we found that HD apelin administration promotes whole body insulin resistance.
Although i.c.v. apelin controls peripheral glucose homeostasis, chronic i.c.v. perfusion of apelin does not modify cumulative food intake in our experiment. This result is in accordance with Taheri et al. (44) which demonstrates similar effect in rats. At the opposite, numerous studies implicate central apelin as a positive (47) or negative regulator (43) of food intake. Such discrepancies could be explain by injection process (acute vs. chronic), the dose injected in lateral ventricle (low vs. high) and by the nutritional state (fast vs. fed) (44). In our study, we demonstrate that LD apelin targets hypothalamic NO in fed conditions. One of the mechanisms could be explained by the fact that the hypothalamus needs an impregnation of peripheral factors (including glucose and/or insulin) to adequately respond to brain apelin via NO. In accordance with this hypothesis, Becskei et al. (2) demonstrate a differential expression of c-Fos expression in the arcuate nucleus of fasted, chow-refed or ad libidum fed mice associated to variations of plasma hormones concentrations (insulin, leptin, ghrelin). In this study, the authors also demonstrate that supplementation of food with macronutrients (protein, fat, or carbohydrates) may modify c-Fos expression in refeeding mice, suggesting that the arcuate nucleus represents an important site in the short-term control of energy intake. However, the feeding-related factors implicated in the genesis of the transition from fasted to fed state in the hypothalamus, and thus contributing to the brain apelin/NO effect during fed state, remain to be defined. Thus, we can speculate that the capacity of hypothalamic nuclei to respond to apelin varied in function of numerous parameters, including the nutritional state as suggested by our c-Fos study in the hypothalamus and by plasma apelin variations observed during the day. Such variations of hypothalamic c-Fos expression during the nutritional state and/or apelin levels may have consequence on autonomous nervous system activity which could explain peripheral variations observed on glycemia and insulin release. Thus, we can speculate that such a modification of hypothalamus activity in our model may have consequences on glucose homeostasis, and identification of apelinergic neurons and efferent nervous signals implicated in this control need to be further explored.
This study shows for the first time that centrally injection of apelin modulates glucose homeostasis. The downstream effects are pleiotropic, dose-dependent, and involve several distinct hypothalamic nuclei that link hepatic glucose production, insulin release, and centers mediating autonomic control. Finally, results including generation of a central apelin-resistant state in vivo reveal apelin/APJ as a novel mechanistic candidate for the transition from normal to diabetic states. In fact, potential therapeutic strategies based on apelin/APJ system have to preferentially target peripheral apelin effects since they are conserved in HFD mice model (12). Evaluation of the quantity of iv apelin able to reach the brain while retaining beneficial peripheral effect on glycemia will be a major issue for the future clinical relevance of apelin.
Materials and Methods
Mice
Animals were handled in accordance with the principles and guidelines established by the National Institute of Medical Research (INSERM) and by the local ethical committee of the IFR-BMT. C57Bl6/J mice and mice deficient in endothelial NO synthase (eNOS -/-) on a C57Bl6/J background were obtained from Charles River Laboratory (l′Arbresle, France). Mice were housed conventionally in a constant temperature (20°–22°C) and humidity (50%–60%) animal room and with a 12/12h light/dark cycle (lights off at 7:00 AM) and free access to food and water through the 24 h period. All injections and experiments were performed in 13–15-week-old males. A group of male mice was subjected to high fat diet (HFD) containing 20% protein, 35% carbohydrate, and 45% fat (SAFE, Augy, France). HFD-fed mice were followed at regular intervals with measure of weight and blood parameters (glucose, insulin) until they were obese and insulin resistant corresponding to 3 months of HFD. Experiments were performed on 6 h-fasted or fed mice. During the time of experiment (3 hours), mice fed overnight were placed in a new clean cage without food.
Surgical procedures
For in vivo acute and chronic perfusions, an indwelling i.c.v. catheter (Alzet Brain Perfusion Kit 3, 1-3 mm, Charles River, 0.1 mm lateral, 0.22 mm anteroposterior from the bregma and 1.5 mm deep) was implanted in anesthetized mice with isoflurane (Abbott, Ringis, France). For chronic perfusions, the i.c.v. catheter was connected to an osmotic mini-pomp (Model 2004, Alzet; Cupertino, CA), as previously described (21).
Acute injections
Apelin
Bolus injection of 2 μl of [Pyr]apelin-13 (concentration from 10 pM to 50 nM corresponding to 20.10−3 fmol to 50 fmol, Bachem, UK), the most active apelin isoform (12), was injected directly to the i.c.v. catheter completed to 2 μl of artificial cerebrospinal fluid (aCSF) for treated mice, or 4 μl of aCSF for control mice. Blood glycemia was measured every 30 min from −30 to 210 min (time 0 corresponding to i.c.v. apelin injection). To limit stress due to accumulation of tail blood samples, insulinemia was measured at different time intervals from −30 to 120 min in another set of mice.
NOS inhibitor
Similar experiments were performed with a NOS inhibitor, NG-monomethyl-L-arginine (L-NMMA, Sigma), who was dissolved extemporaneously in aCSF, and then infused at a concentration of 100 μM (2 μl). The L-NMMA infusion was started 30 min before the start of the apelin injection.
Chronic perfusion of apelin
Using an osmotic mini-pump system connected to the lateral ventricle, we measured glucose homeostasis parameters, as previously described in detail (21). Briefly, the osmotic mini-pump delivers either aCSF or apelin-13 (high-dose, HD; 2 μl of 20 nM) over 2 weeks, at a rate of 0.25 μl/h. Fasted/fed glycemia and insulinemia, body weight, and food intake were evaluated every week. In a different set of mice, ITT were performed during the treatment.
Real-time amperometric NO measurements
Mice were decapitated without anesthesia after 6 hours of fasting or fed conditions. After dissection, hypothalamus fragment was washed in Krebs-Ringer bicarbonate/glucose buffer (pH 7.4) in an atmosphere of 95% O2–5% CO2 and then immersed in Eppendorf tubes containing 400 μl of the same medium. Each tube contained one hypothalamus. After a 10 min recovery period, the spontaneous NO release was measured at 35°C for 20 min by using a NO-specific amperometric probe (ISO-NOPF, 100 μm diameter, 5 mm length, World Precision Instruments, Aston Stevenage, UK) implanted directly in the hypothalamus (13, 16). Apelin-13 or saline was injected directly in the survival medium (final concentrations: 10 pM or 20 nM). Calibration of the electrochemical sensor was performed by the use of different concentrations of a nitrosothiol donor S-nitroso-N-acetyl-D,L-penicillamine (SNAP, Sigma), as previously described in details (16, 24). The concentration of NO gas in solution was measured in real-time with data acquisition (Apollo1000, World Precision Instruments, Aston Stevenage, UK) at a sampling rate of 10 values/sec. The computer-interfaced DataTrax2 software (World Precision Instruments, Aston Stevenage, UK) performed data acquisition. Data are expressed as delta variation of NO release from basal.
Oral glucose tolerance test
6 hour-fasted mice were injected with i.c.v. apelin-13 or aCSF 120 min before oral glucose (3 g/kg) loading. Blood was collected from the tail vein at −30, 0, 15, 30, 45, 60, 90, and 120 min later for determination of glucose levels. Blood was also collected 30 min before and after 15 min glucose loading for determination of plasma insulin concentration, as previously described (21 –23). In another set of mice, pharmacological blockade of NOS was induced by i.c.v. L-NMMA injection 150 min before apelin treatment, and consequences on glycemia and insulinemia were measured. In a similar way, experiments were performed in the presence of the NO donor SNAP (S-nitroso-N-acetyl-D,L-penicillamine, Sigma) that was dissolved extemporaneously in aCSF, and then infused at a dose of 22.7 nmol in 2 μl completed to 2 μl of aCSF in eNOS KO mice. At this dose, i.c.v. SNAP did not modify peripheral plasma concentrations of hormones including angiotensin II and vasopressin (34). SNAP infusion was started 120 min before oral glucose (3 g/kg) loading.
ITT
6 hour-fasted mice were injected with i.c.v. apelin-13 or aCSF 120 min before intraperitoneal insulin injection (1 mU/g), as previously described (46). Blood was collected from the tail vein at −30, 0, 15, 30, 45, 60, 90, and 120 min later for determination of glucose levels.
Euglycemic hyperinsulinemic clamp
A femoral iv catheter was implanted 7 days before clamp studies. Hepatic glucose production (HGP) and whole body glucose turnover (TO) were evaluated by the hyperinsulinemic-euglycemic clamp technique, conducted at a 6-h fast with a continuous infusion of 2.5 mU/kg−1/min−1 human insulin (Actrapid) coupled with [3-3H]glucose (0.33 μCi, PerkinElmer, Boston, MA). 6 hour-fasted mice were injected with i.c.v. apelin-13 or aCSF before starting the clamp, as previously described (23). Tail blood glycemia was obtained at time 0 and every 10 min thereafter to adjust a variable 20% glucose infusion rate (GIR) to maintain euglycemia (5–6 mM). When steady-state was obtained (±90 min), blood samples (5 μl) were collected every 10 min for 1 h for estimation of plasma glucose specific activity. At steady state, the rate of glucose appearance (Ra) measured as=[3-3H]GIR/glucose specific activity equals the rate of peripheral glucose disposal (Rd) or TO. In insulin-stimulated conditions (2.5mU/kg−1/min−1), HGP was obtained by subtracting the GIR (mg/kg−1/min−1) to the Rd previously calculated: HGP (Ra)=Rd - GIR. The whole-body glycolytic flux was calculated from the [3H]2O accumulated in the plasma during the last hour of the infusions. The whole-body glycogen synthesis (Gln Synth) rate was calculated by subtracting the glycolytic flux (glycolysis, glycol) from the glucose turnover rate. For each mouse, the mean values have been calculated and then averaged with values from mice from the same group.
Insulin assays
Serum insulin was measured using an ultra-sensitive mouse insulin ELISA (Mercodia, Uppsala, Sweden).
Variations of plasma apelin levels
Plasma apelin levels for NC and HFD mice were measured every 4 hours with a commercially available enzyme-linked immunoassay (ELISA) kit (Phoenix Pharmaceuticals, Burlingame, CA). The sensitivity of the assay was 0.2 ng/ml and the intra-assay error was below 5%. The ELISA had 100% cross-reactivity with human apelin-12, apelin-13, and apelin-36.
Quantification of c-Fos expression in the hypothalamus
A bolus injection of 2 μl of Apelin-13 was performed as described above. Mice were anesthetized 2 h after the injection, perfused with 4% picric acid buffer and 4% formaldehyde. The brain was removed from the skull, postfixed with the formaldehyde buffer, cryoprotected one night in 20% sucrose, sectioned, and stained for immunohistochemistry, as previously described in detail (22).
Western blot analysis
Mice were decapitated without anesthesia after 6 hours of fasting or in fed conditions. After dissection, the hypothalamus fragment was washed in Krebs-Ringer bicarbonate/glucose buffer (pH 7.4) in an atmosphere containing 95% O2–5% CO2 and then immersed in tubes containing 400 μl of the same medium. Each tube contained one hypothalamus. Apelin-13 or saline was injected directly in the survival medium (final concentrations: 10 pM or 20 nM). After 3 min of incubation, each hypothalamus was frozen at −80°C in liquid nitrogen and homogenized in lysis buffer. Then, blots were performed as previously described (6). Briefly, the membranes were blocked for 90 min at room temperature with 5% dried milk and incubated overnight at 4°C with a primary polyclonal antibody against total eNOS (dilution 1/1,000; Santa Cruz Biotechnology, Santa Cruz, CA) or the phosphorylated active form (Ser1177) of eNOS (dilution 1/1,000; Cell Signaling Technology, Ozyme, St. Quentin Yvelines, France). After three washes, membranes were incubated with horseradish peroxidase-conjugated anti-rabbit IgG antibody (dilution 1/10,000; Amersham Biosciences Europe, Orsay, France) for 2 hours. Immunoreactivity was detected using an enhanced chemiluminescence detection kit (ECL system; Amersham Biosciences Europe) and exposure to X-ray film (Amersham Hyperfilm ECL, GE Health Care Bio-Sciences Corp, Piscataway, NJ). Bands were quantified using Image Quant system (GE Health Care Bio-Sciences Corp). Data are expressed as percentage of variations of ratio phosphorylated protein/total protein compared to control.
Statistical analysis
Results are presented as mean±SEM. The statistical significance of differences was analyzed by student t-test, by two-way ANOVA followed by a post hoc t-test, or one-way followed by post-hoc Bonferroni′s or Dunnett′s multiple comparison test, when appropriate. Statistical analyses were assessed by using GraphPad Prism version 5.00 for windows (GraphPad Software, San Diego, CA). Results were considered statistically significant when p<0.05.
Footnotes
Acknowledgments
PDC is research associate from the FRS-FNRS (Fonds de la Recherche Scientifique) Belgium. This work was supported by the “Société Française de Nutrition” (SFN). We thank Pr Jean-François Arnal for eNOS KO mice generous gift, Amandine Everard from UCL and the “Plateforme Genotoul Anexplo” from Toulouse for excellent technical assistance. We thank Nadia De Mota for technical advice.
Author Disclosure Statement
No competing financial interests exist.