
Abstract
This study tested the hypothesis that the induction of autophagy by producing therapeutic amounts of endoplasmic reticulum (ER) stress in the heart before an ischemic insult would ameliorate/reduce subsequent lethal myocardial ischemic/reperfusion (I/R) injury (similar to ischemic preconditioning). A dose–response study with both tunicamycin and thapsigargin was performed to determine the optimal dose (0.3 mg/kg) for inducing autophagy for cardioprotection. The Sprague–Dawley rats weighing between 250 and 300 g were randomly assigned into five groups: normal control (injected with saline only), high (3 mg/kg), and low (0.3 mg/kg) doses of tunicamycin or thapsigargin, respectively. After 48 h, the rats were subjected to an isolated working heart preparation: 30 min ischemia followed by 2 h of reperfusion with continuous left ventricular function monitoring. At the end, the hearts were subjected to either measurement of infarct size or cardiomyocyte apoptosis. Some hearts (from different sets of experiments) were used for transmission electron microscopy (TEM), confocal microscopy, or Western blot analysis. Tunicamycin and thapsigargin, irrespective of the dose, induced sufficient ER stress, as evidenced by the increased phosphorylation or activation of eIF2α and PERK. Such ER stress potentiated autophagy in the heart, as evidenced by an increase in LC3-II, beclin-1, and Atg5. This was also supported by TEM, clearly showing the production of autophagosomes, and by confocal microscopy, showing upregulation of eIF2α and beclin-1. The autophagy produced with lower doses of tunicamycin and thapsigargin in the face of myocardial I/R resulted in reduction of the I/R injury, as evidenced by improved left ventricular function and reduced myocardial infarct size and cardiomyocyte apoptosis. In concert, an induction of GRP78 and activation of Akt and Bcl-2 occurred. The higher doses conversely were detrimental for the heart and were associated with induction of CHOP and downregulation of Akt. The results thus display the proof of concept that induction of autophagy by ER stress (therapeutic amount) before ischemia (similar to ischemic preconditioning) could reduce subsequent lethal ischemic reperfusion injury. Antioxid. Redox Signal. 14, 2191–2200.
Introduction
Because the pathophysiology of myocardial ischemia/reperfusion (I/R) injury also involves oxidative stress and calcium homeostasis (4), it is likely that I/R would cause ER stress. Recent studies found that I/R could affect the ability of ER to synthesize, fold, and sort proteins and results in unfolded protein response (6). We hypothesized that, if a small therapeutic amount of ER can be induced before ischemic insult, that might induce autophagy and protect the myocardium during subsequent lethal I/R injury (preconditioning-like phenomenon). We chose two different inducers of ER stress, tunicamycin (by enhancing glycosylation) (25) and thapsigargin (by disturbing Ca2+ homeostasis) (16) to induce ER stress. Our results indicated that such ER stress indeed developed autophagy, and, depending on the ER stress, the autophagy would either protect the ischemic heart from subsequent cellular injury or lead to failure.
Materials and Methods
Animals
All animals used in this study received humane care in compliance with the Animal Welfare Act and other federal statutes and regulations relating to animals and experiments involving animals, adhering to the principles stated in the Guide for the Care and Use of Laboratory Animals, NRC Publication, 1996 edition. Sprague–Dawley male rats weighing between 250 and 300 g were fed ad libitum regular rat chow with free access to water until the start of the experimental procedure. The rats were randomly assigned to one of the following five groups: normal control (injected with saline only), and High (3 mg/kg) and Low (0.3 mg/kg) doses of tunicamycin or thapsigargin (3 mg/kg and 0.3 mg/kg).
Isolated working-heart preparation
Rats were anesthetized with sodium pentobarbital (80 mg/kg, IP), (Abbott Laboratories, North Chicago, IL) and with the anticoagulant heparin sodium (500 IU/kg., IV) (Elkins-Sinn, Cherry Hill, NJ). After ensuring sufficient depth of anesthesia, we performed a thoracotomy; hearts were isolated and perfused in the retrograde Langendorff mode at 37°C at a constant perfusion pressure of 100 cm of water (10 kPa) for a 5-min washout period. The perfusion buffer used in this study consisted of a modified Krebs-Henseleit bicarbonate buffer (KHB) (in mM: sodium chloride, 118; potassium chloride, 4.7; calcium chloride, 1.7; sodium bicarbonate, 25; potassium biphosphate, 0.36; magnesium sulfate, 1.2; and glucose, 10) (5).
At the end of 10 min, after the attainment of steady-state cardiac function, baseline cardiac function parameters like aortic flow (AF; ml/min), coronary flow (CF; ml/min), left ventricular developed pressure (LVDP; mm Hg), and first derivative of developed pressure (LVdp/dt; mm Hg/s) were recorded. Ischemic adaptation-group hearts were subjected to four cyclic episodes of 5-min ischemia each, followed by 10 min of reperfusion. The I/R and ischemic-adaptation group hearts were then subjected to 30 min of global ischemia followed by 2 h of reperfusion. The first 10 min of reperfusion was in the retrograde mode to allow postischemic stabilization, and thereafter in the antegrade working mode to allow assessment of functional parameters, which were recorded at 30, 60, and 120 min of reperfusion. Control hearts were collected after 2 h and 45-min retrograde perfusion in a Langendorff apparatus (5).
Cardiac-function assessment
Aortic pressure was measured by using a Gould P23XL pressure transducer (Gould Instrument Systems, Valley View, OH) connected to a side arm of the aortic cannula. The signal was amplified by using a Gould 6600 series signal conditioner and monitored on a CORDAT II real-time data-acquisition and analysis system (Triton Technologies, San Diego, CA). Heart rate, LVDP, and LVdp/dt were all derived or calculated from the continuously obtained pressure signal. AF was measured by using a calibrated flowmeter (Gilmont Instruments, Barrington, IL), and CF was measured by timed collection of the coronary effluent dripping from the heart (5).
Echocardiography
The procedure was carried under light anesthesia with sodium pentobarbital (30 mg/kg, IP). The chest of the animal was shaved, and the animal was put in a dorsal decubitus position. Imaging of the heart was done by using a 7-MHz ultrasound probe and a Sequoia 512 echographer (Siemens Acuson) with fundamental imaging modality. Images were stored on magneto-optical disks for off-line analysis. Parasternal long-axis views were obtained and recorded to ensure that the mitral and aortic valves, as well as the apex, were visualized. The exact position of the transducer was adjusted as necessary to acquire standard images. The parasternal short-axis views were recorded at the mid-papillary muscle level. M-mode tracings were performed at the mid-papillary muscle level in either the parasternal long- or short-axis views, with a sweep speed 150 mm/s, measurements were taken by using the leading-edge–to–leading-edge method with 0.1-mm accuracy. All measurements were made by a single observer blind to the identity of the tracings. All measurements were averaged over three to five consecutive cardiac cycles. The reproducibility of measurements was assessed in two sets of baseline measurements in 10 randomly selected rats, and the repeated-measure variability did not exceed 5%. Echocardiographic measurements included septal (IVSTD) and posterior (PWTD) left ventricular wall thickness in diastole, LV cavity size [end-diastolic (LVEDD) and end-systolic (LVESD) dimensions], aortic root, and left atrial anteroposterior diameter. Fractional shortening was computed as follows: (LVEDD − LVESD)/LVEDD, and as global systolic function was balanced, the ejection fraction (EF) was derived as EF = (LVEDD2 − LVESD2)/LVIDD2. Left ventricular myocardial mass was calculated by using LVMass (Troy) = 1.05 [(LVEDD + PWTD + IVSTD)3 − (LVEDD)3]. All the measurements were obtained at the time of examination by the echosonographer and subsequently read by two separate physicians who were blinded to the groups. The average of the measurements was used for subsequent analysis.
Infarct-size estimation
At the end of reperfusion, the left ventricle was cut into transverse slices. The slices were incubated in 1% triphenyl tetrazolium solution in phosphate buffer (Na2HPO4, 88 mM; NaH2PO4, 1.8 mM) for 20 min at 37°C (15). This procedure distinguishes necrotic tissue from viable myocardium. The slices were stored for 48 h in 10% buffered formalin. The heart slices were photographed, and the weights of the slices were monitored. Digital images of the slices were magnified, and the area of necrosis in each slice was quantified with computerized planimetry. The risk and infarct volumes in cubic centimeters of each slice were then calculated on the basis of slice weight to remove the introduction of any errors due to nonuniformity of heart-slice thickness. The risk volumes and infarct volumes of each slice were summed to obtain the risk and infarct volumes for the whole heart. Infarct size was taken to be the percentage of infarct volume of risk volume for any one heart.
Assessment of apoptotic cell death
Immunohistochemical detection of apoptotic cells was carried out by using the TUNEL method (Promega, Madison, WI). In brief, after the isolated heart experiment, the heart tissues were immediately put in 10% formalin and fixed in an automatic tissue-fixing machine. The tissues were carefully embedded in the molten paraffin in metallic blocks. Before analysis of tissues for apoptosis, samples were sectioned and placed on glass slides. The tissue sections were deparaffinized with xylene, washed, and rehydrated by sequential washes with different concentrations of ethanol (absolute, 95%, 85%, 70%, 50%). Then the TUNEL staining was performed according to the manufacturer's instructions. The fluorescence staining was viewed with a fluorescence microscope (Axioplan2 Imaging; Carl Zeiss Microimaging, New York, NY) at 520 ± 20 nm for the green fluorescence of fluorescein and at 620 nm for the red fluorescence of propidium iodide. The number of apoptotic cells was counted and expressed as a percentage of the total myocyte population.
Transmission electron microscopy
Small tissue samples about 1 mm3 were fixed by immersion in 4% glutaraldehyde, postfixed for 1 h in 1% OsO4 in 0.1 M cacodylate buffer, dehydrated, and embedded in Epon 812 at 60°C for 48 h. Routine 60-nm ultrathin sections were cut and mounted on coated grids, and stained with 1% uranyl acetate and Reynold's lead citrate. The transmission electron microscopy examination was performed with Philips CM 12 at 60 kV, and digital images were recorded with Morada CCD, iTEM (Olympus Soft Imaging Solutions; Olympus).
Western blot analysis
Left ventricles from the hearts were homogenized in 1 ml of buffer (25 mM Tris-HCl, 25 mM NaCl, 1 mM orthovanadate, 10 mM NaF, 10 mM pyrophosphate, 10 mM okadaic acid, 0.5 mM EDTA, 1 mM PMSF, and 1 × protease inhibitor cocktail), as described previously (14, 17). In brief, the homogenates were centrifuged at 2,000 rpm at 4°C for 10 min. The supernatant was centrifuged at 10,000 rpm at 4°C for 20 min. The resultant supernatant was the cytosolic fraction. The cytosolic extracts were aliquoted, snap frozen, and stored at −80°C until use. Total protein concentrations in cytosolic extracts were determined by using a BCA Protein Assay Kit (Pierce, Rockford, IL). Cytosolic proteins were separated in SDS-PAGE and transferred to nitrocellulose filters. Filters were blocked in 5% nonfat dry milk and probed overnight with a primary antibody. Primary antibodies against eIF2a, phospho-eIF2a, PERK, phospho-PERK, IRE1α, LC3, beclin-1, GRP78, CHOP, Akt, phospho-Akt, Bcl-2, and glyceraldehyde 3-phosphate dehydrogenase (GAPDH) were obtained from Cell Signaling or Santa Cruz Biotechnology, and used at 1:500 dilutions, except for GAPDH (1:1,000). Protein bands were identified with horseradish peroxidase–conjugated secondary antibody (1:2,000 dilution) and Western Blotting Luminol Reagent (Santa Cruz Biotechnology). The resulting blots were digitized, subjected to densitometric scanning by using a standard NIH image program, and normalized against loading control.
Immunofluorescence techniques and image analysis
Heart-tissue samples collected at the end of experiments were fixed in 2% buffered paraformaldehyde (pH 7.4), embedded and frozen in O.C.T. compound, and subjected to cryosectioning (14, 17). The 5-μm cryosections of the obtained specimens were processed for immunofluorescence analysis. The primary antibody against LC3-I and II (mouse monoclonal IgG from MBL International Co., Woburn, MA,
Statistical analysis
The values for myocardial functional parameters, total and infarct volumes, and infarct sizes were all expressed as the mean ± standard error of mean (SEM). An analysis of variance test followed by the Bonferroni correction was first carried out to test for any differences between the mean values of all groups. If differences were established, the values of the treated groups were compared with those of the control group with a modified t test. The results were considered significant if p < 0.05.
Results
Effects of tunicamycin and thapsigargin (low and high doses) on ventricular function, myocardial infarct size, and cardiomyocyte apoptosis
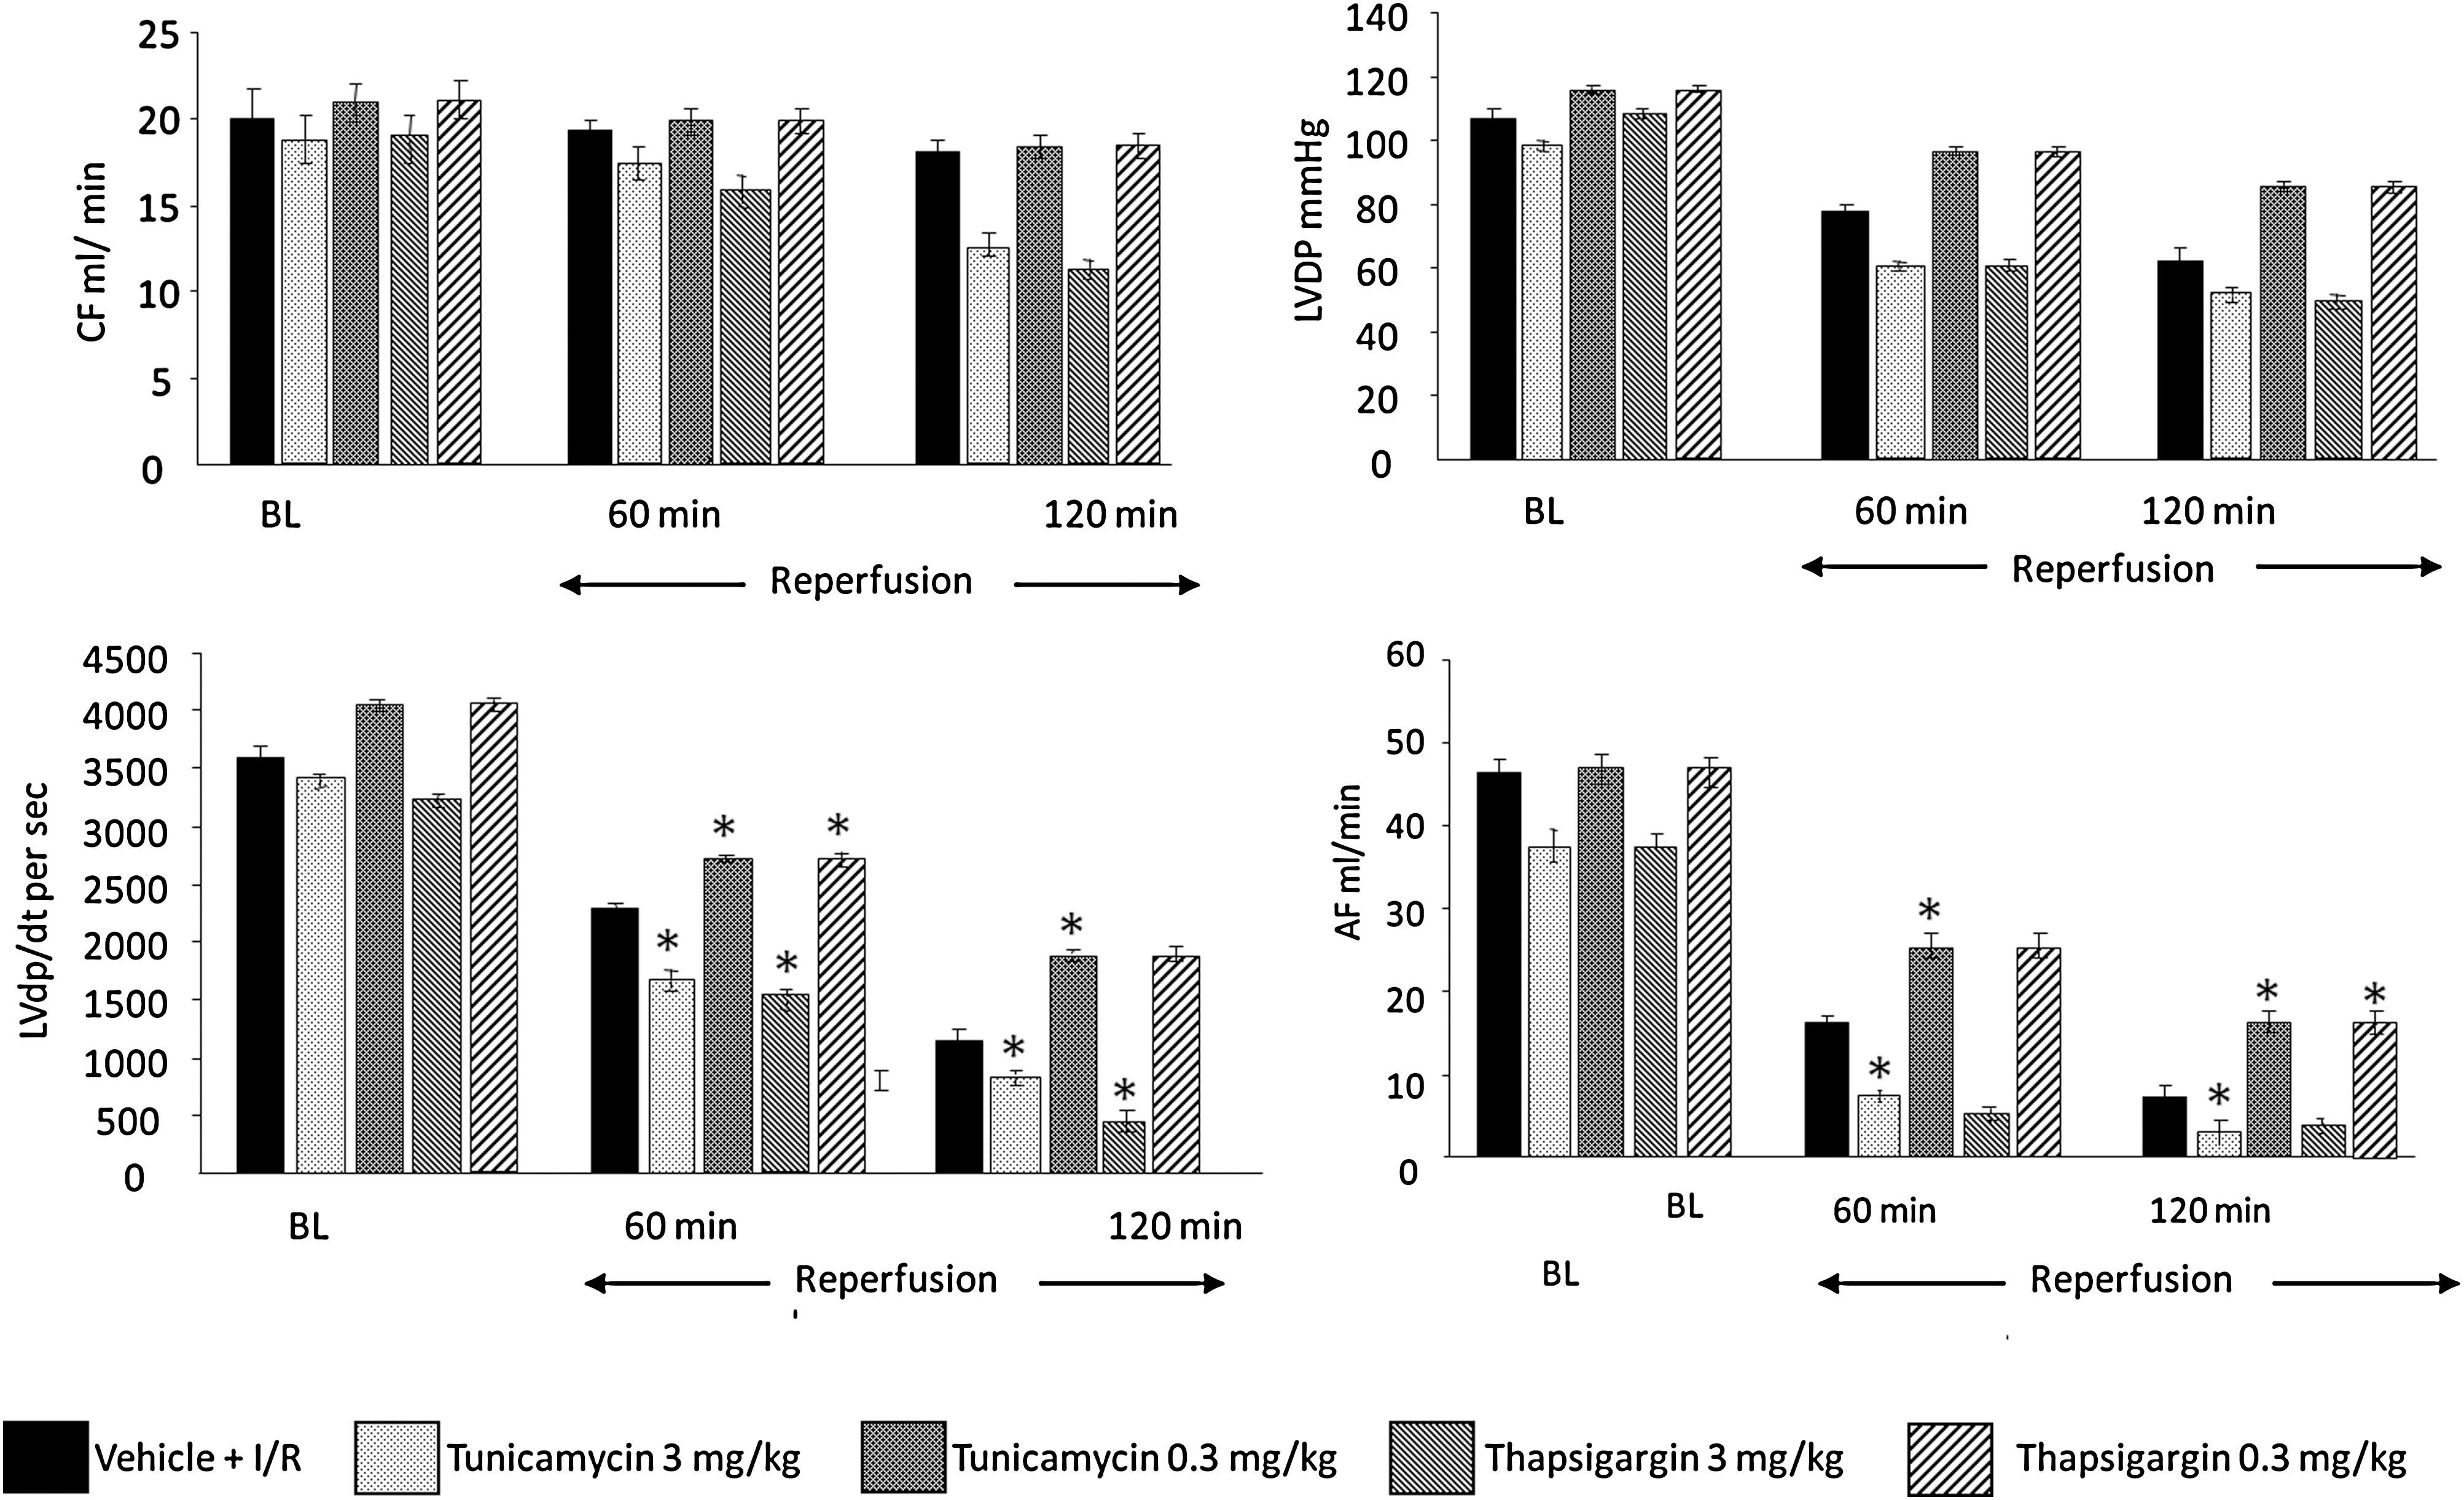
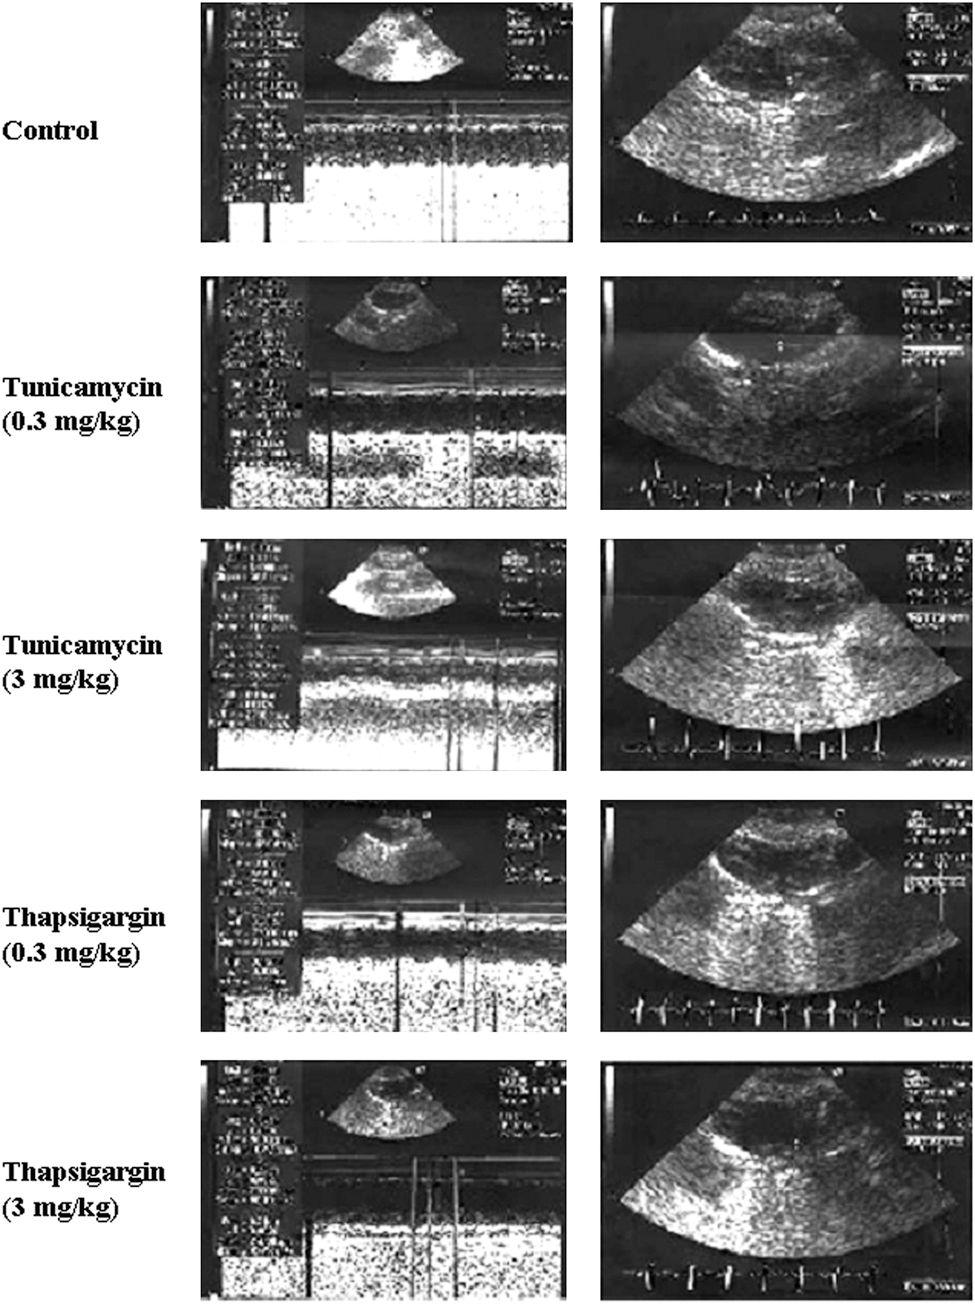
To assess the effects of low and high doses of tunicamycin and thapsigargin on the hearts subjected to I/R, cardiac function was recorded at baseline level and during the reperfusion. At baseline, CF (an indicator of coronary artery dysfunction) and LVDP (defined as the difference of the maximal systolic and diastolic aortic pressures) were the same between the groups (Fig. 1). However, increased dp/dt and AF were noticed for low doses (0.3 mg/kg) of tunicamycin and thapsigargin. This trend persisted during reperfusion, such that at 60 and 120 min of reperfusion, all the functional parameters were enhanced compared with baseline or higher doses of tunicamycin and thapsigargin, indicating cardioprotection. Higher doses of tunicamycin (3 mg/kg) and thapsigargin (3 mg/kg) showed lower than baseline values, indicating depression of the ventricular function. No significant difference in echocardiographic parameters was found between low dose–treated (either tunicamycin or thapsigargin) and control animals (Fig. 2 and Table 1). High doses of both treatments caused left ventricular dilatation (mainly end-systolic diameters) and worsening of systolic function (fractional shortening and ejection fraction). Thapsigargin caused significant increase in left ventricular mass, probably attributable to edema of left ventricular myocardium, which was not observed in tunicamycin-treated animals, suggesting different actions on attenuation of myocardial function by the two drugs.
EF, ejection fraction: (LVEDD2 − LVESD2)/LVEDD2; FS, fractional shortening: (LVEDD − LVESD)/LVEDD; IVSTD, interventricular septum thickness in diastole; LA, left atrial; LVEDD, left ventricular end-diastolic diameter; LVESD, left ventricular end-systolic diameter; LVmass (Troy), 1.05 (LVEDD + PWTD + IVSTD)3 − (LVEDD)3 in grams; PWTD, posterior wall thickness in diastole.
p < 0.05 compared with the untreated control group.
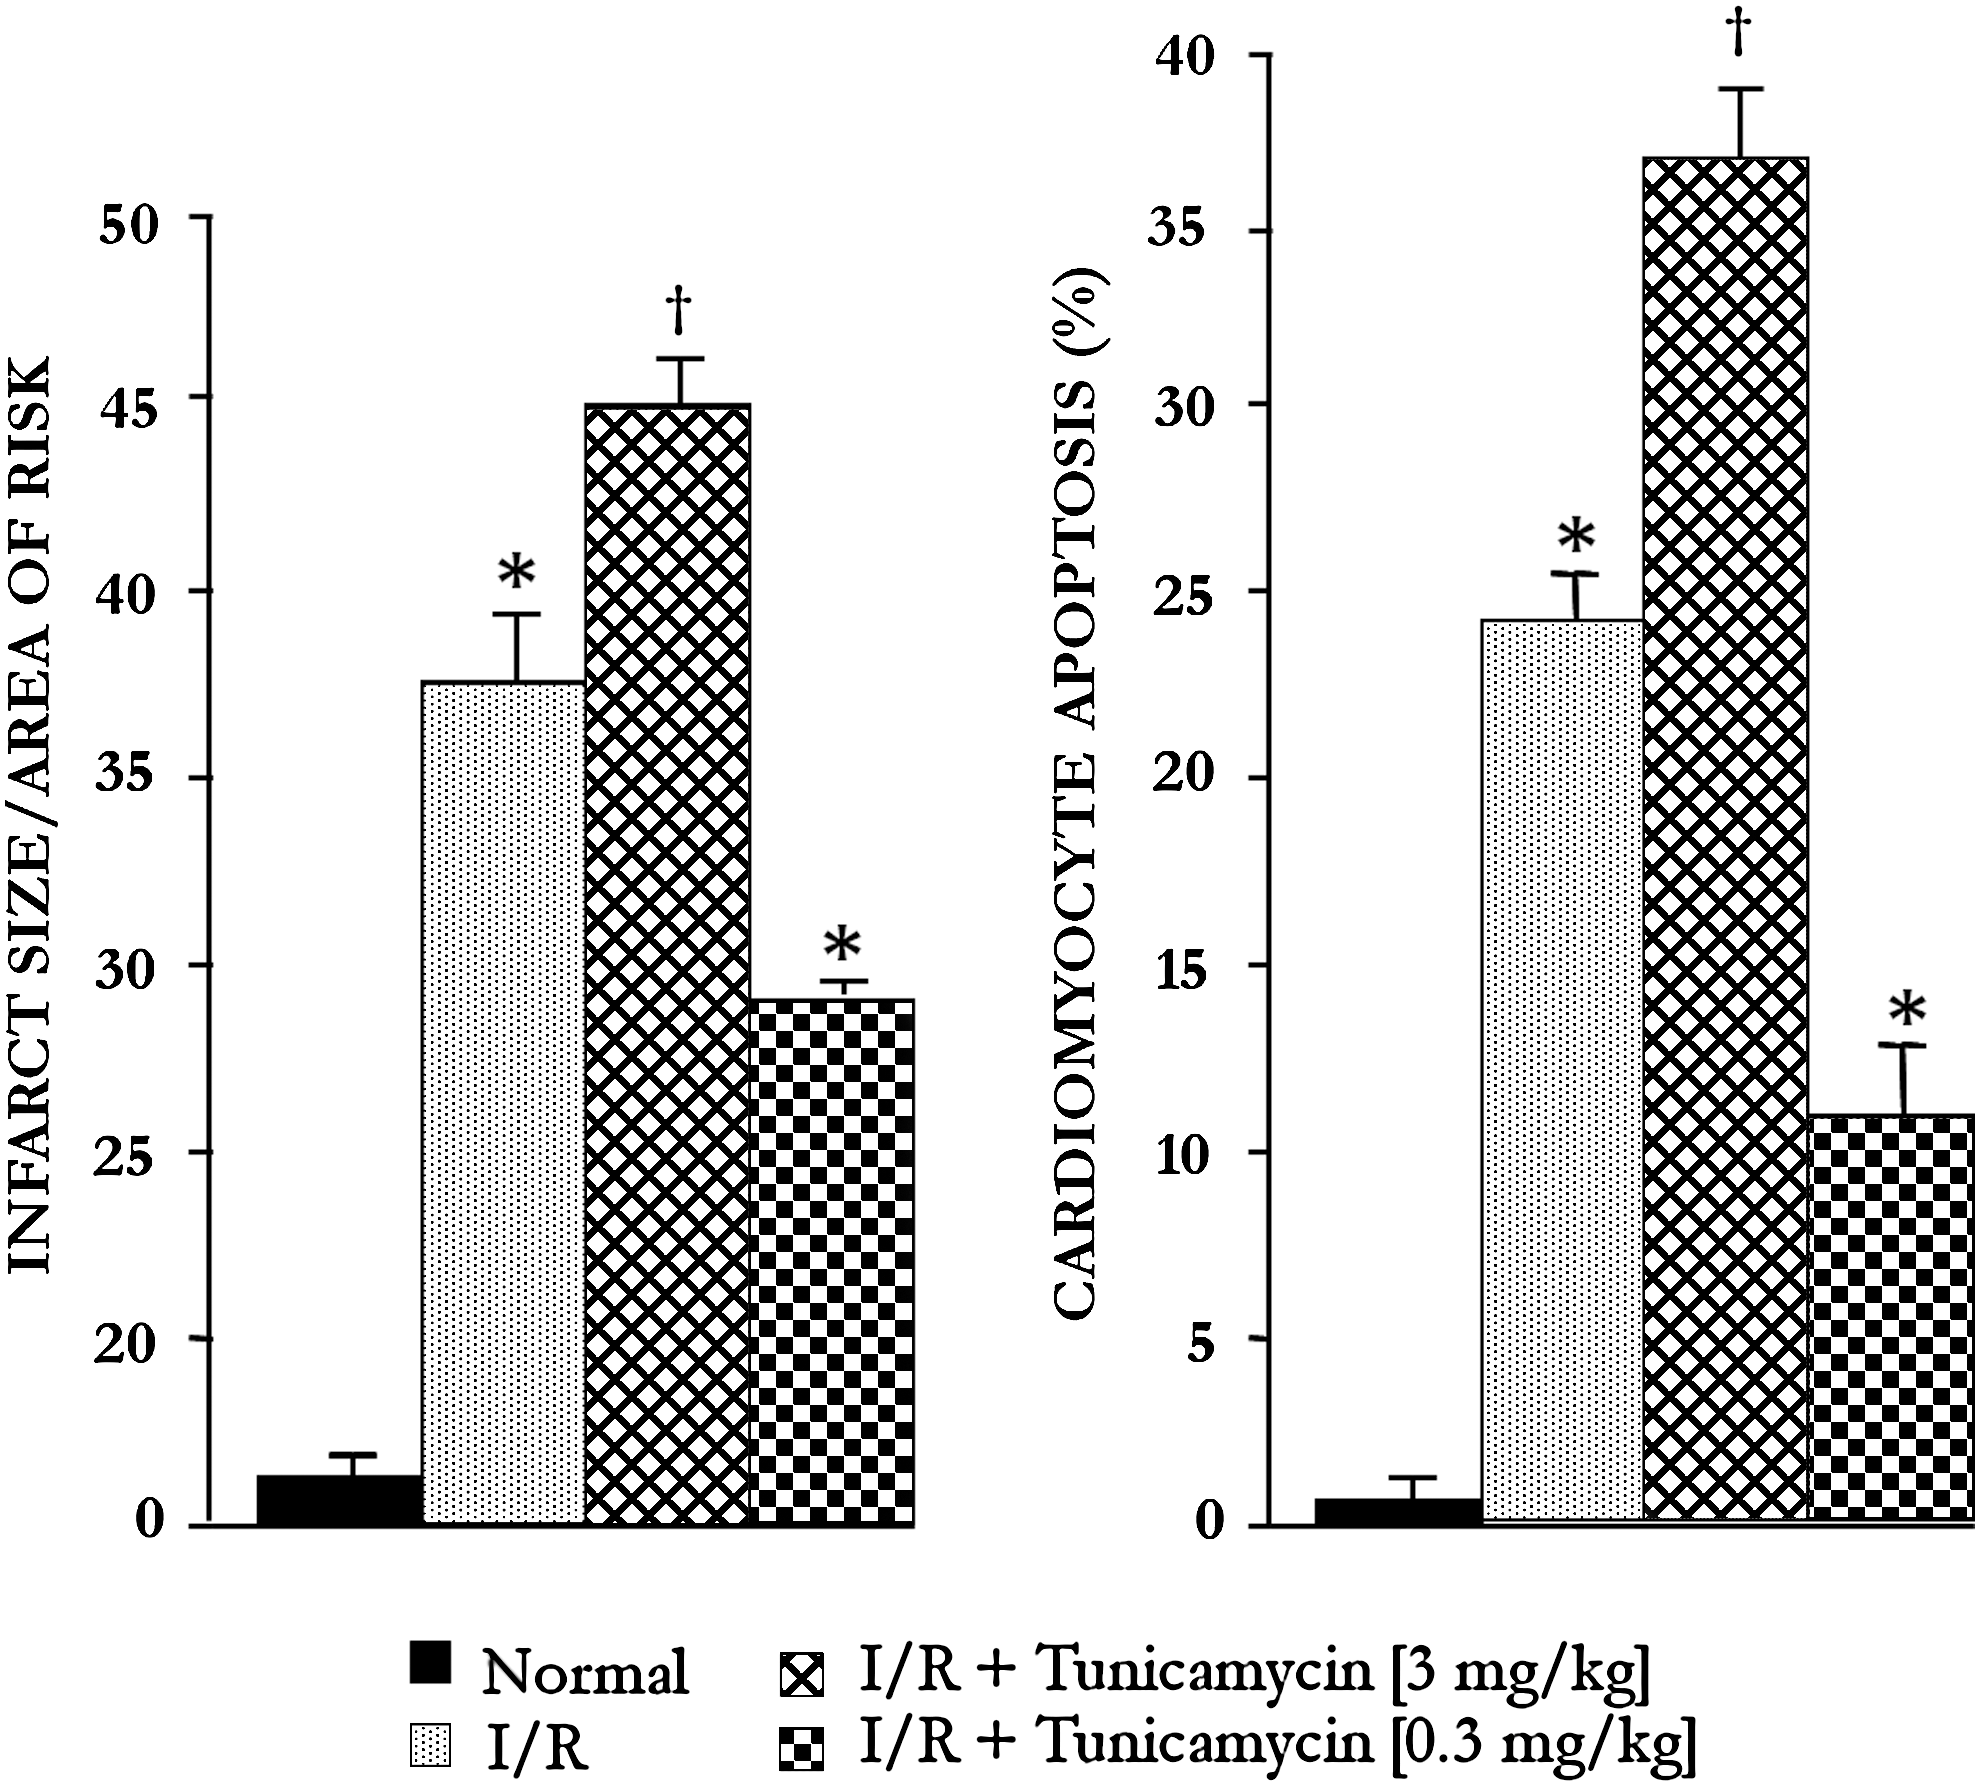
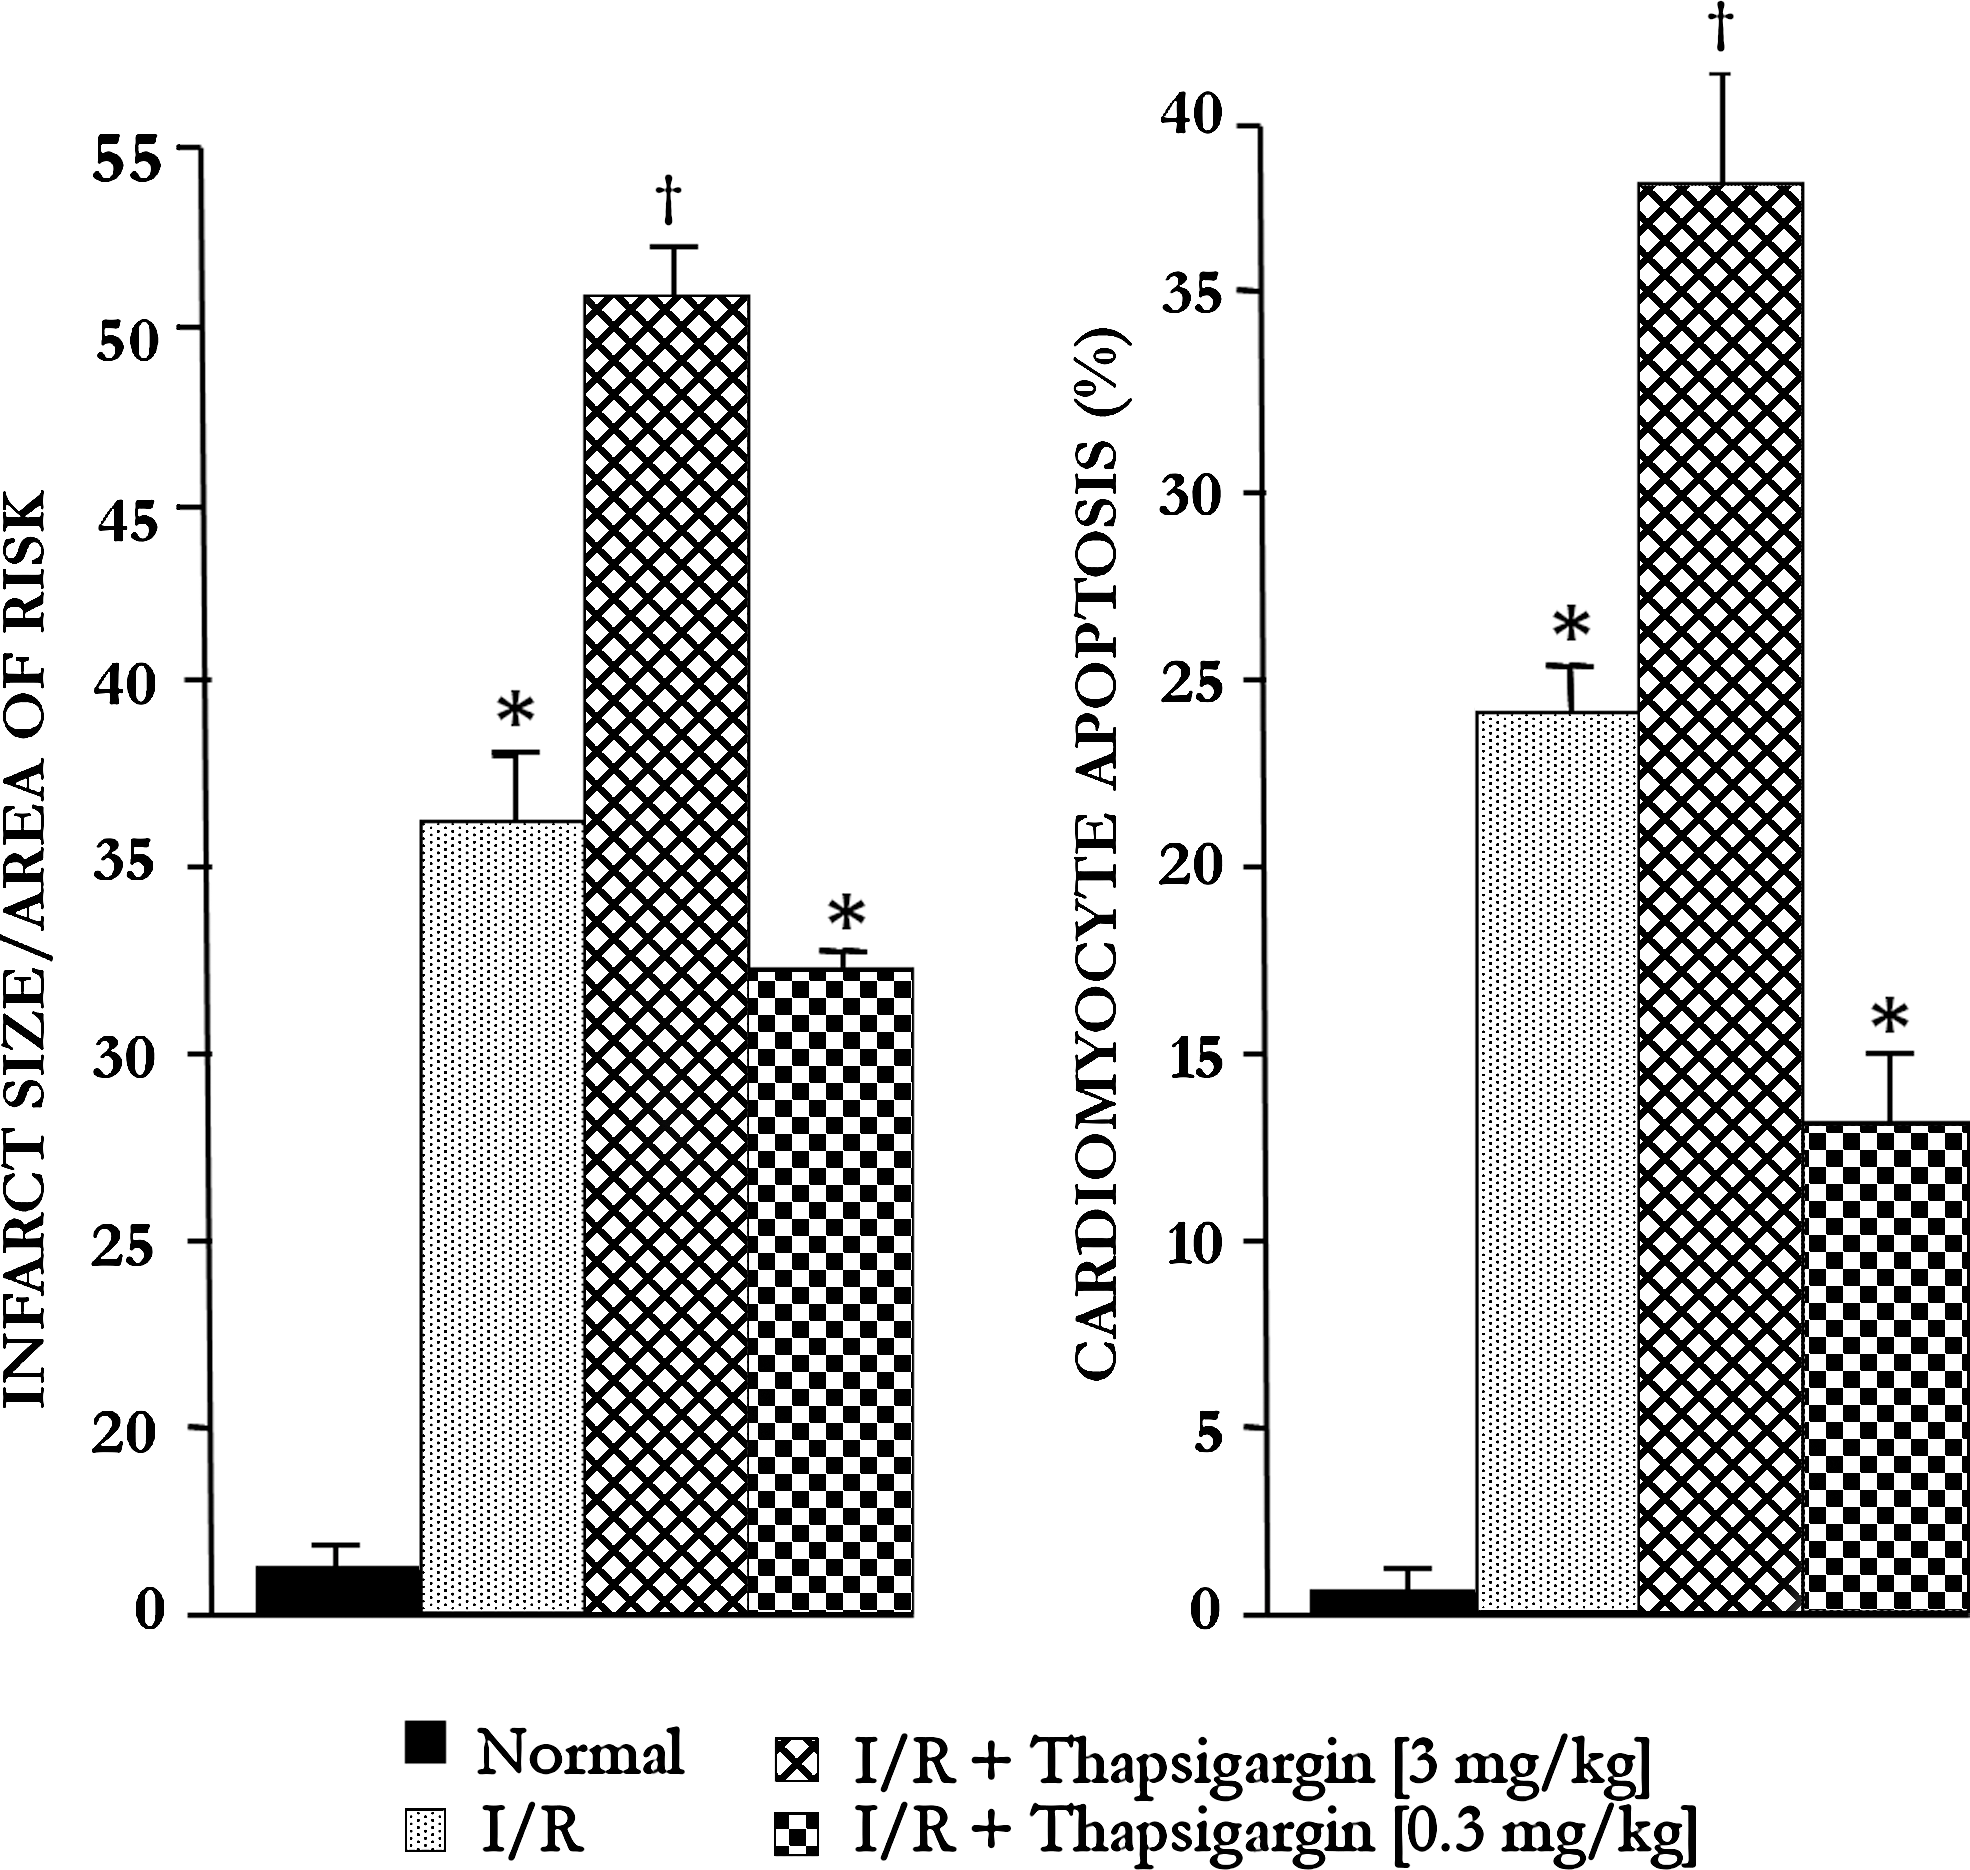
Myocardial infarct size and cardiomyocyte apoptosis (Figs. 3 and 4) were increased with 3 mg/kg tunicamycin and thapsigargin, and lower doses (0.3 mg/kg) significantly reduced infarct size and number of apoptotic cells. The results thus indicate that the higher dose of tunicamycin and thapsigargin was detrimental, whereas the lower dose was cardioprotective.
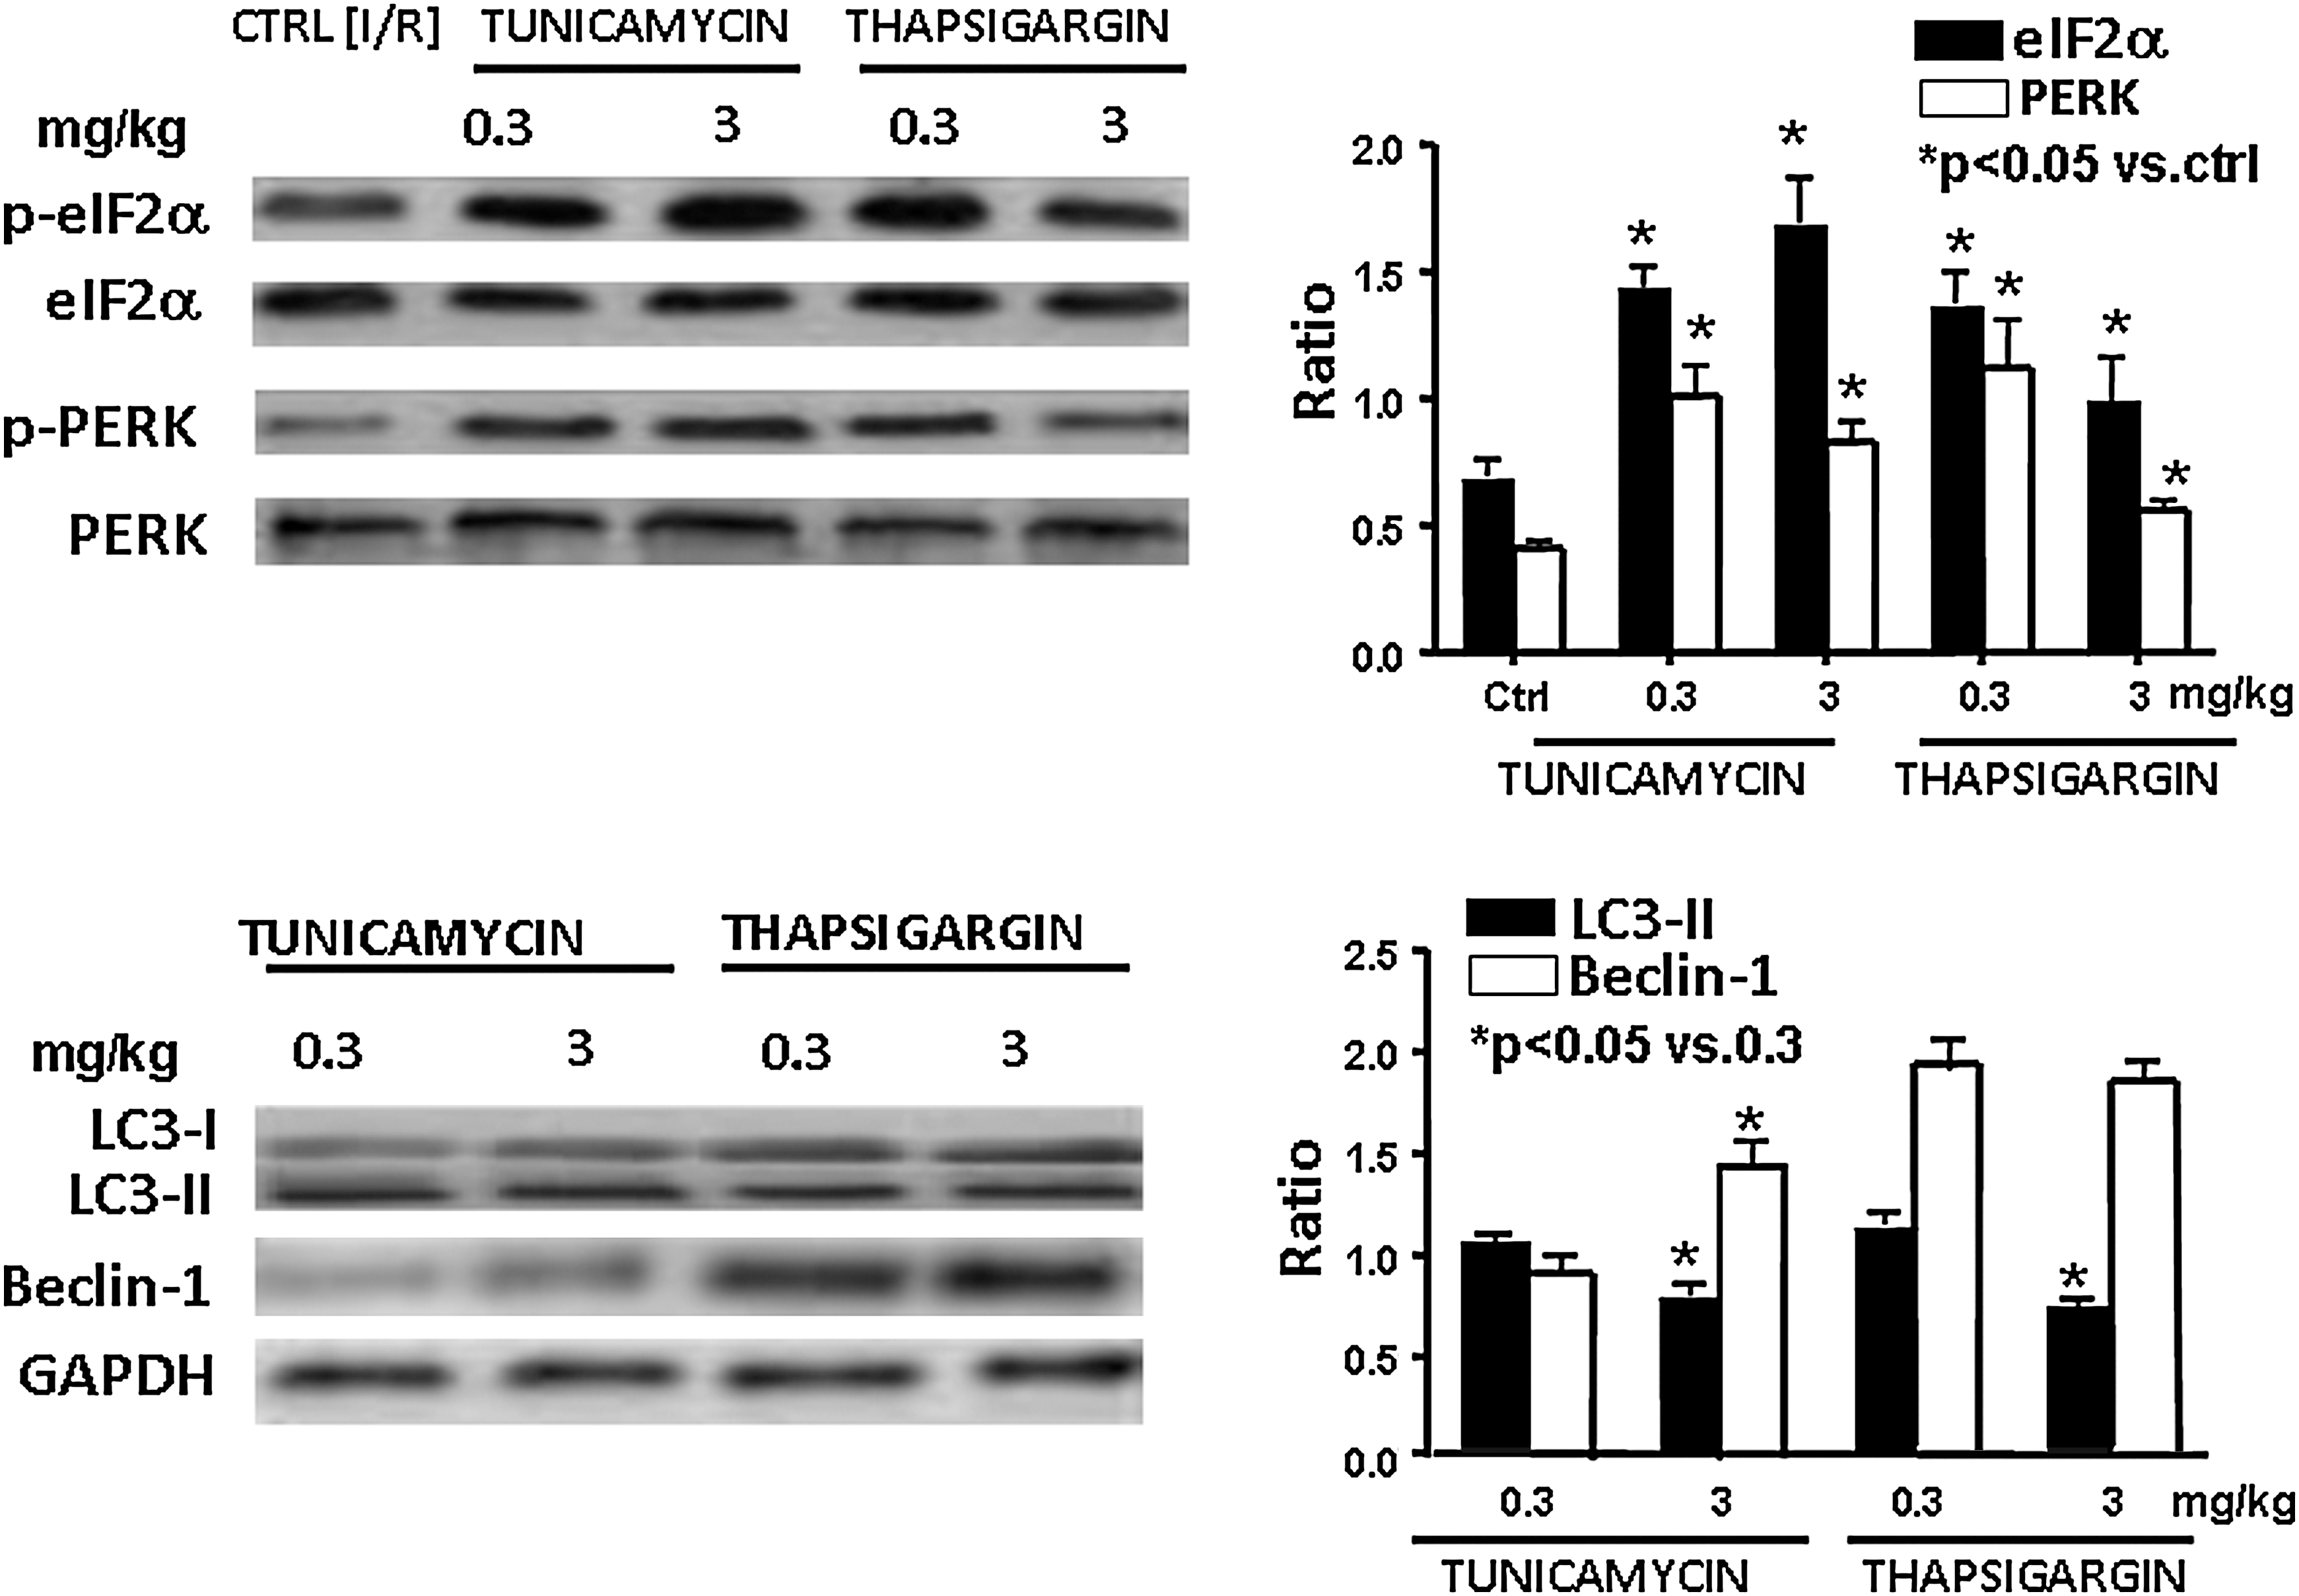
Effects of tunicamycin and thapsigargin on the phosphorylation of eIF2α and PERK and induction of the expression of LC3-II and beclin-1
Because an essential step of the autophagy formation is the phosphorylation of PERK/eIF2α, we first examined the phosphorylation status of these two ER-stress markers. As shown in Fig. 5, both low and high doses of tunicamycin and thapsigargin increased the phosphorylation of eIF2α and PERK, suggesting that both high and low ER stress can activate these proteins, leading to autophagy. These results were supported by the ability of tunicamycin and thapsigargin to induce the formation of LC3-II and beclin-1, credible markers of autophagy (Fig. 5).
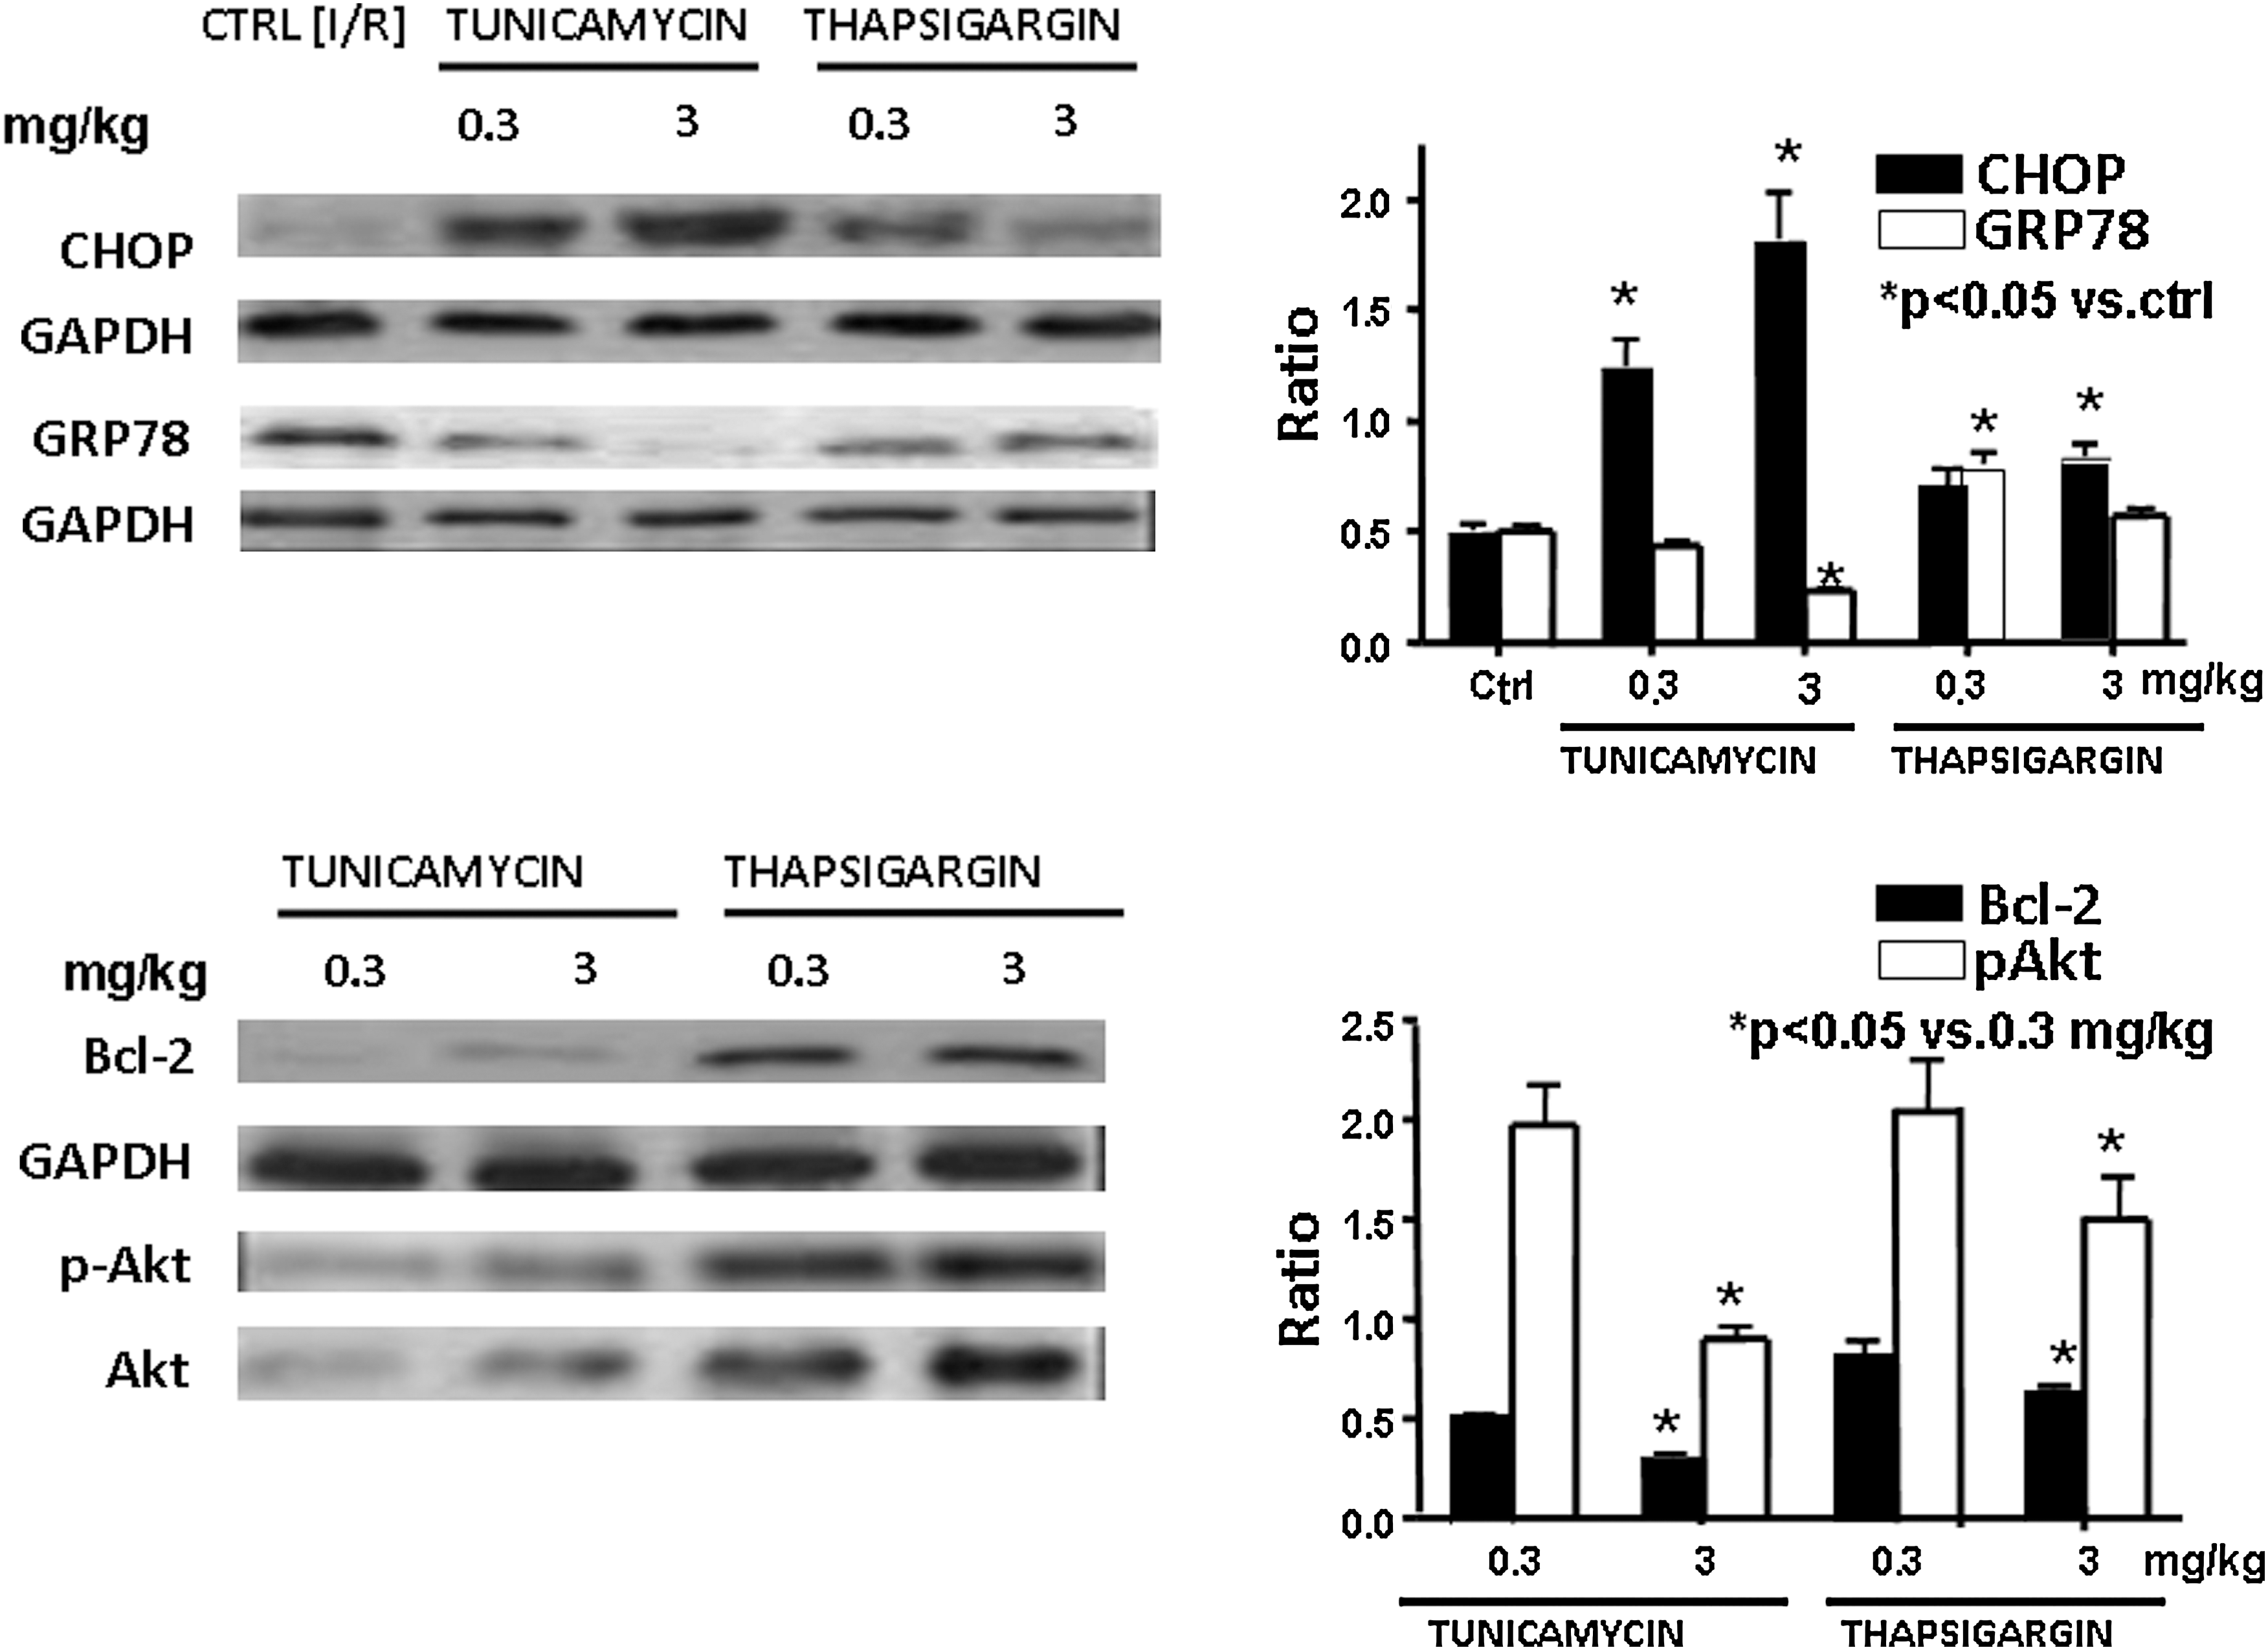
Induction of the expression of CHOP and GRP78, as well as phospho-Akt and Bcl-2
Figure 6 shows a significantly high induction of CHOP with 3 mg/kg of tunicamycin, whereas 0.3 mg/kg of both drugs induced higher amounts of GRP78. It is well known that induction of CHOP is associated with cell death, whereas induction of GRP78 induces cell survival. Corroborating these results, Fig. 6 demonstrates overall upregulation of Bcl-2, as well as increased Akt phosphorylation with 0.3 mg/kg of tunicamycin and thapsigargin, whereas the reverse was true for the high dose of these compounds. The results thus suggest that although both tunicamycin and thapsigargin induced ER stress irrespective of doses, resulting in autophagy, a low dose of these compounds induced survival signal, whereas the high dose of autophagy induced a death signal.
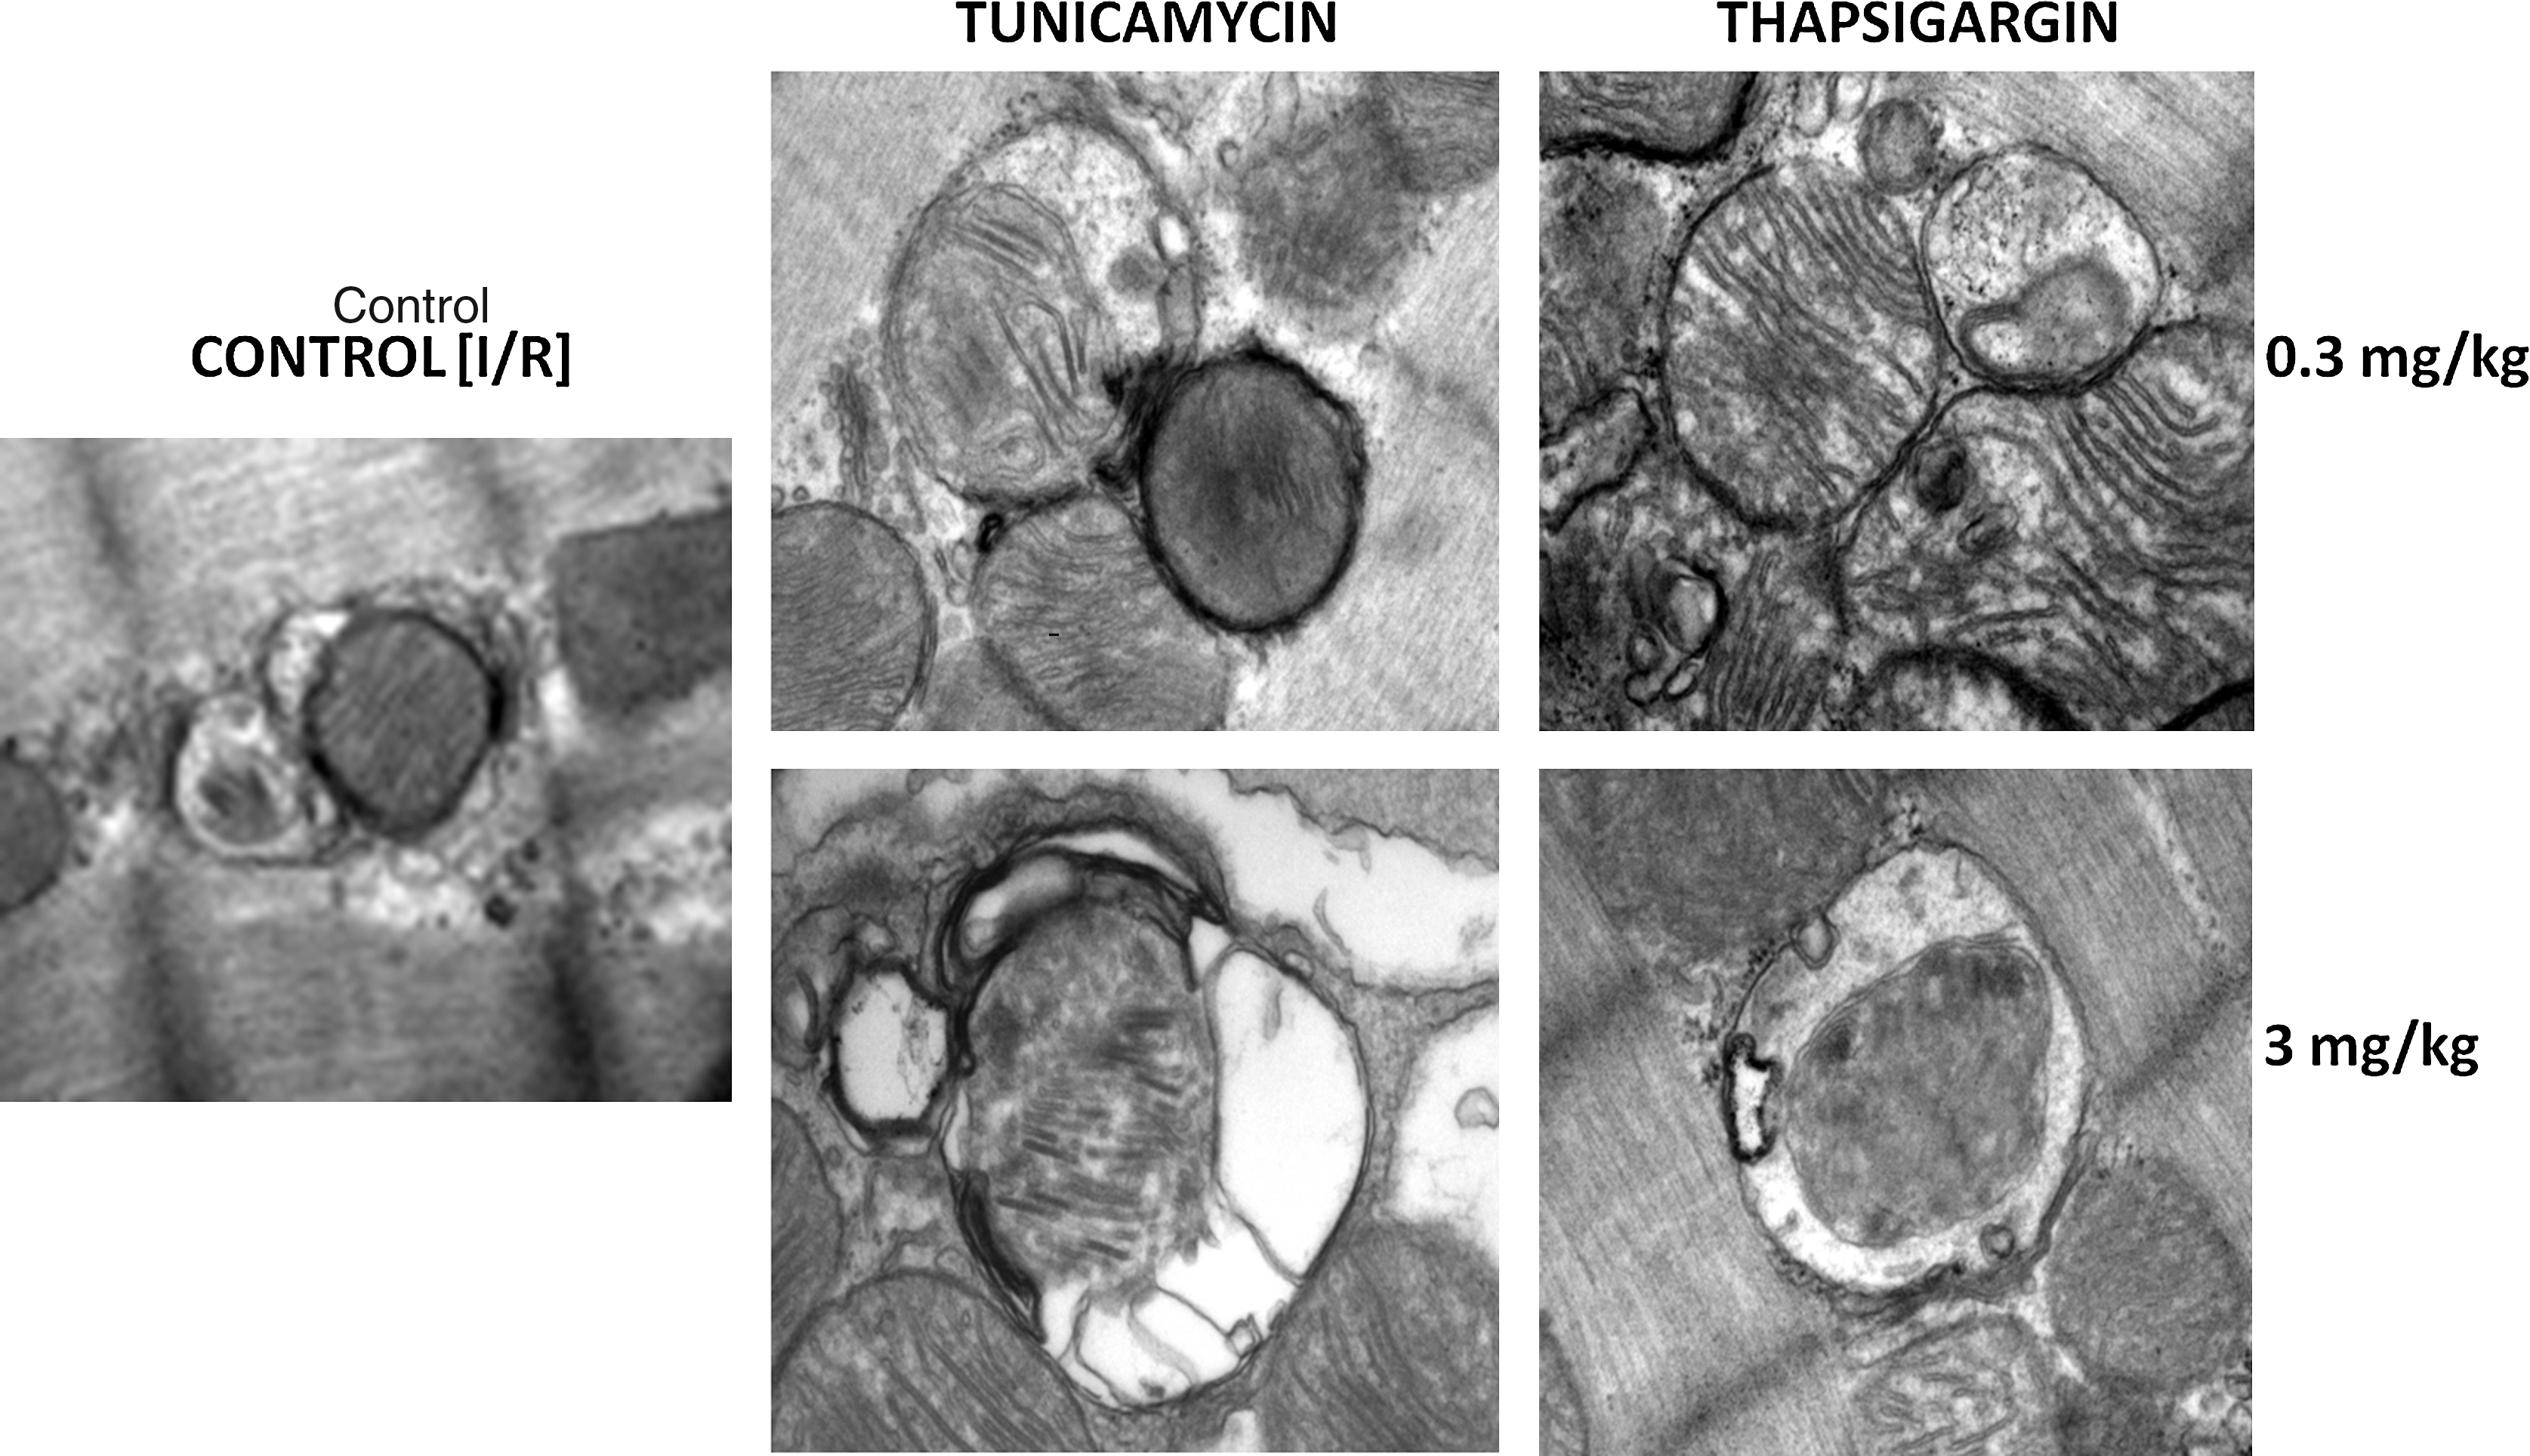
Transmission electron microscopy
The formation of autophagosomes with tunicamycin and thapsigargin was further confirmed with TEM, which clearly demonstrated that the autophagosomes formed are quite selective and are associated with mitochondria (Fig. 7). It is interesting to note that autophagosomes formed with 0.3 mg/kg of tunicamycin and thapsigargin, and those formed with 3 mg/kg of these compounds are somewhat different. First, low doses induce autophagosomes containing intact mitochondria with a characteristic double layer, whereas high doses form autophagosomes containing partially degraded cytoplasmic materials and mitochondria.
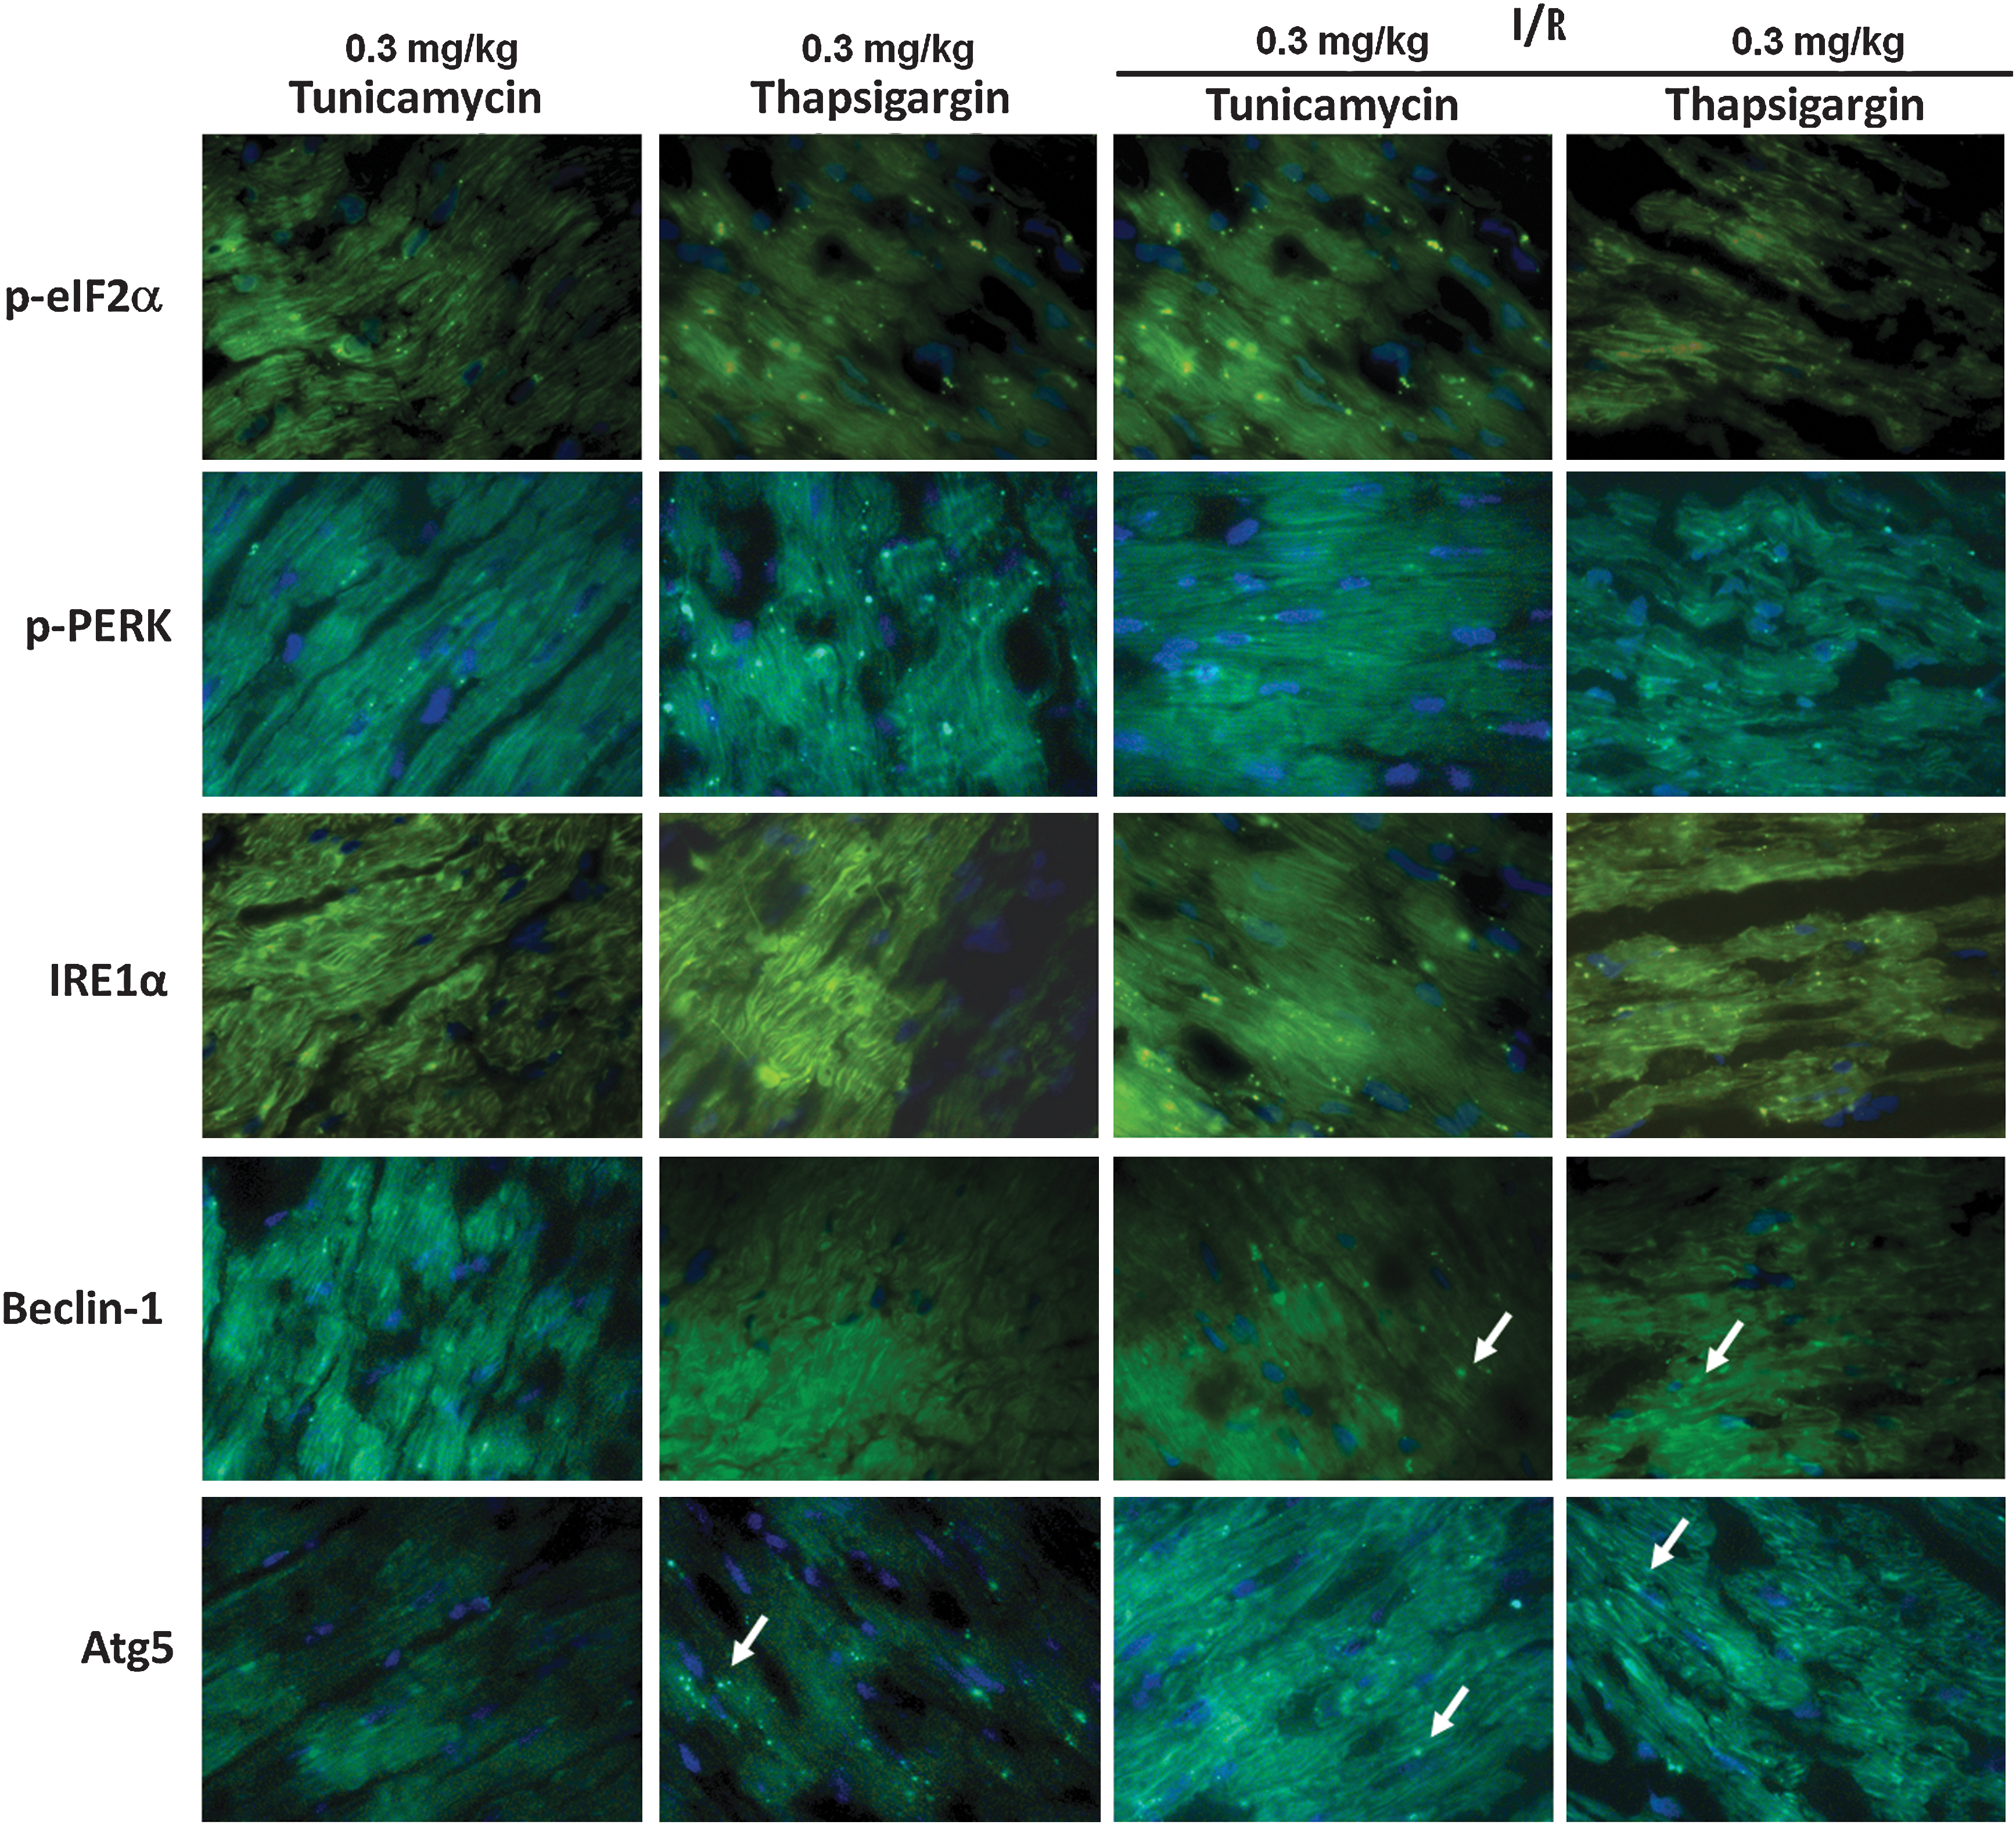
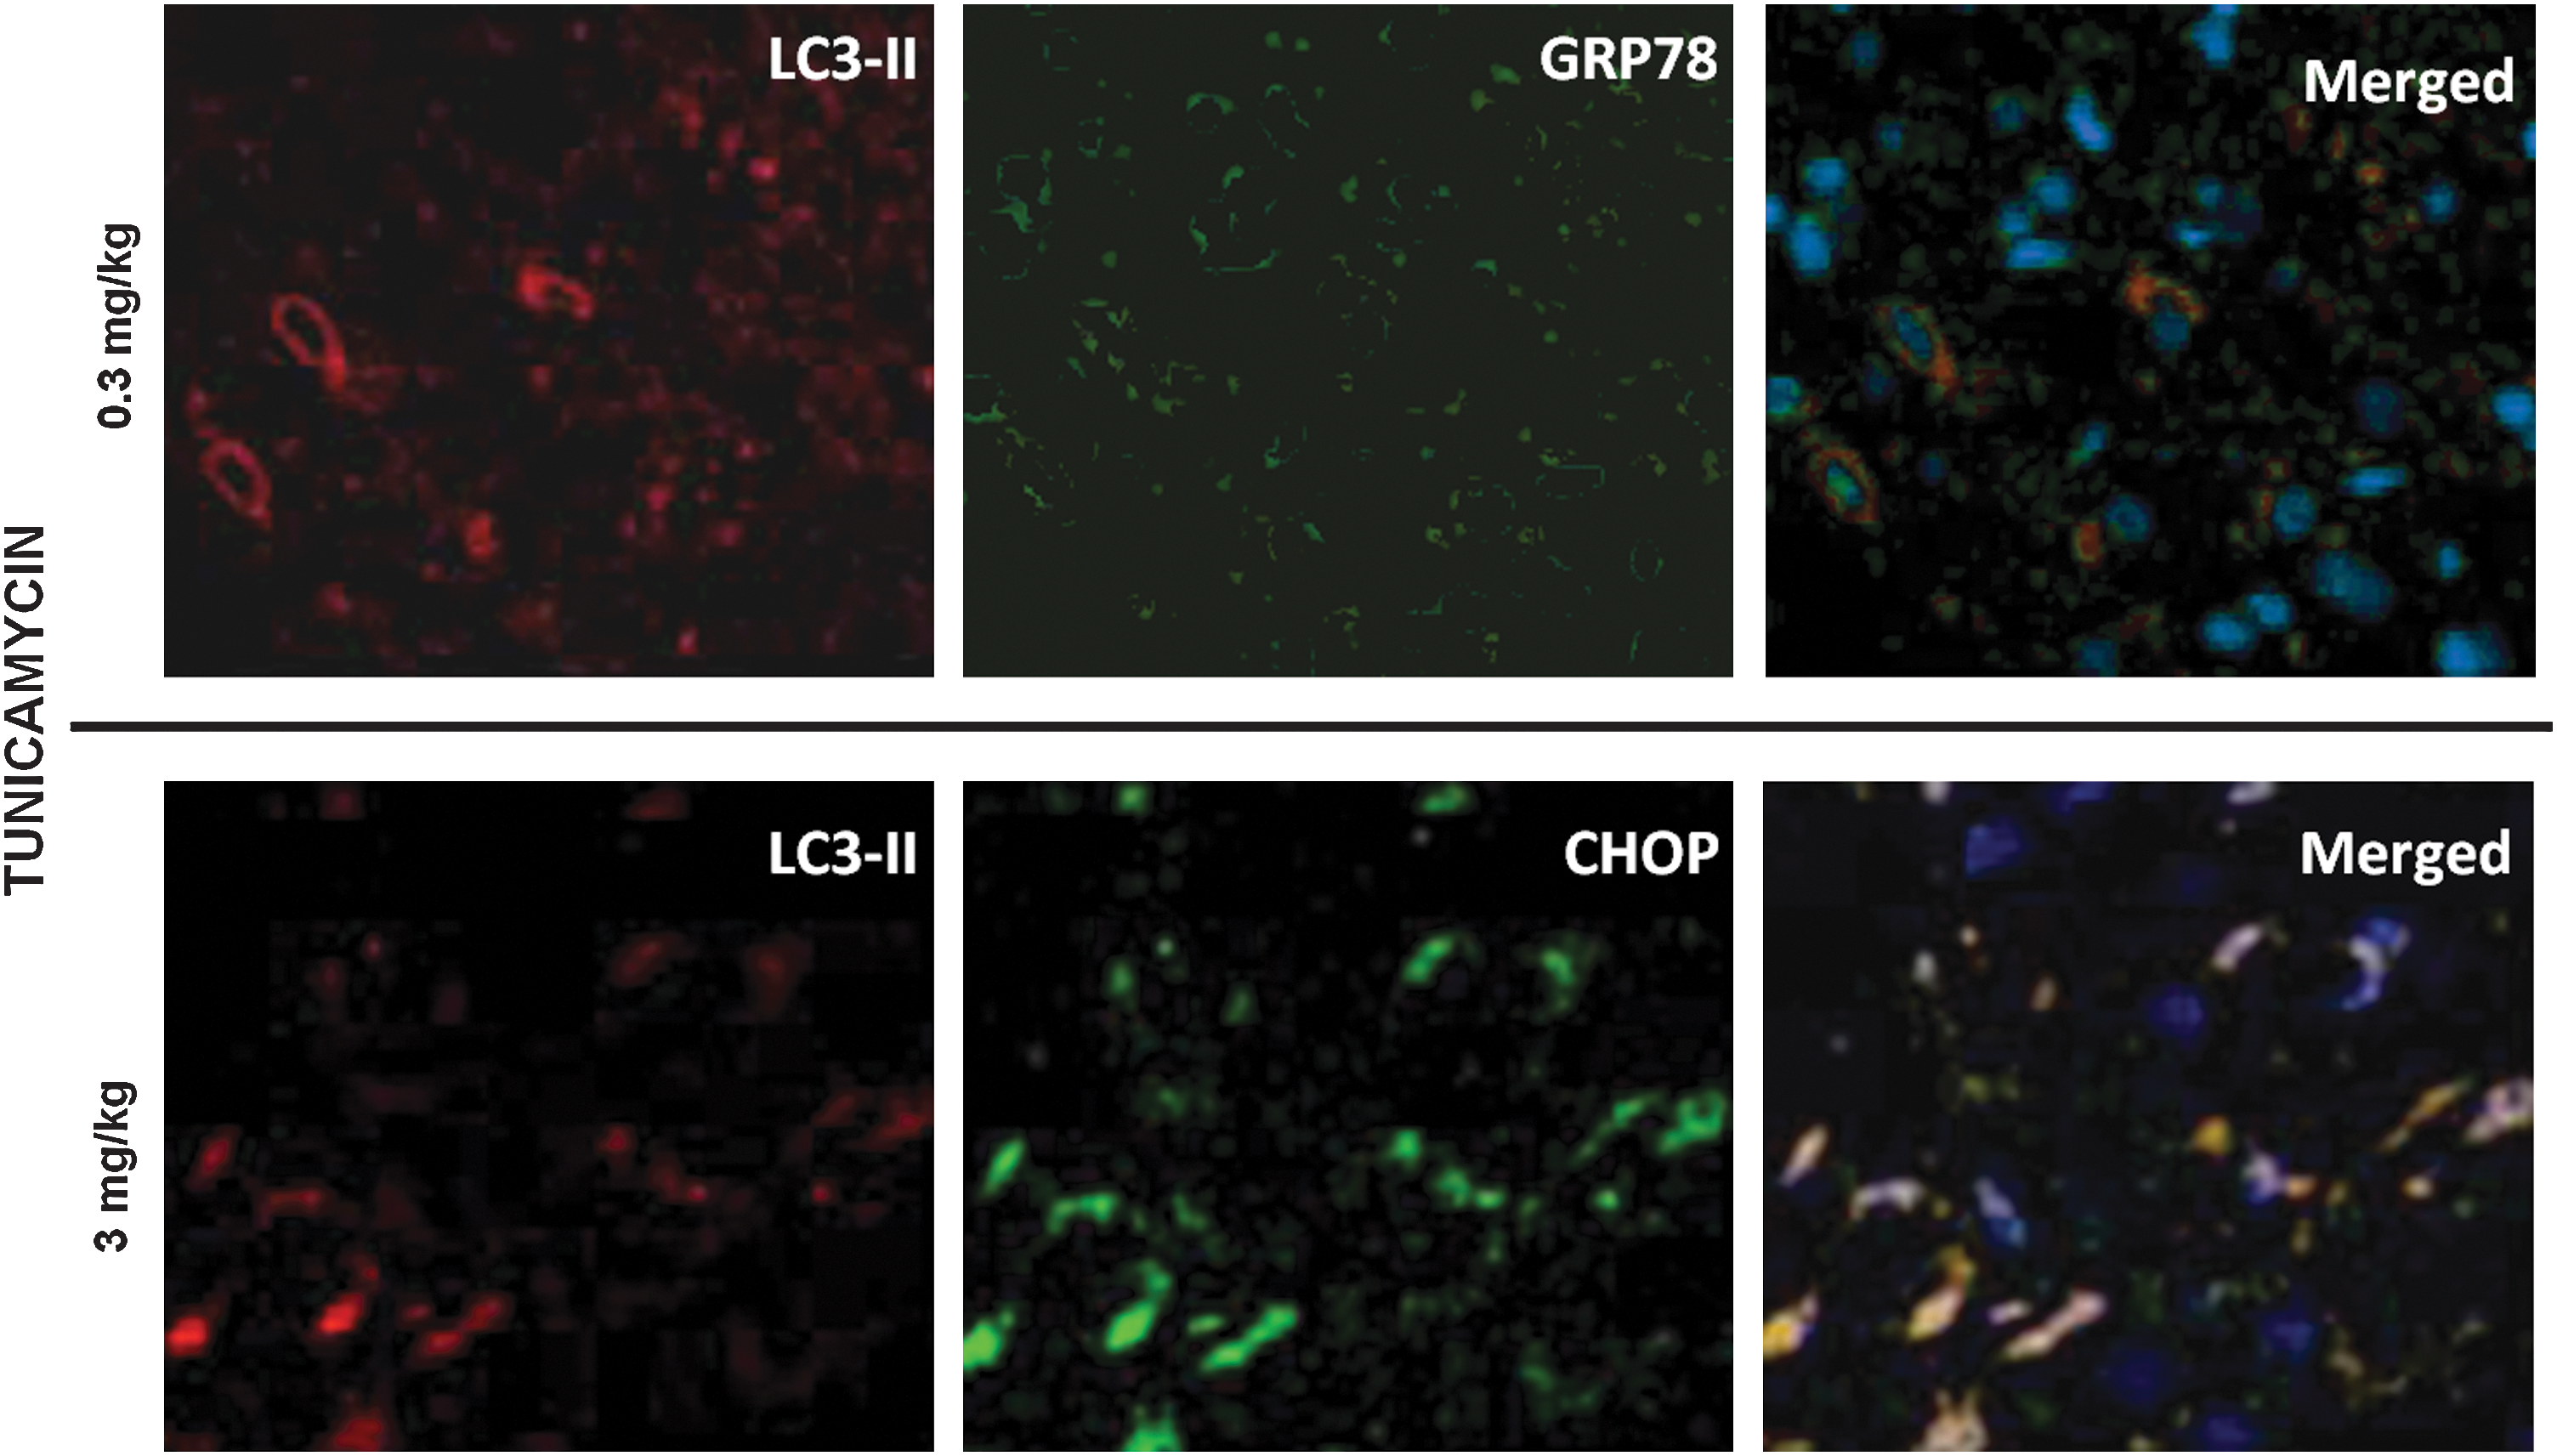
Fluorescence and confocal microscopy
Figures 8 and 9 show the results of the immunofluorescence microscopy. Fig. 8 shows that low doses (0.3 mg/kg) of tunicamycin and thapsigargin increase the phosphorylation of eIF2α and PERK, as well as IRE1α, which are maintained or further enhanced during I/R. Furthermore, tunicamycin and thapsigargin can induce the formation of beclin-1 and Atg5, ultimately leading to autophagy and cardioprotection at such a low dose. Fig. 9 shows that the low dose (0.3 mg/kg) of tunicamycin induced LC3-II and GRP78, and the merged picture clearly demonstrates the association of LC3-II and GRP78 (upper panel). In contrast, a high dose (3 mg/kg) of tunicamycin (lower panel) induced LC3-II in conjunction with the formation of CHOP, which is clearly demonstrated in the merged picture.
Discussion
The results of the present study indicate that tunicamycin and thapsigargin induced sufficient ER stress, as evidenced by the activation of eIF2α and PERK, as noted by their increased phosphorylation as well as the activation of IRE1α. Such ER stress potentiated autophagy in the heart, as evidenced by the increased LC3-II, beclin-1, and Atg5. This was also supported by the TEM, which clearly showed the production of autophagosomes. These results were echoed by the fluorescence microscopy, which showed upregulation of eIF2α and beclin-1. The autophagy produced in the face of myocardial I/R resulted either in the reduction of I/R injury, as evidenced by improved left ventricular function and reduced myocardial infarct size and cardiomyocyte apoptosis, or in increased cellular injury leading to heart failure. The induced expression of GRP78 indicated a survival signal, which was confirmed by the phosphorylation of Akt and increased expression of Bcl-2. The results thus displayed the proof of concept that induction of autophagy by ER stress before ischemia (similar to ischemic preconditioning) would reduce subsequent lethal IR injury. Our results also demonstrate the other side of the autophagy. If the ER stress was excessive, autophagy still occurred, but this time, autophagy led to cellular death. The M-mode echocardiogram showed indications of heart failure. The difference was that this time, Western blot showed the induction of the activation of CHOP. Furthermore, a reduction in the expression of Akt phosphorylation was noted.
Several lines of evidence suggest that ER stress can go both ways [e.g., can induce apoptosis during I/R (24) or can confer protection of the I/R myocardium (18). In our study, we noticed an identical scenario: tunicamycin and thapsigargin at higher doses were detrimental to the hearts (heart failure was reflected by the reduced cardiac function and increased infarct size and apoptosis). We performed several studies to determine optimal doses that could induce a cardioprotective amount of ER stress. In this respect, ER stress appears to behave like pharmaceutical preconditioning agents, which only at optimal doses function as preconditioning agents, but at higher doses are detrimental to the cells. Previous workers, however, linked cardioprotection with ER stress only. For example, induction of the expression of ER stress proteins GRP94 and GRP78 was linked with cardioprotection (21). In contrast, our results clearly show that ER stress readily induces autophagy and reveals characteristic double-layer autophagosome formation. The formation of beclin1 and LC3-II, the two credible markers of autophagy, was increased in concert. It appears that this is a case of controlled ER stress induction caused by the accumulation of unfolded proteins that trigger the unfolded protein response and potentiate autophagy. When ER stress is overwhelming, however, ER function can no longer be restored, and then the apoptotic machinery is activated for the removal of cells. The authors term this phenomenon ER stress preconditioning, because similar to preconditioning, when stress is overwhelming, it triggers apoptosis. Previously, studies with yeast showed that dithiothreitol and tunicamycin, at concentrations that trigger the unfolded protein response, upregulated the expression of ATG genes and ATG-dependent autophagy (27). The amount of ER stress, however, varies from species to species. For example, high concentrations of tunicamycin were required to induce ER stress–mediated autophagy for Saccharomyces cerevisiae (3).
We detected LC3-II formation (membrane-bound form) from LC3-I (free form) as a key step for the induction of autophagy in mammalian cells (13) The activation of beclin-1 further confirms the initiation of autophagy. It is important to note that ER stress regulates eIF2α phosphorylation through activation of protein kinase regulated by RNA (PKR)-like ER kinase (PERK). Although we did not confirm it, from the literature, it appears that the phosphorylation of PERK/eIF2a is essential for the conversion of LC3-II from LC3-I (12).
Previous studies support the notion that ER stress can express both GRP78 and CHOP, depending on the amount of stress. GRP78 is generally cardioprotective (28). Endothelin-1–mediated protection from hypoxia in cardiac myocytes was ablated by a GRP78 antisense oligodeoxynucleotide (20). A related study showed that GRP78 protects cells from apoptosis induced by topoisomerase inhibition (22). A recent study showed that GRP78 expression inhibits insulin and ER stress–induced SREBP-1c activation and reduces hepatic steatosis in mice (11). Unlike the expression of GRP78, which is cardioprotective, the expression of CHOP is detrimental to the heart. In our study, when the ER stress was relatively high and echocardiography showed clear signal for heart failure, we found the expression of CHOP in the hearts. These hearts had worse ventricular function, increased infarct size, and cardiomyocyte apoptosis. Previous studies also demonstrated increased apoptosis with CHOP during ER stress (9). These authors showed that excess stress to the ER triggers apoptosis, but the mechanisms underlying these processes remain unclear. Here we show that excess ER stress also induces autophagy, but such autophagy leads to cardiomyocyte death.
Another recent study showed that CHOP induced ER stress–induced apoptosis in T cells (23). Furthermore, prolonged ER stress in the hypertrophic and failing heart after aortic constriction led to the induction of CHOP (19). The results indicated that when ER stress was excessive or prolonged, the initiation of the apoptotic processes was promoted by transcriptional induction of CHOP. Consistent with these previous reports, our results revealed increased ER stress–induced heart failure but still with an induction of autophagy.
In summary, the results of the present study indicate that tunicamycin and thapsigargin induced sufficient ER stress, as evidenced by the activation of eIF2α and PERK, leading to the potentiation of autophagy in the heart, as evidenced by the increased LC3-II, beclin-1, and Atg5 expression. This was also supported by the TEM, which clearly showed production of autophagosomes. Fluorescence microscopy showed upregulation of eIF2α and Beclin-1. The autophagy produced before myocardial I/R resulted either in the reduction of I/R injury, as evidenced by improved left ventricular function and reduced myocardial infarct size and cardiomyocyte apoptosis, or in an increased cellular injury, leading to cardiac injury.
Footnotes
Acknowledgment
This work was supported in part by OTKA 78223.
Author Disclosure Statement
No competing financial interests exist.