
Abstract
This article has been officially retracted from the Journal
Introduction
Innovation
As part of a molecular understanding of adult stem cell differentiation and self-renewal, stemness gene-controlling Ago2 plays a very important role as a key regulator in the nucleus. This study indicates that nuclear Ago2 has crucial roles in self-renewal and differentiation in hUCB-MSCs via stemness gene expression and activation of JAK2/STAT3 and Wnt5A/ β-catenin. Ago2-mediated cell self-renewal in hUCB-MSCs occurs by direct Ago2 binding and positive regulation at regulatory regions of the Oct4, Sox2, Nanog, and β-catenin genes. These genes participate in feed-forward regulation to tune the expression levels of key genes and modify gene expression programs to obtain stem cell multipotency and long-term proliferation and survival. With the highly improved growth activity and differentiation potency induced by the adult stem cell reprogramming, stem cells have therapeutic potential for use in improved cell-based disease therapies.
Mesenchymal stem cells (MSCs) are progenitor cells capable of differentiating into a variety of mature tissues. There are also multipotent stromal cells from bone marrow. MSCs have generated much interest as a potential source for cell-based therapeutic strategies. They can be isolated from various tissues, including umbilical cord blood (UCB). Human UCB-MSCs are useful for the regeneration of damaged tissues because they have the most valuable potential for assuming different cell phenotypes, such as osteocytes, chondrocytes, adipocytes, hepatocytes, neurons, myocytes, and keratinocytes with anti-inflammatory capacity (15). Also, we can assume that hUCB-MSCs and embryonic stem cells (ESCs) exhibit similarities in signal transduction pathways. ESCs are pluripotent stem cells that can self-renew and have the capacity to divide for indefinite periods without differentiation. In specific developmental environments, ESCs can differentiate into any of more than 200 specific cell types that make up an organism. To gain insight into human development and to realize the therapeutic potential of stem cells, an understanding of transcriptional regulation in stem cells, including hUCB-MSCs, and of early cellular differentiation is crucial. The transcriptional regulatory network of ESCs or of fetal hUCB-MSCs that maintains and controls cell pluripotency and self-renewal involves Oct4, Sox2, Nanog, and REX1, which are well-known transcription factors. Stemness, which involves maintaining the balance between self-renewal and differentiation and the ability to switch from one state to another, is fundamental to both embryonic stem cell plasticity and developmental re-programming of mature cells. ESC pluripotency is regulated both by extrinsic signaling pathways and by intrinsic gene regulatory mechanisms involving a network of the aforementioned transcription factors (1, 4, 5, 8, 12). Thus, to better understand the biology of embryonic development and to develop the therapeutic potential of stem cells, it is critical to discover the molecular mechanisms that regulate stem cell differentiation and the stages at which cell lineages are induced and specified. These stem cell processes likely involve extracellular signaling factors, transcription factors, cell-cycle regulators, microRNA, genes implicated in chromosomal stability, and DNA methylation (11, 13, 16, 20, 22, 23, 25). Transcription factors, including stemness genes that control stem cell plasticity and self-renewal, have been identified (22, 23) and the core circuitry by which these factors exert their regulatory effects on protein-coding genes has been described (25, 26, 27, 28, 31, 32, 34, 36).
Our recent study showed that the microRNA processing protein Ago2 actively induces hUCB-MSC cell proliferation via functional genes including stemness genes directly after binding to gene regulatory regions. It is possible that Ago2-initiated signal activation of JAK/STAT3 and Wnt5A/β-catenin via Oct4 can be exploited for the purpose of improving their therapeutic value of hUCB-MSCs.
Results
Ago2 nuclear localization and binding to regulatory regions of stemness gene in hUCB-MSCs
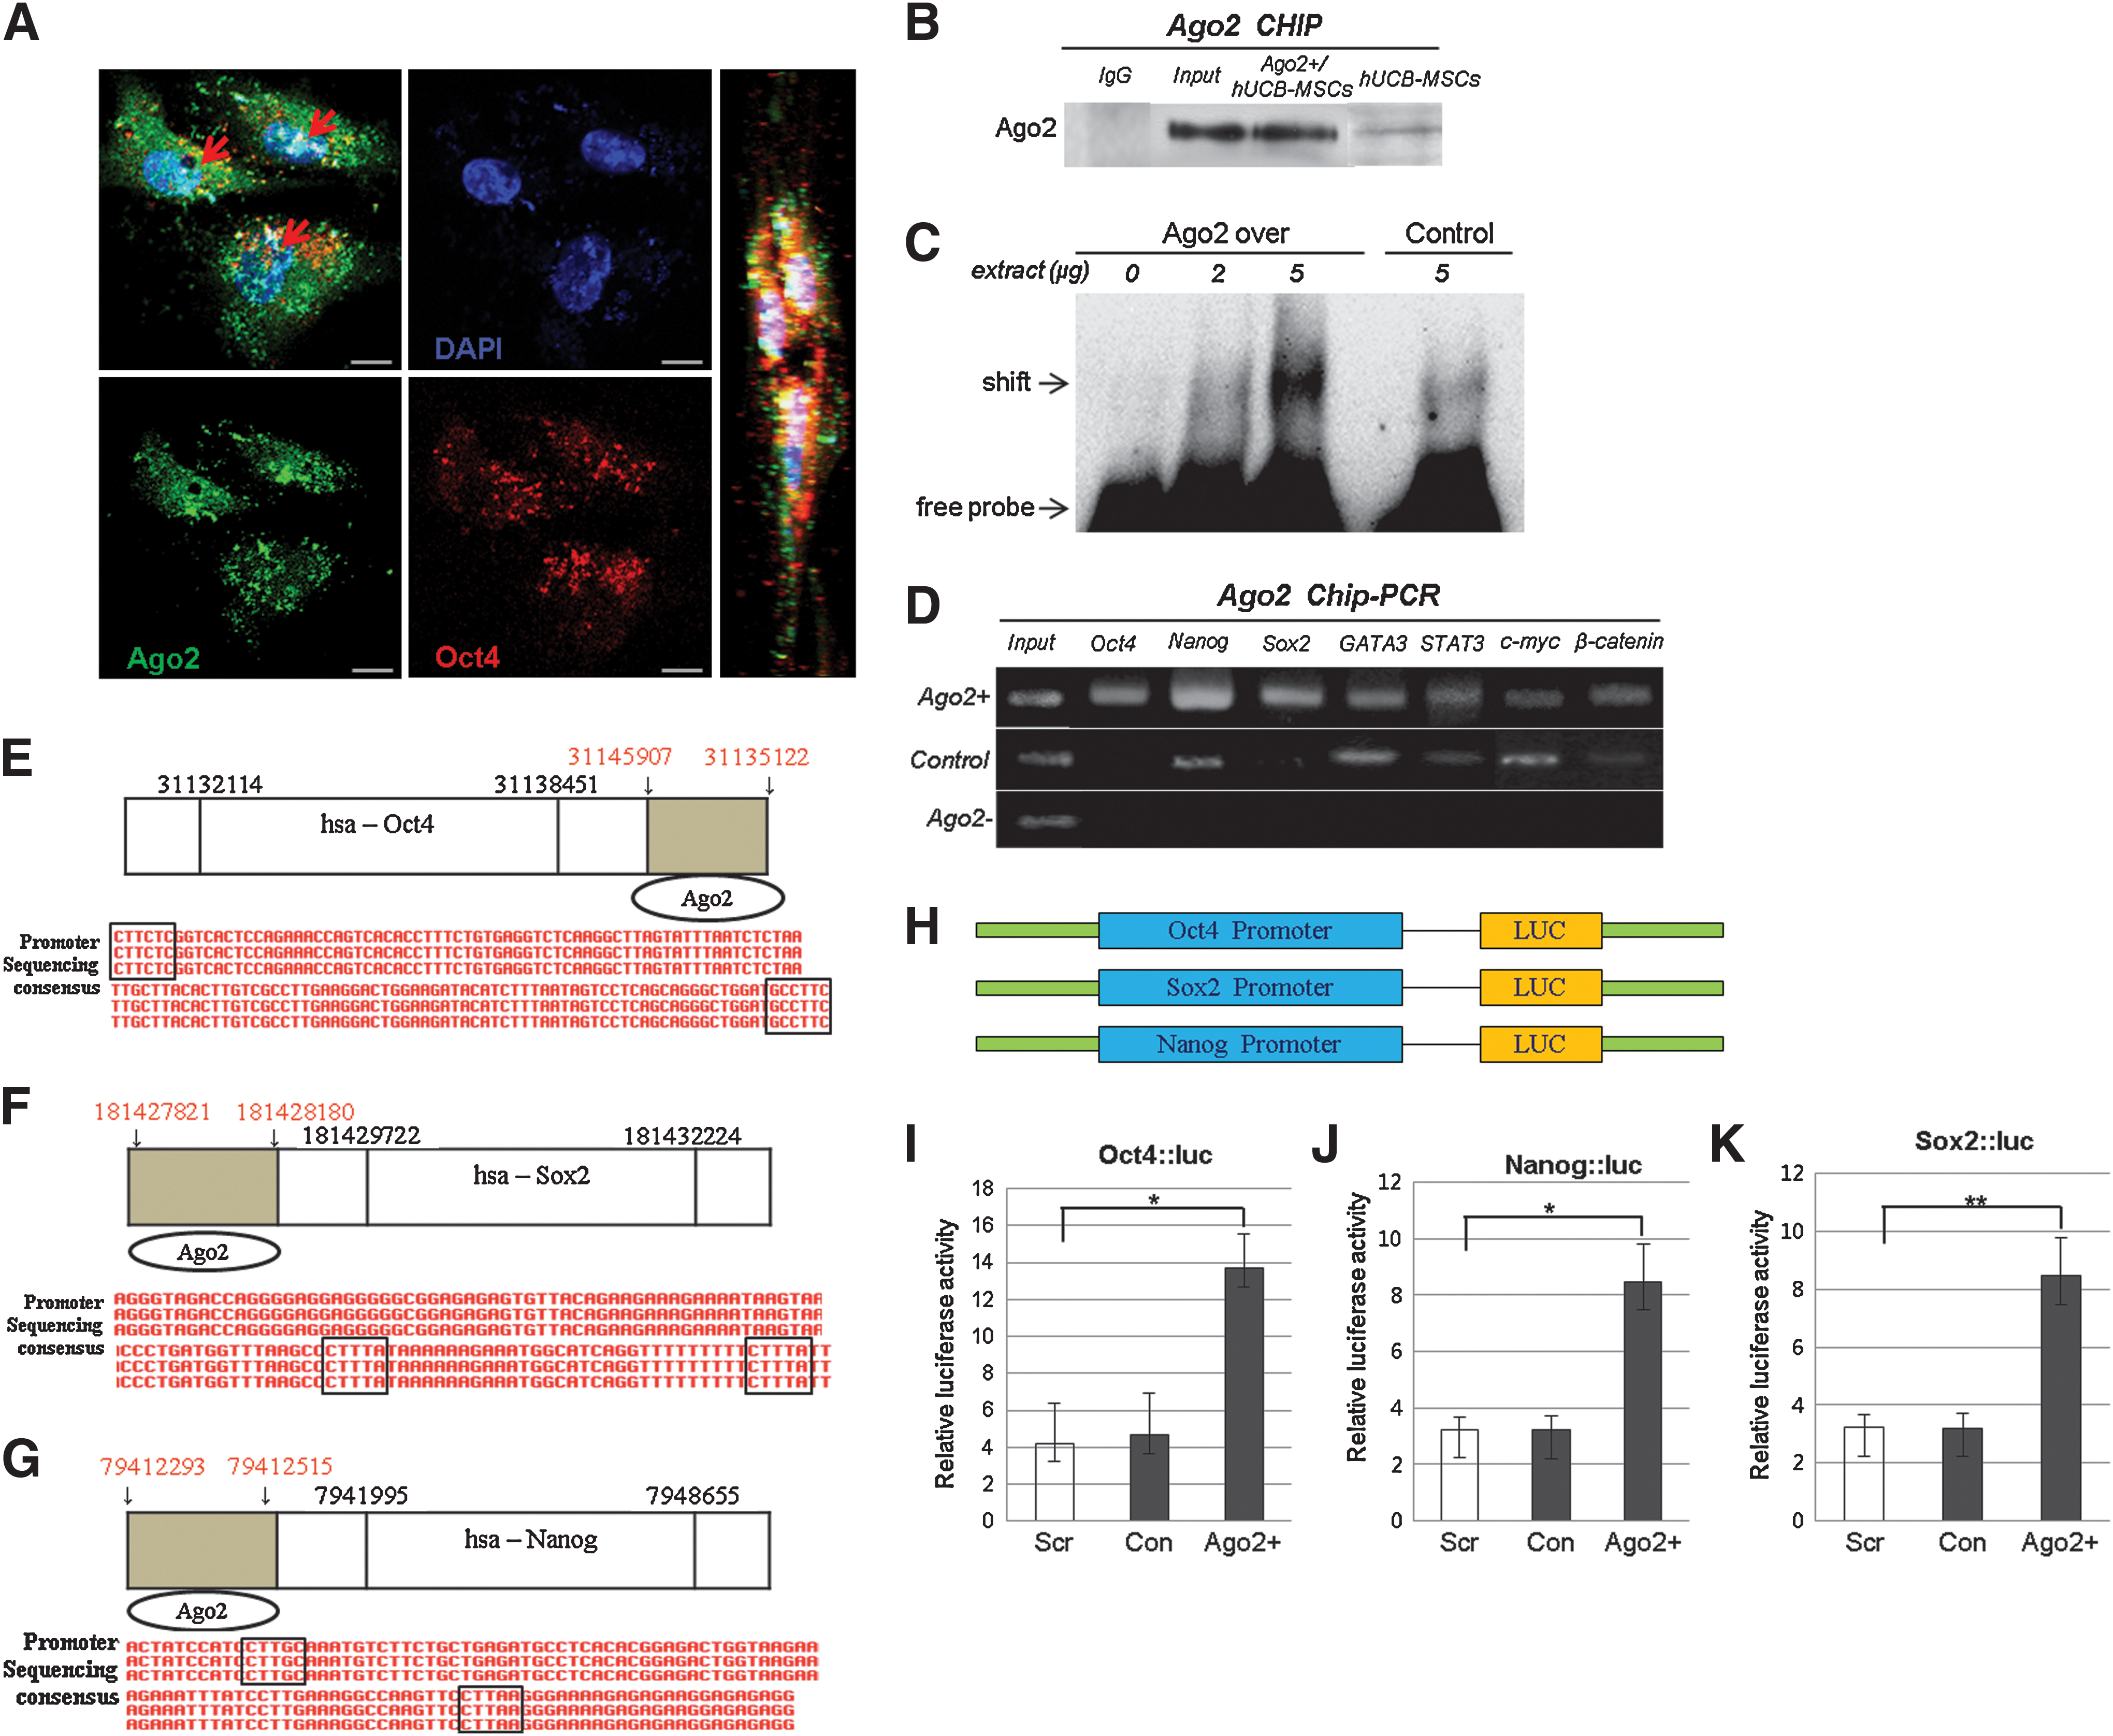
In cultured hUCB-MSCs, we found that Ago2 was localized to the nucleus in significantly high levels of Ago2 expressing cells via immunocytochemistry, CHIP immunoblotting, and electrophoresis mobility shift assay (EMSA) DNA binding assays (Fig. 1). Foremost, we found nuclear localization of Ago2 in cultured hUCB-MSCs. The immunocytochemical image in Figure 1A shows co-localized DAPI (blue), Ago2 (green), and Oct4 (red) in the nucleus. Our Western blot analysis of Ago2 localization in the nucleus also supported the Ago2 ChIP results before and after Ago2 overexpression in cultured hUCB-MSCs (Fig. 1B). Furthermore, EMSA was performed to obtain direct evidence of physical binding of Ago2. Nuclear proteins were extracted from cultured hUCB-MSCs (Ago2 overexpressed cell or control cell) and reacted with a biotin-labeled DNA probe containing the Ago2 binding sequence of the promoter. The addition of the Ago2 probe to these cell extracts induced a shift in mobility of the probe in the gel, indicating a direct interaction between the Ago2 probe and nuclear proteins (Fig. 1C). Ago2 ChIP/PCR analysis result revealed that nuclear Ago2 bound to the regulatory regions of the stemness genes Oct4, Nanog, Sox2, c-Myc, β-catenin, and GATA3 (Fig. 1D). Our previous study (9) reported an Ago2-binding nucleotide sequence in Ago2-treated hUCB-MSCs and control human adipose tissue stem cells (hATSCs). Furthermore, we determined the consensus nucleotide sequence motifs of Ago2-binding genes, including SEPN1 and miR10b, by detecting multiple overlapping consensus ChIP DNA fragment sequences (9). In this study, we also detected Ago2 bound to specific sequences in the regulatory regions of the Oct4, Sox2, and Nanog genes (Figs. 1E–1G). Next, we investigated the expression of stemness genes using a luciferase assay. Ago2 stimulation enhanced luciferase activity driven by the Oct4, Sox2, and Nanog promoter in hUCB-MSC cells (Fig. 1I–1K). In hUCB-MSCs transfected with Ago2, luciferase activity induced by Ago2 transfection was markedly increased.
Ago2 regulates hUCB-MSC proliferation
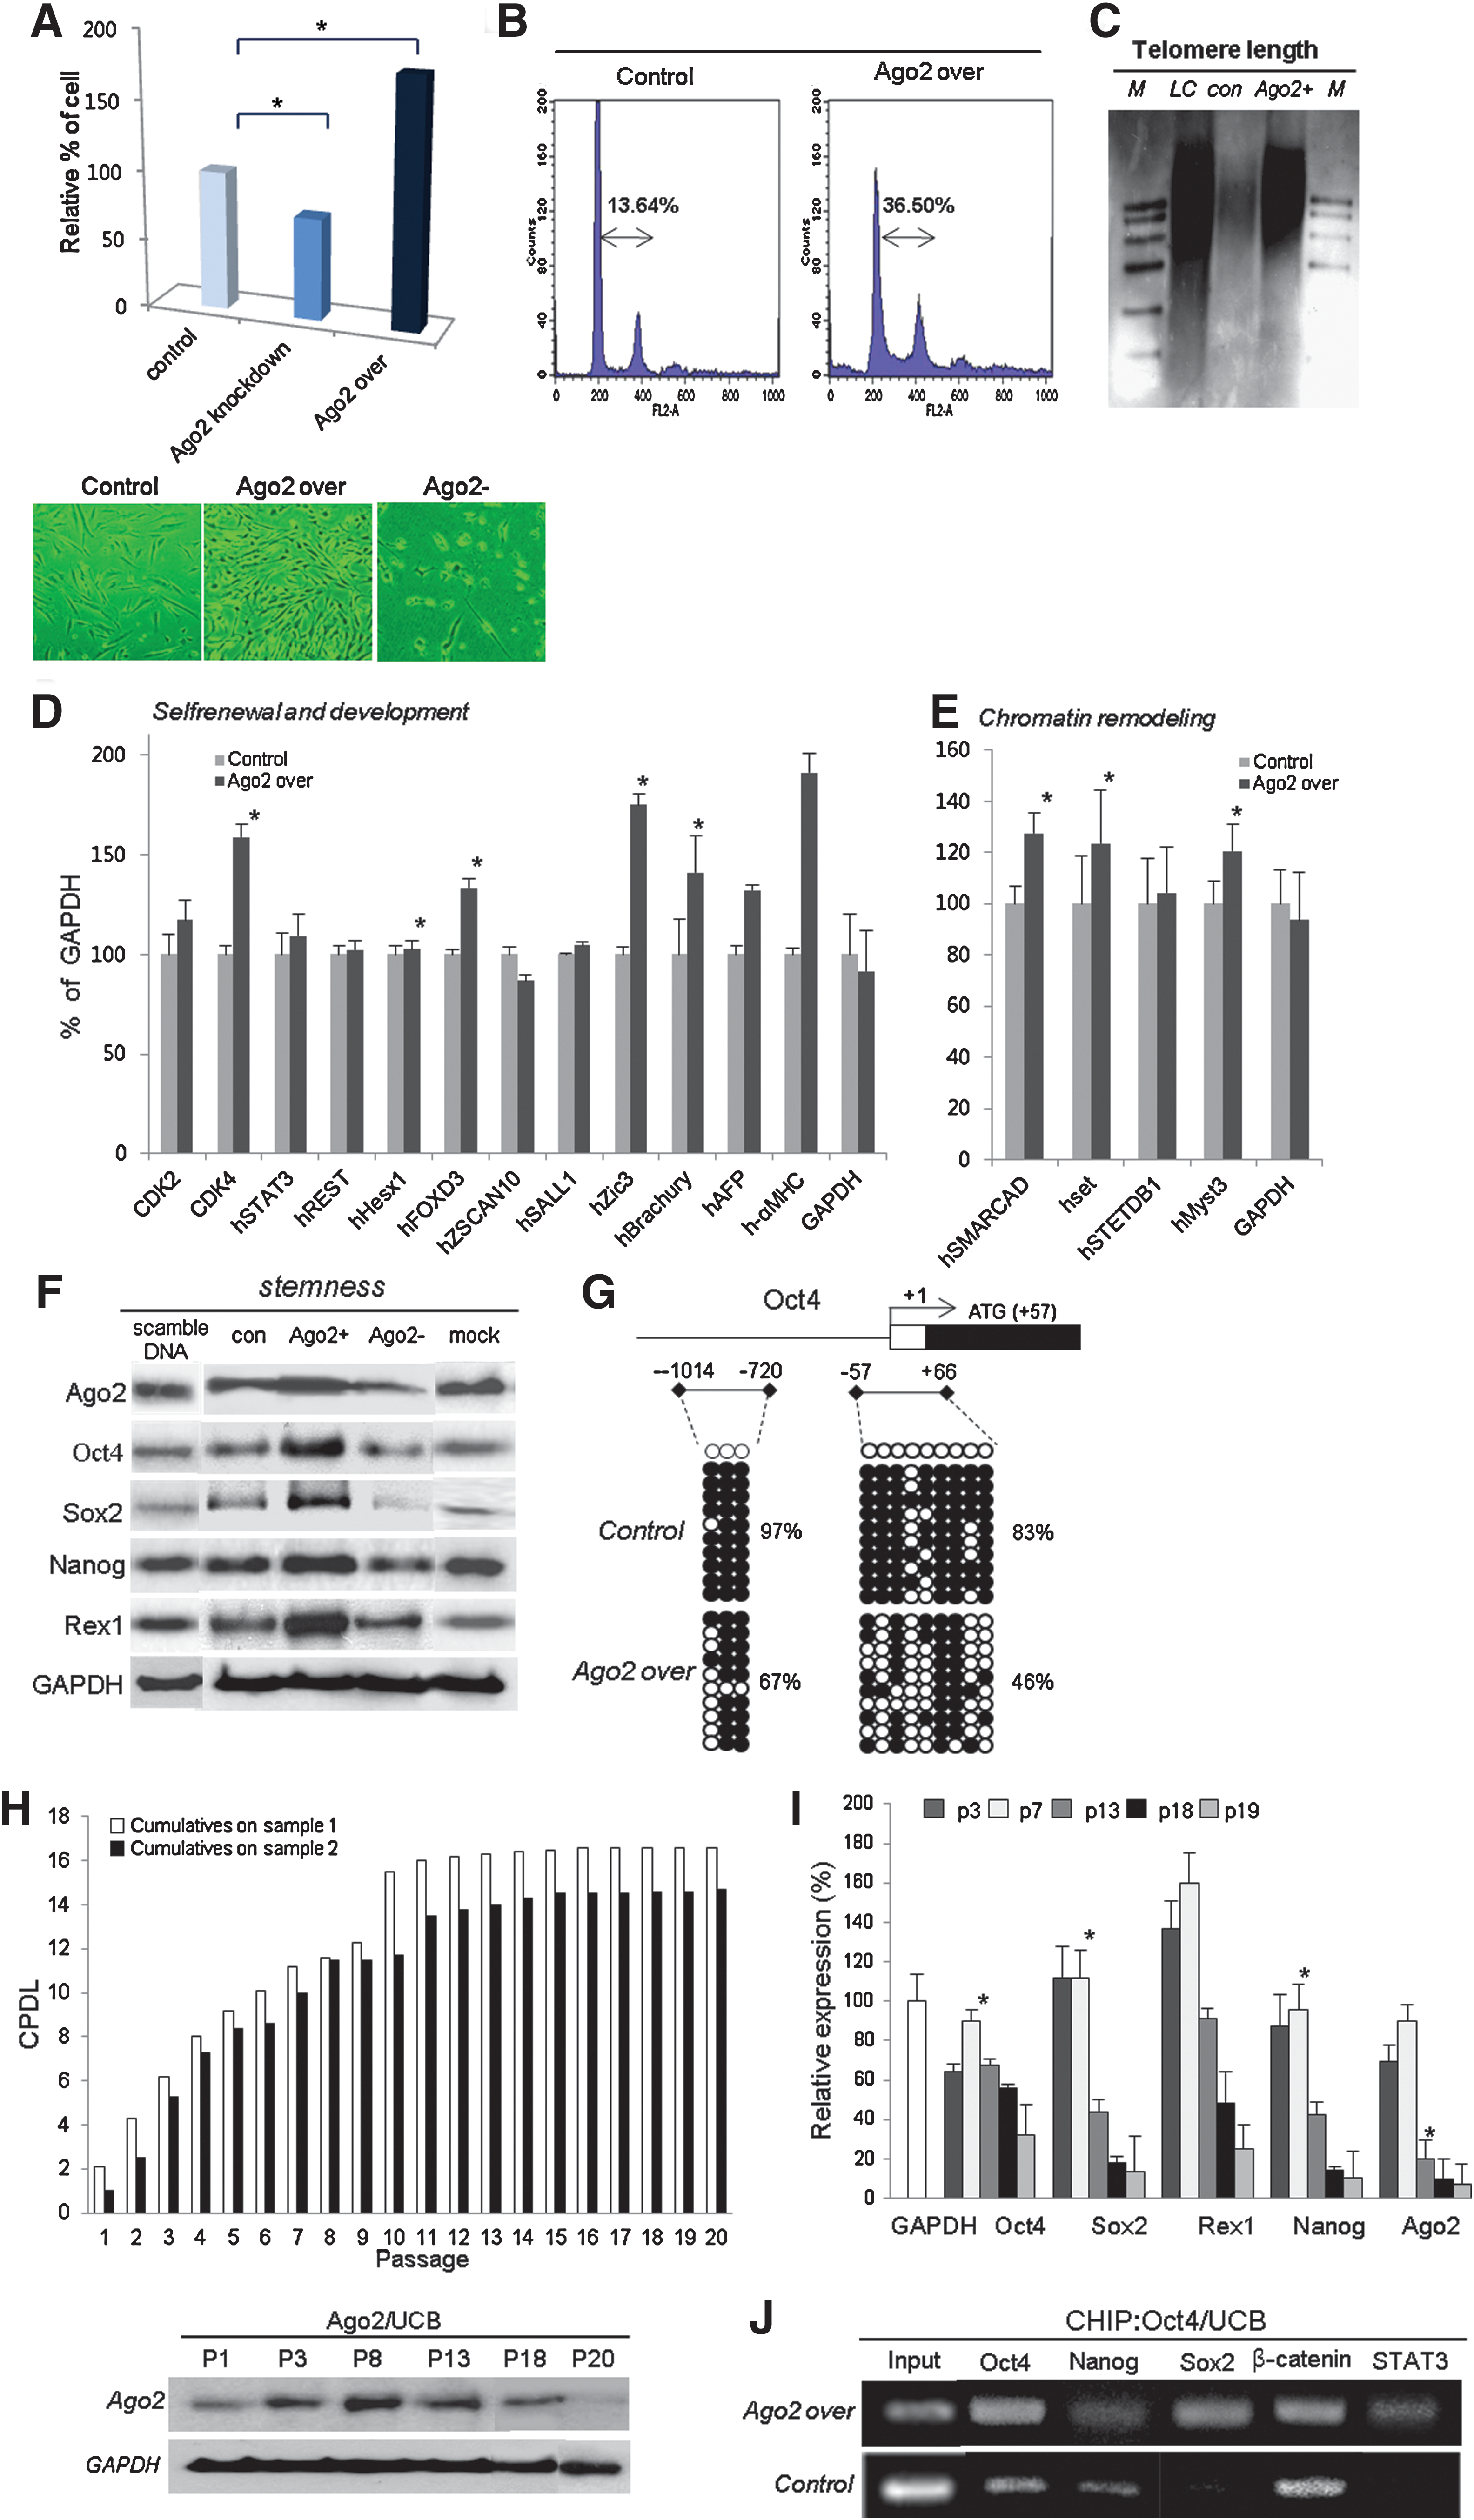
To characterize Ago2-dependent cell proliferation, Ago2 knockdown and overexpression experiments were performed using hUCB-MSCs. To investigate the stem cell potential of hUCB-MSCs as a function of Ago2 expression levels, the proliferative capacity of cells was evaluated after Ago2 knockdown or overexpression, and cell viability was assessed using trypan blue exclusion. Normal hUCB-MSCs grew faster than Ago2 knockdown cells but more slowly than cells overexpressing Ago2. The growth of hUCB-MSCs was increased by 30%–70% when Ago2 was overexpressed and decreased by 20%–30% after Ago2 knockdown (Fig. 2A). Ago2-overexpressing cells also exhibited a less round morphology and a higher cell density compared to control cells (Fig. 2A). For detailed analysis of cell cycle progression, FACS analysis of hUCB-MSCs was performed. The method is based on the binding of propidium iodide (PI), a membrane-impermeable dye, to nucleic acids in hUCB-MSCs whose plasma membranes have become permeable due to induced cell damage. This leads to a G1-arrested cell population with a higher DNA content than cells in the G1 phase of the cell cycle. The proportion of cells in the G0/G1 phase significantly increased in Ago2-overexpressing cells compared with control hUCB-MSCs (Fig. 2B). Additionally, measurement of telomere length and total DNA content by Southern blot analysis indicated that Ago2 overexpression (Ago2+) significantly induces telomere length elongation and more condensed chromosomal DNA content compared to control hUCB-MSCs (con) (Fig. 2C). The intensity of the telomere band was greater in Ago2-overexpressing cells than in untreated cells. To further study stem cell potentiality, the expression of stemness- and proliferation pathway-related proteins was evaluated by RT-PCR and Western blot. RT-PCR showed that the expression of chromatin remodeling-related genes (SMARCAD, Set, STEDB1, and Myst) and self-renewal- and development-related genes in Ago2-induced cells was higher than in untreated cells (Figs. 2D and 2E). In line with the RT-PCR results, the expression patterns of several stemness genes, including the human embryonic and adult stem cell pluripotency markers Rex1, Nanog, Sox2, and Oct4, had an expression pattern similar to that of Ago2 (Fig. 2F). Consistent with induced epigenetic reprogramming in cultured hUCB-MSCs, the regulatory region of the Oct4 gene showed high demethylation after Ago2 overexpression (Fig. 2G). Figure 2H represents the cumulative population doubling level (CPDL) during culture of two different hUCB-MSC lines. Cell growth activity gradually increased up to passage 11–12 (p11–12) but was relatively attenuated after p12. Moreover, different proliferative activity in various passages of hUCB-MSCs might be significantly correlated with alterations in the expression levels of Oct4, Sox2, Rex1, Nanog, and Ago2 with increasing passage number or age, as indicated by RT-PCR and Western blot analyses of Ago2 expression in various passages of cultured hUCB-MSCs. Ago2 expression from p3 to p8 was significantly increased depending on the passage, but late-passage (p13) cells showed gradually decreasing Ago2 expression (Figs. 2H and 2I). At passage p13, cells also showed maximal expression of stemness gene expression; beyond p13, stemness and Ago2 expression levels were significantly downregulated (Figs. 2H and 2I). Moreover, we performed Oct4 ChIP analysis on cultured hUCB-MSCs and confirmed that Oct4 directly regulates Nanog, Sox2, β-catenin, and STAT3 expression via binding to their regulatory regions (Fig. 2J).
Involvement of JAK2/STAT3 and Wnt/β-catenin during Ago2-mediated cell self-renewal
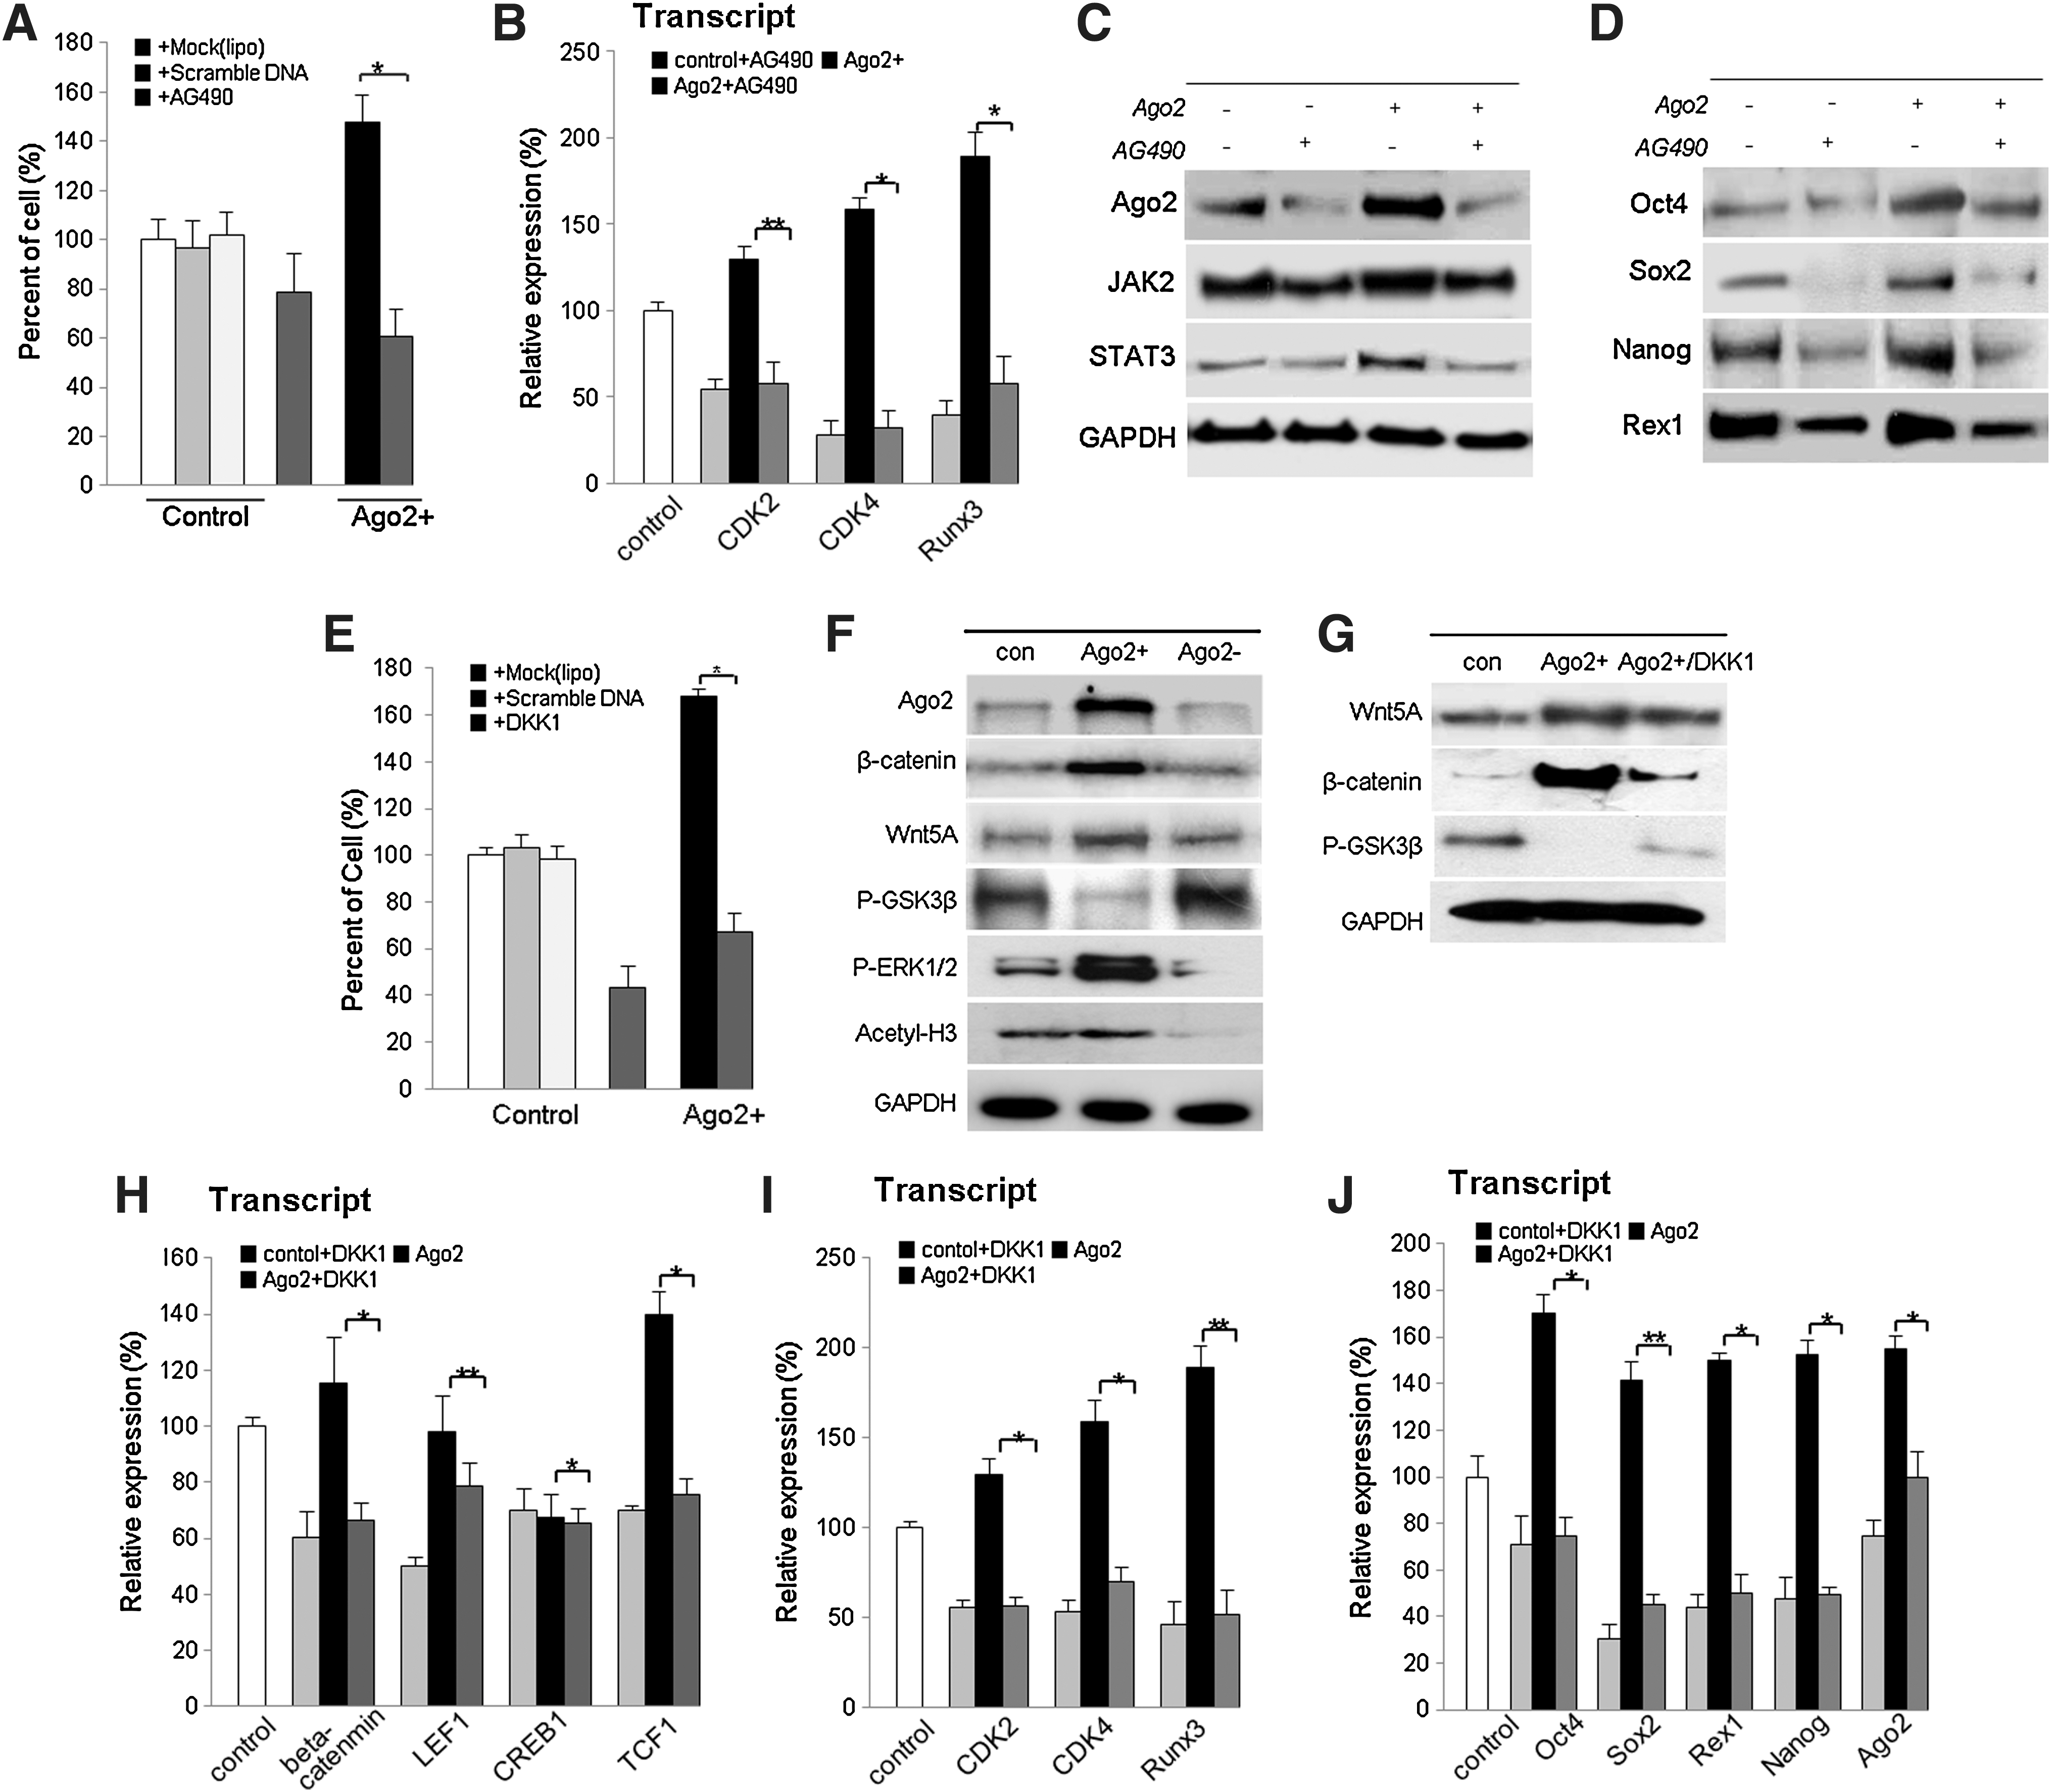
Because JAK2/STAT3 comprise a family of transcription factors that are important in embryonic development, organ genesis, and innate and adaptive immune function, as well as in regulation of cell growth, differentiation, and apoptosis (34), it is possible that Ago2 regulates cell growth through the JAK2/STAT3 pathway. To define the mechanisms responsible for increased production of JAK2 and STAT3 in response to Ago2, we investigated molecular signaling by western blot and cell counting 12 h after treatment of Ago2-overexpressing hUCB-MSCs with AG490, a specific JAK2 inhibitor. After AG490 treatment, levels of JAK2 and STAT3 expression and activation were reduced, and cell growth was considerably downregulated (Figs. 3A and 3B). We also observed that addition of Ago2 activated JAK/STAT3 and maintained activation (Fig. 3C). Similarly, JAK2/STAT3 inhibition negatively affected the expression of Ago2 and stemness- and cell cycle-related genes (Figs. 3B–3D). As shown in Figure 3D, AG490 treatment significantly reduced levels of Ago2 protein and of stemness genes. Thus, we can conclude that Ago2 enhanced cell proliferation by JAK2/STAT3-meditated induction of the stemness genes Oct4, Sox2, Nanog, and Rex1, and by direct binding to regulatory regions of stemness genes to regulate their expression. Furthermore, we found that JAK2/STAT3 positively regulated Ago2 expression (Fig. 3C). Additionally, we evaluated the role of β-catenin/Wnt during Ago2-mediated hUCB-MSC self-renewal. Our study showed that β-catenin/Wnt is associated with stem cell self-renewal (Fig. 3E). GSK3β was partially inactivated after Ago2 overexpression and activation of Wnt5A, and β-catenin was increased (Figs. 3F and 3G). Moreover, Ago2 enhanced, and Ago2 knockdown downregulated, pMEK and acetyl-histone3 expression in cultured hUCB-MSCs (Fig. 3F). Accordingly, Ago2 overexpression in hUCB-MSCs resulted in the induction of stem cell-associated transcription factors and cell self-renewal-related factors. A marked increase in the expression of Oct4, Sox2, Rex1, and Nanog, and of CDK2, CDK4, and RUNX3 was observed at the transcript level (Figs. 3H–3J).
Interference of Ago2 expression induces p38/JNK-mediated apoptotic cell death
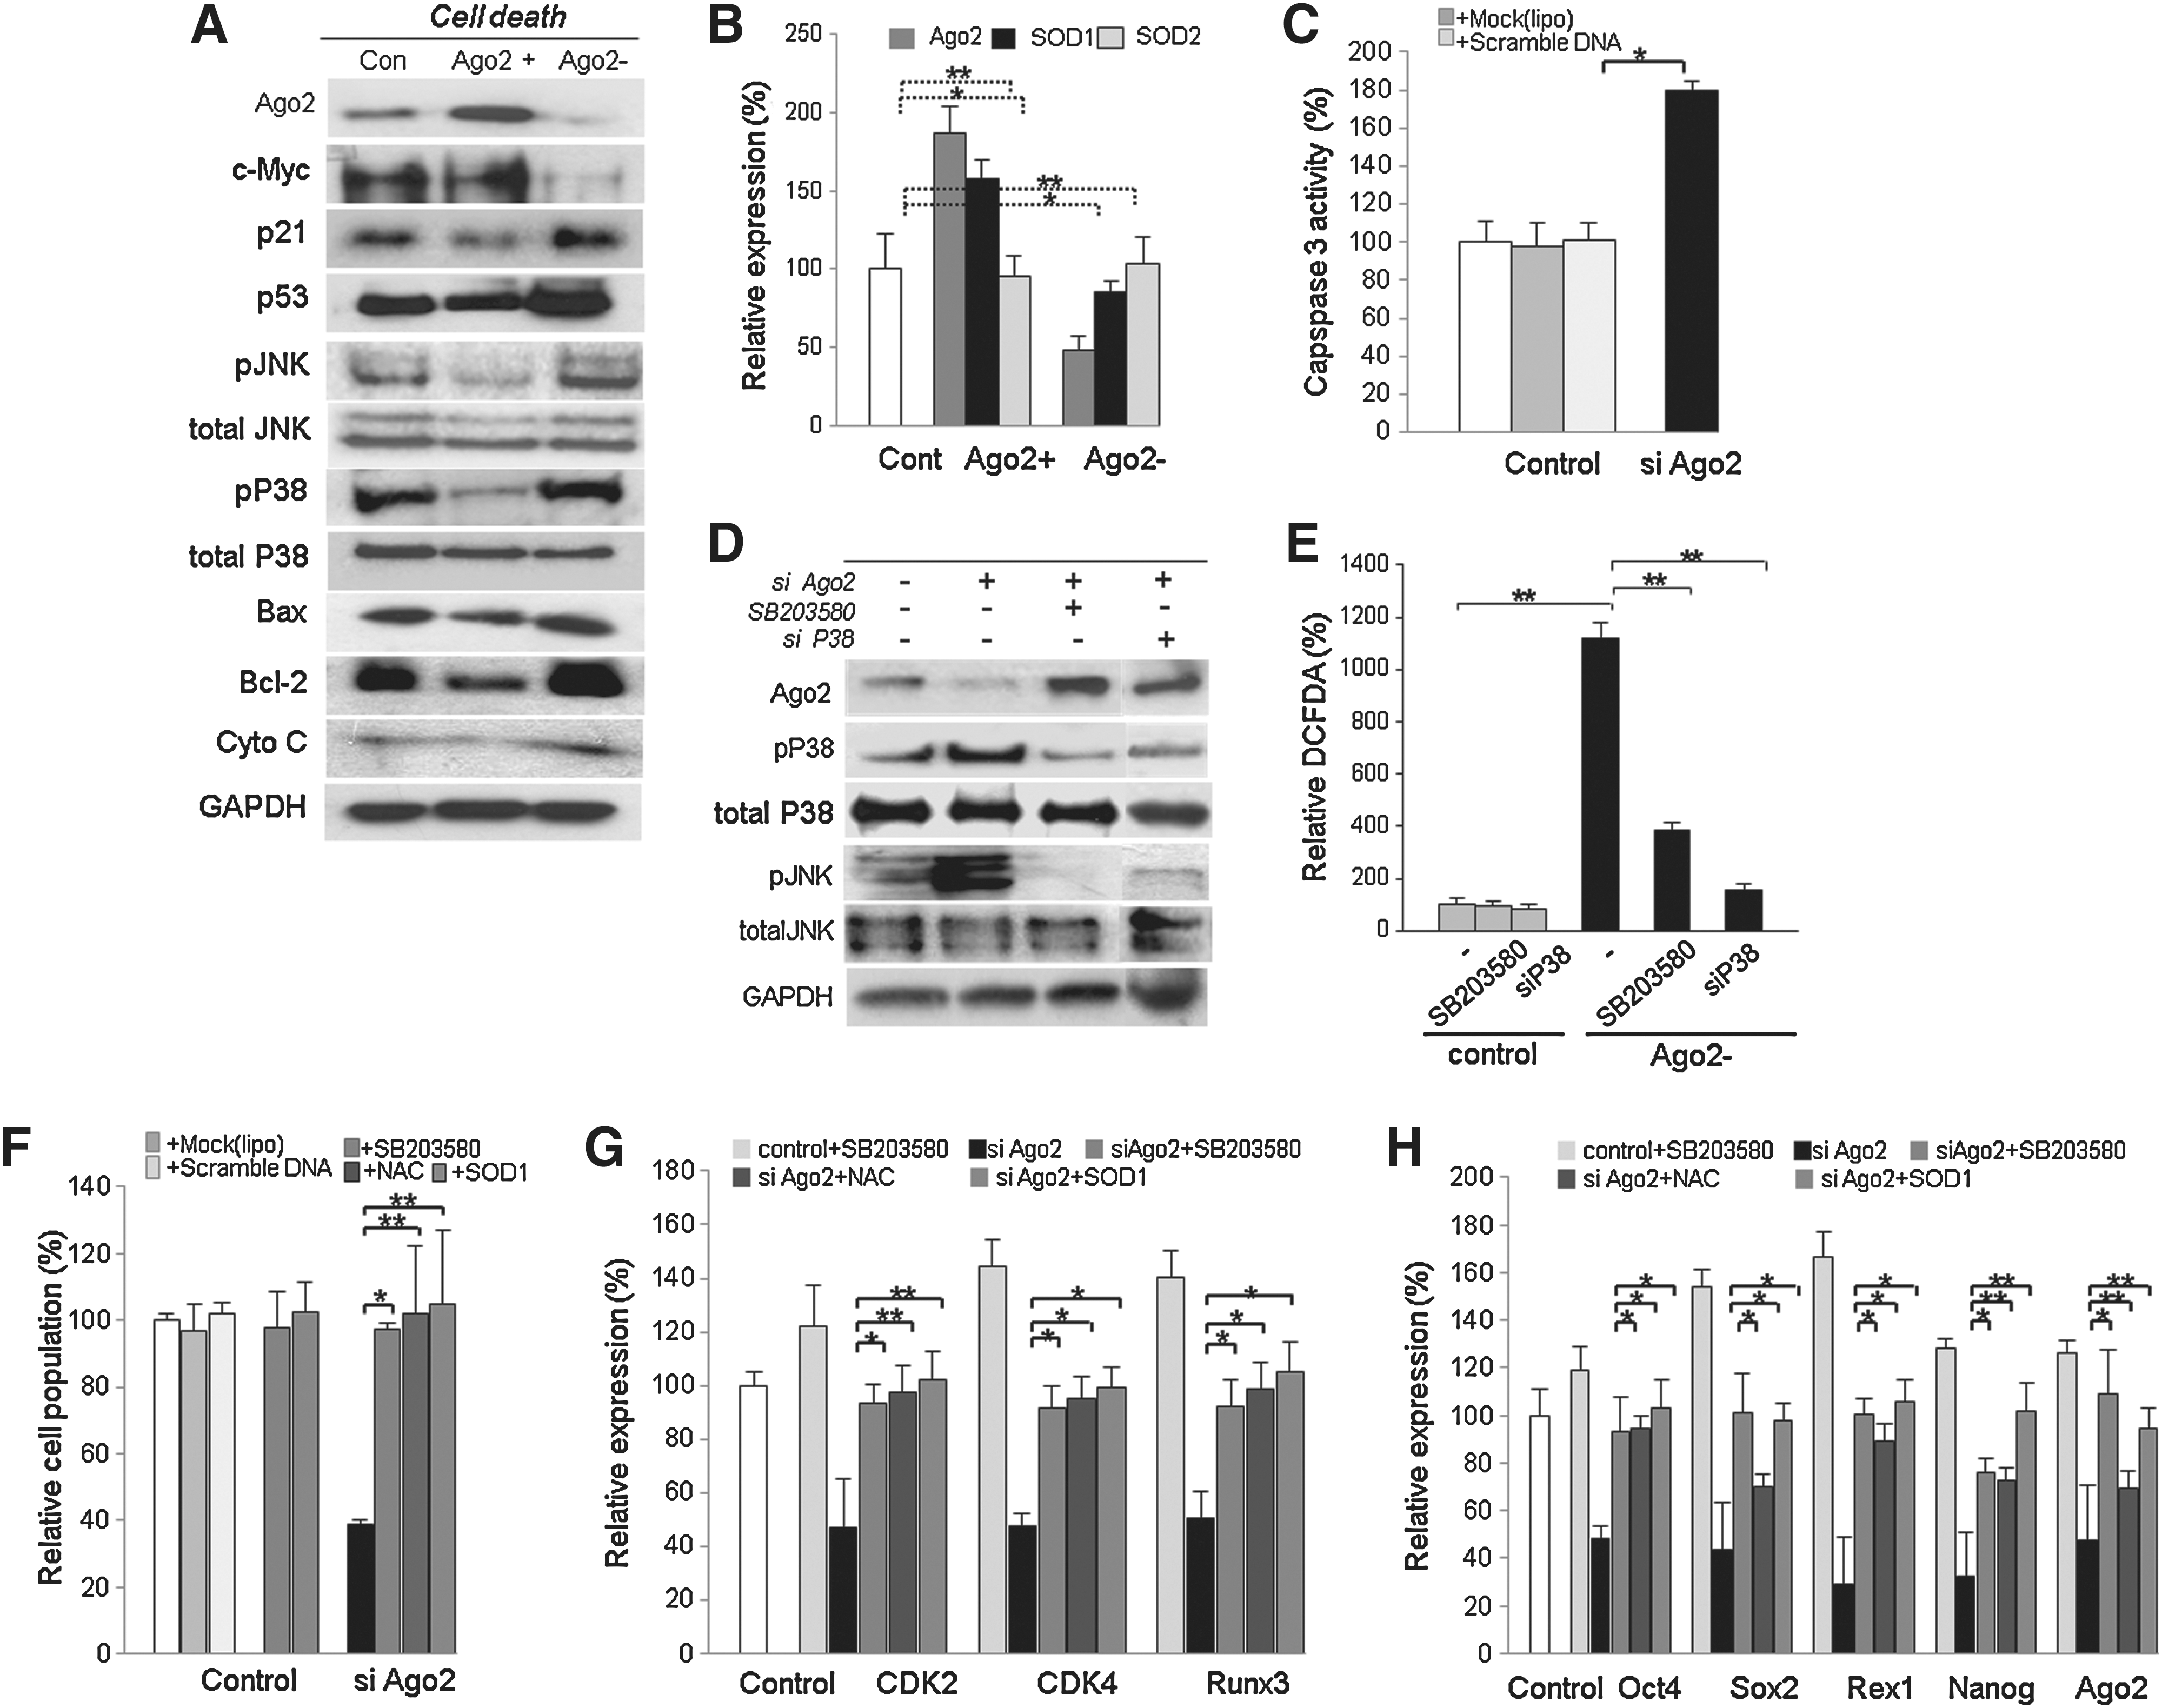
We previously confirmed that Ago2 knockdown significantly decreased cell viability compared to Ago2-overexpressing or control hUCB-MSCs. To investigate whether Ago2 knockdown activates apoptotic signal mediators and inactivates cell survival factors, representative proteins were detected by Western blot. First, we studied the expression of cell cycle-related factors including c-myc, p53, and p21. In addition, we detected the apoptotic mediators JNK, p38, caspase-3, Bax, Bcl-2, and cytochrome C. Compared with untreated cells, Ago2-overexpressing cells showed downregulation of the tumor suppressor proteins p21 and p53 and decreased levels of JNK, P38, Bax, Bcl-2, caspase-3, and cytochrome C (Fig. 4A). Likewise, Ago2 knockdown cells upregulated tumor suppressor and pro-apoptosis proteins relative to control cells (Fig. 4A). On the other hand, to determine SOD (superoxide dismutase) expression before and after Ago2 knockdown or overexpression, we measured Ago2, SOD1, and SOD2 transcripts expressions. SOD1 expression was significantly increased (160%) after Ago2 overexpression and also interfered expression of Ago2 effectively downregulated SOD1 expression (80%) (Fig. 1B). Caspase-3 activity was also higher (180%) in Ago2 knockdown cells than in control cells (Fig. 4C). To address the mechanism by which Ago2 siRNA inhibits the growth of hUCB-MSCs, we employed an inhibitor of P38, SB203580, and si P38. At result, interference of P38 expression significantly abolished the expression of p38 and JNK along with downregulated DCFDA+ ROS producing cell in Ago2 knockdown hUCB-MSCs (Figs. 4D and 4E). The proliferation rate of SB203580 (or si P38), N-acetyl cysteine (NAC), or SOD1/siAgo2-treated cells was significantly increased along with downregulated ROS production, compared to SB203580 untreated Ago2 knockdown hUCB-MSCs (Fig. 4E). Also, SB203580, NAC, or SOD1/pCMV66-XL5 treatment in Ago2 knockdown cells showed increased CDK2, CDK4, and RUNX3 expression levels compared to Ago2 knockdown control hUCB-MSCs, along with compensated cell survival (Figs. 4F and 4G). Moreover, the expression of Oct4, Sox2, and Ago2 was promoted by SB203580, NAC, or SOD1 relative to siAgo2-treated cells (Fig. 4H). When we exposed Ago2 knockdown hATSCs to N-acetylcysteine (NAC) or SOD1/pCMV66-XL5, the expression levels of stemness genes and Ago2 were significantly recovered and self-renewal activity was also recovered into normal (Figs. 4F–4H). Addition of SB203580, NAC, or SOD1 to hUCB-MSCs decreased the induction of apoptotic cell death by siAgo2 (data not showed), consistent with JNK and p38 phosphorylation inducing apoptotic cell death signaling pathways during Ago2 knockdown. These results support the idea that direct siRNA inhibition of Ago2 induces cell death and results in a dramatic increase in apoptosis following DNA fragmentation by caspase-3 activation. We confirmed that Ago2 knockdown significantly inhibits cell growth and survival and finally induces cell apoptosis (Fig. 4).
Ago2 knockdown attenuates proliferation of hUCB-MSCs via interference with stemness gene expression
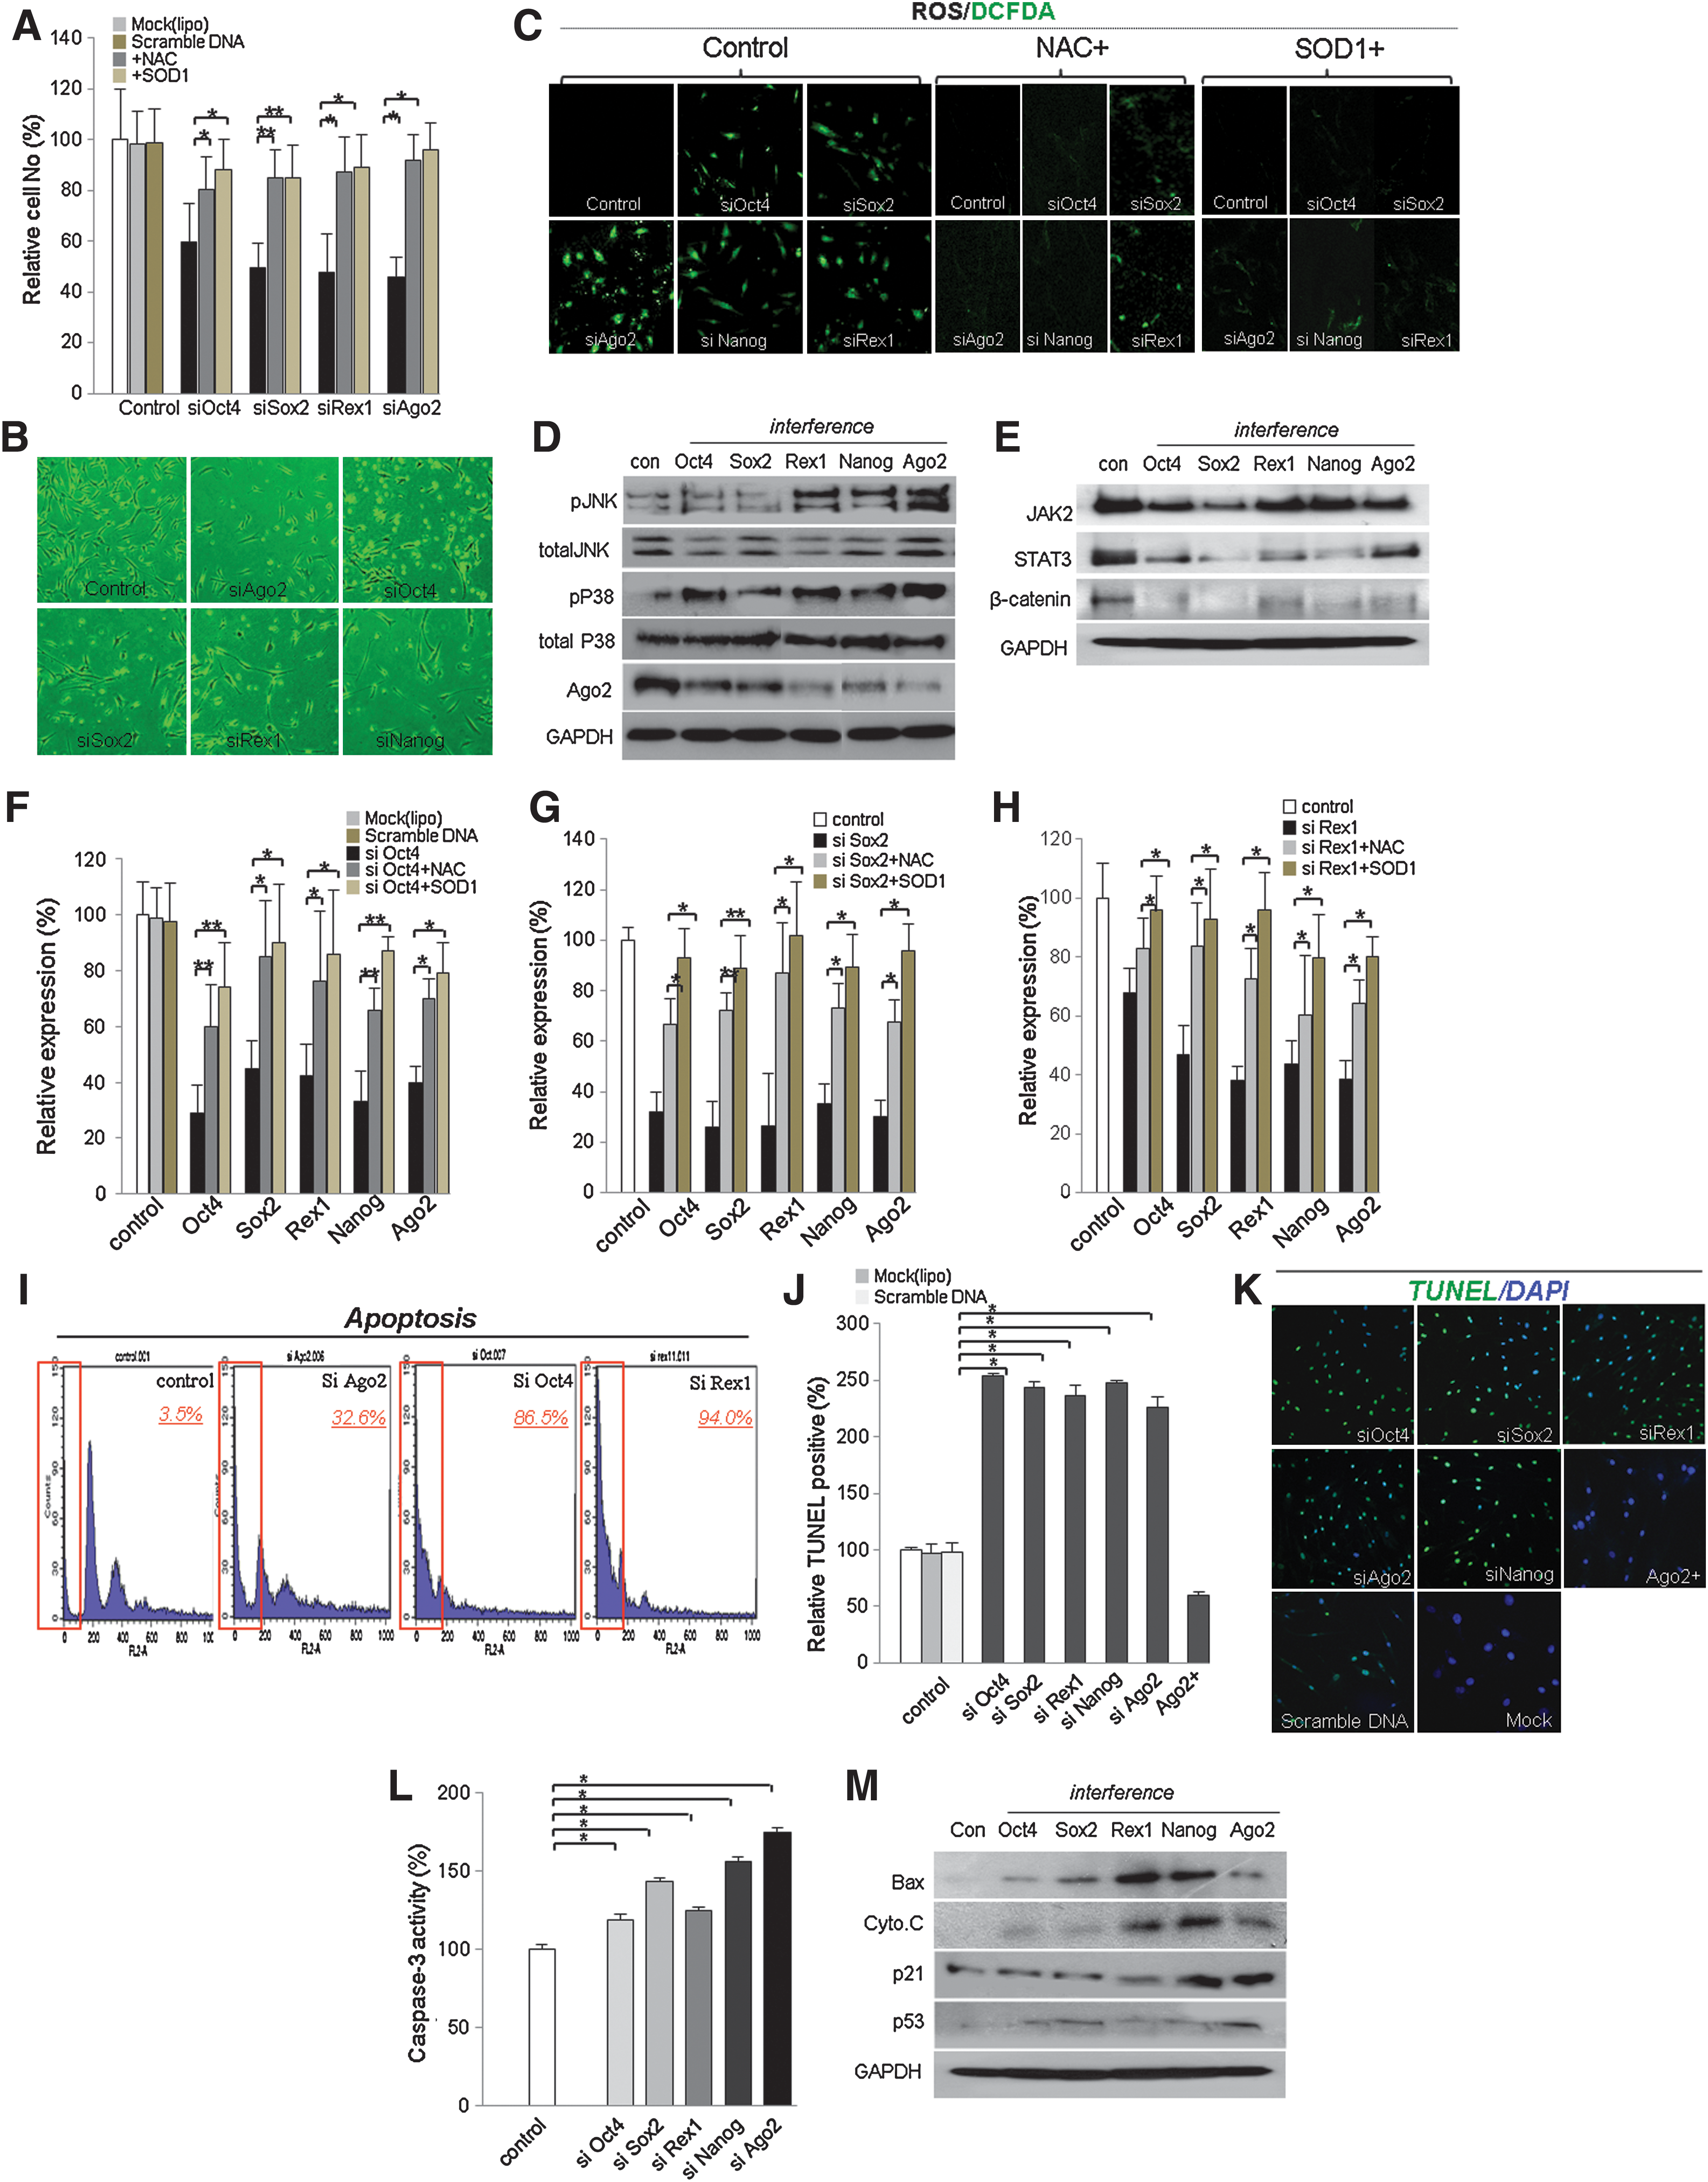
We confirmed that the Ago2 expression level affects the fate of hUCB-MSCs and that Ago2 binds to specific regions of the Oct4, Sox2, and Nanog promoters. Next, we assessed whether Ago2 and stemness genes are correlated with cell self-renewal and survival. To gain a more detailed understanding of the functional relationship between Ago2 and stemness genes, we used siRNA to knock down Oct4, Sox2, Rex1, Nanog, and Ago2 expression in cultured hUCB-MSCs and evaluated cell self-renewal ability and signal factor activation. When we used siRNAs targeting stemness genes, the proportion of 5-bromo-2-deoxyuridine (BrdU)-positive cells was decreased (data not shown). Ago2 and stemness gene knockdown resulted in attenuated self-renewal, unstable attachment of the cells to the culture substrate, globular morphology, and eventual death (Figs. 5A and 5B). Viable cell counts of stemness gene knockdown cells were very similar to those of Ago2 knockdown cells. Oct4, Sox2, Rex1, and Nanog knockdown in hUCB-MSCs resulted in survival rates of 70%, 32%, 30%, and 66%, respectively, compared to control cells (Fig. 5A). Oct4, Sox2, Rex1, and Nanog knockdown-induced self-renewal attenuation was rescued by NAC or SOD1 in hUCB-MSCs (Fig. 5A). Reactive oxygen species (ROS) were also estimated using the fluorescent probe DCFDA. Compared with 3.5% control ROS intensity, Ago2, Oct4, and Rex1 knockdown cells had intensities up to 94% (Fig. 5C). Ago2, Oct4, Sox2, Nanog, and Rex1 knockdown-induced ROS production was effectively eliminated by NAC or SOD1 pretreatment (Fig. 5C). Finally, we could conclude that Ago2 directly controlled stemness genes, thereby affecting cell fates such as survival or apoptosis. Consistent with this notion, p38/JNK activation was prominently increased after Ago2 and stemness gene knockdown in hUCB-MSCs (Fig. 5D). The expression of molecular markers both in control cells and in each stemness gene-specific knockdown population was analyzed by Western blot. After 24 h of siRNA treatment, hUCB-MSCs displayed prominently different expression of cell growth and cell death mediators (Fig. 5D). Additionally, stemness gene knockdown attenuated JAK2/STAT3 and β-catenin (Fig. 5E). When we induced knockdown of Oct4, Sox2, and Rex1 expression, all tested expression levels of Ago2 and stemness genes were significantly downregulated; NAC or SOD1 treatment significantly rescued Oct4, Sox2, and Rex1 expression (Figs. 5F–5H). Quantitative analysis of hUCB-MSC cell death was performed by flow cytometry of PI-stained hUCB-MSCs before and after Ago2, Oct4, and Rex1 knockdown. The number of PI-positive apoptotic cells was significantly increased from 32% to 94% after each gene knockdown, and TUNEL-positive cell populations were similarly increased (Figs. 5I–5K). TUNEL assay results showed increased DNA damage in knockdown cells (nearly 90%) compared to untreated controls (35%), while addition of Ago2 to hUCB-MSCs cells resulted in very few apoptotic cells (∼20%) (Figs. 5J and 5K). To understand the molecular mechanism by which RNAi knockdown of stemness genes and Ago2 induces apoptosis in hUCB-MSCs, we measured cellular caspase-3 activity (Fig. 5L). Caspase-3 activity was effectively increased by up to 170% by knockdown of stemness genes (Fig. 5L). Western blot analysis showed that knockdown activated the expression of the apoptosis signaling mediators cytochrome C, Bax, p21 and p53 (Fig. 5M).
Ago2-mediated stemness expression enhances the differentiation ability of hUCB-MSCs
The ability to differentiate into a variety of cell types is an important characteristic of hUCB-MSCs. We evaluated hUCB-MSC potency for multilineage differentiation. Stemness gene and Ago2 knockdown cells showed more differentiation into osteogenic, condrogenic, and adipogenic lineages than did control and Ago2-overexpressing cells when cultured in appropriate differentiation media (Fig. 6A). Chondrogenic differentiation was determined by toluidine blue O staining, and osteogenic differentiation was determined by von Kossa staining. Osteogenic differentiation was associated with mineralized nodules. Examination of osteogenic differentiation using toluidine blue O staining revealed more prevalent differentiation in the stemness gene- and Ago2-knockdown cells than in Ago2-overexpressing or control cells (Fig. 6A). To quantify the intensity of Oil Red O staining, stained cells were eluted with 100% isopropanol, and the quantity of Oil Red O in the eluate was measured. Ago2- and stemness gene-knockdown cells retained about 5% more stain than untreated cells, and Ago2-overexpressing cells retained even less stain (Fig. 6A and data not shown). When Von Kossa staining was quantified, stain retention was about 40% greater in siRNA-treated cells than in untreated cells (data not shown). During fat, cartilage, and bone differentiation, Ago2-overexpressing cells showed significantly attenuated mesodermal differentiation behavior and downregulated expression of such genes as RUNX3, PPAR-γ, collagen IV, and RXR (Figs. 6B and 6C). RT-PCR analysis indicated that stemness gene and Ago2 knockdown in hUCB-MSCs enhanced the expression of Collagen IV, AP, PPARγ, and the osteogenic factors osteonectin and osteopontin (Figs. 6D–6F). These findings indicated that Ago2 knockdown promoted differentiation under mesoderm-inducing conditions by controlling stemness genes. Adipogenic differentiation of cells was apparent by cellular accumulation of lipid-rich vacuoles that stained with Oil Red O. Lipid droplets were generated after 1 week in adipogenic differentiation medium and subsequently increased during adipogenic differentiation. Examination of samples after 2 weeks revealed more lipid droplets in the absence of Oct4, Sox2, Nanog, Rex1, and Ago2 than in control or normal cells (data not shown).
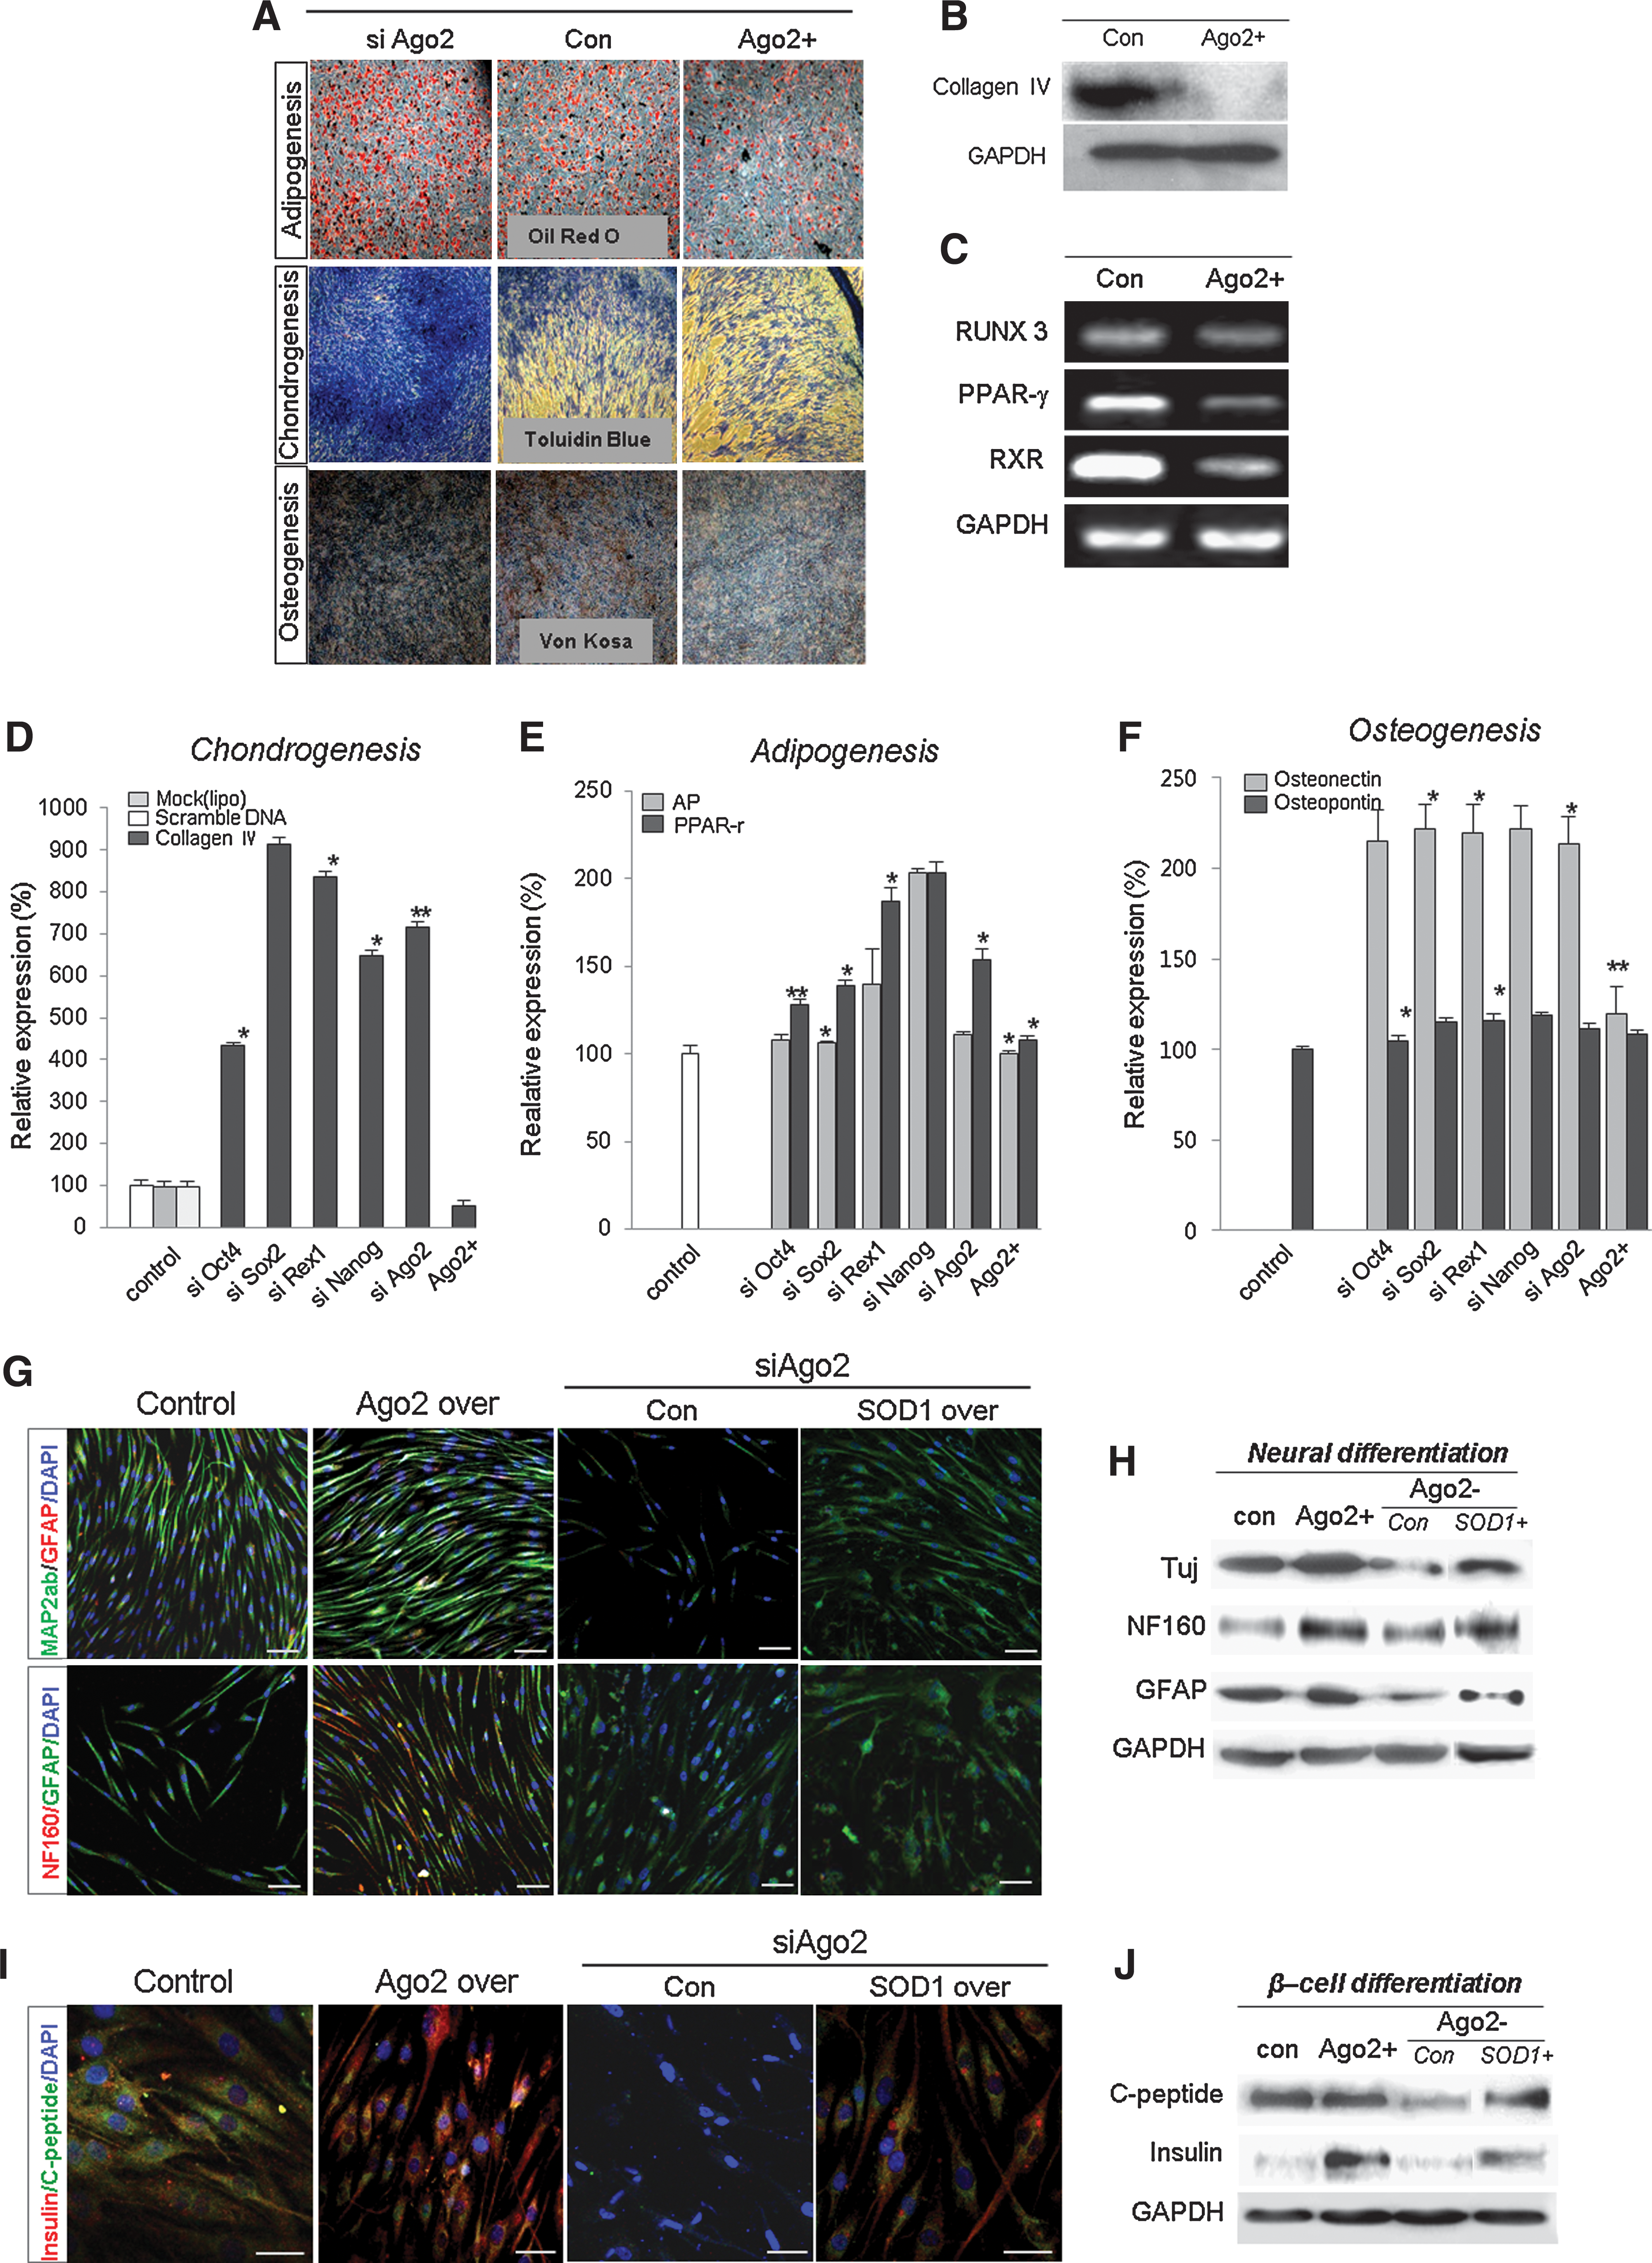
To determine the differentiation capacity of cells knocked down for or overexpressing Ago2, we induced differentiation into ectodermal (neural) and endodermal (β-cell) cells. We evaluated the efficiency of neurogenic and β-cell differentiation of these cells by immunocytochemistry and Western blot analysis before and after Ago2 overexpression and interference of Ago2 expression. The resulting expression of the mature β-cell differentiation markers C-peptide and insulin were significantly increased after Ago2 overexpression in hUCB-MSCs. In contrast, Ago2 downregulation resulted in reduced neural and β-cell differentiation efficiency and decreased expression of lineage-specific genes such as TuJ, NF160, GFAP, C-peptide, and insulin (Figs. 6G–6J). Moreover, siAgo2 –induced decreased transdifferentiation potency was significantly rescued by exogenic SOD1 expression along with increased tissue specific gene expression (Figs. 6G–6J).
Discussion
Ago proteins have specific post-transcriptional functions during miRNA biogenesis that enhance the production and/or stability of mature miRNAs. They usually negatively regulate the expression of specific miRNAs that target and interfere with the expression of specific development- and cell self-renewal-related genes (Supplementary Fig. S1; Supplementary Data are available online at
Nuclear Ago2 directly regulates Oct4, a critical regulator of stem cell pluripotency that is highly expressed in the early mammalian embryo and in the inner cell mass of the blastocyst (20). In embryonic stem (ES) cell cultures, though the mechanisms of Oct4-sensitive cell fate regulation have been widely investigated, the involvement of Ago2 in Oct4 expression regulation in stem cells has not been clarified. Recent studies have associated Oct4 with the undifferentiated pluripotent state of stem cell populations derived from various adult tissues (10). In this study, RNA interference of Ago2 completely blocked cell survival and differentiation ability, via pP38/pJNK mediated apoptotic signals, and significantly diminished the ability to differentiate into neural cells and β-cells by inhibiting Oct4, Sox2, Rex1, and Nanog expression. Direct inhibition of stemness genes effectively blocked cell survival, self-renewal, and transdifferentiation potency in a process involving signal mediator inactivation and also ROS production (Figs. 4, 5, and 6). Thus, nuclear Ago2 is crucial for maintaining stem cell functional properties. Human UCB-MSCs lose the capacity to maintain multipotency upon knockdown of stemness genes or nuclear Ago2 by RNA interference. It has been demonstrated by ChIP studies of hUCB-MSCs that Oct4 binds a regulatory region of β-catenin, and it is likely that nuclear Ago2 induces hUCB-MSC self-renewal and differentiation through Oct4 control of JAK2/STAT3 and Wnt5A/β-catenin signal activation by direct binding to regulatory regions of these genes. We confirmed this idea using RNA interference targeting Ago2 and stemness genes, including Oct4. Ago2 knockdown resulted in markedly diminished stemness expression, STAT3 and Wnt5A/β-catenin phosphorylation, and cell survival and self-renewal activity (Fig. 3). Similarly, knockdown of each stemness gene also abolished cell survival, self-renewal, and differentiation potency, though mesodermal differentiation was slightly increased. Thus, Oct4 regulation of nuclear Ago2, Ago2 regulation of Oct4, and STAT3 and β-catenin expression were crucial for survival and maintenance of stem cell potency in hUCB-MSCs. Nuclear Ago2 or stemness expression in hUCB-MSCs led to increased stem cell identity and decreased differentiation into a mesodermal lineage but also led to increased neural differentiation and β-cell differentiation at the morphological and molecular levels. Nuclear Ago2/Oct4 activates the expression of genes functionally important for differentiation into neural cells or β-cells after escape from the mesodermal character of hUCB-MSCs. We previously studied the effect of Oct4 expression in hATSCs on mesodermal lineage differentiation into fat, bone, and chondrocytes. Oct4-knockdown hATSCs were shown to accumulate significant quantities of calcium and lipid droplets, and differences were apparent in nodule and lipid droplet formation efficiency between naive and Oct4-knockdown cells; moreover, Oct4-knockdown cells showed overexpression of adipogenesis- and osteogenesis-related transcription factors and improved chondrogenic activity. In contrast, when we induced mesodermal differentiation in hATSCs overexpressing Oct4, Sox2, and Nanog, the differentiation efficiency of each stemness gene-overexpressing cell population was prominently decreased, and lineage-specific gene expression declined. During neural induction in differentiated Oct4/hATSCs, we observed extreme upregulation of TuJ and MAP2ab and lower levels of nestin expression than in control hATSCs. In contrast to the neural differentiation potency of Oct4/hATSCs, mesodermal differentiation potency was significantly downregulated compared to control hATSCs (25, 31, 32). RNAi-mediated knockdown of Ago2 or Oct4 was used to extend the analysis of Ago2-mediated stemness function in hUCB-MSCs. Ago2 or Oct4 knockdown in hUCB-MSCs led to decreased stem cell identity and increased differentiation into a mesodermal lineage but also led to decreased neural and pancreatic cell differentiation ability at the morphological and molecular levels (Fig. 6). Additionally, Ago2/Oct4 knockdown dramatically increased apoptotic cell death of cultured hUCB-MSCs and induced the activation of apoptotic genes such as caspase-3, Bax, and cytochrome C. When Ago2 or Oct4 expression was restored by exogenous overexpression in damaged hUCB-MSCs, the cells recovered, activating survival-associated signal molecules such as AKT/PI3K, Bcl2, and ERK1/2 (data not shown). Additionally, to determine the direct effect of ROS on cell differentiation, we induced neural and mesodermal differentiation before and after NAC treatment in Ago2-knockdown cells. Treatment with NAC had no effect on mesodermal and neural differentiation efficiency. Therefore, we conclude that induction of ROS in Ago2-knockdown cells does not directly affect cell differentiation along with suboptimal level of rescued stemness and Ago2 expression (data not shown). This result also demonstrates that Ago2/Oct4 is essential for self-renewal and survival of hUCB-MSCs and establishes a conserved role in mammalian pluripotency maintenance; such therapeutic stem cells have potential for use in improved cell-based disease therapies (Fig. 7).

Materials and Methods
Isolation and culture of hUCB-MSCs
Human UCB-MSCs isolation and expansion from UCB was conducted as previously reported (15). Separated hUCB-MSCs were subcultured at a density of 5 Í 105 cells/cm2 in DMEM (Invitrogen, Carlsbad, CA) and used for experiments during passages 5–8. All media were supplemented with 2 mmol/L L-glutamine, 100 units/mL penicillin, 100 μg/mL streptomycin, and 10% fetal bovine serum (FBS) (Invitrogen). Cells were incubated at 37°C in a humidified atmosphere containing 5% CO2.
Cell viability assay
Cell viability was assessed by visual cell counts in conjunction with a trypan blue exclusion assay. Mitochondrial activity was assessed by measuring the ability of the cortical cultures to reduce 3,4,5-dimethyl thiazol-2-yl-2,5-diphenyl tetrazolium bromide (MTT; Sigma, St. Louis, MO) to a colored formazan precipitate using a plate reader. Triplicate wells were established under each experimental condition for all experiments, and each experiment was repeated at least three times. The raw data from each experiment were analyzed for variance using Fisher's test or Student's t-test. For flow cytometry, cells were cultured in 100-mm dishes at densities that ensured exponential growth at the time of harvesting. Harvesting and processing protocols were used to detect DNA using flow cytometry with propidium iodide staining. The cells were analyzed with a BD Biosciences FACScan system (San Jose, CA). The percentages of cells in the G0/G1, S, and G2/M phases of the cell cycle were determined using a DNA histogram-fitting program (MODFIT; Verity Software, Topsham, ME). A minimum of 104 events or samples were collected.
To identify the cumulative population doubling level (CPDL), hUCB)- MSCs, were cultured in DMEM (with 20% FBS). Two bars in the graph indicate a CPDL increase (Fig. 2H). Both bars show a consistently increasing growth rate over passage number. Each bar indicates the CPDL cumulative values from two separately sampled cells.
EMSA
Before or after Ago2 overexpression, hUCB-MSCs cells (approximately 2–4 X 10⁶) were collected by trypsin digestion, and the nuclear extracts were prepared using a kit (Pierce, Rockford, Il). A synthesized, biotin-labeled, and annealed DNA probe (5’TAGGTGGAGCTTCTCGGGGACTAAA-3’) at 20 fmols that contained the Ago2-binding site sequence was reacted with nuclear extracts for 20 min. The reactions were applied onto 5% polyacrylamide gels (Bio-Rad, Hercules, CA), and then transferred to nylon membranes. Biotin-labeled DNA was detected using a streptavidin-horseradish peroxidase conjugate and chemiluminescent substrate (Pierce). To examine the supershift of DNA–protein complexes, an antibody against Ago2 was added to the DNA–protein binding reactions and loaded into the gels. The detailed methods followed the protocol of the LightShift Chemiluminescent EMSA Kit (Pierce).
Luciferase assay
To determine the activity of Oct4, Sox2, and Nanog promoters before and after Ago2 overexpression in hUCB-MSCs, we performed a luciferase reporter gene assay. The firefly luciferase test reporter genes used in this study, pGL3-Oct4, pGL3-Sox2, and pGL3-Nanog the luciferase reporter plasmid driven 2.9-kb AR promoter. As an internal control, phRL-SV40 was obtained from Promega (Madison, WI). Cells were seeded in 6-well plates until 70% confluence and transfected with Ago2 using Lipofectamine™. Cells were transfected with a pair of reporter gene plasmids using Lipofectamine™ LTX and Plus™ Reagent, referring to the manufacturer's protocol (Invitrogen). After transfection of each plasmid, cells were incubated with DMEM containing 10% FBS. At 24–48 h post-transfection, medium was replaced with fresh phenol red-free RPMI plus 0.1% BSA with 10 nM DHT. Cells were harvested 24–48 h later for dual luciferase assays (Bright Glo, Promega) to determine the promoter activity of the test plasmid. Firefly luciferase expression from the test plasmid and Renilla luciferase expression from phRL-SV40 in a single sample were measured sequentially in a luminometer according to the Dual-Luciferase Reporter System protocol (Bright Glo, Promega).
Evaluation of neural differentiation potencies of hUCB-MSCs
To confirm the neurogenic potency of cultured cells, cells were subjected to differentiation conditions. Cultured neuronal cells formed spherical clumps of cells and free-floating neurospheres in the culture medium. The spheres of cells were transferred to a petri dish and cultured in Neurobasal medium (NB, Invitrogen, Gaithersburg, MD) supplemented with B27 (Invitrogen), 20 ng/ml bFGF, and 20 ng/ml BDNF (Sigma, St Louis, MO) for 3 days. The culture density of the spheroid bodies was maintained at 10–20 cells/cm2 to prevent self-aggregation. For neural differentiation, neurospheres derived from neuronal cells were layered on PDL-laminin double-coated cover slips. Spheres were cultured and maintained for 7 days in NB media containing 2% FBS and 10 μM retinoic acid. For identification of differentiated neuronal cells, we performed immunocytochemistry using primary antibodies to neural markers.
Small interfering RNA inhibition experiment
Ago2, stemness, and P38 gene-specific siRNA duplexes were synthesized by Dharmacon RNA Technologies (Lafayette, CO). For transient transfection in cultured hUCB-MSCs, cells at approximately 60% confluency in 6-wells were transiently transfected with 10 μM siRNA (antisense) using Lipofectamine (Invitrogen) to silence the stemness, Ago2, and P38 genes. After transfection with siRNA sequences, cells were allowed to stabilize for 48 h before being used in experiments. Cells were harvested after 24 h for RNA isolation and protein extraction. Silencer Negative Control siRNA (catalog number 4611; Ambion, Inc., Austin, TX) was utilized as a control for nonspecific gene silencing. The transfection of siRNA was conducted using DharmaFECT siRNA transfection reagents according to the manufacturer's instructions (Dharmacon RNA Technologies). Two complementary hairpin siRNA template oligonucleotides harboring the 21-nt target sequences of each human gene were employed for transient transfection (5 h) using 50 nM siRNA against Ago2, Oct4, Sox2, Rex1, and Nanog. Furthermore, the quantity of siRNA was optimized in accordance with the manufacturer's instructions. For each gene, targeted siRNAs and scrambled siRNAs with the same nucleotide content were used. For cell differentiation studies, a low concentration of si-Ago2 (20 nM) was utilized. Compared to unrelated control siRNAs and scrambled siRNAs, the gene-specific siRNAs resulted in an 80%–90% reduction in the mRNA levels of each gene as determined by real-time PCR. The siRNA that provided the most efficient inhibition (90%–95%) was utilized for experiments to assess cell function and gene expression.
Inhibition assays
To confirm the relevance of the JAK2, P38/JNK, and Wnt signaling pathways in terms of controlling the cell growth or functional gene expression in the Ago2 or stemness genes interfered cells, hUCB-MSCs were seeded in 10 cm dishes at a density of 6×10⁵ and cultured in 2% FBS containing DMEM medium for 8 h at 37°C in a CO2 incubator. The UCB-MSCs were then stimulated with Ago2 for 6 h. The Ago2-stimulated hUCB-MSCs were treated with the P38 MAPK inhibitor SB203580 (10 μM; Promega), the JAK inhibitor AG490 (10 μM; Sigma), or the β-catenin inhibitor DKK1 gene construct (1 μg) and then incubated them for 1 h. After a medium change, cells were further incubated for 12 h. Treated cells were then analyzed for relative self-renewal activity and differential gene expression via viable cell counting, Western blotting, or RT-PCR.
Western blot analysis
For confirmation of expressed proteins in cultured UCB-MSCs, cells were lysed in 500 μl of lysis buffer (20 mM Tris-HCl pH 7.5, 150 mM NaCl, 1 mM EDTA, 1% Triton X-100, 2.5 mM sodium pyrophosphate, 1 mM EGTA, 1 mM glycerophosphate, 1 mM Na3VO4, and 1 mM PMSF). The lysates were clarified via 10 min of centrifugation at 15,000 g and the total protein content was determined via a Bio-Rad (Millano, Italy) protein quantification kit. For Western blotting, equal amounts (40 μg) of protein extracts in a lysis buffer were subjected to 10% SDS-PAGE analysis and transferred to a nitrocellulose membrane. Anti-PI3K (1:1000, Cell Signaling), anti-p-MEK (1:1000, Cell Signaling), anti-p-ERK (1:1000, Cell Signaling), anti-p-STAT3 (1:1000, Cell Signaling), anti-p-Akt (1:1000, Cell Signaling), anti-p-SAPK/JNK (1:1000, Cell Signaling), anti-JAK2 (1:1000, Cell Signaling), anti-p21 (1:200, Santa Cruz Biotechnology, Santa Cruz, CA), anti-p53 (1:200, Santa Cruz Biotechnology), anti-c-Myc (1:200, Santa Cruz Biotechnology), anti-MAP2ab (1:500, Sigma), anti-NF160 (1:40, Sigma), anti-Nestin (1:500, BD Biosciences), anti-GFAP (1:3000, Dako Cytomation), anti-acetyl histone 3 (1:3000, Millipore Corp., Billerica, MA), anti-acetyl histone 4 (1:3000, Millipore), anti-Tuj (1:400, Sigma), and anti-β-actin (1:500, Sigma) antibodies were incubated with membranes. After Western blotting, relative band intensities were determined and compared using Quality-one 1-D analysis software (Bio-Rad).
CHIP on chip analysis
The monoclonal antibodies were obtained from Santa Cruz Biotechnology, and the rabbit polyclonal IgG (PP64B) antibody was obtained from Upstate. Cells were harvested and chemically crosslinked with 1% formaldehyde (Sigma) for 20 h at 4°C. Cells were then pelleted at 4°C (500 g), washed with ice-cold PBS, washed twice with lysis buffer, pelleted, and flash frozen in liquid nitrogen. Pellets were resuspended in pre-IP dilution buffer (4% GEPAL and 1 mM PMSF), and additional components (100 mM PMSF, protease inhibitor, 20% SDS, 5 M NaCl, H2O). Cells were sonicated using a Branson Sonifier 450 D at 50% amplitude with 1261-minute pulses followed by 1-minute rests in ice water. Sonicated fragments ranged in size from 200 to 1000 bp. Post-sonication, samples were centrifuged at 14,000 rpm for 10 min at 4°C, aliquoted, and flash frozen in liquid nitrogen. Sonicated cell extracts were equivalent to 2 x 10⁶ cells and were used in subsequent immunoprecipitations. Samples were pre-cleared with protein G Dynabeads (Dynal) in 1000 mL of dilution buffer that included 0.01% SDS and 1.1% Triton X-100. Cell extracts were incubated with 1 μg of antibody overnight at 4°C. Chromatin antibody complexes were isolated with 100 mL of protein G Dynabeads, and washed once with low salt buffer (0.1% SDS, 1% Triton X-100, 2 mM EDTA, 20 mM Tris-HCl, 150 mM NaCl), once with high salt buffer (same as low salt buffer with 500 mM NaCl), once with LiCl wash buffer (0.25 M LiCl, 1% IGEPAL-CA630, 1% deoxycholic acid, 1 mM EDTA, 10 mM Tris), and twice with TE. Protein/DNA complexes were eluted from the beads in 10 mL of 20% SDS, 20 mL of 1 M NaHCO3, and 170 mL of H2O at 65°C with occasional vortexing. Crosslinking was reversed by the addition of 8 mL of 5 M NaCl to samples and overnight incubation at 65°C. Extracts were treated with RNase A and proteinase K, and DNA was purified using an Upstate EZ ChIP kit. A total of 5 mg of purified DNA (Ago2-chip, c-Myc-chip, Sox2-chip, and Input) was amplified using the GenomePlex Whole Genome Amplification (WGA) kit (Sigma), DNase treated, and labeled with a GeneChipH WT Double-Stranded DNA Terminal Labeling kit.
Mesodermal and endodermal differentiation potencies of hUCB-MSCs
To compare the multipotential differentiation abilities of UCB-MSCs, the cells were subjected to differentiation under conditions known to induce adipogenic, osteogenic, and chondrogenic lineages in human cells. Prior to culturing in the induction media, the cultures were grown up to ∼80% confluence. For adipogenic differentiation, the UCB-MSCs were induced by the passaging of cells at a dilution of 1:10 in control media supplemented with 10 ng/ml of insulin and 10–9 M dexamethasone (Sigma). Adipogenic differentiation was visualized by the presence of highly refractory intracellular lipid droplets via phase-contrast microscopy. To induce osteogenic differentiation, the cultures were fed daily for 3 weeks with control medium containing 10 mM β-glycerophosphate, 50 ng/ml ascorbic acid, and 10–9 M dexamethasone. The mineralization of the extracellular matrix was visualized by staining the cultures with von Kossa and Alizarin Red. Von Kossa staining was conducted using an aqueous 5% AgNO3 solution, followed by 2 min of fixation in 5% Na2S2O3 solution. For chondrocyte differentiation, the cells were cultured at 37°C with 5% CO2 in 500 μl of chonodrogenic media containing 6.25 g/ml insulin, 10 ng/ml of transforming growth factor 1, and 50 ng of ascorbate-2-phosphate in control media for 2–3 weeks. The medium was replaced every 2 days for 15 days. For calcium deposit and chondrocyte analysis in paraffin-embedded tissue, we stained differentiated cells using methylene blue. For the induction of neural differentiation of hUCB-MSCs, we cultured neurospheres in a neurobasal medium (NB; Invitrogen, Gaithersburg, MD), supplemented with B27 (Invitrogen), 20 ng/ml of bFGF, and 10 ng/ml of EGF (Sigma) for 4–7 days. hUCB-MSCs neurospheres were then layered and cultured further on PDL-laminin double-coated well plates for 7 days. On the other hand, β-cell differentiation of UCB-MSCs was induced by culture in “N2 media+NA” containing DMEM/F12 (Gibco-Invitrogen) supplemented with 10 mM nicotinamide (Sigma-Aldrich), ITS (1:50), B27 media supplement (1:50; Invitrogen), and 15% FBS. After 24 h of culture, the medium was changed to high-glucose (3500 mg/L dextrose) differentiation media for 2 weeks. After the induction of differentiation, we conducted immunocytochemistry using an insulin antibody. To determine the expression of the neural markers, differentiated UCB-MSCs were fixed in 4% paraformaldehyde (PFA) fixative solution for 30 min at room temperature. After extensive washing in PBS, the cells were blocked for 30 min at room temperature with 1% normal goat serum. The cells were then incubated with primary antibodies against anti-TuJ 1 (1:500; Sigma) and anti-GFAP (1:1500; Dako, Carpinteria, CA). After extensive washing, the cells were incubated with FITC or Texas-Red conjugated secondary antibodies (1:250; Molecular Probes). Controls in which the primary antibodies were omitted or replaced with irrelevant IgG resulted in no detectable staining. The specimens were evaluated using a Leica fluorescence microscope (Leica Microsystems, Exon, PA). We then analyzed the cells via fluorescence microscopy (Leica Microsystems).
Measurement of intracellular ROS and NAC/SOD pretreatment
Intracellular ROS in UCB-MSCs was evaluated using the fluorescent probe DCFDA [5-(and-6)-carboxy-2',7'-dichlorodihydrofluorescein diacetate]. For visualization by fluorescent microscopy, cells were plated in glass bottom dishes and treated with 0.3 mM H2O for 6 h. Cells were then washed and loaded with 10 μM of DCFDA for 30 min at 37°C and imaged by fluorescent microscopy (ex/em=495/525 nm). For the quantitative assessment of ROS production, UCB-MSCs in 96-well plates were washed with HBSS and loaded with 10 μM of DCFDA for 30 min at 37°C. Cells were washed three times with HBSS and exposed to 100 μM of tBHP alone or with SS-31. The oxidation of DCF was monitored in real-time using a microplate spectrofluorometer (Molecular Devices, Sunnyvale, CA) using ex/em wavelengths of 485/530 nm.
To determine the relationship between stemness and Ago2 expression and ROS generation in cultured UCB-MSCs, we directly treated cells with the antioxidant NAC (N-acetyl-L-cysteine, 1 mM, Sigma Co.) or transfected 8 μg of the SOD1 (superoxide dismutase)/pCMV66-XL5 (OriGene Technologies, Rockville, MD) gene construct after transfecting cells with si-stemness or si-Ago2. After 24 h of SOD1/pCMV66-XL5 transfection or NAC treatment, we analyzed ROS accumulation and stemness expression. In addition, we detected cell self-renewal-associated gene expression. We evaluated the differentiation potency of si-stemness or si-Ago2-transfected hUCB-MSCs before and after SOD1/pCMV66-XL5 transfection using immunocytochemical and Western blot analyses. Next, 24 h after si-stemness and si-Ago2 transfection, we transfected cells with SOD1/pCMV66-XL5 and induced neural or β-cell differentiation for 7 days in lineage-specific differentiation media. We evaluated the differentiation potency using immunocytochemical and Western blot analyses.
Statistical analysis
Significance was tested by t-test or ANOVA using GraphPad InStat 3.0 software (La Jolla, CA). For repeated measures ANOVA and in vitro studies where Kaplan-Meier curves and log-rank analysis were performed, MedCalc software (Mariakerke, Belgium) was used.
Footnotes
Acknowledgments
This work was supported by the National Research Foundation of Korea (NRF) grant funded by the Korea Government (MEST, 2010-0020265) and the 21st Century Frontier/Korean Stem Cell Research Center (SC 5110).
Author Disclosure Statement
No competing financial interests exist.
Abbreviations used
References
Supplementary Material
Please find the following supplemental material available below.
For Open Access articles published under a Creative Commons License, all supplemental material carries the same license as the article it is associated with.
For non-Open Access articles published, all supplemental material carries a non-exclusive license, and permission requests for re-use of supplemental material or any part of supplemental material shall be sent directly to the copyright owner as specified in the copyright notice associated with the article.