
Abstract
Introduction
Innovation
The gene neutrophil cytosolic factor 1 (NCF1) emerged as a possible genetic contributor to rheumatoid arthritis (RA), due to findings in rodent models of arthritis. The genetics of NCF1 is complex in the human genome, complicating genetic analysis. In this study several new assays were developed to be able to investigate copy number variation of NCF1 and the allelic distribution and functionality of three single-nucleotide polymorphisms in NCF1. This detailed characterization revealed that RA patients are less likely to have one extra copy of a functional NCF1-like gene compared with controls. This is the first finding of a genetic association of NCF1 with RA. It was also found that the T-allele of NCF1-339 is expressed in NCF1 and encodes a greatly reduced capacity of the phagocyte NADPH oxidase (NOX2) complex to produce reactive oxygen species. These findings help elucidate part of the complexity of NCF1 and add support to previous findings of a role of NCF1 and the NOX2 complex in RA pathogenesis.
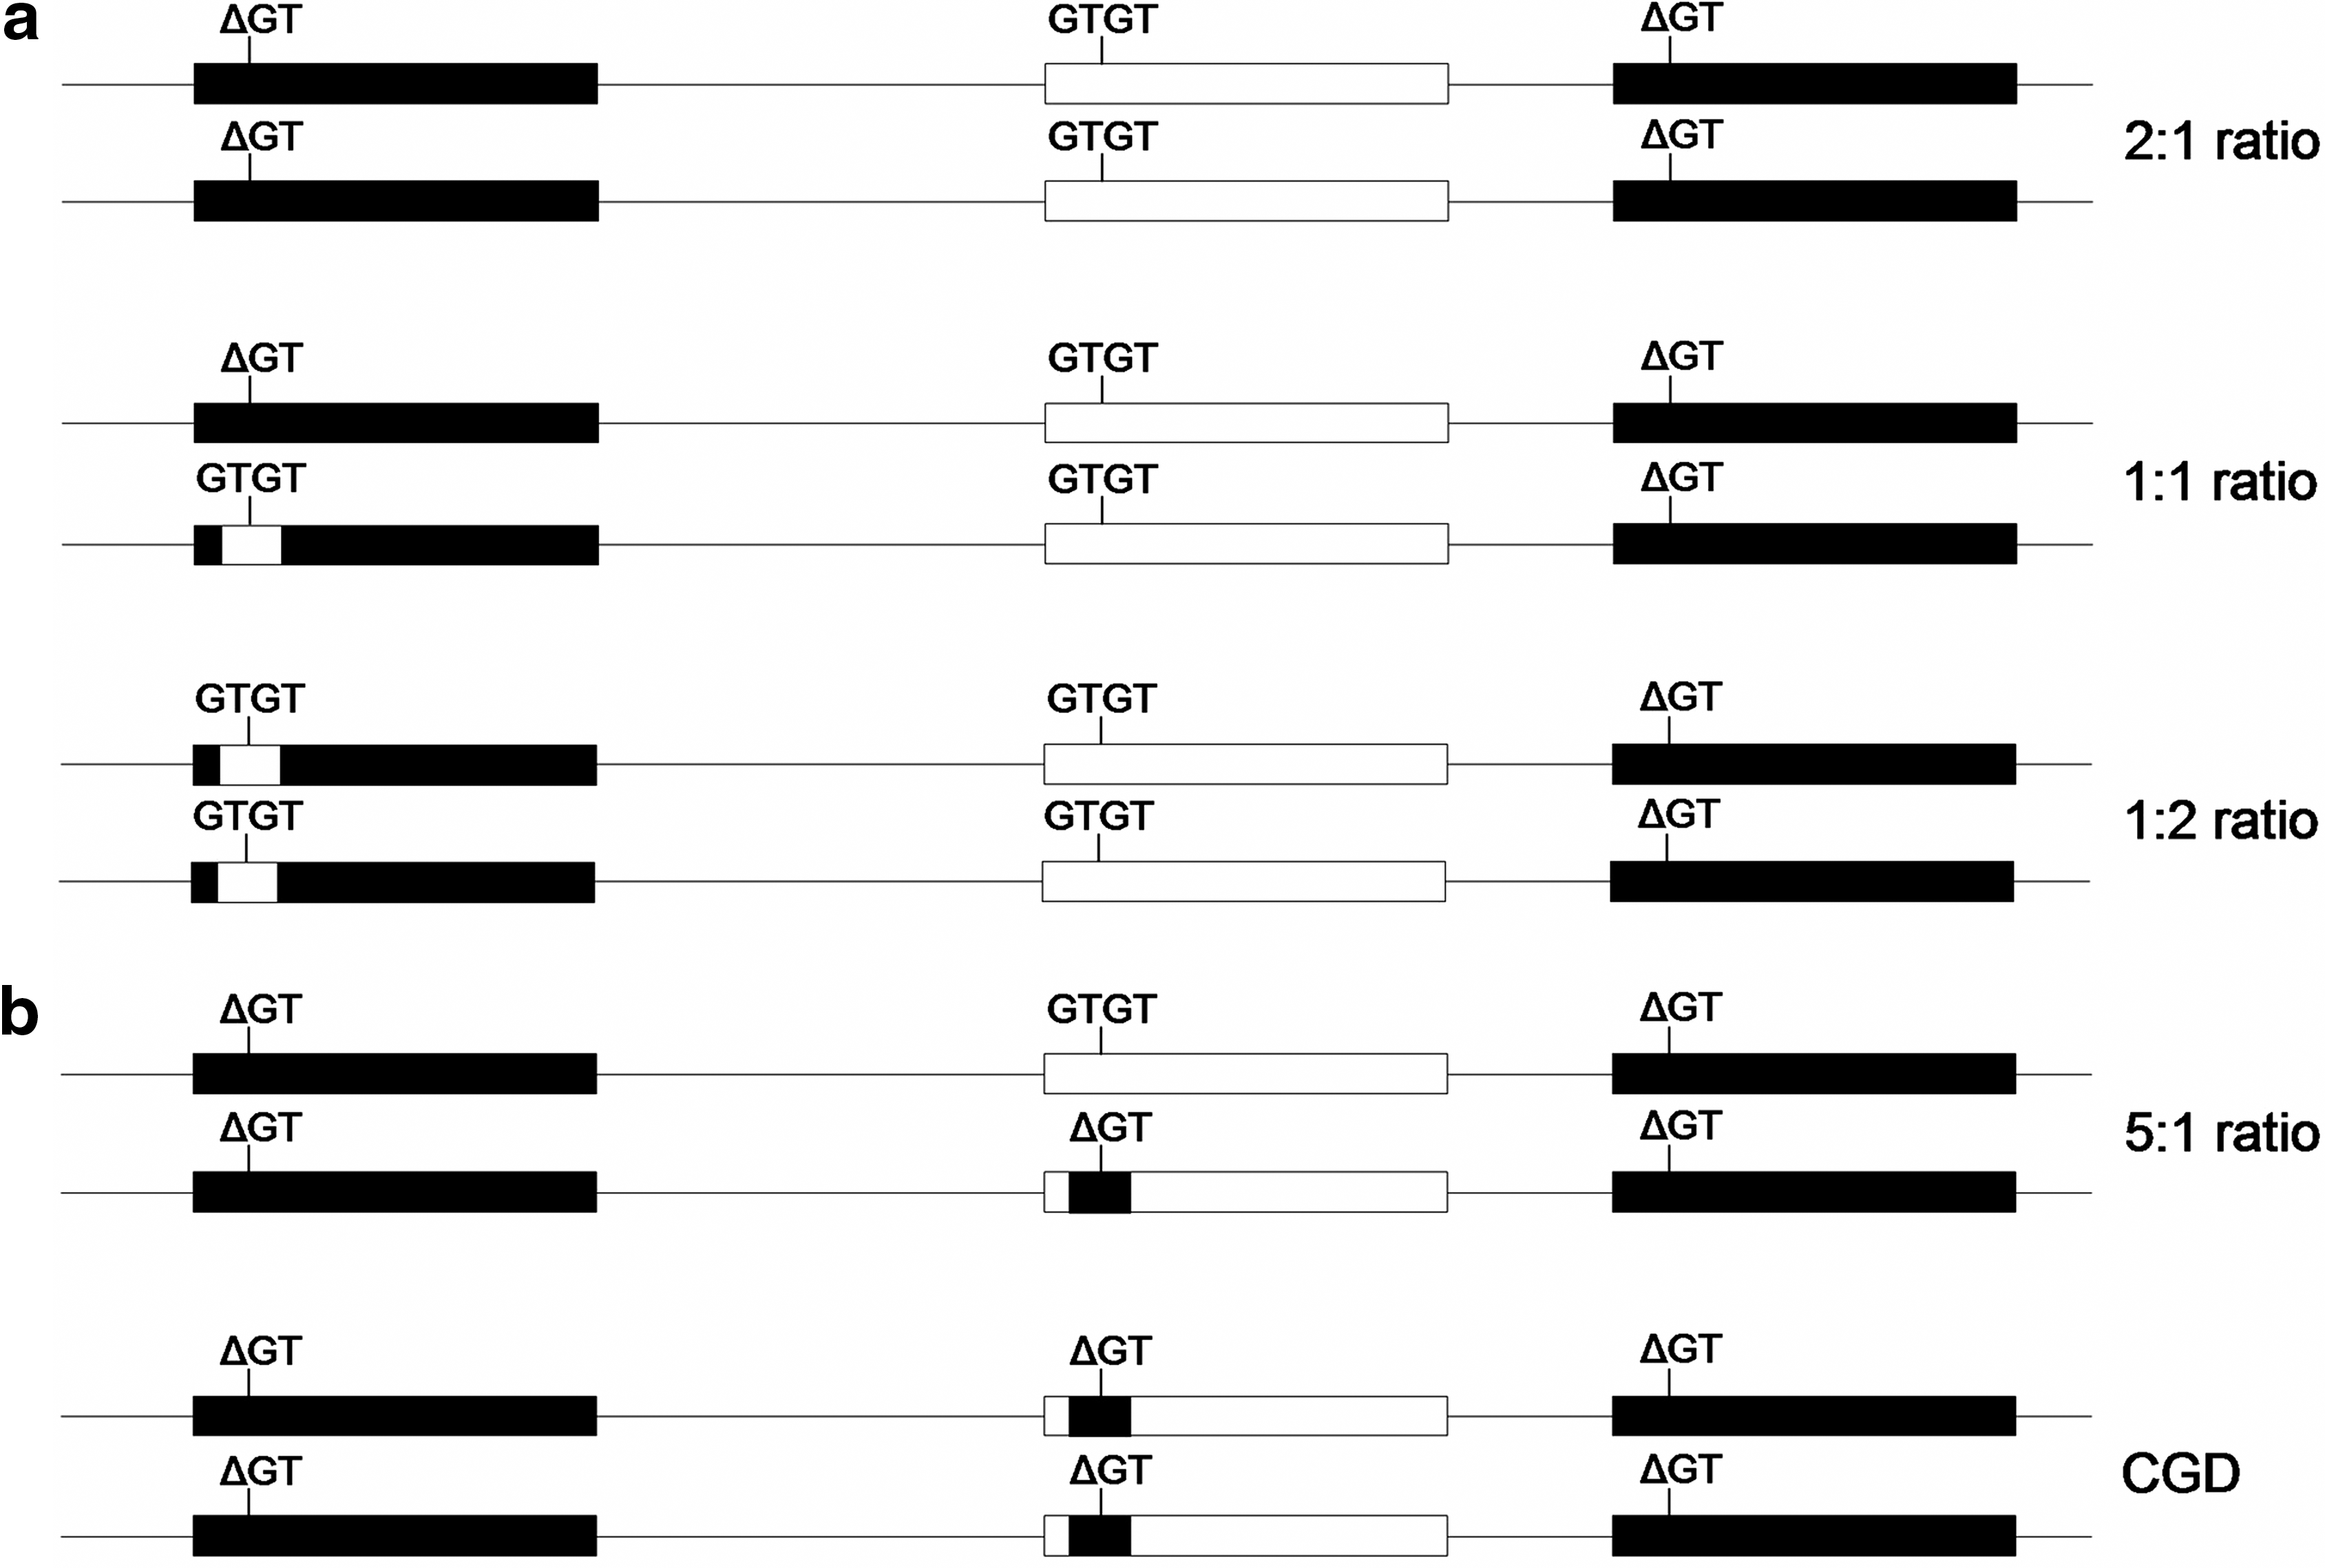
In the human genome, NCF1 is located in the complex 7q11.23 region, characterized by deletions, duplications, and inversions (2, 26). Close to NCF1 there are two pseudogenes, NCF1B and NCF1C (NCF1B/C), sharing 98% sequence similarity with NCF1 (10, 15). The only genetic variant confirmed to be NCF1B/C specific is a GT deletion (ΔGT) in exon two, encoding a premature stop codon and a truncated protein (10). Patients with the NCF1 (p47phox) form of the primary immunodeficiency syndrome chronic granulomatous disease (CGD) only have NCF1B/C-like genes, containing the ΔGT deletion, leading to a complete loss of NOX2 produced ROS (Fig. 1b) (32). In these patients, the functional GTGT sequence in NCF1 has been exchanged with the ΔGT sequence from NCF1B/C, most likely due to genetic cross over events between NCF1 and NCF1B/C (32). Due to the high sequence similarity between NCF1 and NCF1B/C, it is difficult to specifically measure the number of functional NCF1 copies. Instead, methods have been developed to estimate the ratio of NCF1B/C and NCF1 genes, by segregating on the ΔGT/GTGT sequence (14). The most prevalent ΔGT/GTGT ratio, 2:1, reflects two copies each of NCF1, NCF1B, and NCF1C, whereas CGD carriers have five NCF1B/C like genes and only one NCF1 gene, giving a 5:1 ratio (Fig. 1). A few studies have also reported 1:1 and 1:2 ratios, reflecting the presence of one or two copies of an additional NCF1-like gene (here denoted NCF1-II), containing the functional GTGT sequence (Fig. 1a) (14). The NCF1-II gene reportedly expresses NCF1B/C-specific alleles (10), but is fully transcribed and believed to be functional (8, 14). Two of the NCF1B/C-specific alleles in NCF1-II encode amino acid replacements (14) and could therefore alter protein function and the capacity of the NOX2 complex to produce ROS.
The genetic variants in the human NCF1 gene could have similar effect on NOX2 produced ROS, as the SNP in Ncf1 found to regulate arthritis in the rats. To investigate if genomic or genetic variants of NCF1 are associated with RA, we performed a detailed study of the different NCF1 genes, by measuring the ΔGT/GTGT ratio in RA cases and controls. We also genotyped three nonsynonymous SNPs in 974 RA cases and controls to study association with RA.
Results
Copy number analysis reveals complex distribution of NCF1 genes
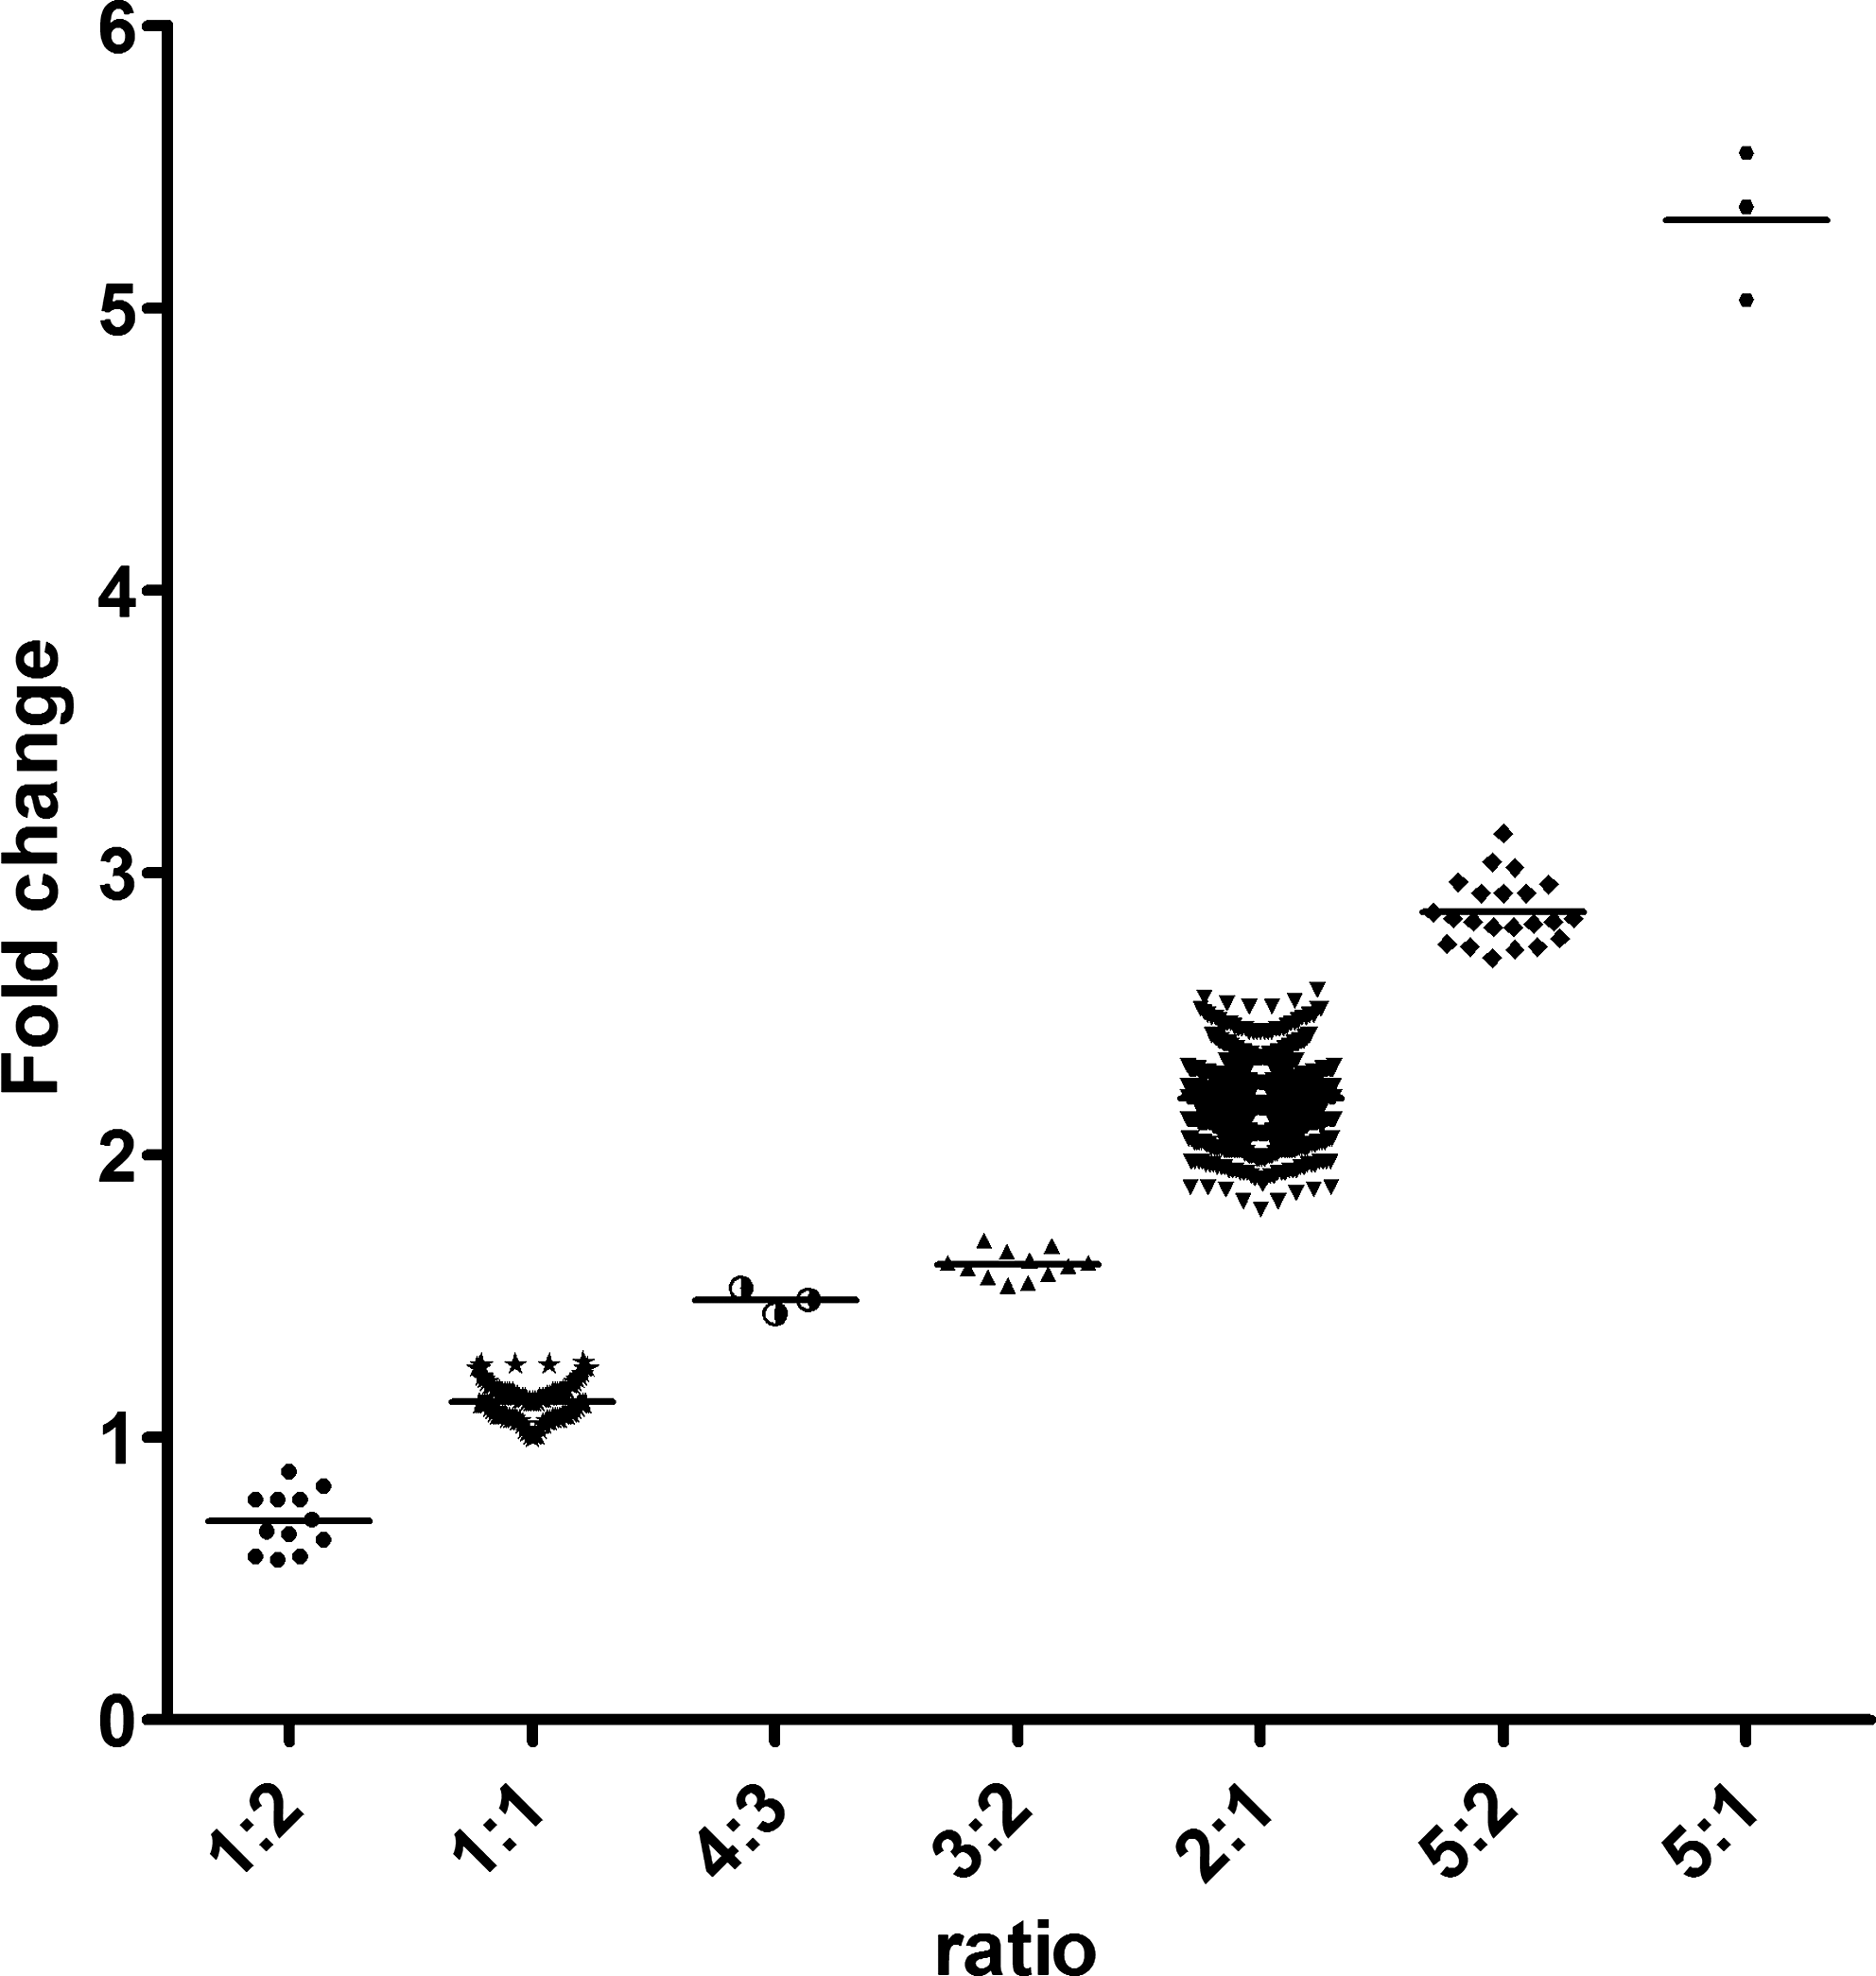
We used quantitative real-time polymerase chain reaction (qPCR) to measure the ratio between NCF1B/C and NCF1 in 494 RA patients and 480 controls. The multiplex qPCR assays contain probes specific for either the GTGT sequence found in NCF1 and NCF1-II or the ΔGT sequence found in NCF1B/C (39). The ratio between NCF1B/C and NCF1 was estimated from the fold change (FC) values calculated using the 2−ΔΔCT method. As expected, the 2:1 ratio is the most common (85.3%), whereas 9.3% have a 1:1 ratio (Table 1). The increased ΔCT value of NCF1/NCF1-II and decreased of NCF1B/C confirm that the 1:1 ratio corresponds to three copies each of NCF1B/C and NCF1/NCF1-II. Twelve samples had a 1:2 ratio, corresponding to two copies of NCF1B/C and four of NCF1/NCF1-II. Three CGD carriers, with a 5:1 ratio, were also detected. In addition, we found three ratios, 3:2, 4:3, and 5:2, not corresponding to a total of six NCF1-like genes, but instead seem to reflect five or seven genes (Fig. 2). The ΔCT values shows that the 3:2 and 5:2 ratios reflect changes in NCF1B/C copy number, with an increased ΔCT of NCF1B/C in the 5:2 ratio and a decreased in the 3:2 ratio. The 4:3 ratio instead reflects an increase in NCF1/NCF1-II copy number.
p-value 0.037.
#, number of subjects.
The NCF1-II gene is less common in RA patients
When comparing the ratio distribution between RA patients and controls, we found that RA patients have a significantly lower frequency of the 1:1 ratio, 7.6% compared with 11.6% in controls, p=0.037, OR=0.63, 95% CI: 0.40–0.97 (Table 1). No difference in frequency between cases and controls was seen for the other ratios (Table 1).
The T-allele of NCF1-339 is expressed in NCF1 and not specific for NCF1-II
A previous study has suggested that NCF1-II expresses NCF1B/C-specific alleles at two nucleotide positions, here denoted NCF1-339 and NCF1-566 (14). To confirm this and to investigate association with RA, these two SNPs and a third nonsynonymous SNP, NCF1-365, were genotyped in the Epidemiological Investigation of Rheumatoid Arthritis (EIRA) cohort (Table 2). Genotyping of NCF1 is complicated by the presence of NCF1B/C, requiring a nested PCR strategy, exclusively amplifying the GTGT sequence, to achieve NCF1/NCF1-II specificity (Supplementary Fig. S2; Supplementary Data are available online at
Representative rs numbers.
NCF1, neutrophil cytosolic factor 1; SNP, single-nucleotide polymorphism.
5:1 ratio.
2:1, 5:2, and 3:2 ratios.
1:1 or 4:3 ratios.
1:2 ratio.
p-values from the combined NCF1/NCF1-II association analysis of allele frequencies.
#, number of subjects.
T-allele of NCF1-339 encodes loss of functionality of the NOX2 complex
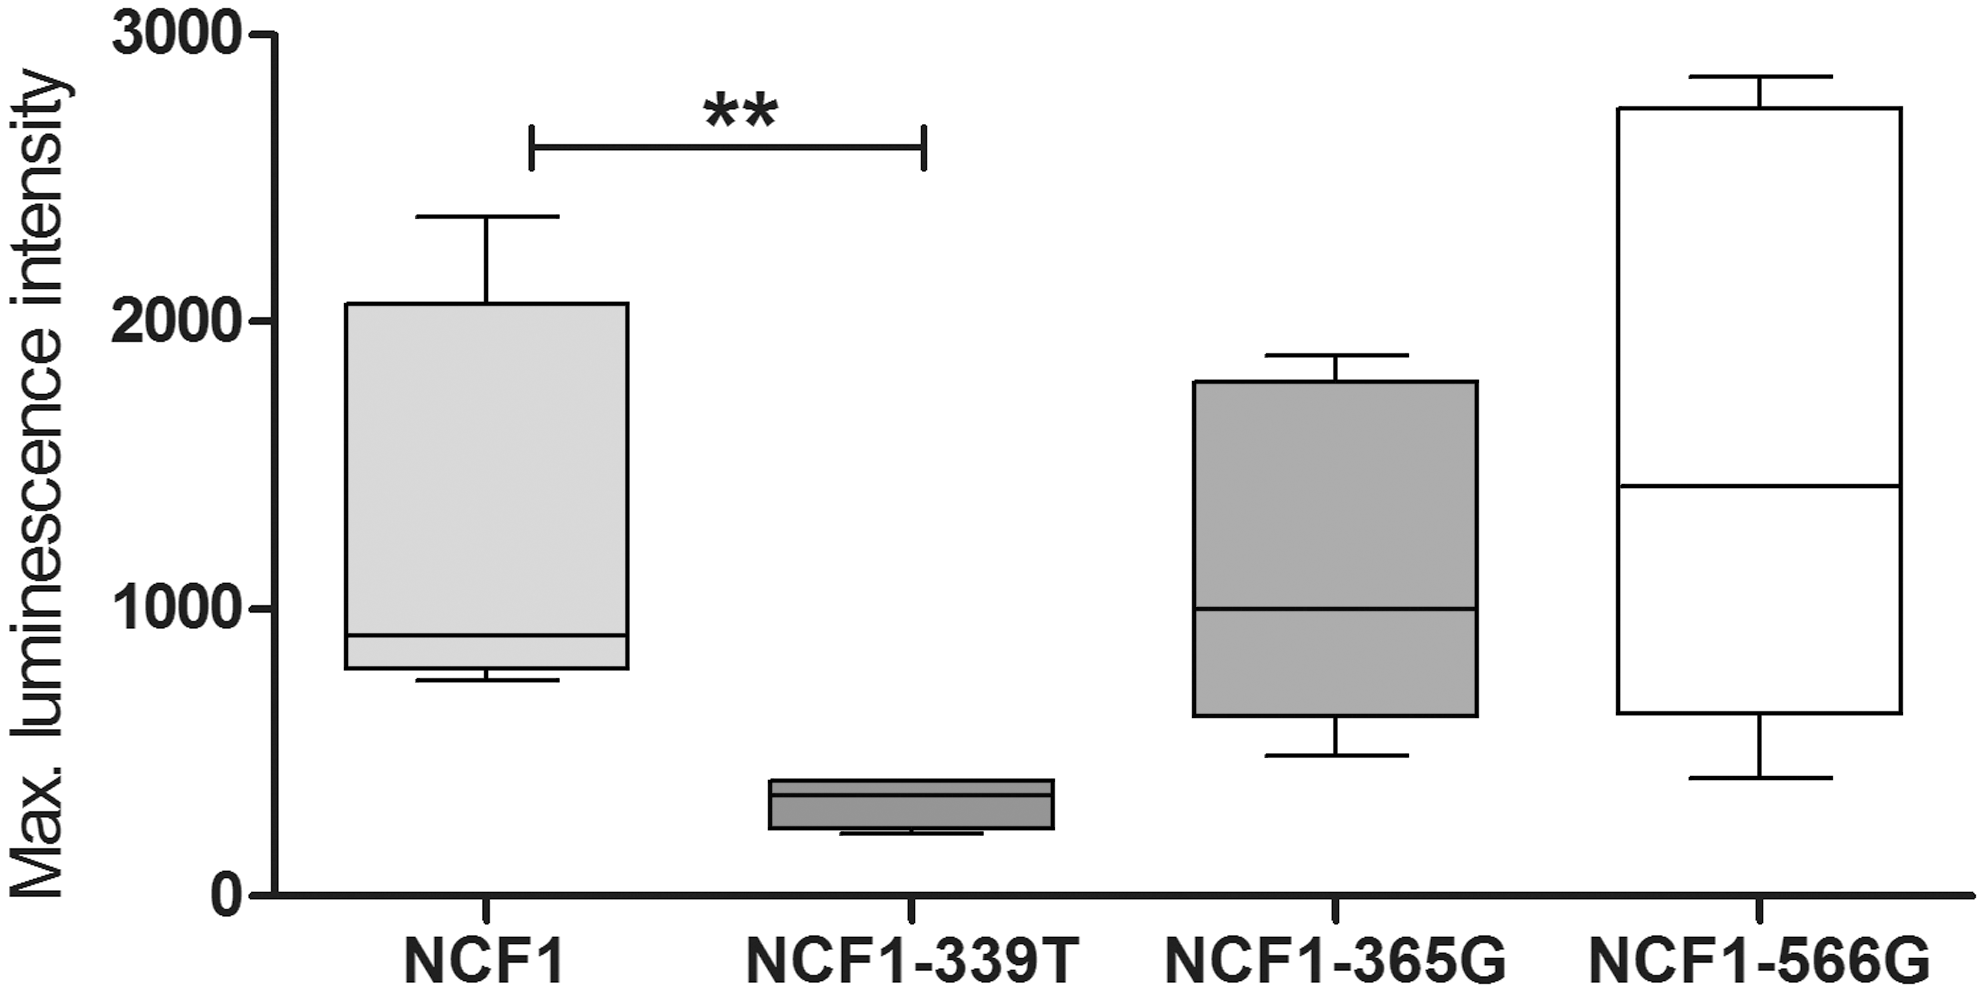
NCF1-339, NCF1-365, and NCF1-566 encode amino acid shifts that could alter the functionality of the NCF1 protein and consequently also of the NOX2 complex (Table 2). We used three constructs of the human NOX2 complex in COS cells, in which the NCF1 gene was mutated at either one of the three SNP positions, to estimate the effect of each allele on ROS production. The construct expressing the T-allele of NCF1-339 had significantly reduced ROS production, p=0.0079 (Fig. 4). The G-allele of NCF1-365 and the G-allele of NCF1-566 did not encode a significant difference in ROS production capacity.
Discussion
In this study we show that genomic variation of the NCF1 gene is associated with RA. The 1:1 ΔGT/GTGT ratio, reflecting the presence of NCF1-II, is significantly less common in patients with RA compared with controls. We also show that the G-allele of NCF1-566 is specific for NCF1-II, but the T-allele of NCF1-339 is not, in contrast to previous reports (14). We also see that the T-allele of NCF1-339 greatly reduces ROS production by the NOX2 complex. These findings help elucidate part of the complexity of NCF1 as well as adding support to previous findings of a role of NCF1 and the NOX2 complex in RA pathogenesis.
Previous studies have investigated association of the 1:1 ratio with inflammatory bowel disease (12, 38), parasitic infection, and multiple sclerosis (11), with the presumption that the 1:1 ratio increases disease risk. Our results instead indicate a protective effect of the 1:1 ratio against RA and thus also of the presence of the additional NCF1-II gene. Having the 1:1 ratio increases expression of NCF1 mRNA and protein (8, 13); however, it does not increase NOX2-produced ROS. Most likely this is because the efficiency of the NOX2 complex cannot be increased unless there is increased expression of the other subunits of the complex (22). Hence, there appears to be no difference in ROS production between the 1:1 or 2:1 ratio, explaining the RA-protective effect. However, a reduced number of functional NCF1 copies negatively affect the functionality of the NOX2 complex (8). Due to a heterozygous deletion, some patients with Williams-Beuren syndrome have only one functional NCF1 gene, and reduced levels of Ncf1 protein and ROS. We show that the T-allele of NCF1-339 is expressed in both NCF1 and NCF1-II and could have a similar effect by encoding a complete loss of NOX2-produced ROS. In a 2:1 ratio context, heterozygous expression of the T-allele will likely reduce ROS levels, whereas in a 1:1 ratio context, the presence of the additional NCF1-II gene could restore ROS production to normal levels. In this study, the T-allele is most frequent in a 2:1 ratio context, and RA patients are slightly more likely to have a 2:1 ratio while expressing the T-allele, 72.3% compared with 64.3% of controls. Although not significant, this could indicate that the protective effect of the 1:1 ratio comes from the additional NCF1-II gene restoring reduced ROS levels, caused by loss-of-function alleles such as the T-allele of NCF1-339. Most likely, there are also other genetic variants in NCF1 encoding reduced functionality of the NOX2 complex, from which NCF1-II could be protective.
The T-allele of NCF1-339 encodes an amino acid shift from arginine to histidine at position 90 in the protein sequence. Arg90 is evolutionary conserved and is a binding site to phosphatidylinositol (3,4)-biphosphate (PI(3,4)P2) in the membrane (36). Mutation studies have shown that amino acid substitutions to Lys90, Ala90, and Leu90 greatly reduce the binding capability to PI(3,4)P2, and decreases the production of ROS (20, 24). The substitution to His90 could be expected to have similar or more severe effects on binding to PI(3,4)P2, than Lys90 based on the amino acid properties, which is supported by our results from the construct experiments.
There are reports of CGD patients showing symptoms resembling autoimmune syndromes—inflammatory bowel disease (1, 34), juvenile RA (23), and lupus (5)—indicating how important a functional NOX2 complex is to maintain tolerance toward self-antigens and preventing autoimmunity. The link to autoimmunity is strengthened by both NCF4 and NCF2 of the NOX2 complex being associated with other autoimmune diseases: NCF4 with Crohn disease (31) and NCF2 with SLE (9).
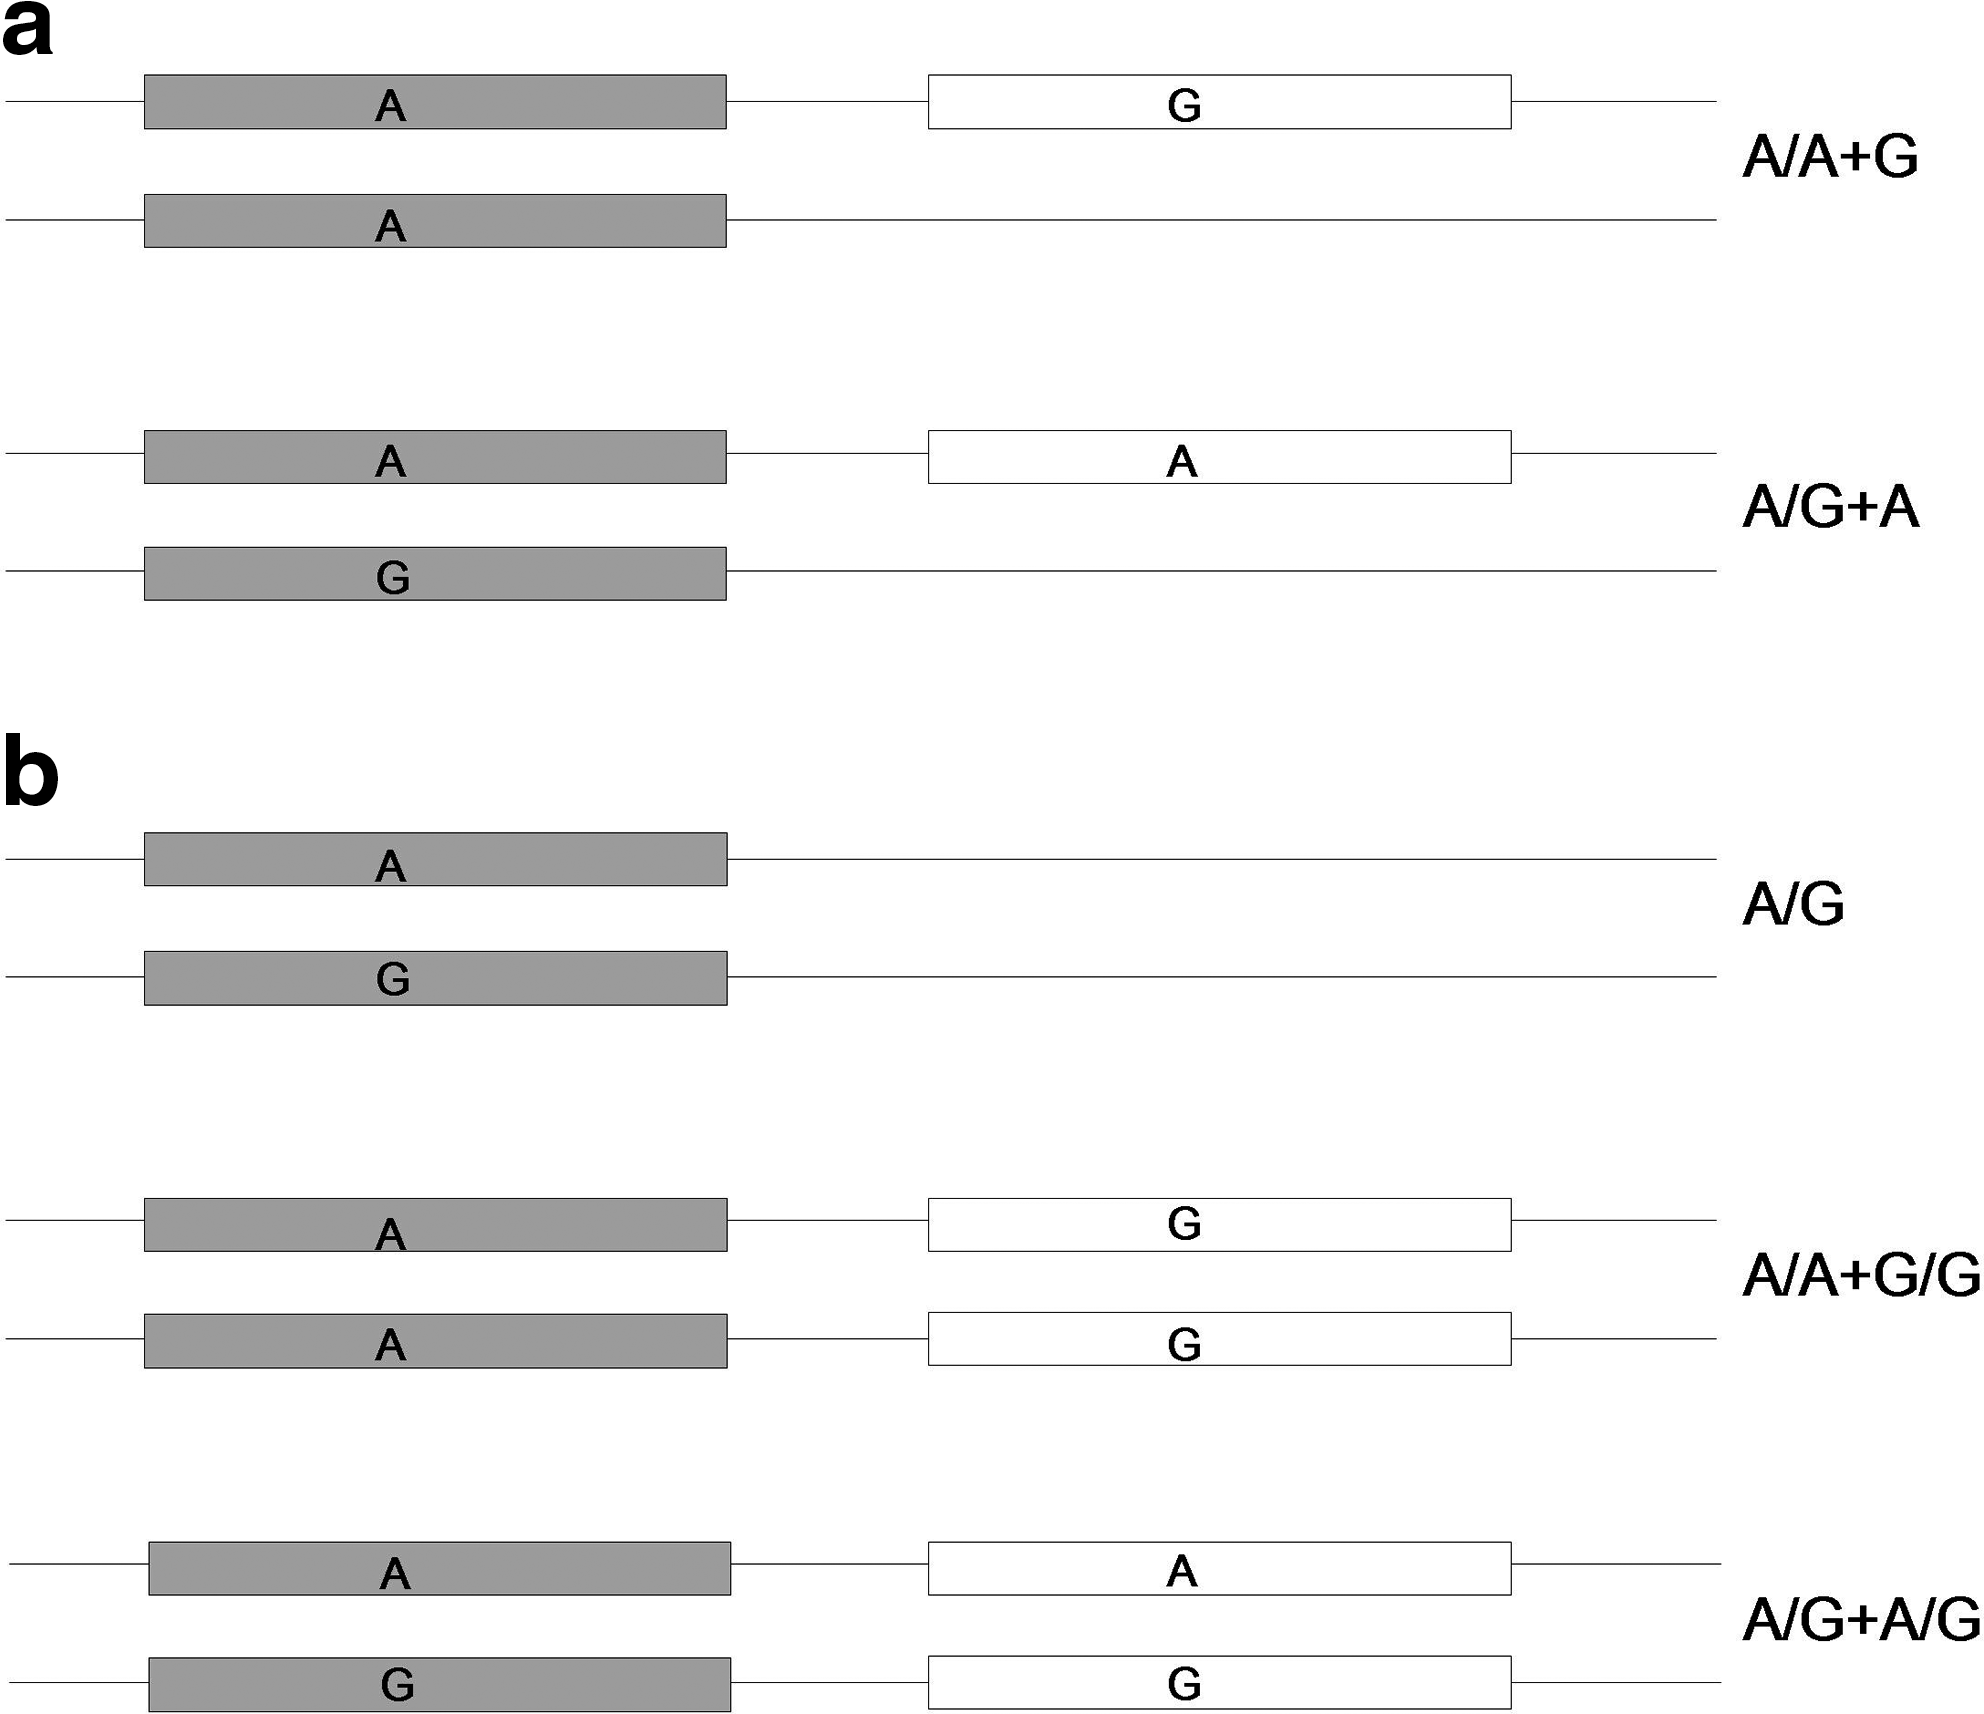
The region surrounding NCF1 is highly dynamic and subject to segmental duplications, deletions, and inversions (2, 21). In combination with the presence of the NCF1B and NCF1C genes, this makes studying NCF1 with PCR-based techniques difficult. The ΔGT sequence is the only genetic variant shown to be NCF1B/C specific, and therefore this was used to distinguish between NCF1/NCF1-II and NCF1B/C. The nested genotyping assay specifically amplifies the GTGT sequence, but analysis is further complicated by the presence of NCF1-II. To be able to determine the true genotypes we used an out-of-phase design of the genotyping assays, increasing the number of peaks defining the genotype. However, we are still unable to conclusively determine the exact genotypes of NCF1-566, when one or two copies of NCF1-II are present, as the genotyping assay used for NCF1-566 cannot separate NCF1 from NCF1-II. However, as the G-allele is only seen in 3 individuals not having NCF1-II, we conclude that the G-allele is almost exclusively expressed in NCF1-II and thus the genotypes are interpreted as A/A+G and A/A+G/G. NCF1-339 and NCF1-365 could be genotyped more precisely by using an additional assay, specifically amplifying the region spanning exons three and four in NCF1, excluding NCF1-II (33). This assay enables correct calls of genotypes like C/C+T and C/T+C.
The qPCR assay used in the ratio study quantifies the number of NCF1/NCF1-II and NCF1B/C copies separately by two different probes, making it possible to determine changes in the number of NCF1/NCF1-II or NCF1B/C copies. However, due to a slight unspecificity of the NCF1B/C probe, the NCF1B/C copy number is overestimated, reflected by higher than expected ratios. Nonetheless, we have determined that the 1:1 ratio reflects an increase of NCF1/NCF1-II copies and a decrease of NCF1B/C, compared with the 2:1 ratio. The 1:2 ratio reflects a substantial increase in NCF1/NCF1-II and decrease in NCF1B/C. The 3:2 and 5:2 ratios reflect changes only in NCF1B/C copy number, whereas the 4:3 ratio indicate an increase of NCF1/NCF1-II, while NCF1B/C is unchanged. The finding of the 3:2, 5:2, and 4:3 ratios indicates that the distribution of NCF1 genes is even more complex than previously believed and a recent study shows that this distribution also varies between populations (4).
In conclusion, our data show a complex inheritance of NCF1, NCF1-II, and NCF1B/C. We find that RA patients are less likely to have a copy of NCF1-II, possibly indicating that an additional copy of a functional NCF1-like gene is protective against RA. This finding is also supportive of the theory that increased levels of ROS are protecting against RA and autoimmunity.
Methods
Patient samples
The samples are from the EIRA, a population-based case–control study. The study base comprised the population, aged 18–70 years, in an area of the middle and southern parts of Sweden during May 1996–2005. A case was defined as a person who received a first time diagnosis of RA according to the American College of Rheumatology criteria of 1987 (3). About 494 RA patients and 480 controls, individually matched on sex and age were used. About 72% are women and the mean age is 53±11 years for the patients and 56±12 years for the controls.
Multiplex qPCR assay
To quantify the number of NCF1 and NCF1B/C copies and to estimate the ΔGT/GTGT ratio, we used a multiplex qPCR assay (39). In each multiplex reaction the number of either NCF1 or NCF1B/C copies is compared with the control gene albumin, which has no copy variation. The MBG probes (Applied Biosystems, Carlsbad, CA) for NCF1/NCF1B/C use the GTGT sequence as a distinguisher and are labeled with the FAM dye. The albumin probe is labeled with the VIC dye. Primer and probe sequences are listed in Supplementary Table S1. The reaction was run using the ABI PRISMA® 7000 Sequence Detection System and TaqMan Universal PCR Mastermix (Applied Biosystems). Each reaction was run in triplicate with 50 ng of DNA/reaction and a final volume of 25 μl. Optimized primer concentrations in the NCF1/Albumin reaction are 600/800 nM and the NCF1B/C/Albumin reaction are 300/800 nM. The probe concentrations are 100 nM in all reactions. ΔRn, the normalized emission intensity for a specific sample, was set at five different thresholds along the exponential phase of the curve, giving five CT values per sample. The mean and standard deviation were calculated and used in further calculations. ΔCT=(mean CT NCF1–mean CT albumin) or (mean CT NCF1B/C–mean CT albumin). About 2−ΔΔCT between NCF1B/C and NCF1 was calculated using the formula: ΔΔCT=(ΔCT NCF1B/C−ΔCT NCF1). To ensure specificity of the NCF1 and NCF1B/C probes, plasmid DNA from the NCF1/NCF1B/C-specific bacterial artificial chromosome (BAC) clones (NCF1; RP11-186N20 and RP11-81J7, NCF1B/C; RP11-219M8 and RP11-396K3) was used.
Ratio analysis and validation
The 2−ΔΔCT FC values were divided into 0.1 windows and graphed (Supplementary Fig. S1). Based on the distribution of the FC values, ranges for the ratios were set (Supplementary Table S2). The 4:3 ratio FC values overlap with the 3:2 FC values and could only be assigned a ratio after analysis of the ΔCT values for the NCF1/NCF1-II probe. We were not able to assign ratios for eight samples, which were excluded from further analysis. The distribution of copy number of NCF1-II (0, 1, or 2) was in accordance with Hardy–Weinberg equilibrium in controls but not in patients (p=0.0002), which is expected because of the detected association.
As a validation method we also ratio-typed all samples using the gene-scan method (7). We found that this method was not as sensitive as the qPCR method in distinguishing between the 5:2, 3:2, and 2:1 ratios, which contributed to a higher failure rate (∼10%). Among the nonfailed samples 743/751 (98.9%) assigned a 2:1 ratio using the gene-scan method had also been assigned the 2:1 ratio using the qPCR assay. The genotyping assays were also used to confirm ratio assignment in samples where both alleles are expressed. A combined analysis of the gene-scan and genotyping results assigned the same ratio for 90/92 samples assigned 1:1 by the qPCR method.
Selection of SNPs for genotyping study
We selected two nonsynonymous SNPs, NCF1-339 and NCF1-566, reported to be of NCF1B/C origin and specifically expressed in NCF1-II (14). The nonsynonymous SNP NCF1-365 was also selected for genotyping. The SNPs have multiple rs-numbers and are therefore denoted according to their position in the mRNA sequence, NCF1-339 (rs13447 or rs17355366), NCF1-365 (rs17856077 or rs62475423), and NCF1-566 (rs4868).
Genotyping
Nested PCRs were used to ensure assay specificity (Supplementary Fig. S2). The first PCR specifically amplifies either NCF1/NCF1-II (primers; GTGT-specific) or NCF1 (primers; NCF1-exon3-4; Supplementary Table S1). Reaction conditions for the GTGT-specific assay are 100 ng DNA, 300 nM primer, 500 nM dNTP, 1× Buffer 3, 3.75U Taq polymerase (Expand long template PCR system; Roche Diagnostic, Basel, Switzerland). Reaction cycling conditions were 2 min at 95°C, followed by 10 cycles of 10 s at 95°C, 6.5 min at 68°C, followed by 20 cycles of 15 s at 95°C, 6.5 min+10 s extension each cycle at 68°C, followed by 68°C for 7 min. The specificity of the reactions was confirmed by using BAC clones specific for NCF1 (RP11-186N20 and RP11-81J7) or NCF1B/C (RP11-219M8 and RP11-396K3). The second (nested) PCR amplifies the regions surrounding the SNPs following standard protocols for pyrosequencing (Qiagen, Hilden, Germany; Supplementary Fig. S2). About 0.5 μl of a 1:500 dilution of the first PCR was used in the pyrosequencing reaction.
Genotype analysis
The pyrosequencing method calculates genotypes by comparing peak heights, corresponding to the nucleotides in and around the SNP, in a pyrogram. Each peak is generated by the light emitting from incorporation of a nucleotide. At the SNP position nucleotides representing the two alleles are injected and incorporation of the correct nucleotide will generate a peak in the pyrogram. A peak height of 1 represents the insertion of one nucleotide and a height of two a double insertion. To interpret pyrograms created by incorporation of nucleotides in both NCF1 and NCF1-II, we used an “out-of-phase” design for the three genotyping assays. In the out-of-phase assay the injection of nucleotides is out-of-phase for one of the two alleles, leading to incorporation only if the in-phase allele is present. This strategy creates a pyrogram with more peaks defining the genotype (Supplementary Fig. S3). To correctly call the genotypes, the results from the ratio analysis also had to be included in the analysis. The distribution of genotypes was in accordance with Hardy–Weinberg equilibrium.
ROS production assay
All reagents like isoluminol, HRP fraction II, and PMA were purchased from Sigma Aldrich (St. Louis, MI). COS cells reconstituted with CYBB (gp91phox), CYBA (p22phox), and NCF2 (p67phox) (provided by Mary C. Dinauer, Indiana University, Indianapolis, Indiana) was cultured in Dulbecco's complete medium, 10% fetal calf serum, and penicillin–streptomycin (Gibco, Invitrogen, Paisley, United Kingdom). Human NCF1 (BM457671) was isolated from the IMAGE clone 5498834 and inserted into the pcDNA3.1/Hygro (+) mammalian expression vector (Invitrogen). The three studied amino acid variants at position 339 (Arg to His), 365 (Ser to Gly), and 566 (Asn to Asp) were produced in the NCF1 construct using in vitro mutagenesis kit (Agilent Technologies, Santa Clara, CA) according to the manufacturer's recommendations. Adherent COS-7 cells were harvested by incubating with trypsin/ethylenediaminetetraacetic acid for 5 min at 37°C. The cells were resuspended, washed in phosphate-buffered saline, and cultured in 96-well plates (NUNC, Roskilde, Denmark) at a density of 20,000 cells/well overnight. The cells were transiently transfected with NCF1 with lipofectamin plus, optimum, and DNA PLUS system (Invitrogen), according to the manufacturer's instructions, using 100 ng DNA per well. Transfected cells were grown in complete media for another 48 h until assayed.
Functionality of the NOX2 complex and thus the function of the studied NCF1 allele was assayed directly in the culture plate using an isoluminol detection method (6). Briefly, the cells were gently washed in Hank's balanced salt solution and 100 μl of isoluminol reagent buffer (final concentration isoluminol 50 μg/ml, horse radish peroxidase-type II 2.5 μ/ml, and PMA 400 ng/ml). Samples were gently mixed and the data collection was initiated immediately. The NOX2-produced ROS is initiated within minutes. Extra-cellular ROS production was followed at 37°C as produced luminescence signal (FluoStar Optima, BMG Labtechnologies, Offenburg, Germany) and presented as maximal relative signal during a measurement period of 30 min.
Statistical analyses
The Hardy–Weinberg analyses were done using the HWE test in the PLINK software (30). Association analyses of allele and genotype frequencies were done using the “Basic case/control association” test and the “Full model” tests in PLINK. Both these tests are based on contingency tables and Chi-square statistics. The combined NCF1/NCF1-II association analyses were done using the “CNP/SNP association” test in PLINK, which is based on regression analysis, and using contingency tables and Chi-square statistics in GraphPad InStat version 3.06. Ratio frequencies were also analyzed using contingency tables and Chi-square statistics in GraphPad InStat.
The statistical analysis of the ROS production differences in the mutated NCF1 construct against nonmutated NCF1 was performed using the Mann Whitney test with GraphPad Prism version 4.03.
Footnotes
Acknowledgments
We thank Emma Mondoc for technical assistance, Lars Klareskog and Leonid Padyukov for providing the EIRA samples, and André Reis for advice on the qPCR method. This work was supported by the Swedish Research Council, the Swedish Science Strategic foundation, and the EU projects Masterswitch HEALTH-F2-2008–223404, NeuroproMiSe LSHM-CT-2005–01863, and AUTOCURE LSHM-CT-2005–018661.
Author Disclosure Statement
Rikard Holmdahl and Peter Olofsson are founders of the company Redoxis AB, which is exploring possibilities for treatment by agents stimulating ROS production. No other authors declare conflict of interest.
Abbreviations Used
References
Supplementary Material
Please find the following supplemental material available below.
For Open Access articles published under a Creative Commons License, all supplemental material carries the same license as the article it is associated with.
For non-Open Access articles published, all supplemental material carries a non-exclusive license, and permission requests for re-use of supplemental material or any part of supplemental material shall be sent directly to the copyright owner as specified in the copyright notice associated with the article.