
Abstract
Introduction
Because of its lipophilic property, H2S penetrates biological membranes (32) and inhibits mitochondrial cytochrome c oxidase activity with a binding constant similar to the one measured with cyanide (17). Cytochrome oxidase is the terminal oxidase of the mitochondrial electron transport chain (36). In contrast, if sulfide is infused to permeabilized colonocytes, a mitochondrial sulfide oxidation is observed that is maintained as long as the sulfide flux does not exceed the cellular oxidation capacity, leading us to propose hydrogen sulfide as the first mineral fuel for human colonocytes (13). The mitochondrial sulfide oxidizing unit (SOU) is presumably made of the sulfide quinone reductase (SQR), which oxidizes sulfide and donates electrons to the coenzyme Q in the respiratory chain, and of two other enzymes, the dioxygenase ethylmalonic encephalopathy (ETHE1) and the thiosulfate sulfur transferase (TST; also known as one isoenzyme of the rhodanese), which allow the production of thiosulfate (7, 16, 31, 35). Accordingly, we have shown that the transfection of CHO cells with a mammalian expression vector containing the cDNA for the human SQRDL gene homologous to bacterial enzyme led to an increased capacity for sulfide oxidation (21).
Innovation
Our results represent an important contribution in the field of colonic epithelial cell sulfide metabolism by showing that sulfide oxidizing capacity is increased in differentiated cells. Importantly, our results are compatible with the view that sulfide is not primarily oxidized for increasing the cellular level of ATP but rather for allowing its detoxification. These results must be considered taking into account that luminal sulfide in excess is known to represent a metabolic troublemaker and a genotoxic agent against genomic DNA. By using oxygen consumption measurement and gene expression assay, our data indicate that the respiratory capacity of colonic epithelial cells and sulfide oxidizing unit activity represent important parameters for sulfide detoxification capacity.
In that context, this study was undertaken to determine the concentration of the sodium salt of H2S, which is situated between stimulating and inhibiting concentrations toward O2 consumption in intact human colonic HT-29 Glc−/+ epithelial cells. HT-29 Glc−/+ cells, although originating from a colon carcinoma, have retained numerous metabolic similarities with normal colonocytes, including their capacity to oxidize butyrate (1, 22).
Furthermore, we tested if cellular differentiation is associated with an increased capacity of colonocytes to oxidize sulfide. We also examined which block, that is, SOU and/or respiratory chain, is modified when H2S detoxification capacity is increased. Lastly, biopsies from human large intestine were recovered for the measurement of expression of genes corresponding to the SOU enzymes in the colonic mucosa according to the different anatomical regions to determine if the three enzymes constituting this unit are homogeneously or heterogeneously expressed in the human large intestine mucosa.
Results
Effects of sulfide on HT-29 Glc−/+ cell oxygen consumption
As shown in (Fig. 1A) NaHS, used at a 20 μM concentration, was able to markedly increase the O2 consumption of HT-29 cells. A higher NaHS concentration, that is, 40 μM, failed to significantly affect the basal O2 consumption. Using NaHS at 65 or 130 μM led to an inhibition of cellular O2 consumption. After allowing the HT-29 cells to metabolize the sulfide present in the incubation medium, the reversion rate of oxygen consumption goes back to the basal value when using the 20 μM concentration. In the presence of higher concentration of sulfide, the progressive inhibition of respiration was concomitant with incapacity of HT-29 cells to go back to the initial value, indicating only partial reversion of this inhibition (Table 1).
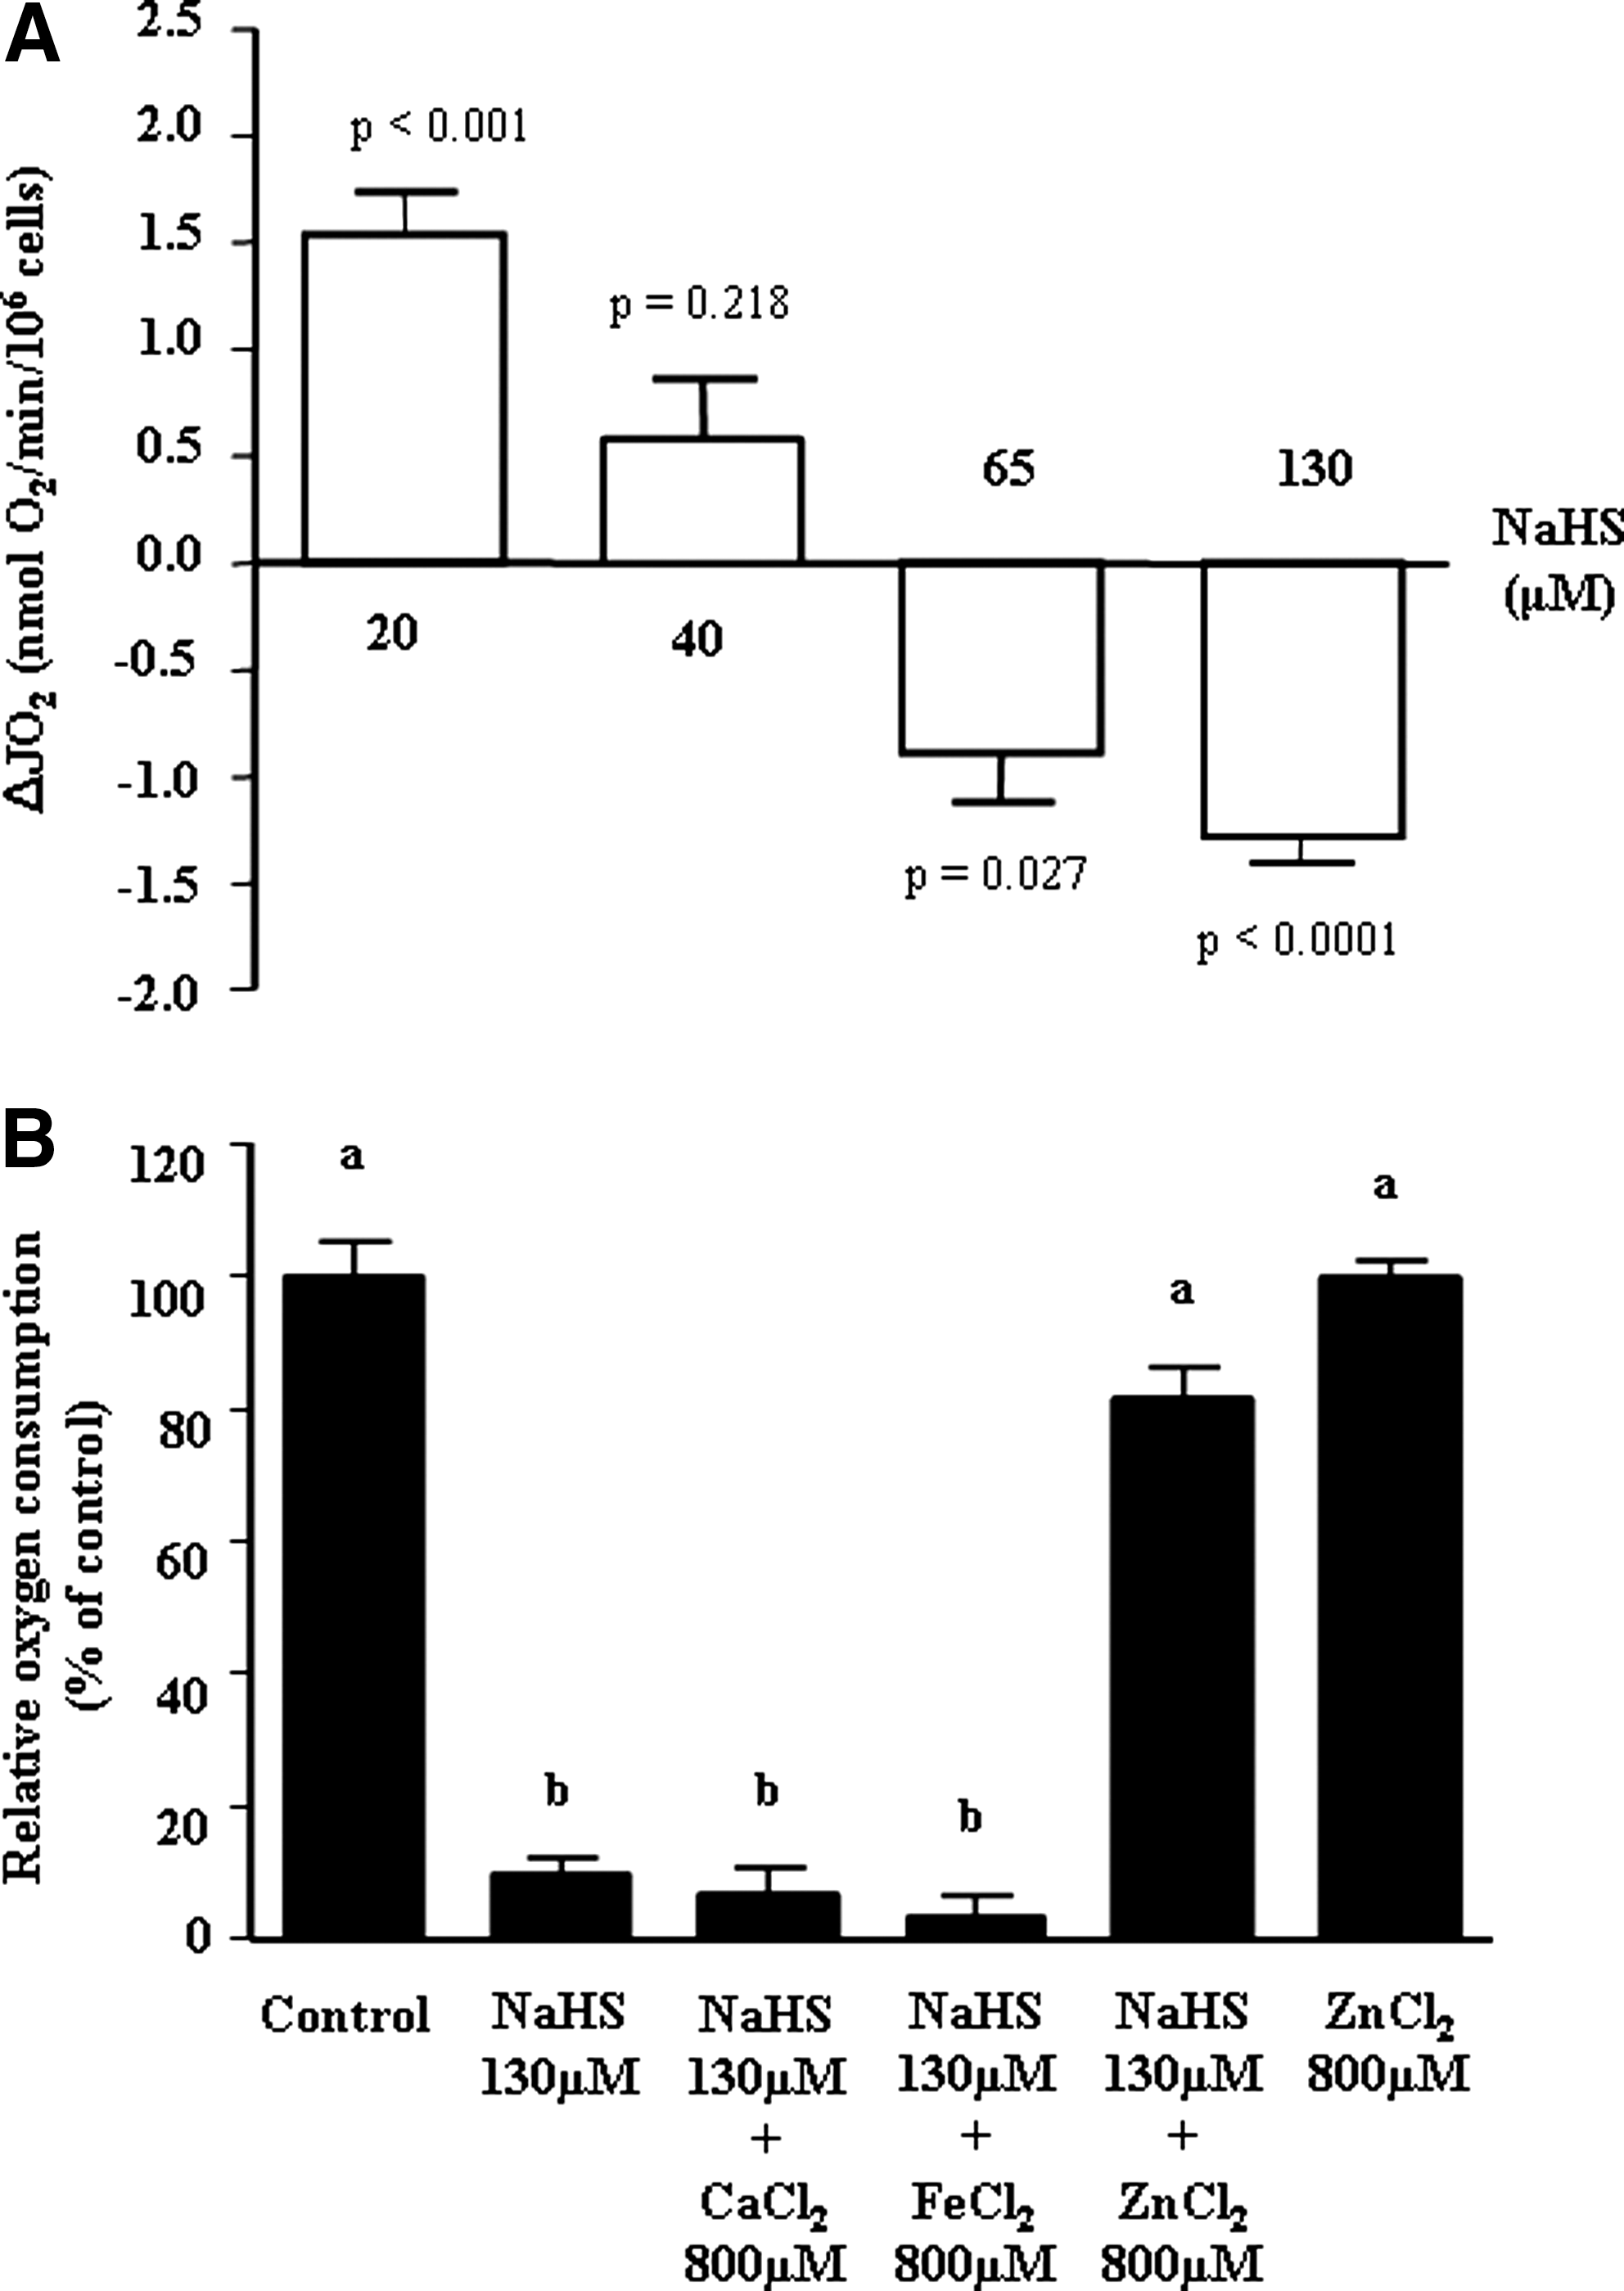
The reversion of the effects of NaHS was calculated after stabilization of the respiratory rate following the stimulation (20 μM) when all NaHS added was oxidized or inhibition (65–130 μM) of oxygen consumption induced by addition of NaHS. Oxygen consumption rates of cells were measured for 35 min after addition of different concentrations of NaHS and expressed as the percentage of basal oxygen consumption (before any NaHS addition). The results (mean±SEM) represent 5–8 independent experiments. Values were considered significantly different when the p-value was<0.05.
NS, not significant.
Effects of divalent cations on the inhibiting effect of NaHS on HT-29 Glc−/+ oxygen consumption
As indicated in Figure1B, 800 μM ZnCl2 was able to reverse the inhibiting effect of 130 μM NaHS on HT-29 oxygen consumption. Lower doses of ZnCl2 were less effective (data not shown). Other salts of divalent cations, that is, CaCl2 and FeCl2, were without any detectable effect on such parameter.
Capacity of HT-29 Glc−/+ cells to oxidize sulfide according to their differentiation state
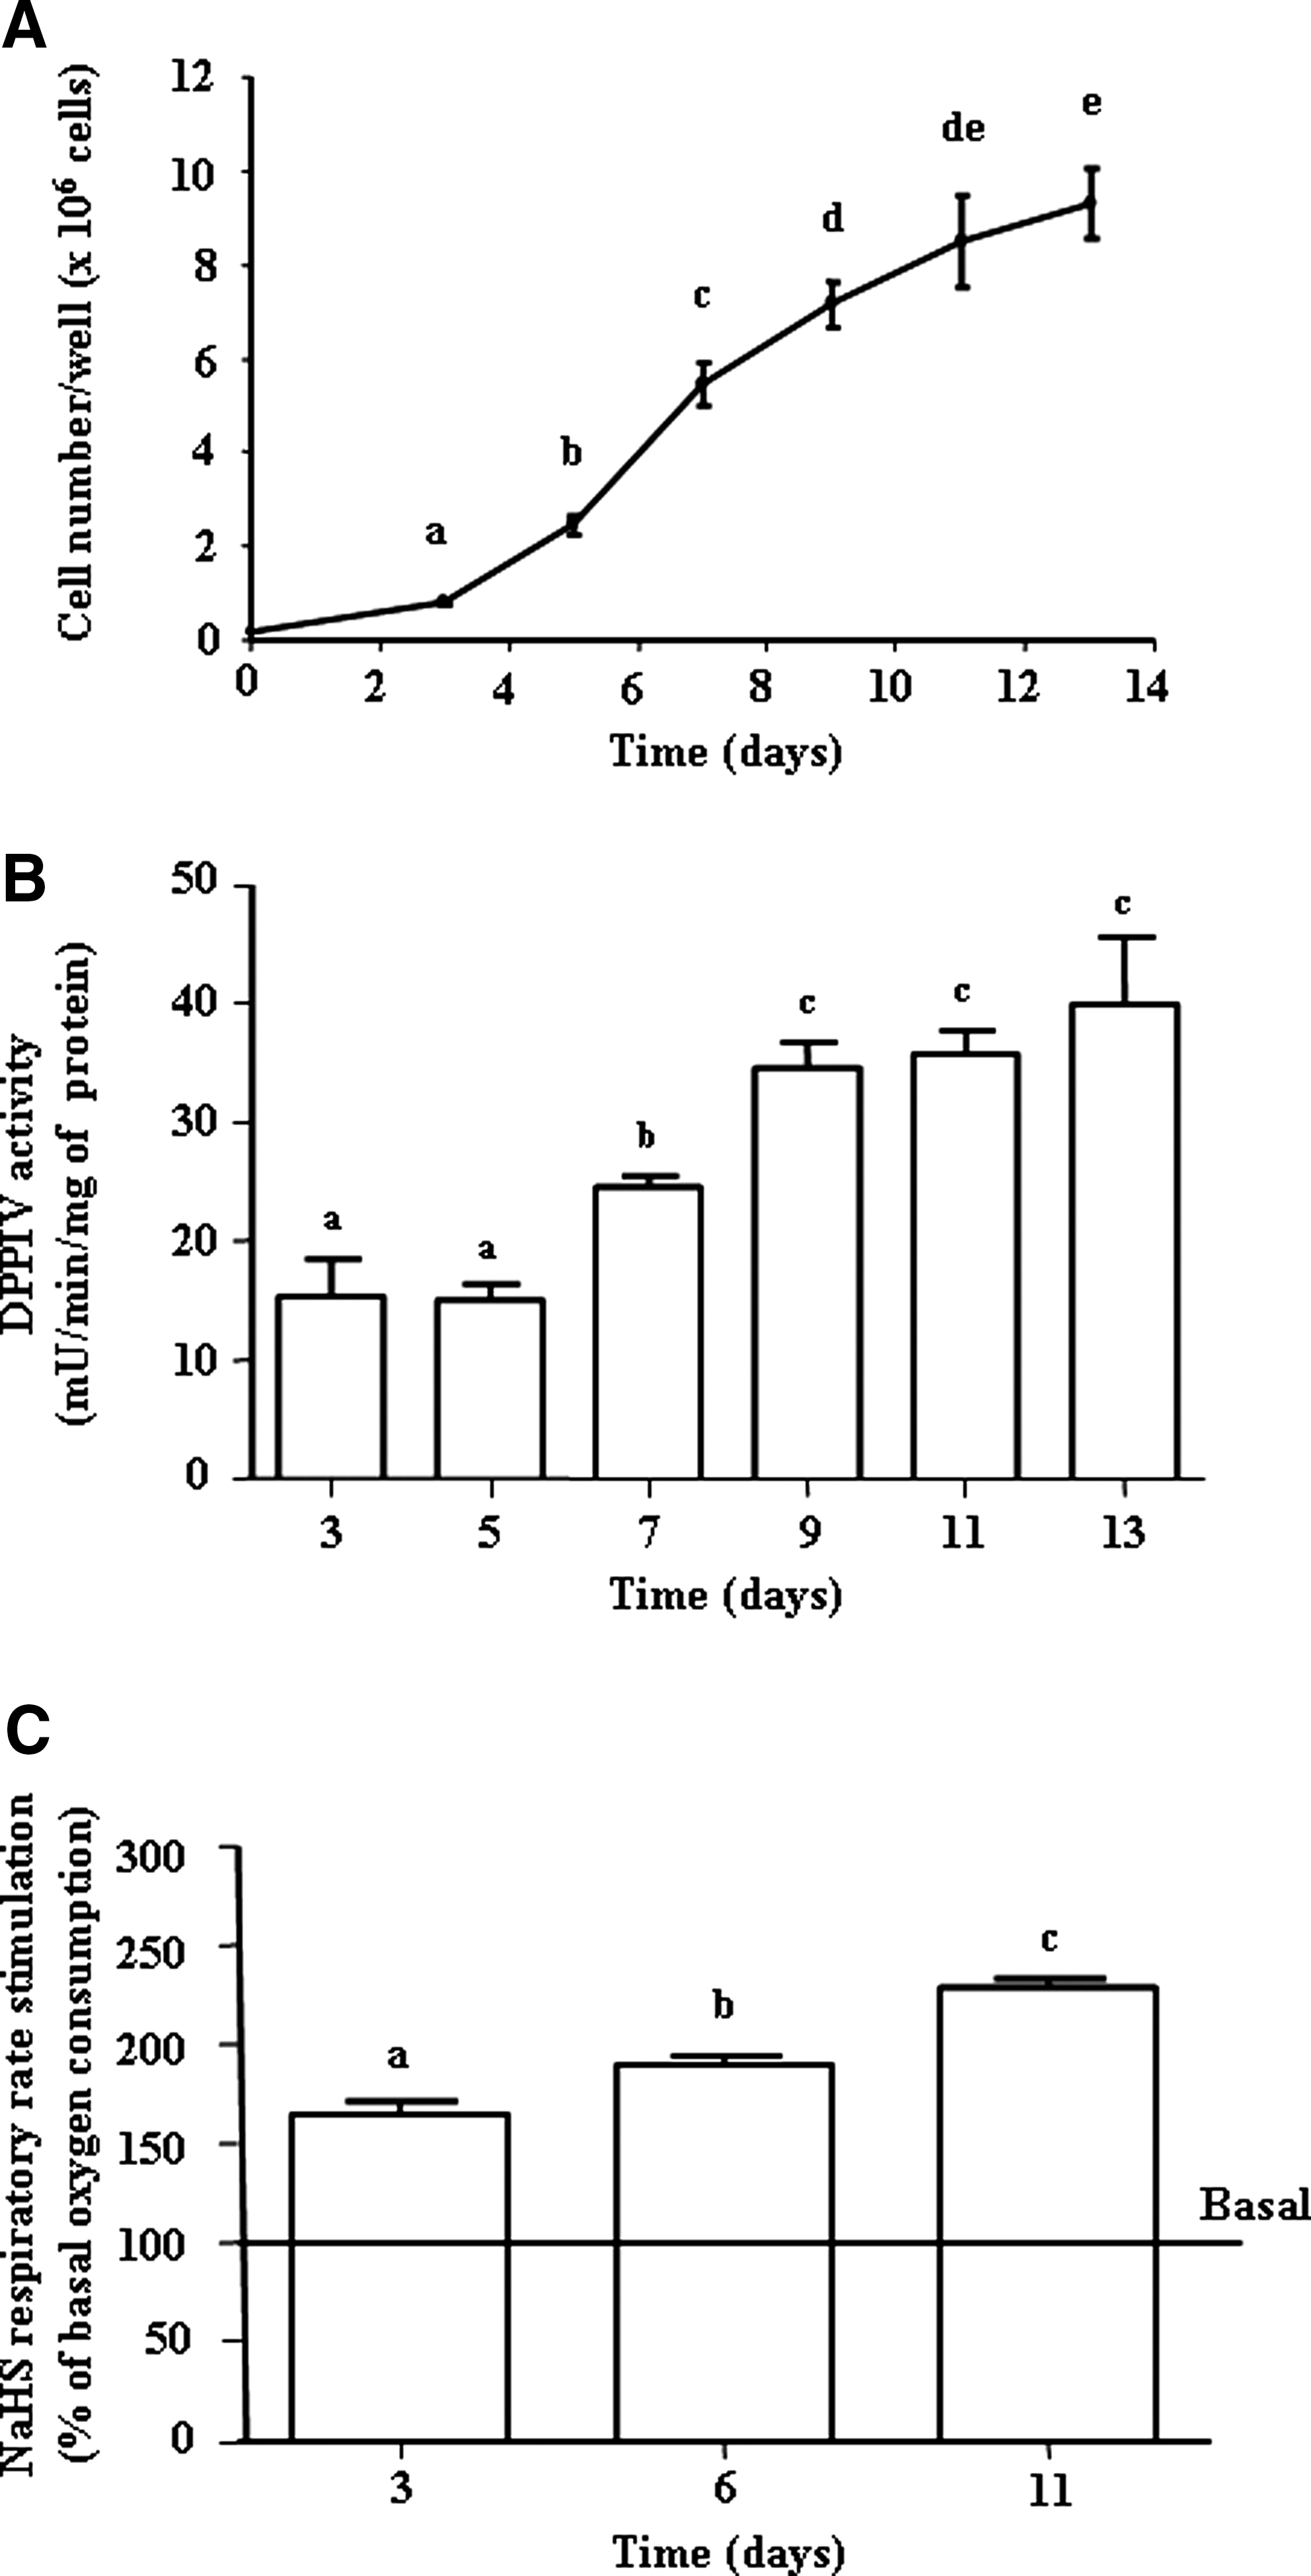
As indicated in Figure 2A, after a period of rapid cell growth, HT-29 cells progressively slowed down up to late confluency at day 13. This was concomitant with an increase of the brush membrane-associated dipeptidyl peptidase IV (DPPIV) activity used as an indicator of cell differentiation (Fig.2B). Using HT-29 cells in the early growth phase (day 3), in the preconfluency period (day 6) and at late confluency (day 11), we found, using 20 μM NaHS concentration, that the cell capacity for sulfide oxidation was significantly increased from day 3 to day 11 (Fig. 2C). The basal oxygen consumption (measured without any exogenous agent) was similar at day 3, day 6, and day 11 (n=5, see Fig. 5).
Effect of fatty acid pretreatment on the capacity of HT-29 Glc−/+ cells to oxidize sulfide
As shown in Figure 3A, when HT-29 cells were treated for 4 days (between day 2 and day 6) with 2 mM butyrate, the cell capacity for sulfide oxidation was significantly increased (p=0.0037) compared with control experiments. The basal oxygen consumption (without NaHS) was similar in control and butyrate-treated cells (data not shown). When the same experiments were performed using 30 mM acetate or 2 mM caprylic acid (a fatty acid that undergoes beta-oxidation in colonic cells), no significant effect of pretreatment with these compounds on the NaHS-stimulated oxygen consumption was measured. When butyrate was added for a shorter period, that is, 24 h, between day 10 and day 11, a similar increase of the capacity for sulfide oxidation was recorded at day 11 with again no effect of acetate and caprylic acid (Fig. 3A). However, the same 24 h exposure to butyrate has no effect when made from day 2 to day 3 and from day 5 to day 6 (data not shown).

Effects of the cell differentiation state and of treatment with butyrate on the maximal respiratory capacity of HT-29 Glc−/+ cells
The maximal respiratory capacity measured in the presence of the uncoupler carbonyl cyanide 4-(trifluoromethoxy) phenylhydrazone (FCCP) was found to increase from day 3 to day 11, averaging 172%±12% of the basal oxygen consumption at day 3, 229%±11% at day 6 (Fig. 3B), and 269%±10% at day 11 (Fig. 3B). Accordingly, a treatment with butyrate 2 mM led to an increase of the uncoupled respiratory rate when cells were treated from day 2 to day 6 and from day 10 to day 11 compared with the untreated cells (Fig. 3B)
Expression of SQR, ETHE1, and TST genes in HT-29 Glc−/+ cells undergoing spontaneous and butyrate-induced differentiation
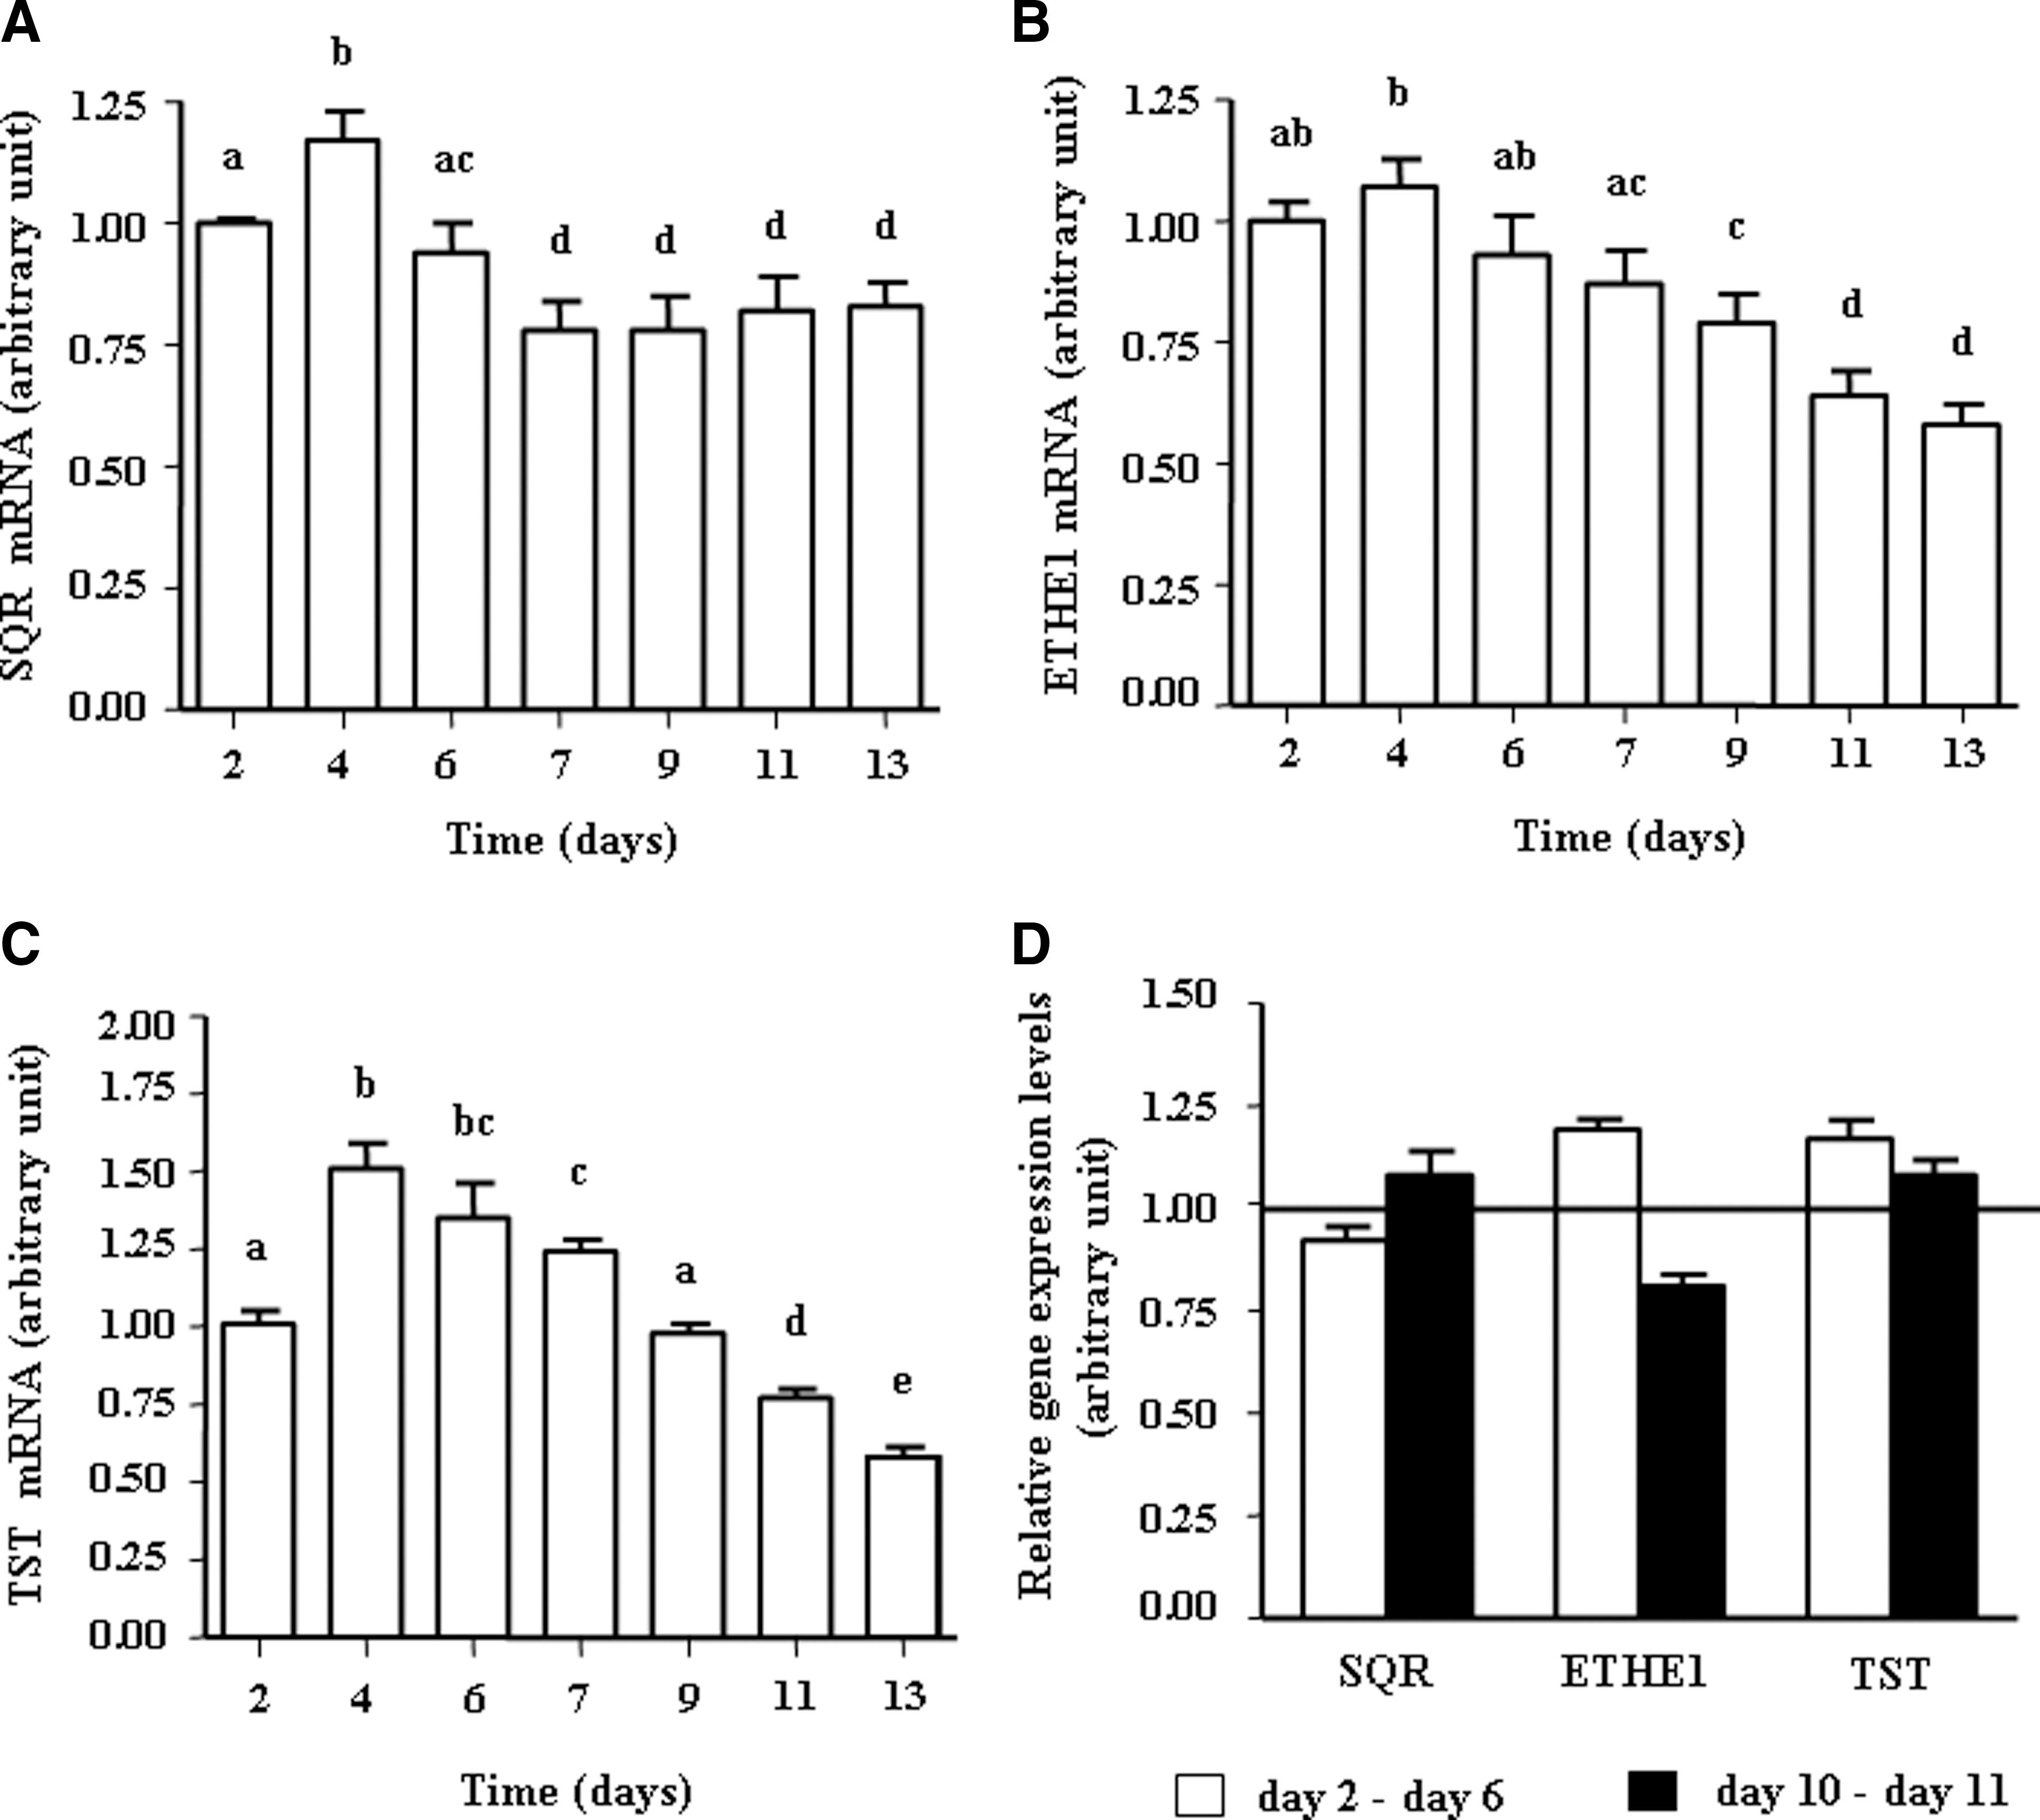
As showed in Figure 4A, B, C, SQR, ETHE1, and TST transcripts were detected in proliferating and differentiated HT-29 cells. ETHE1 and TST expression decreased modestly, but significantly, according to the state of differentiation (Fig. 4B, C). Butyrate treatment did not induce any significant change in the gene expression corresponding to the enzymes of the SOU (Fig.4D).
Capacity of HT-29 Glc−/+ cells to oxidize sulfide in the presence of oligomycin according to their differentiation state
As indicated in Figure 5, the F0/F1 ATPase inhibitor oligomycine was effective in markedly reducing the basal O2 consumption in the mitochondrial respiratory chain. In the presence of both oligomycin and 20 μM NaHS, the oxygen consumption was greatly stimulated in all cases. The increase of O2 consumption presumably mostly attributable to sulfide oxidation in the SOU was similar from day 3 (0.95 nmol/106 cells/min) to day 6 (1.26 nmol/106 cells/min) and increased at day 11 (1.83 nmol/106 cells/min), indicating that SOU activity appears higher in differentiated cells than in highly proliferative cells (see Fig.5).

Expression of the sulfide oxidation unit genes in human large intestine biopsies
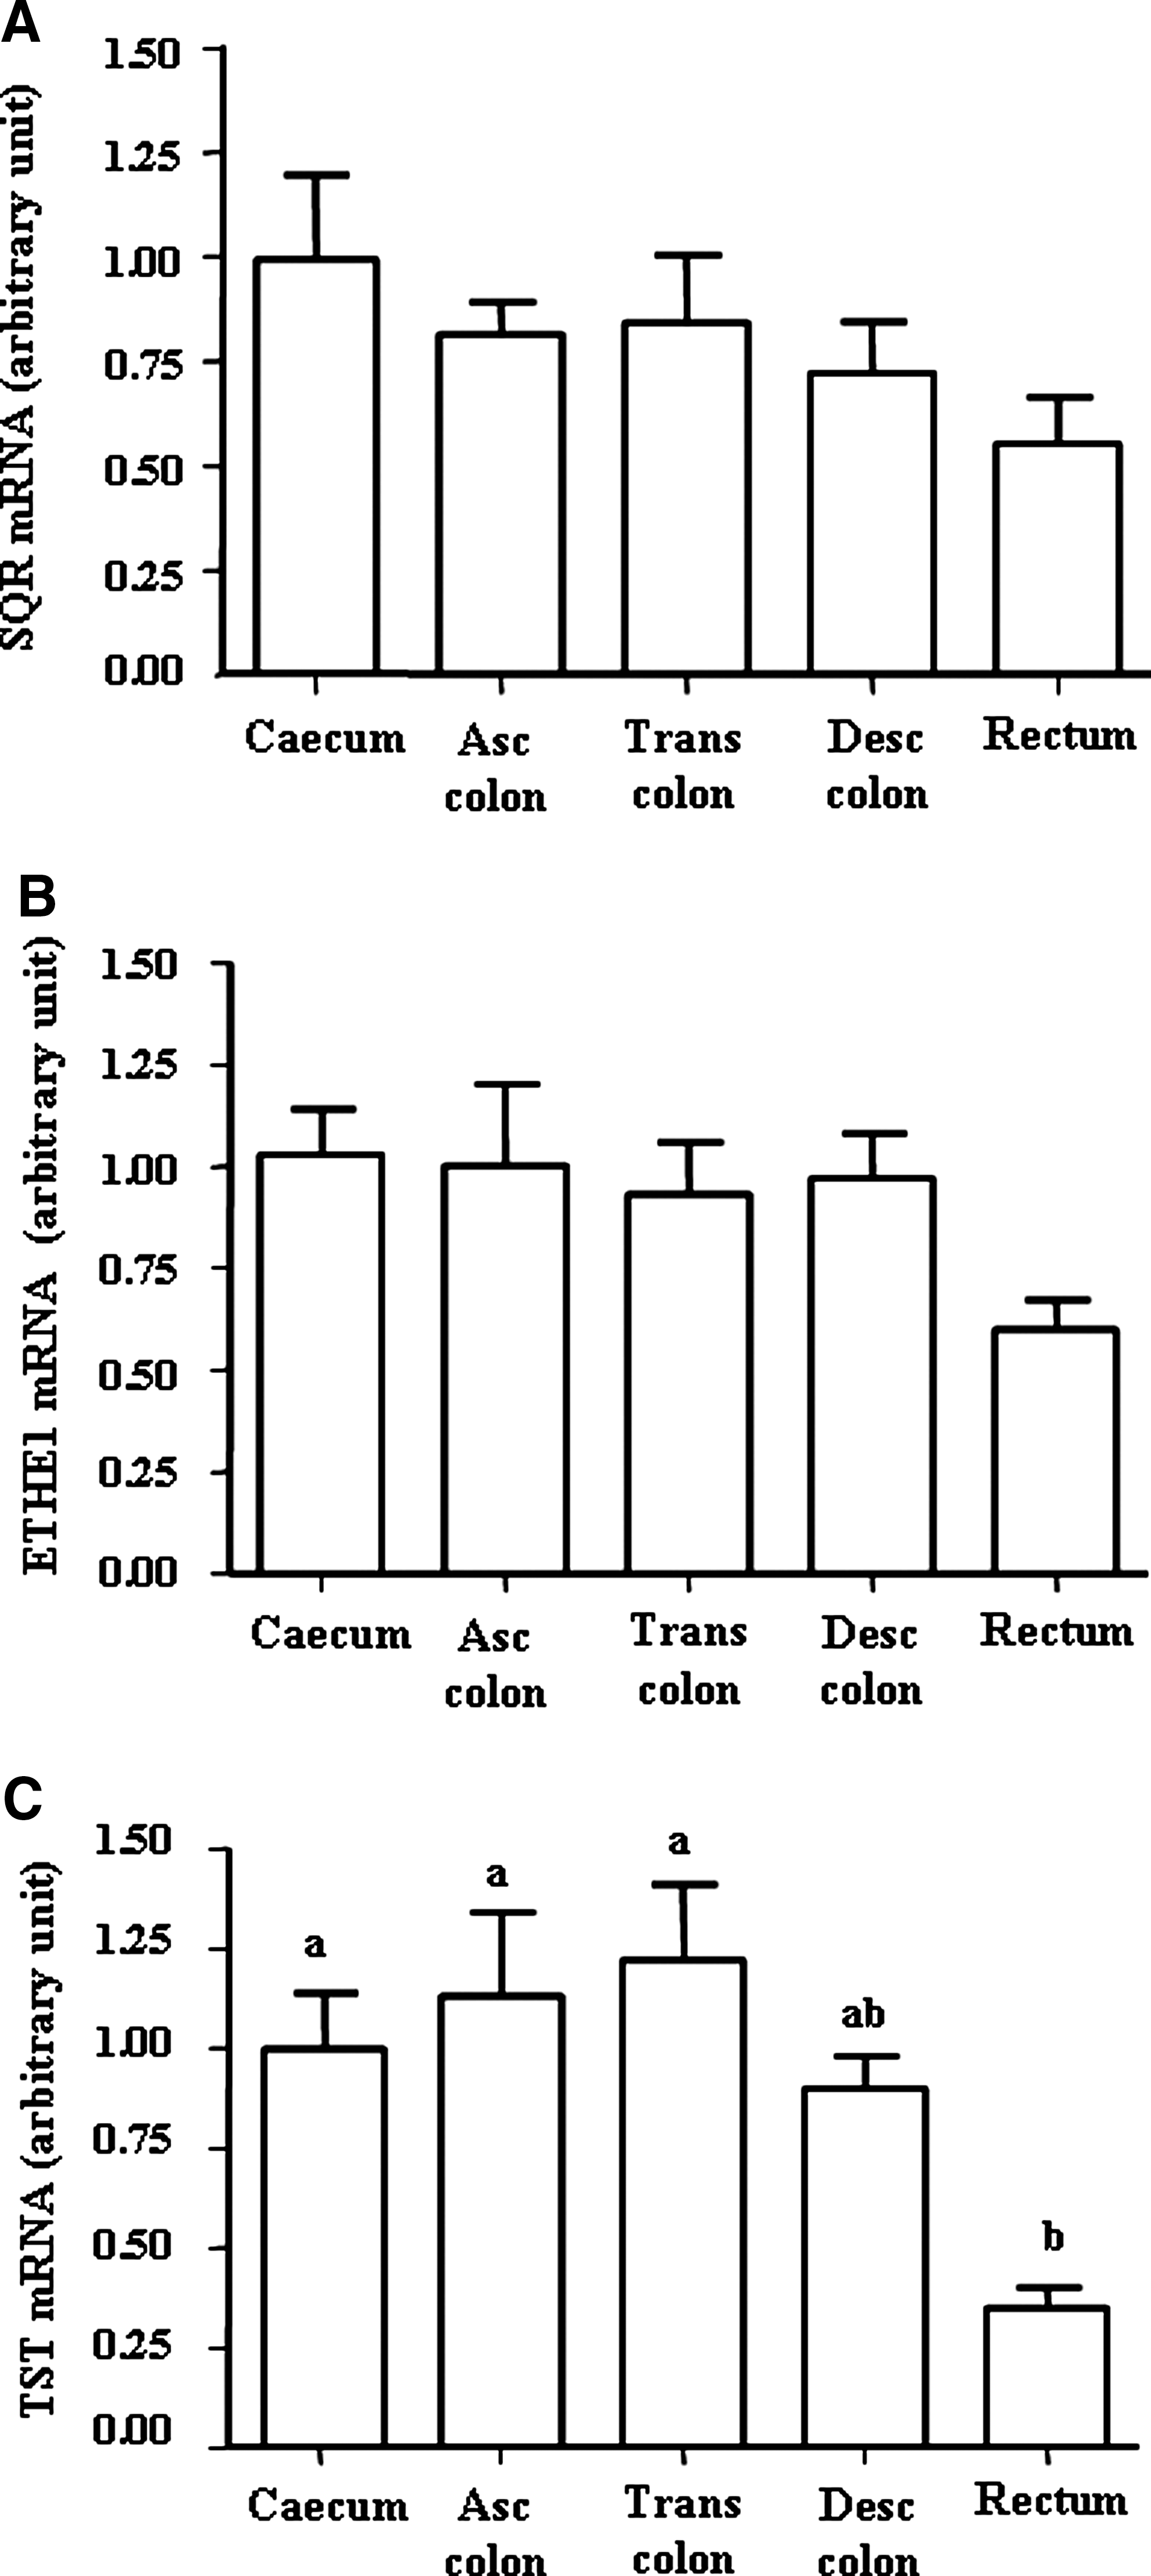
The SQR, ETHE1, and TST genes were found to be expressed in the different anatomical parts of the large intestine (Fig. 6A, B, C). The relative TST expression was found to be significantly lower in the rectal biopsies compared with the other anatomical parts of the large intestine (p=0.01 between rectum and cecum, p=0.016 between rectum and ascending colon, and p=0.007 between rectum and transverse colon; Fig. 6C). ETHE1 and SQR gene expression levels were not significantly different along the different anatomical localization.
Discussion
Our work with the human colonic adenocarcinoma epithelial HT-29 Glc−/+ cells shows that 20 μM NaHS increases O2 consumption. In contrast, NaHS used at 65 μM concentration (and above) was inhibitory toward cell respiration. Fifty micromolar sodium sulfide represents approximately the breaking point between concentrations that stimulate or inhibit O2 consumption. Interestingly, this latter concentration is in the same order of magnitude than the free sulfide concentration measured in human feces that is, 60 μM (18). The measurement of the increase of oxygen consumption after sulfide addition represents the sum of the oxygen consumption by the SOU and by the cytochrome oxidase (Fig. 7). For the same electron transfer rate in the mitochondrial respiratory chain from complex III to complex IV, the entry of electrons in the SOU would consume threefold more oxygen than entry of electrons from complex I or II (21). Thus, it is worth to note that an increase in the cellular overall oxygen consumption can be related to a situation where the sulfide concentration is high enough for partial inhibition of cytochrome oxidase (see Fig. 7).

Our results demonstrate that the inhibiting effect of NaHS pretreatment on the cell respiration is followed by an inability of HT-29 Glc−/+ cells to recover their initial basal rate of oxygen consumption. Although the mechanisms explaining this results remain unclear (and beyond the topic of the present study), they are likely linked to the nature of sulfide binding to the cytochrome c oxidase (23, 30).
Previous data have shown that thiosulfate is the end product of sulfide detoxification in the large intestine mucosa (11, 24) and in the liver (16). This is reflected by the oxygen to sulfide stoichiometry (21). Accordingly, the capacity of HT-29 Glc−/+ to oxidize sulfide was associated with the presence of transcripts corresponding to SQR, ETHE1, and TST genes.
We found that 800 μM ZnCl2, but not the other divalent cations tested, was able to reverse the inhibition of HT-29 Glc−/+ cell oxygen consumption caused by sodium hydrogen sulfide; in accordance with results showing that zinc acetate reduces cecal sulfide level (33). Zinc is absorbed in the 20%–30% range (14, 20) explaining the relatively high zinc concentrations (i.e., 150 μM) measured in the colonic contents (15).
An important result of our study was the higher capacity of differentiated HT-29 Glc−/+ cells to oxidize sulfide compared with undifferentiated cells. This result is compatible with the view that the mature cells from the surface epithelium are more efficient for sulfide oxidation/detoxification than the undifferentiated cells from the crypt compartment characterized by mitosis capacity (25). Since hydrogen sulfide is considered as a genotoxic agent toward colonic epithelial cells (5), capacity of pluripotent stem cells for sulfide disposal may represent an important parameter for avoiding DNA damage (28). However, the concentration of luminal sulfide in close vicinity with these latter cells in vivo is not known and represents an important parameter although difficult to assess from a technical point of view. From our data, it appears that the increase of sulfide oxidation capacity during spontaneous cell differentiation is not caused by increased mRNA expression of the SOU enzymes.
When HT-29 Glc−/+ cells were cultured for day 2 to day 6 in the presence of butyrate, which represents a luminal compound with pro-differentiating effect on HT-29 Glc−/+ cells (22), the cell capacity for sulfide oxidation was again increased compared with control untreated cells. This observation was not specific for the HT-29 Glc−/+ cell line since the same results were obtained with another colonic epithelial cell line, that is, Caco-2 cells (S. Mimoun et al., unpublished data).
This effect was not observed with acetate, a short-chain fatty acid that has no effect on cell proliferation/differentiation (22) and does not undergo beta oxidation in HT-29 cells, suggesting that butyrate acts on the HT-29 Glc−/+ capacity to oxidize sulfide as itself (1). The fact that caprylic acid, which (like butyrate) undergoes beta-oxidation in colo-rectal mucosa (19), has no effect on the capacity of HT-29 Glc−/+ cells to oxidize sulfide reinforces this view.
The amplitude of the stimulation of respiration by sulfide (taking into account that electrons originating from SOU take priority over those coming from complex I) indicates to what extent SOU saturates the electron transfer from complex III to complex IV (21). The more than 2.6-fold stimulation due to sulfide in differentiated cells grown in the presence of butyrate (Fig. 3A) is close to the maximal theoretical value of 3.0-fold while it remains lower in other cases (Fig. 2C). Although oligomycin is as a mean to decrease electron transfer in the respiratory chain, the increase of the flux of electrons from SOU (relative to its activity) gets closer to the saturation of electron transfer in the respiratory chain (see the fold stimulation due to sulfide in Figure 5 in comparison with the fold stimulation in Fig. 2C). These observations allow us to conclude that SOU increased, in functional terms, with differentiation, allowing it to reach the maximal detoxification utility level allowed by mitochondrial oxidation (21).
The maximal rate of electron transfer through the mitochondrial respiratory chain is revealed by the maximal oxygen consumption observed in the presence of the respiratory uncoupler FCCP. However, respiratory coupling restricts the cellular respiration to a rate matching the cellular ATP turnover. The term “respiratory reserve” is used to describe this respiratory capacity that is not used in the basal state but is revealed by uncoupling. In the present study, spontaneous and butyrate-induced HT-29 cell differentiation was concomitant with an increase of the sulfide-induced oxygen consumption as well as an increase of the cell-uncoupled respiratory rate, suggesting that a part of the cell respiratory reserve was somehow mobilized to increase the cellular sulfide oxidation capacity in differentiated cells, while it has no influence on the basal respiratory rate because of respiratory coupling.
In connection with this latter point, the use of oligomycine revealed that the mitochondria of spontaneously differentiated HT-29 cells are markedly less coupled than mitochondria from more proliferative cells (Fig. 5).
Overall, these results are compatible with the view that through a coordinate sequence of events, differentiated HT-29 cells acquire an increased capacity to oxidize sulfide. This includes increased sulfide oxidation in SOU and increased rate of electron transfer in the redox pathway from SQR to cytochrome c oxidase. Decreased bioenergetics performance appears to represent the price to be paid for maximizing sulfide detoxification rate. This indicates that sulfide [although able to generate ATP through its oxidation (21)] is not primarily oxidized to increase the cellular level of ATP above a steady-state value, but rather to allow its detoxification. In other words, detoxification of H2S can be considered as a priority over the maximal efficiency of its use as an ATP-generating substrate.
Lastly, the analysis of the expression of the genes corresponding to the SOU enzymes in human biopsies revealed that the genes corresponding to the SOU enzymes are expressed in all anatomical regions of the large intestine. TST gene expression was significantly decreased in the rectum compared with proximal parts of the human large intestine. The functional consequences of this low expression of TST in the rectum mucosa remain to be determined.
From the data obtained in this study, it appears that the differentiation state of colonocytes, the anatomical regions of the large intestine, and the concentration of sulfide-binding component in the luminal content are likely important parameters in determining the consequences of increased luminal sulfide concentrations on the large intestine epithelium.
Materials and Methods
Chemicals
Reagents for cell treatments were from Sigma-Aldrich (St Louis, MO). Reagents for quantitative polymerase chain reaction (qPCR) were from Invitrogen (Cergy Pontoise, France) and primers from Eurogentec (Seraing, Belgium).
Human colonic biopsies
Colonic biopsies were obtained at the time of routine colonoscopic examination from 12 individuals (5 males, 7 females) examined at Avicenne Hospital (Assistance Publique-Hôpitaux de Paris, Bobigny, France). Subjects ranged in age from 26 to 78 years (median age 57 years). They were characterized by normal colonic tissue and were free of polyps, colon cancer, and other colonic lesions at the time of examination. Furthermore, they had no known family history of colon cancer. Informed consent was obtained for all subjects participating in these studies. For each individual, two biopsies were taken from each anatomical parts of colon. One biopsy was immediately snap-frozen on dry ice in TRIzol® reagent (Invitrogen, Carlsbad, CA) (∼1 ml per 50–100 mg of tissue) and stored at −80°C until RNA extraction. The other biopsy was used for histological examination. Only normal biopsies confirmed by the histological analysis were included in our study.
Cell culture
The HT-29 Glc−/+ used in this study were selected by Zweibaum et al. (37) from the parental line. Cells between passages 37 and 74 (one passage every week) were grown in a Dulbecco's modified Eagle's medium containing 4 mM L-glutamine and supplemented with 10% (v/v) heat-inactivated fetal calf serum. The culture medium was changed every day. Cells were seeded at a density of 2×10⁴ cells/cm2 and isolated using phosphate buffered saline containing 0.5 g/L trypsin and 0.2 g/L ethylenediaminetetraacetic acid.
Oxygen cell consumption
Oxygen consumption was measured by polarography (oxygraph Hansatech Inst. Norfolk, United Kingdom) at 37°C using a Clark-type electrode (2). Cells were isolated (∼5.106 cells) and resuspended in 1.5 ml air-saturated incubation mixture (20 mM HEPES buffer containing 200 mM mannitol, 5 mM KH2PO4, 2.5 mM MgCl2, and 0.5 mM EGTA; pH 7.4 enriched with 0.1% of serum albumin bovine). After stabilization of the basal respiratory rate, that is, in the absence of any exogenous agent, NaHS was added as a single bolus at different concentrations. After NaHS addition in the incubation medium, and according to the dose of sodium sulfide used, the respiratory rate went back to a value close to the basal value or below this basal value (i.e., at a time point when all the added NaHS was metabolized by HT-29 Glc−/+ cells). This allowed to calculate the partial reversion rate of the effect of NaHS on O2 consumption (23) as a percentage of the basal HT-29 Glc−/+ oxygen consumption. The calculation of oxygen consumption rate due to solely NaHS addition (Δ JO2) was made using the difference between the oxygen consumption rate in the presence of sulfide and the basal rate. Uncoupled respiration rate was measured after addition of the proton ionophore FCCP (1.5 μg/ml).
Cell treatments
HT-29 Glc−/+ cells were incubated without or with butyrate used as a pro-differentiating agent or with acetate or caprylic acid. Then, cells were isolated and used immediately for oxygen consumption measurement in the presence of 20 μM NaHS concentration and/or in the presence of FCCP.
Dipeptidyl peptidase IV activity
DPPIV activity was measured using the method of Nagatsu (29) in sonicated cells. Briefly, activity was determined spectrophotometrically at 405 nm using Gly-Pro-pNA as substrate. The protein contents of cells were determined by the method of Lowry et al. (26) using the Biorad kit.
Gene expression analysis
The expression levels of SQR, ETHE1, and TST genes were analyzed by Real-time PCR. Total RNAs were extracted from HT-29 Glc−/+ cells, and from colonic biopsies by TRIzol® reagent according to the manufacturer's instructions (Invitrogen). Cells were lysed and homogenized directly in culture flask. Biopsies were homogenized using a Tissue Lyser (Qiagen, Courtaboeuf, France). RNA concentrations were determined by absorption measurement at 260 nm using a Nanodrop spectrophotometer (Labtek, Paris, France) and the RNA quality was checked by loading aliquotes onto 1% agarose gel. For Real-time PCR analysis, 400 ng of total RNA was first reverse transcribed using the high-capacity cDNA reverse transcription kit (Applied Biosystems, Foster City, CA). Reverse-transcribed RNA were amplified on a 7300 real-time PCR system (Applied Biosystems) using the SYBR green fluorescence (PE Applied System) method and specific oligonucleotides designed with Primer Express software. The primers used were as follows: 18S forward, 5′- ACGGAAGGGCACCACCAGGAG−3′ and reverse, 5′-GCACCACCACCCACGGAAACG-3′; ACTB forward, 5′-TCAGGAGGAGCAATGATC TTGA-3′ and reverse, 5′-GACAGGATGCAGAAGGAGATCAC-3′; SQRDL forward, 5′-AGCGCCTT TCCATG T ATCTCA-3′ and reverse, 5′-TCCCCAGTAACCCCTTAGCA-3′; ETHE1 forward, 5′-GGCTGCTCTATGCTGTGAATACC-3′ and reverse, 5′- AGCCCC GAGCCTGTAATGT-3′; TST forward, 5′- TGCTGGAGAACCTTGAATCTAAGA-3’ and reverse, 5′- G CC CGAGTCCAGTCCTACTG-3′. BLASTN searches were conducted against GenBank to check the total gene specificity of the nucleotide sequences chosen for the primers. The identity of the PCR products was confirmed by melting temperatures and dissociation curves. cDNA of all genes were amplified with same efficiency of PCR (>98%) calculated from the slopes of the standard curves. Thermal cycling conditions comprised an initial denaturation step at 95°C for 10 min and 40 amplification cycles at 95°C for 15 s and 60°C for 1 min. The cycle threshold (CT) for each sample was determined at a constant fluorescence threshold line. Obtained values for cells and colonic biopsies were normalized against those for 18S and β-actin, respectively, these latter remaining almost constant in all samples. Relative gene expression levels were calculated using the 2−ΔΔCt formula, where ΔCt value was determined as the difference between the Ct value for each gene tested and Ct value for reference gene. ΔΔCt was calculated as the difference of ΔCt between sample and control groups.
Data analysis
The results are expressed as mean values (±SEM). Statistical analysis was performed using the mixed models for repeated-measure analysis (version 9.1; SAS Institute, Cary, NC) with the Student t-test, one-way or two-way analysis of variance, and Tukey-Kramer multiple-comparisons post hoc tests when appropriate. Differences with p-values<0.05 were considered as statistically significant.
Footnotes
Acknowledgments
The authors thank the medical staff of the Gastroenterology Department at Avicenne Hospital for their assistance in obtaining the biopsy samples. The financial support of NYCOMED France is gratefully acknowledged.
Author Disclosure Statement
No competing financial interest exists.