
Abstract
Introduction
Innovation
N-myc downstream regulated gene-1 (NDRG1) inhibits cancer progression and is a promising therapeutic target. However, the molecular mechanisms of its antitumor activity remain unknown. We identify crucial links between NDRG1 and three key signaling pathways (transforming growth factor-β [TGF-β], phosphatidylinositol 3-kinase [PI3K], and Ras) that control cancer progression, and two tumor suppressors (phosphatase and tensin homolog deleted on chromosome 10 [PTEN] and mothers against decapentaplegic homolog-4 [SMAD4]). These findings provide a novel insight into NDRG1 function and identify NDRG1 as a promising target for chelators that upregulate it.
NDRG1 has been negatively correlated with metastasis in a number of neoplasms, including PCa (2, 3, 13, 28, 36). NDRG1 upregulation in PCa leads to a significant reduction in primary tumor growth, angiogenesis, and metastasis (36). Moreover, NDRG1 is positively correlated with an increased differentiation of PCa (1), as well as pathological stage, histological grading, and reduced invasion (36). However, the complex molecular pathways affected by NDRG1 are unclear and require further elucidation. Such investigations are essential for understanding the potential of NDRG1 as a molecular target for PCa treatment. This is crucial considering that iron chelators (e.g., di-2-pyridylketone 4,4-dimethyl-3-thiosemicarbazone [Dp44mT]) with marked and selective antitumor activity upregulate NDRG1 in vitro and in vivo in many tumor types, including PCa (27, 33, 47). Hence, NDRG1 is one of a number of important molecular targets (e.g., cyclin D1, p21 etc.) that are modulated in response to chelators (50).
This investigation examines the molecular targets of NDRG1 and identifies the Zn-finger transcription factor GLI-similar-3 (GLIS3) and the ubiquitin E3 ligase, neural precursor cell expressed developmentally downregulated 4-like (NEDD4L) (15, 26). Significantly, NEDD4L regulates the transforming growth factor-β (TGF-β) pathway that controls proliferation (15). Considering this, we demonstrated that NDRG1 modulates the TGF-β pathway, promoting the expression of two tumor suppressors, phosphatase and tensin homolog deleted on chromosome 10 (PTEN) and mothers against decapentaplegic homolog-4 (SMAD4), in different PCa cell lines. Moreover, we identified that NDRG1 inhibits the oncogenic Ras and phosphatidylinositol 3-kinase (PI3K) pathways. The present studies are important for understanding the function of NDRG1 that is upregulated upon iron depletion using chelators (27, 33, 47).
Results
NDRG1 is upregulated after iron depletion
NDRG1 expression is induced by cellular iron depletion (12, 33, 47). This effect is partly mediated through hypoxia-inducible factor-1α (33). We examined the iron chelators, desferrioxamine (DFO; 250 μM) and Dp44mT (10 μM) (47), on NDRG1 expression in MIAPaCa-2, PANC-1, and CFPAC-1 PCa cells. A higher concentration of DFO than Dp44mT was used because of the limited permeability and lower chelation efficacy of DFO (33). After a 24 h/37°C incubation with the chelators, NDRG1 was significantly (p<0.01–0.001) upregulated in three PCa cell lines (Fig. 1A). This is important considering the potent and selective activity of Dp44mT (27, 47) and that NDRG1 upregulation correlates to its antitumor activity against PANC-1 xenografts (Fig. 1B).
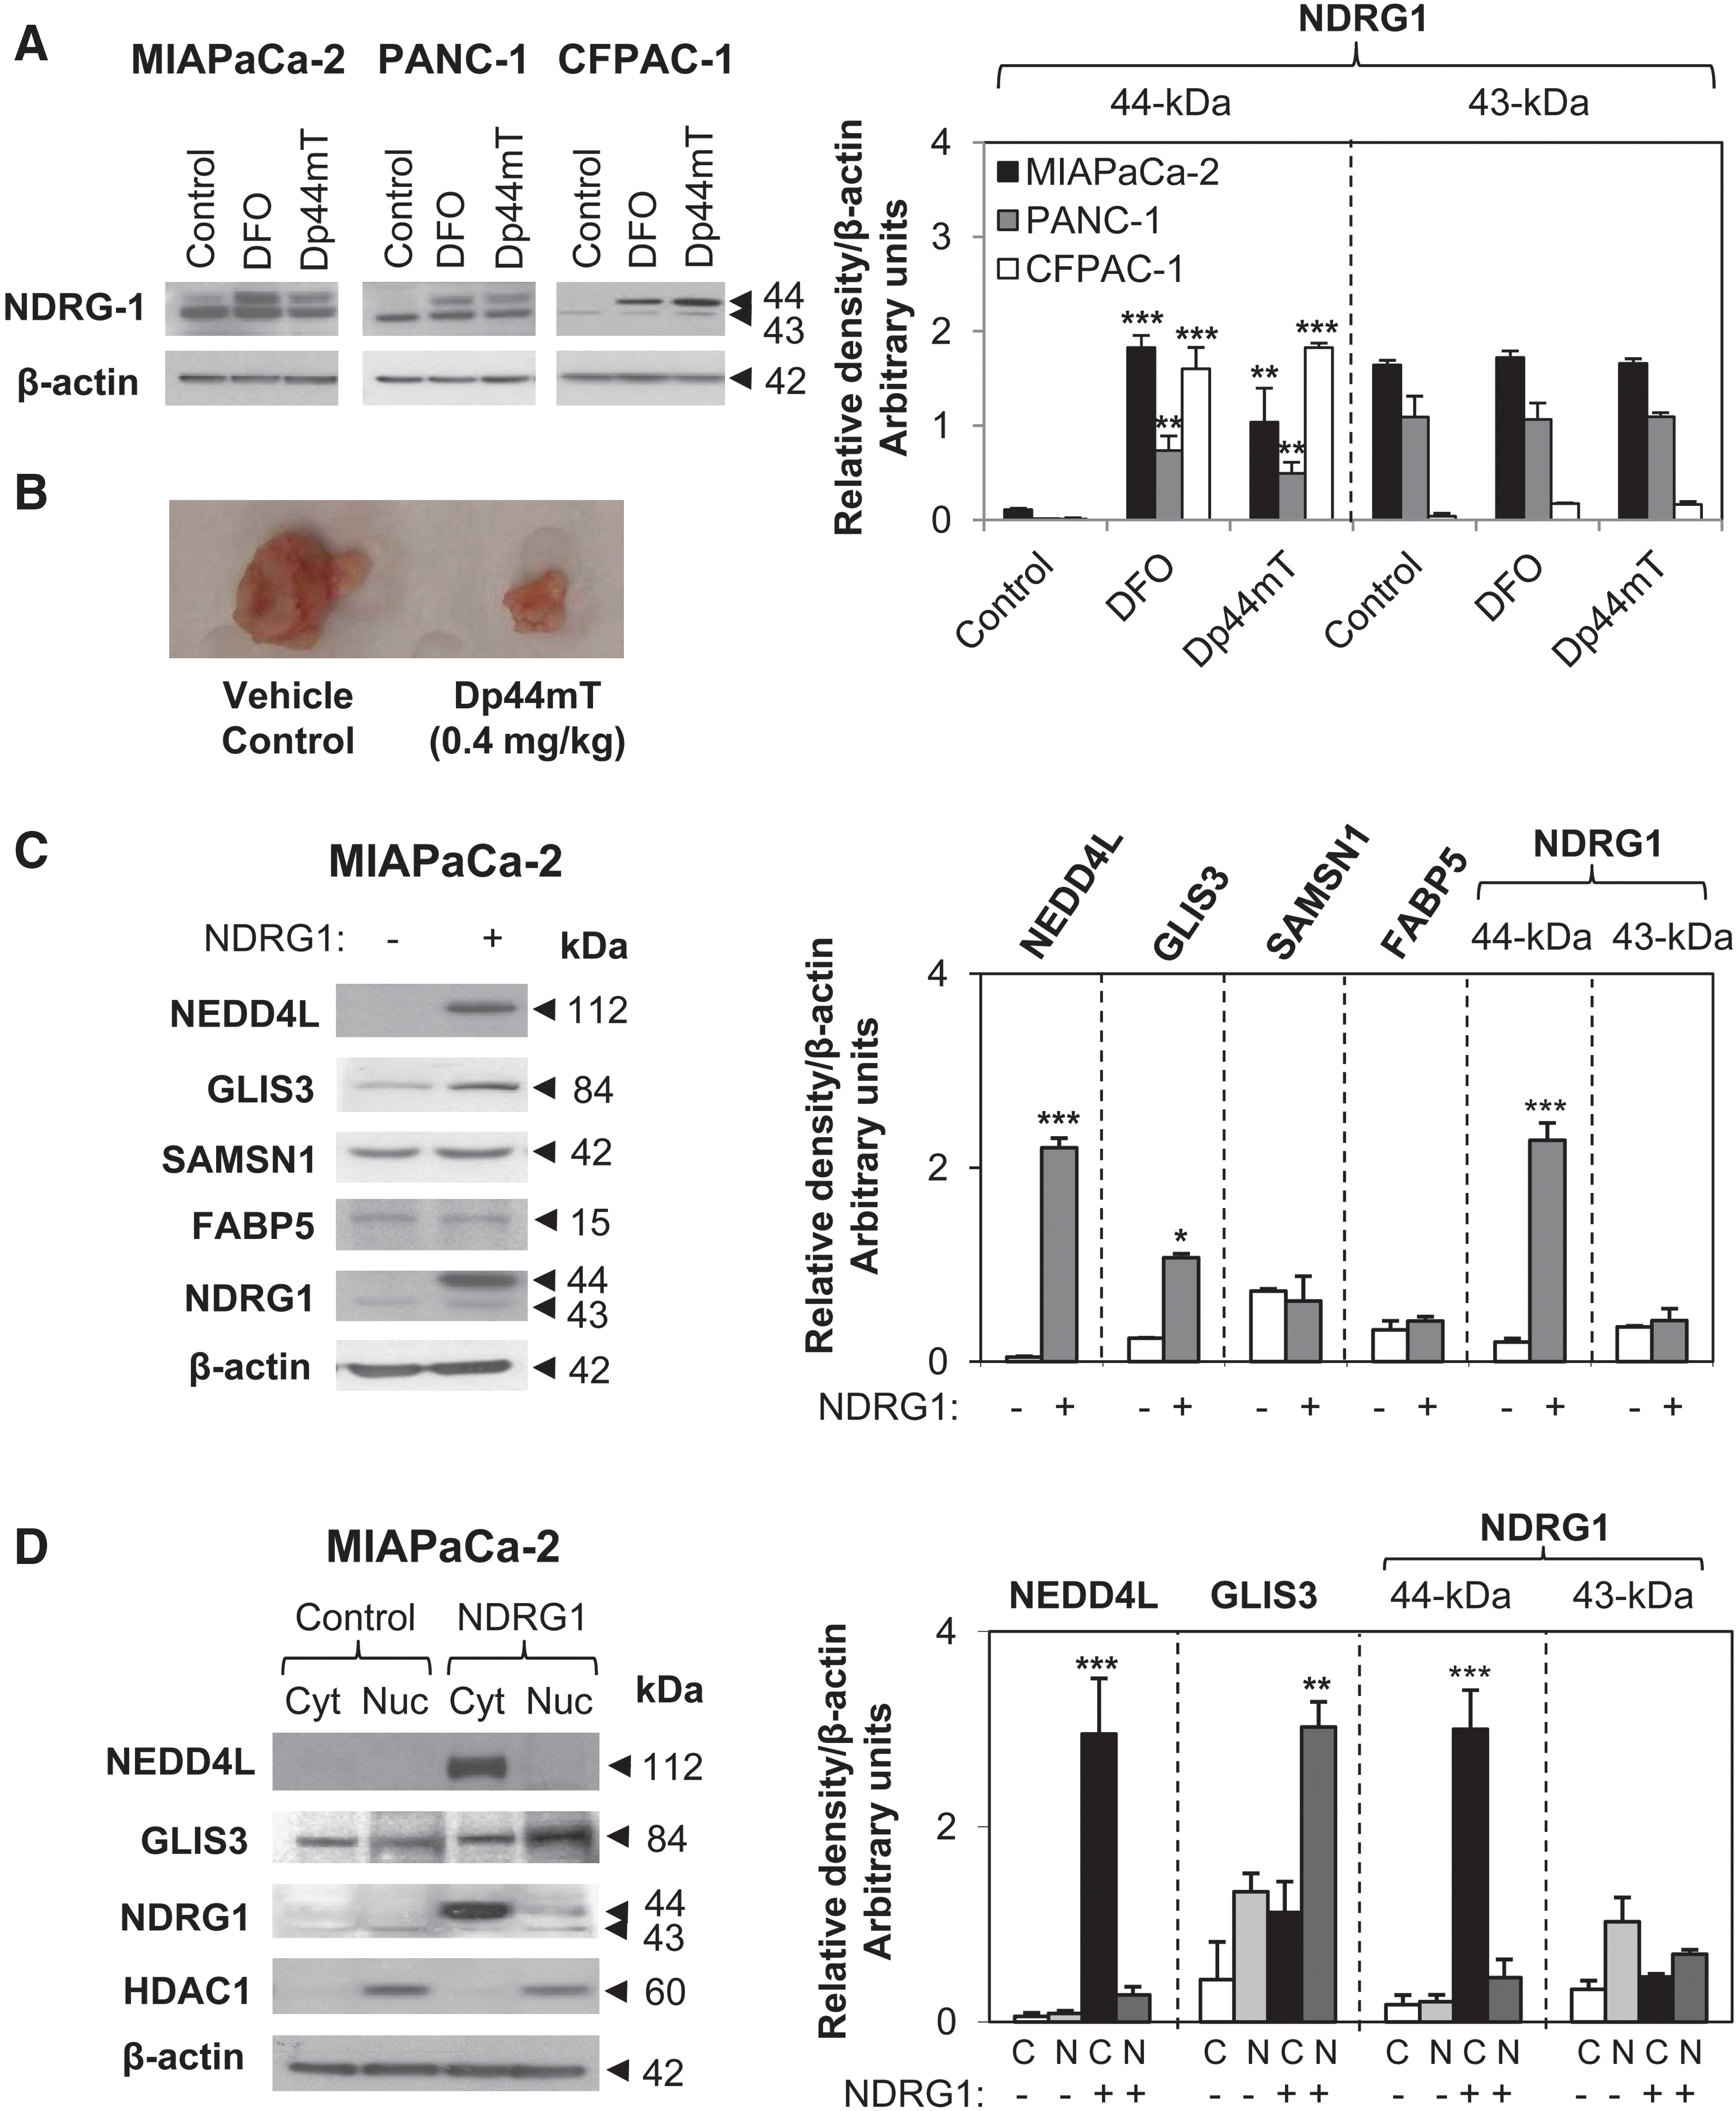
As previously found (27), two NDRG1 bands at 43- and 44-kDa were detected and may correspond to its different phosphorylation states (39). Notably, the 44-kDa band was markedly upregulated by chelators relative to the control, while no significant effect was observed on the 43-kDa band. Indeed, we recently demonstrated that iron chelators upregulate phosphorylated NDRG1 (27), but we do not definitively know whether this totally accounts for the 44 kDa band. We next examined NDRG1 targets to understand its function.
Gene groups modulated by NDRG1
MIAPaCa-2 cells stably transfected to overexpress NDRG1 were analyzed using whole genome microarray to examine its molecular targets. Of the 145 statistically significant genes modulated by NDRG1, a substantial number were involved in apoptosis, regulation of transcription, nucleotide binding, the immune response, and so on (Supplementary Fig. S1; Supplementary Data are available online at
The 30 genes with greatest differential expression (including 9 downregulated and 21 upregulated genes; i.e., log2 ratio >1.75 or <−1.75) and that were statistically significant (p<0.05; Table 1) were verified using reverse transcriptase (RT)–polymerase chain reaction (PCR) in three different MIAPaCa-2 cell lysates, with 29 of these confirming the microarray (Supplementary Fig. S2). For further validation, we selected genes with the highest fold change that were then examined by western analysis. These included NEDD4L, GLIS3, SAMSN1, and FABP5. Both NEDD4L and GLIS3 were significantly (p<0.05–0.001) upregulated by NDRG1 in MIAPaCa-2 cells at the mRNA (Supplementary Fig. S2) and protein levels (Fig. 1C), while SAMSN1 and FABP5 expression were not markedly affected at the protein level (Fig. 1C). Moreover, NEDD4L was significantly (p<0.001) upregulated in the cytoplasm, while GLIS3 was significantly (p<0.01) upregulated in the nuclear fraction by NDRG1 overexpression (Fig. 1D). As a positive control for the nuclear fraction, we examined histone deacetylase 1 expression (HDAC1; Fig. 1D), which was localized in the nucleus (45). Notably, NDRG1 was primarily localized in the cytoplasm, as previously described (31).
GLIS3, GLI-similar-3; NDRG1, N-myc downstream regulated gene-1; NEDD4L, neural precursor cell expressed developmentally downregulated 4-like.
Although GLIS3 plays a developmental role in pancreatic β-cells (26), there is limited information regarding its function. However, NEDD4L modulates the TGF-β signaling pathway, an important regulator of proliferation (15, 37). We, therefore, focused on the role of the better-characterized NEDD4L to further examine the downstream effects of its upregulation in response to NDRG1 in PCa and the TGF-β pathway.
NDRG1 increases SMAD4
The classic TGF-β1 response involves the tumor-suppressive SMAD-dependent pathway (37). However, TGF-β does not activate SMAD-dependent signaling in MIAPaCa-2 cells (40, 46). To assess this, we examined pSMAD2 (S465/467), SMAD2, pSMAD3 (S423/425), and SMAD4 protein levels in MIAPaCa-2 cells after TGF-β1 (10 ng/ml) or TGF-β1 (10 ng/ml) combined with anti-TGF-β1 blocking antibody (αTGF-β1; 10 μg/ml) for 36 h/37°C (Fig. 2A). In agreement with earlier reports (40, 46), we observed no evidence of SMAD-dependent signaling in MIAPaCa-2 control cells with no alteration of pSMAD2 or pSMAD3 after TGF-β1 treatment (Fig. 2A). This may reflect the low levels of TGF-β receptors (TGFβRI and TGFβRII) (37) in MIAPaCa-2 cells, which were significantly (p<0.001) lower than in TGF-β-sensitive PANC-1 cells (44) (Supplementary Fig. S3). Moreover, TGF-β receptor expression was not modulated by NDRG1 in MIAPaCa-2 cells (Supplementary Fig. S3).
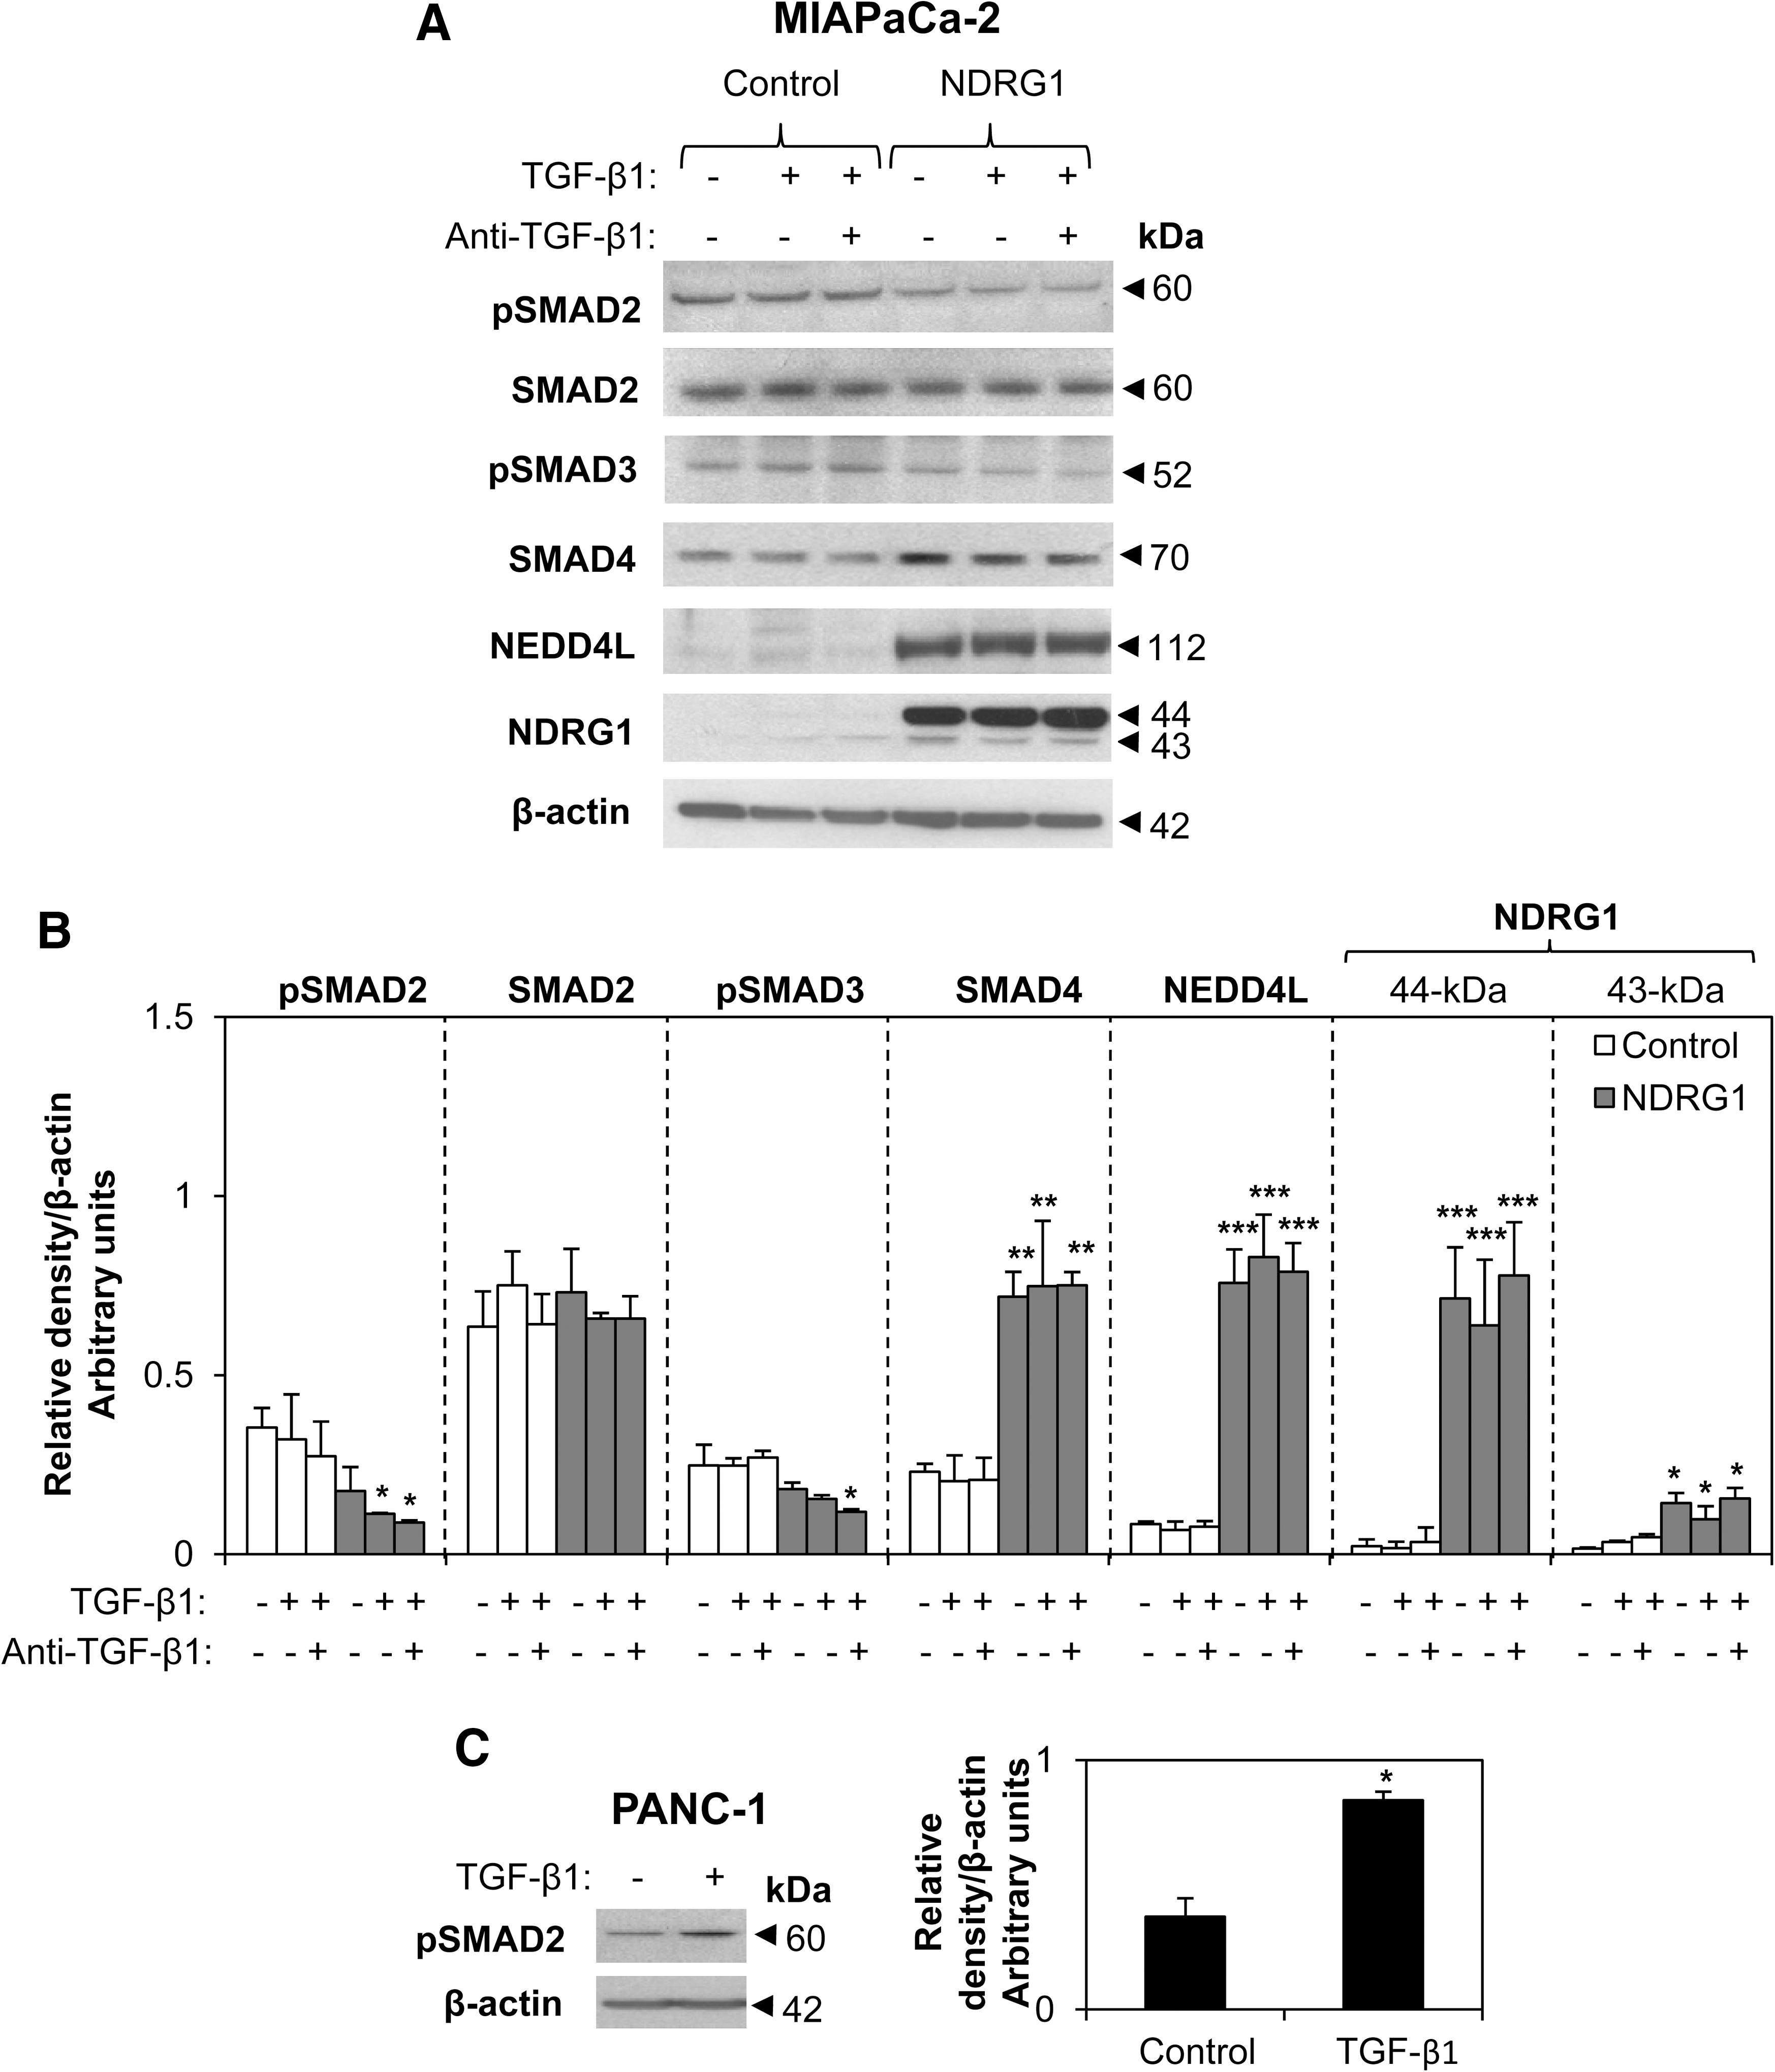
Examining MIAPaCa-2 cells transfected with NDRG1 and comparing them with empty vector-transfected control cells, we observed no difference in SMAD2 expression, while pSMAD2 and pSMAD3 were slightly reduced in NDRG1-transfected cells, although this was not significant (p>0.05) under all conditions (Fig. 2A, B). The slight reduction in pSMAD2 and pSMAD3 may be due to increased NEDD4L expression, as it degrades phosphorylated SMADs (15). On the other hand, SMAD4 levels were significantly (p<0.01) increased by NDRG1 in MIAPaCa-2 cells, and this was independent of TGF-β1 treatment (Fig. 2A, B). Moreover, NEDD4L levels were also significantly (p<0.001) increased by NDRG1 in the MIAPaCa-2 cells, as demonstrated earlier (Fig. 1C, D), and TGF-β1 treatment had no effect on NEDD4L expression (Fig. 2A).
Collectively, MIAPaCa-2 cells do not respond to TGF-β1 at the physiological dose of 10 ng/ml (16). As a positive control, this TGF-β1 dose significantly (p<0.05) upregulated pSMAD2 and pSMAD3 in PANC-1 cells (Fig. 2C; and Supplementary Fig. S4) that are sensitive to TGF-β1 (44). The stable overexpression of NDRG1 slightly reduced the levels of pSMAD2 and significantly (p<0.05) reduced pSMAD3 in response to TGF-β1 treatment in PANC-1 cells (Supplementary Fig. S4), and this may be related to its ability to increase NEDD4L expression in these cells (Fig. 4B).
NDRG1 increases PTEN
Since TGF-β1 did not activate SMAD-dependent signaling in MIAPaCa-2 cells (Fig. 2A), further studies analyzed oncogenic SMAD-independent pathways that could be activated by TGF-β1 (8, 10, 11). This was important, as SMAD4 is a negative regulator of oncogenic TGF-β1 pathways (34), and its upregulation by NDRG1 (Fig. 2A) may affect TGF-β signaling.
A downstream target of oncogenic SMAD-independent TGF-β pathways in PCa is the tumor suppressor, PTEN, which is often downregulated in response to TGF-β1 (8, 10, 11, 49). We examined PTEN expression in MIAPaCa-2 cells in response to TGF-β1 and NDRG1 and found no marked difference in PTEN mRNA levels (Fig. 3A). Similarly, TGF-β1 did not significantly affect PTEN protein in whole cell lysates (Fig. 3B), which may reflect the low sensitivity of these cells to TGF-β1, as indicated by low levels of TGFβRI and II in MIAPaCa-2 cells (Supplementary Fig. S3). However, NDRG1 significantly (p<0.01–0.001) increased PTEN protein, and this was independent of TGF-β1 (Fig. 3B).

An examination of cytoplasmic and nuclear fractions revealed that TGF-β1 did not modulate PTEN in the cytoplasm, while NDRG1 markedly increased cytoplasmic PTEN (Fig. 3C). However, in the nuclear fraction, TGF-β1 significantly (p<0.05) reduced PTEN in control cells, while NDRG1 significantly (p<0.01) increased PTEN, regardless of TGF-β1 (Fig. 3D). Hence, under control conditions, MIAPaCa-2 cells are sensitive to TGF-β1, where this ligand potentially activates oncogenic SMAD-independent pathways that lead to nuclear PTEN suppression (Fig. 3D). However, NDRG1 abrogates this effect, leading to significantly (p<0.01) increased PTEN in the cytoplasm (Fig. 3C) and the nucleus (Fig. 3D), and this could be mediated by the increase in SMAD4, which is a negative regulator of oncogenic TGF-β1 pathways (34).
NDRG1 increases PTEN, SMAD4, and NEDD4L
To further assess the effect of NDRG1 on PTEN, SMAD4, and NEDD4L, we examined other PCa cells, including CFPAC-1 and PANC-1. CFPAC-1 cells have higher endogenous NDRG1 compared with MIAPaCa-2 and PANC-1 cells (Fig. 4A–C). Considering this, NDRG1 was reduced in CFPAC-1 cells using NDRG1 shRNA. We observed a significant (p<0.01) reduction of the NDRG1 protein in CFPAC-1 cells incubated with NDRG1 shRNAs (shNDRG1 1/2 and shNDRG1 3/4) when compared with the scrambled control shRNA (shControl; Fig. 4A). The 44-kDa NDRG1 band was reduced by 95%, while the 43-kDa band was reduced by 30% in response to shRNA (Fig. 4A). Significantly, the top band is crucial for the antitumor function of NDRG1 in PCa (38). Moreover, PTEN and NEDD4L expression were also significantly (p<0.01) reduced in NDRG1 shRNA-treated samples with both shRNA constructs (Fig. 4A), while SMAD4 was not detected in these cells.
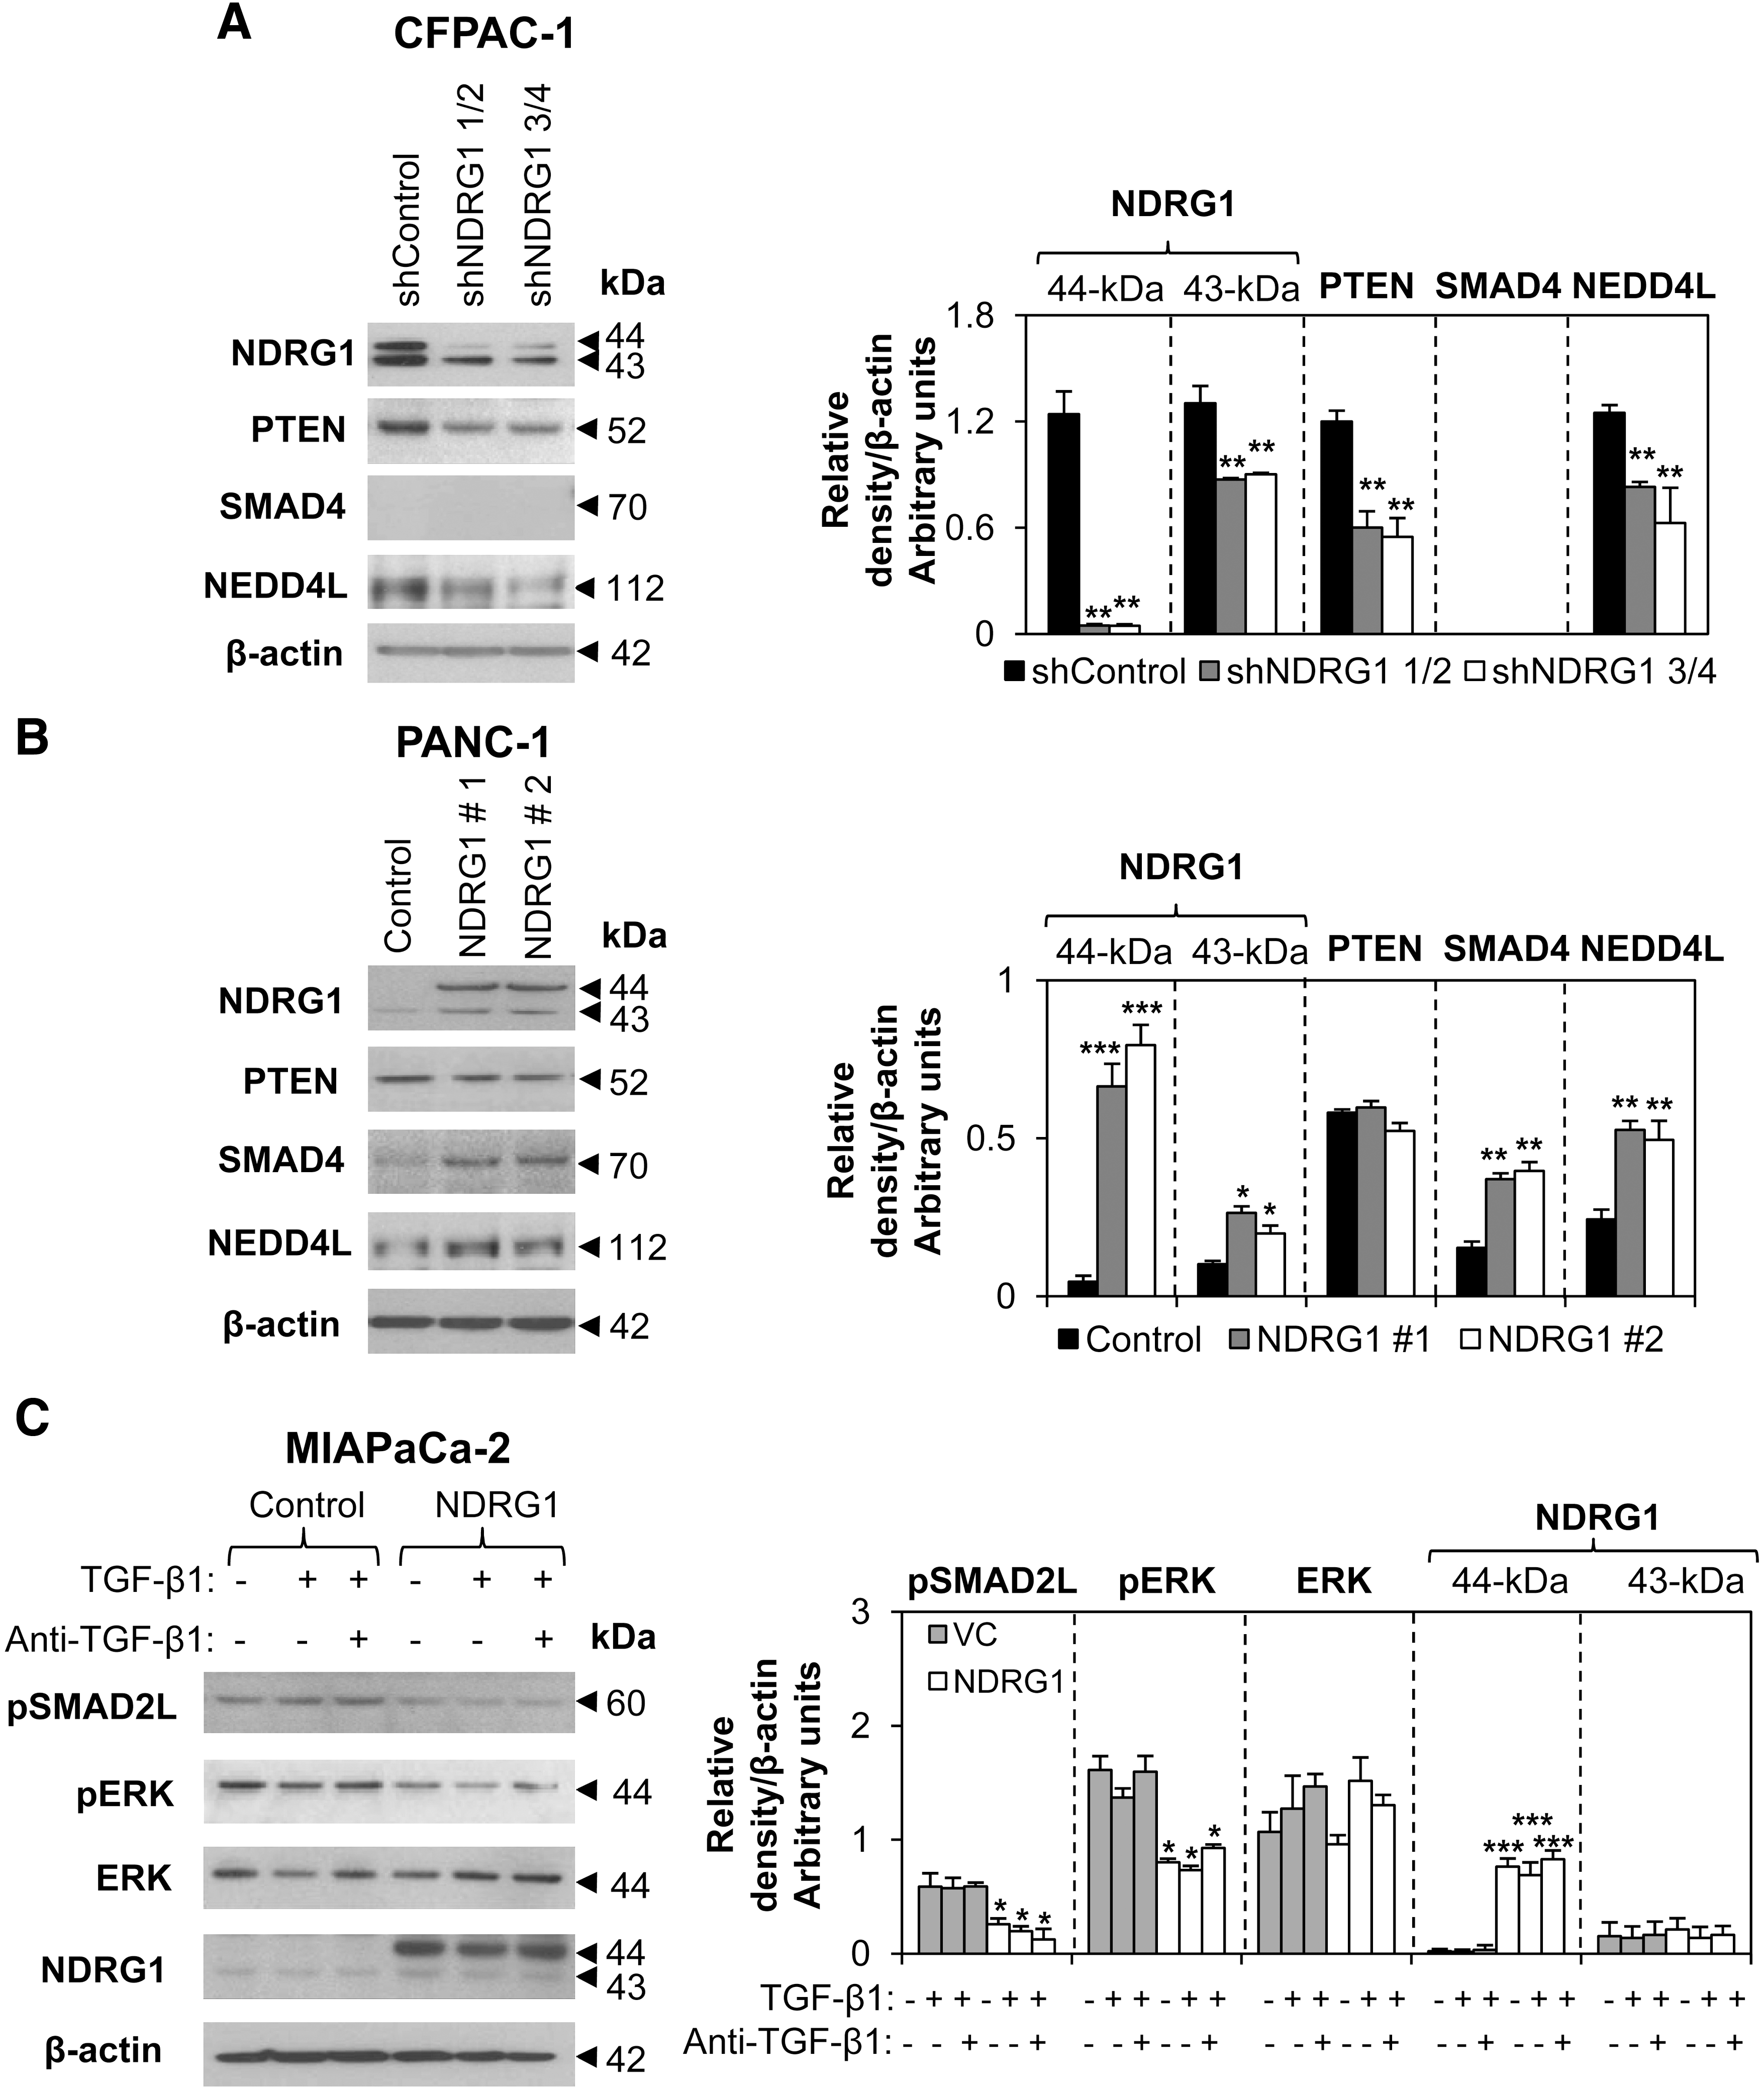
Furthermore, PANC-1 cells, which express low endogenous NDRG1 (Fig. 4B), were stably transfected to overexpress this protein. We found that SMAD4 and NEDD4L levels were significantly (p<0.01) increased in two colonies of PANC-1 cells transfected with NDRG1 (#1 and #2) when compared with empty vector-transfected control cells, while PTEN expression was not affected (Fig. 4B). Hence, NDRG1 promotes NEDD4L expression in all three PCa cell lines and increases PTEN and SMAD4 levels in CFPAC-1 and PANC-1 cells, respectively.
We also examined whether DFO and Dp44mT, which markedly upregulate NDRG1 (Fig. 1A), were also able to modulate the NDRG1 target genes, PTEN, SMAD4, and NEDD4L. Although NDRG1 levels were markedly upregulated by these agents in MIAPaCa-2, PANC-1, and CFPAC-1 cells (Fig. 1A), there were no significant effects on PTEN, SMAD4, or NEDD4L (Supplementary Fig. S5).
NDRG1 inhibits expression of downstream Ras molecules, namely pERK and pSMAD2L
Considering the effect of NDRG1 on increasing SMAD4 expression in two PCa cell lines, we further examined the downstream implications of this. SMAD4 inhibits Ras signaling in PCa (9, 34), and constitutively activated Ras (32) contributes to PCa progression and is a mediator of PTEN suppression (11). Moreover, Ras antagonizes SMAD-dependent TGF-β signaling by leading to the phosphorylation of SMAD2 at S245/250/255 (pSMAD2L) via pERK, inhibiting its nuclear translocation (11, 30).
The ability of NDRG1 to upregulate PTEN and SMAD4 in PCa cells suggests that the Ras pathway is inhibited by NDRG1, and this was further investigated. We initially analyzed the effect of NDRG1 on pSMAD2L in MIAPaCa-2 cells. Notably, MIAPaCa-2 control cells had relatively high pSMAD2L levels (Fig. 4C), suggesting that the Ras pathway was active. However, on NDRG1 overexpression, pSMAD2L was significantly reduced (p<0.05) regardless of TGF-β1 treatment (Fig. 4C). We also examined pERK expression, a key mediator of the Ras pathway (11). This was important, as pERK can phosphorylate pSMAD2L (30). We found that TGF-β did not markedly modulate pERK or extracellular signal-regulated kinase (ERK) expression, while NDRG1 significantly (p<0.05) decreased pERK (Fig. 4C). This indicates that NDRG1 has an inhibitory effect on the downstream targets of the Ras pathway. Furthermore, Dp44mT and DFO that markedly increase NDRG1 expression (Fig. 1A) also significantly (p<0.01) reduced pSMAD2L levels in MIAPaCa-2, PANC-1, and CFPAC-1 cells (Supplementary Fig. S5). In addition, examining PANC-1 tumor xenografts from mice that were treated with Dp44mT (0.4 mg/kg) or the novel iron chelator, di-2-pyridylketone 4-cyclohexyl-4-methyl-3-thiosemicarbazone hydrochloride (DpC; 5 mg/kg), for 29 days, we demonstrate that these agents markedly inhibit tumor growth and significantly (p<0.05) reduce both pERK and pSMAD2L expression in vivo (Supplementary Fig. S6).
We further examined whether the ability of NDRG1 to decrease pERK and pSMAD2L in MIAPaCa-2 cells was dependent on its effects on SMAD4. This was achieved by transfecting vector control and NDRG1-overexpressing cells with SMAD4 siRNA or a scrambled control siRNA and examining pERK and pSMAD2L. In the vector control cells, knocking down SMAD4 resulted in a significant increase of pERK and pSMAD2L, suggesting that SMAD4 negatively regulates the Ras pathway (Fig. 5A), as previously demonstrated (30). However, in cells overexpressing NDRG1 and in the presence of SMAD4, both pERK and pSMAD2L were significantly (p<0.05) lower when compared with vector control cells. On the other hand, cells overexpressing NDRG1 in the absence of SMAD4 still displayed increased pERK and pSMAD2L when compared with vector control cells, although this response was significantly (p<0.05) dampened by NDRG1 (Fig. 5A). Hence, NDRG1 negatively regulates the Ras pathway, and these effects are partially dependent on SMAD4 expression.

Interestingly, examining both nuclear and cytoplasmic fractions of MIAPaCa-2 cells, we also demonstrated that NDRG1 significantly (p<0.05) increased SMAD4 levels in the nucleus, while markedly reducing nuclear pERK expression (Fig. 5B). This is important to note, considering that the nuclear localization of both SMAD4 and pERK is crucial to their antitumor and oncogenic activity, respectively.
NDRG1 inhibits expression of crucial PI3K subunits, p-p85α and p-p55γ
Another oncogenic pathway that contributes to PCa progression is the PI3K pathway (10). Class IA PI3Ks are composed of regulatory subunits (p85α, p85β, and p55γ) and a p110 catalytic subunit (with three isoforms; α, β, and δ) (5, 25) and can be activated by TGF-β1 (9, 25) to promote proliferation (25). Considering the increased PTEN in response to NDRG1, we examined whether this latter protein modulates the PI3K pathway. This was crucial to be investigated, as PTEN inhibits PI3K signaling (25).
The expression of PI3K regulatory subunits including phospho-p85α (p-p85α) and phospho-p55γ (p-p55γ) was significantly (p<0.01) reduced by NDRG1 compared with the vector control, while the expression of PI3K p-p85β was low and difficult to quantitate (Fig. 5C). Interestingly, while PI3K p110α was not markedly affected by NDRG1, PI3K p110β was significantly (p<0.01) increased in response to NDRG1 in MIAPaCa-2 cells (Fig. 5C). Considering these latter data, it is notable that the phosphorylation of PI3K regulatory subunits (p85α/p85β/p55γ) is crucial for pathway activation, as they serve to recruit catalytic subunits (p110α/β/δ) to assemble the PI3K complex (5). When de-phosphorylated, the regulatory PI3K subunits cannot form a complex with p110α/β/δ, inhibiting PI3K signaling (5, 20, 25). Hence, the increased p110β levels could be a compensatory response to the decrease of p-p85α and p-p55γ.
Taken together, these results indicate that NDRG1, potentially through its ability to increase PTEN expression, is able to inhibit the PI3K pathway in MIAPaCa-2 cells by reducing expression of the PI3K subunits, p-p85α and p-p55γ.
NDRG1 downregulates pAKT and pmTOR
To further examine the downstream effects of increased PTEN in MIAPaCa-2 cells, we examined a key molecular target of PTEN, namely phosphorylated AKT (pAKT), which is reduced by this tumor suppressor (25, 35). We found that high NDRG1 levels in MIAPaCa-2 cells led to significantly (p<0.05) lower pAKT, while basal AKT remained unchanged (Fig. 5D). Hence, NDRG1 is able to reduce pAKT, and this may be due to increased PTEN in response to NDRG1 (Fig. 3B–D). Further investigations demonstrated that phosphorylated mTOR (pmTOR), a downstream target of pAKT that functions in promoting proliferation (43), was also significantly (p<0.01) reduced in MIAPaCa-2 cells with high NDRG1 (Fig. 5D). Hence, the NDRG1-induced increase in PTEN has downstream effects on pAKT and pmTOR, and could be a mediator of the antitumor activity of NDRG1 in MIAPaCa-2 cells.
Discussion
NDRG1 has been identified as an important molecular target that can be upregulated by novel anticancer agents which induce cellular iron-deprivation, such as Dp44mT and DpC (27, 33, 47). Here, we identify novel NDRG1 targets, including NEDD4L and GLIS3. NEDD4L is of particular interest, as it negatively regulates the TGF-β pathway by promoting the turnover of TGFβRI and pSMAD2/3 (6, 15, 23, 24). Considering the role of the TGF-β pathway in cancer progression, we examined whether NDRG1 modulates this pathway. Neither TGF-β1 nor NDRG1 activated the SMAD-dependent signaling cascade in MIAPaCa-2 cells. However, the tumor suppressor, SMAD4 (18, 19, 48), was significantly upregulated by NDRG1 in the nucleus of MIAPaCa-2 cells, independently of TGF-β1. In addition, NDRG1 also upregulated SMAD4 in another PCa cell line, namely PANC-1, demonstrating its antitumor effects.
SMAD4 plays a role in the TGF-β pathway and is crucial for its normal antitumor function (37). In fact, when complexed with pSMAD2 or pSMAD3, SMAD4 translocates to the nucleus where it can combine with other transcriptional partners to activate or repress different genes (14). For instance, SMAD4 in combination with pSMAD3 and FoxO1 can induce the transcription of the cyclin dependent kinase inhibitor, p21, a well-known downstream target of the TGF-β pathway (14). Interestingly, we have previously demonstrated that NDRG1 also promotes p21 transcription in cancer cells (29), which is consistent with its positive effect on SMAD4 expression.
Furthermore, SMAD4 inhibits the oncogenic Ras pathway, which is active in >90% of PCa cases (11, 34). This was further demonstrated using MIAPaCa-2 cells, where knocking down SMAD4 resulted in a marked increase in pERK and pSMAD2L, which are downstream targets of the Ras pathway. Considering the ability of NDRG1 to increase SMAD4, we further demonstrated that this metastasis suppressor also inhibited Ras signaling in MIAPaCa-2 cells. This was mediated by a decrease in pSMAD2L and pERK. In fact, pSMAD2L is phosphorylated at S245/250/255 by pERK, leading to its inability to partake in the normal TGF-β signaling pathway (30). Interestingly, when SMAD4 was knocked down in MIAPaCa-2 cells, NDRG1 was able to dampen the increase in pERK and pSMAD2L. This suggests that NDRG1 inhibits the downstream Ras pathway, and this effect is partially dependent on its ability to upregulate SMAD4.
Considering the ability of NDRG1 to reduce both pERK and pSMAD2L levels, we also demonstrated that novel iron chelators that markedly upregulate NDRG1 in PCa (Fig. 1A) (27) can also significantly reduce pSMAD2L expression in each PCa cell type examined (Supplementary Fig. S5). In addition, examining PANC-1 tumor xenografts, we further show that both Dp44mT and DpC markedly reduce both pERK and pSMAD2L expression in vivo (Supplementary Fig. S6B). This is consistent with their ability to upregulate NDRG1 (Fig. 1A) (27) and inhibit PCa tumor growth (Supplementary Fig. S6A) (27).
Another consequence of NDRG1 overexpression in PCa cells was the significant increase in the tumor suppressor PTEN. PTEN expression is often lost in PCa, leading to increased progression (25). A number of factors contribute to PTEN suppression in PCa, including the activation of Ras and PI3K pathways, which could occur through SMAD-independent TGF-β signaling (8, 10, 11, 49). Hence, increased SMAD4, which inhibits SMAD-independent TGF-β signaling and the Ras pathway, may contribute to increased PTEN in response to NDRG1. Moreover, while MIAPaCa-2 and PANC-1 cells have no mutations in SMAD4, CFPAC-1 cells have a homozygous deletion of this latter protein (17), which could have an impact on how these cells respond to TGF-β and NDRG1. This indicates that the effect of NDRG1 on PTEN expression in the CFPAC-1 cells is independent of SMAD4.
Importantly, PTEN inhibits the PI3K pathway, leading to reduced PI3K p-p85, pAKT and inhibition of tumor progression (20). In fact, a negative feedback-loop exists between PTEN and the PI3K pathway (5, 9, 20, 25). Moreover, TGF-β1 can also activate the PI3K pathway through the receptor tyrosine kinase (RTK) receptor, leading to PTEN suppression (Fig. 6) (9). The balance in the PI3K/PTEN feedback-loop is often lost in cancer, resulting in increased PI3K signaling and reduced PTEN levels (5, 20, 25). The upregulation of PTEN in response to NDRG1 could be important in re-balancing this feedback-loop and results in the inhibition of PI3K signaling. Indeed, increased NDRG1 in MIAPaCa-2 cells was correlated with markedly decreased PI3K p-p85α, PI3K p-p55γ, pAKT, and pmTOR, all of which are downstream of the PI3K pathway. Thus, NDRG1 plays a role in regulating the negative feedback-loop between the PI3K pathway and PTEN (Fig. 6). Interestingly, we did not observe any difference in PTEN expression in NDRG1-expressing PANC-1 cells. This may be influenced by the fact that PANC-1 cells have mutated pAKT (7) and may respond differently to NDRG1.

NDRG1 also inhibits the NF-κB pathway in MIAPaCa-2 PCa cells (22). Moreover, the NF-κB pathway was found to be activated by TGF-β in PCa cells, contributing to reduced PTEN expression and its oncogenic effects (8). Hence, these previous studies support our observations that NDRG1 is a negative regulator of oncogenic signaling pathways in PCa. Indeed, the TGF-β, PI3K, Ras, and NF-κB pathways may be interlinked, with NDRG1 being a mediator that regulates their downstream effects.
Collectively, this study demonstrates that NDRG1 is able to inhibit the Ras and PI3K pathways, while upregulating NEDD4L, SMAD4, and PTEN expression. These effects of NDRG1 highlight its antitumor function in PCa, rendering it a promising therapeutic target for novel iron chelators (33, 47).
Materials and Methods
Cell lines
Human pancreatic MIAPaCa-2 cells transfected with a pIRESneo2-NDRG1 vector and vector control cells were obtained from Dr. Michihiko Kuwano (Research Centre for Innovative Cancer Therapy) (36). Human pancreatic PANC-1 and CFPAC-1 cells were purchased from the American Type Culture Collection. The cell types were authenticated based on viability, recovery, growth, morphology, cytogenetic analysis, antigen expression, DNA profile, and isoenzymology by the provider. The cells were maintained in a DMEM medium with 10% fetal calf serum (Invitrogen) and cultured by standard procedures (33) for <3 months after resuscitation.
Human pancreatic MIAPaCa-2 cells are an established epithelial cell line from 65 year-old Caucasian male pancreas carcinoma; human pancreatic PANC-1 are an established epithelial cell line from 56 year-old Caucasian male pancreas epithelioid carcinoma; and CFPAC-1 are an established epithelial cell line from 26 year-old Caucasian male liver metastasis.
Treatments
MIAPaCa-2, PANC-1, and CFPAC-1 cells were incubated with DFO (250 μM; Novartis, Switzerland) or Dp44mT (10 μM) for 24 h/37°C (47).
In other studies, MIAPaCa-2 and PANC-1 cells were serum starved in media containing 1% FCS for 24 h/37°C, then treated with TGF-β1 (10 ng/ml; R&D Systems) or TGF-β1 combined with anti-TGF-β1 antibody (αTGF-β1; 10 μg/ml; R&D Systems) for a further 36 h, and protein and mRNA extracted (33), with fractionation being done using the NE-PER Nuclear and Cytoplasmic Extraction Kit (Pierce).
Whole genome gene-array
MIAPaCa-2 cells transfected with human NDRG1 and vector control cells were used for whole genome gene array using Affymetrix Human Genome U133 Plus 2.0 array (Millenium Sciences; Victoria, Australia). RNA was isolated, and microarray analysis was carried out by the Australian Genome Research Facility. The gene-array data are available via the Gene Expression Omnibus (accession No. GSE25086).
Microarray data analysis
Data processing
Low-level analysis (image to raw expression values) was performed with Affymetrix GeneChip®Operating Software 1.3.0. Absolute expression signals as well as the mean probe level fold changes (expressed as SigLogRatio, i.e., log transformation of fold change using base 2, presence/absence and change calls) were calculated. All chips were scaled to a target intensity of 1000.
Gene expression analysis
A two-phase strategy was used to identify differentially expressed genes. First, genome-wide screening was performed using the gene chip just described. The empirical Bayes procedure (41) was then applied to detect genes that were most likely to be differentially expressed between the NDRG1 overexpressing and control clones. Individual p-values were then adjusted using the Holm step-down procedure to reduce false positives (21). Further analysis produced a list of statistically significant (p<0.05) genes with a log2-fold-change of >1. The top 30 differentially regulated genes with a log2 value of >1.75 or <−1.75 were further examined. Definitive evidence of differential expression was obtained from the RT-PCR of the samples used for microarray analysis and three other mRNA samples.
Annotation
Functional annotation of genes was assigned through Gene Ontology (
Western blot and mRNA analysis
Western analysis was performed (33) using antibodies outlined in Supplementary Data. mRNA was isolated using TRIzol® (Invitrogen) (33). RT-PCR was performed (33) using the primers in Supplementary Table S1. RT-PCR was shown to be semi-quantitative by an optimization protocol demonstrating that it was in the log phase of amplification. β-actin was used as a loading control.
The primary antibodies used were against human NDRG1 (Cat. No. ab37897; goat; 1:2000 dilution; Abcam, Inc.), FABP5 (Cat. No. H00002171-B02; mouse; 1:1000 dilution; Abnova Corporation), SAMSN1 (Cat. No. NB300-976; goat; 1:600 dilution; Novus Biologicals), GLIS3 (Cat. No. ab51268; rabbit; 1:800 dilution; Abcam), and NEDD4L (Cat. No. ab46521; rabbit; 1:1000 dilution; Abcam). To examine the TGF-β1 signaling pathway proteins, rabbit antibodies against human TGFβRI (Cat. No. 3712), TGFβRII (Cat. No. 3713), SMAD2 (Cat. No. 3122), pSMAD2 (S465/467; Cat. No. 3101), pSMAD2 (S245/250/255; Cat. No. 3104), pSMAD3 (S423/425; Cat. No. 9520), SMAD4 (Cat. No. 9515), and PTEN (Cat. No. 9552) were used (1:1000 dilution; Cell Signaling). To examine the PI3K pathway, rabbit antibodies against human pAKT (Cat. No. sc-7985-R), AKT (Cat. No. sc-8312; 1:400 dilution; Santa Cruz), pmTOR (Cat. No. 2971S), pPI3K p85 (Cat. No. 4228), PI3K p110α (Cat. No. 4249), and PI3K p110β (Cat. No. 3011; 1:1000 dilution; Cell Signaling) were utilized. The secondary antibodies implemented were anti-goat, anti-rabbit, and anti-mouse (Sigma-Aldrich Co.), each at a dilution of 1:10,000. All antibody dilutions were performed according to the manufacturer's instructions.
Expression plasmids and transfection
PANC-1 cells were stably transfected with pCMV-tag2-FLAG-NDRG1 (GenHunter) or pCMV-tag2-FLAG (Stratagene) using Lipofectamine 2000 (Invitrogen) following the manufacturer's protocol. Two colonies of PANC-1 NDRG1 overexpressing cells (#1 and #2) were obtained using G418 selection (1.2 mg/ml; Sigma-Aldrich Co.). The pCMV-tag2-FLAG-NDRG1 plasmid was checked by sequencing before transfection (Automated DNA Analysis Facility), and NDRG1 protein expression was verified by western blot.
shRNA and siRNA
Four constructs of shRNA specific for NDRG1 (shNDRG1 1–4) were combined into two mixtures (shNDRG1 1/2 and shNDRG1 3/4) and compared with scrambled control shRNA (shControl; SABiosciences). siRNA against SMAD4 as well as the scrambled control siRNA were purchased from SABiosciences. The shRNA and siRNA were transiently transfected into CFPAC-1 and MIAPaCa-2 cells, respectively, using Lipofectamine 2000 (Invitrogen) and incubated for 72 h/37°C. Western blotting was then performed (33).
Tumor xenografts in nude mice
In vivo experiments were approved by the Animal Ethics Committee (University of Sydney). In these studies, 8-week-old female nude mice (n=8; BALBc nu/nu) were used, and tumor xenografts were established by standard techniques (47). Briefly, each mouse was subcutaneously injected with 2×10⁶ PANC-1 cells suspended in Matrigel (BD Biosciences). Once the tumors reached an average of 90 mm3, the treatment (Dp44mT [0.4 mg/kg] or DpC [5 mg/kg]) began. Dp44mT or DpC was dissolved in 30% propylene glycol in 0.9% saline and intravenously injected (via the tail vein) 5 days/week (Monday-Friday) for 4–6 weeks (47). The vehicle control group also received an intravenous injection of 30% propylene glycol in 0.9% saline at the same time as the Dp44mT- or DpC-treated groups (5 days/week; via the tail vein). Once the control tumors reached 1000 mm3, the animals were euthanized due to ethical requirements.
Densitometry
Densitometry was performed using Quantity One software (Bio-Rad) and normalized using the relative β-actin loading control for protein and mRNA.
Statistics
Data are mean±standard deviation (number of experiments) and were compared using the Student's t-test. Results were considered significant when p<0.05.
Footnotes
Author Disclosure Statement
No competing financial interests exist.
Abbreviations Used
References
Supplementary Material
Please find the following supplemental material available below.
For Open Access articles published under a Creative Commons License, all supplemental material carries the same license as the article it is associated with.
For non-Open Access articles published, all supplemental material carries a non-exclusive license, and permission requests for re-use of supplemental material or any part of supplemental material shall be sent directly to the copyright owner as specified in the copyright notice associated with the article.